Embed Size (px)
Citation preview

AN INFRARED STUDY OF THE CARBON-NITROGEN DOUBLE BOND ABSORPTIONFREQUENCY IN SOME ALKYL AND ALKYL-
ARYL SUBSTITUTED SCHIFFS BASES
By
WILLIAM LEROY STEELE
A DISSERTATION PRESENTED TO THE GRADUATE COUNCIL OF
THE UNIVERSITY OF FLORIDA
IN PARTIAL FULFILLMENT OF THE REQUIREMENTS FOR THE
DEGREE OF DOCTOR OF PHILOSOPHY
UNIVERSITY OF FLORIDA
August, 1963

ACKNOWLEDGMENTS
The author wishes to express his appreciation to
the members of his supervisory committee and to thank
especially Dr. Armin H. Gropp , chairman, whose advice,
suggestions, and inspiration were of immeasurable value
throughout this work.
The author wishes also to express his gratitude
to Dr. R, Carl Stoufer whose contribution of valuable
research equipment at a crucial time allowed the work
to proceed unhindered.
The author further expresses his thanks to the
members of the staff of the Department of Chemistry,
both academic and non—academic , and to his co—workers
for their advice, counsel, and interest.
ii

TABLE OF CONTENTS
Page
ACKNOWLEDGMENTS . . . ii
LIST OF TABLES. iv
LIST OF FIGURES .
Chapter
I. INTRODUCTION 1
II. EXPERIMENTAL 4
Apparatus and Techniques 4
Synthesis of Compounds •••••. 8
III. RESULTS AND DISCUSSION 21
IV. SUMMARY 52
BIBLIOGRAPHY 54
BIOGRAPHICAL SKETCH 56
iii
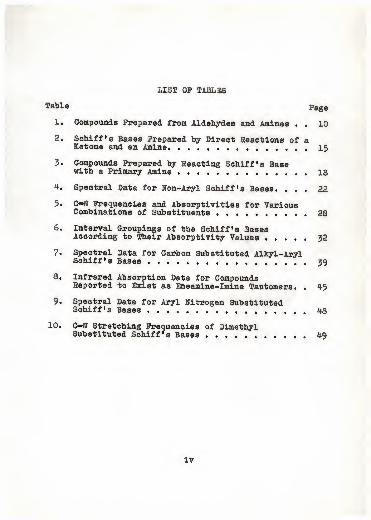
LIST OP TABLES
Tabl e Page
1. Compounds Prepared from Aldehydes and Amines . . 10
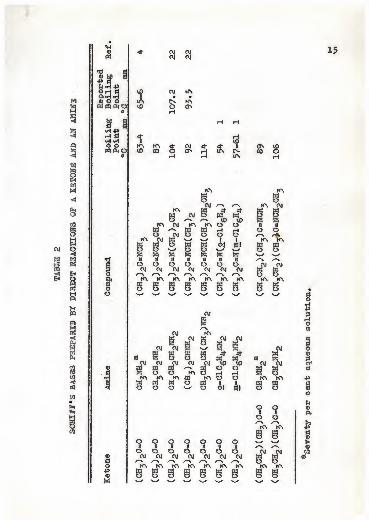
2. Schiff's Bases Prepared by Direct Reactions of aKetone and an Amine. ........ 15
3« Compounds Prepared by Reacting Schiff's Basewith a Primary Amine
A. Spectral Data for Non-Aryl Schiff's Bases. ... 22
5. C*N Frequencies and Absorptivities for VariousCombinations of Substituents ..... 28
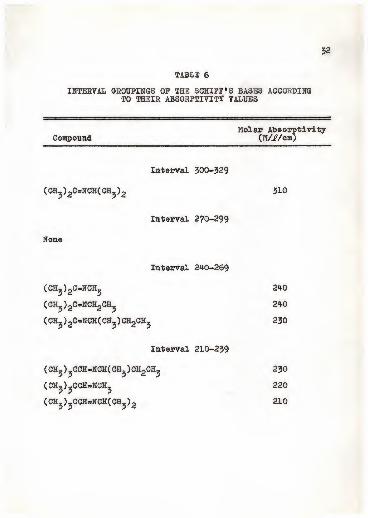
6. Interval Groupings of the Schiff's BasesAccording to Their Absorptivity Values 32
7. Spectral Data for Carbon Substituted Alkyl-ArylSchiff's Bases 59
8. Infrared Absorption Data for CompoundsReported to Exist as Eneamine-Imine Tautomers. . 45
9. Spectral Data for Aryl Nitrogen SubstitutedSchiff's Bases 48
10.
C—N Stretching Frequencies of DimethylSubstituted Schiff's Bases . . 49
iv

LIST OF FIGURES
Figure Page
1. Demountable Cell for Pure Liquids «•••••• 7
2. Reaction Vessel Modified for Addition ofAcetaldehyde. ••• ......... 13
3 . Frequency Polygon ..••»•••• . 35
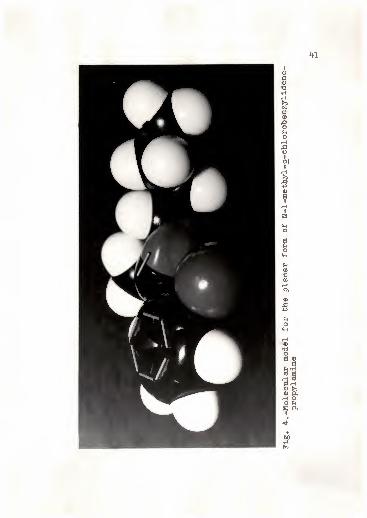
A. Molecular Model for the Planar Form of N-l-methyl-o-chlorobenzylidenepropylamine ..... 41
5. Molecular Model of N-l-methyl-o-chloro-benzylidenepropylamine Showing“HinderedRotation of Phenyl Group. •••..« 43
6. Molecular Model of N-isopropylideneaniline. . . 50
v

CHAPTER I
INTRODUCTION
Infrared studies of compounds containing carton
doubly bonded to carbon or to oxygen have established
reasonably well the frequency ranges of the C=C and C=0
absorptions and the frequency shifts to be expected with
2 19various substituents. * ? The C*N has not been studied
2as thoroughly. In the C»N absorption Bellamy quotes a
frequency range of 1690 to 16A0 cm”1 for open chain
compounds and 1660 to 1630 cm”1 for alpha-beta unsaturated
compounds. The assignments, however, are based primarily
on compounds containing groups such as hydroxyl or amino
which may influence the frequency.
Pabian, Legrand, and Poirier11 reviewed the C»N
frequencies of a variety of compounds reported in the
literature and on the basis of somewhat limited data
assigned frequency ranges for various classes of compounds
and types of substitution.
The simplest class of C«N compounds are those having
the structure
1

2
commonly called Schiff’s bases. The ones having R' and
R" as an alkyl or aryl group and R as hydrogen atom or
an alkyl group were chosen for study.
One notes from the preceding structure that these
compounds can be considered as substituted nitrogen
analogues of aldehydes and ketones. On this basis, one
might predict that the various substituents represented
by R and R' would influence the C»N stretching frequency
in much the same way as substituents in similar positions
influence the C«0 stretching frequency. However, the C»N
frequency should be subject to influences by the nitrogen
substituent.
In addition to studying the sensitivity of the
vibration toward various substituents, attention was paid
to the remote possibilities of cis-trans isomerism and
eneamine-imine tautomerism. Kahovec1^* 1? concluded from
Raman studies of some azomethines, Schiff’s bases in which
R represents hydrogen, that the compounds exist with R'
and R” in the trans positions. Hires and Balog1^
attempted to convert N-butylidenebutyl amine to a mixture
of the two forms by a five to six hour exposure to

3
ultraviolet radiation, "but no difference in the spectrum
of the compound could be detected after irradiation. No
indication of the presence of the two isomers appeared in
any spectrum of the compounds studied in this investigation.
Bergmann, Zimkin, and Pinchas,^ in their study of
factors favoring oxazolidene formation over Schiff’s base
formation when aldehydes or ketones are reacted with
ethanolamine, postulated an eneamine-imine tautomerism to
explain an apparently anomalous absorption and studied
additional compounds to support this conclusion. As will
be discussed more fully in Chapter III, the results of
this investigation indicate that infrared absorptions in
themselves are not a reliable indication of such a
tautomerism.
This study was undertaken in an attempt to assign
frequency ranges for the C»N fundamental frequency in
several classes of Schiff's bases and to correlate frequency
changes with structural changes arising from the groups
substituted on the carbon atom or on the nitrogen atom.
During the course of this investigation an extensive
study of the C=N frequency in azomethines was published
21by Suydam. This work confirms his results within
experimental error in all cases in which similar compounds
were studied.

CHAPTER II
EXPERIMENTAL
Apparatus and Techniques
A Perkin-Elmer Model 21 double-beam. Infrared
spectrophotometer, linear in wavelength and per cent
transmittance was used for this investigation. The
instrument was equipped with a calcium fluoride prism
and was calibrated according to the manufacturers
instructions from 2.5 to 9.5 microns (4000 to 1050 cm-1
)
using ammonia, methane and atmospheric water vapor. The
tolerances for wavelength accuracy are + 0.005 micron
from 2,5 to 8.5 microns and + 0.005 to + 0.01 micron
from 8,5 to 9.5 microns. The instrument was calibrated
to within these tolerances. The corresponding accuracy
in wavenumbers is + 1 cm”1 in the region of primary
concern, 1725 to 1640 cm”1
.
The slit program of 975 recommended by the
manufacturer was used for all studies as well as for
instrument calibration. This program gave a slit
variation from 91 to 96 microns in the region 1725 to
1640 cm”'Land appeared to be the best compromise for low
4

5
noise, good response and adequate resolution. The
amplifier gain and instrument zero were adjusted according
to the manufacturers instructions.
A Perkin-Elmer Model 157 Infracord was used to
record the qualitative spectra of all compounds investigated.
All numerical data, however, were obtained by using the
Model 21.
The spectra of the compounds as pure liquids were
recorded from 2.5 to 9*5 microns using a 0.025 Dam fixed
cell. One compound, N-ethylidenemethylamine, boiled at
room temperature, 25° C. Its spectrum was obtained in the
gas phase using a 10 cm cell. The wavelengths of the
C«N overtone were taken from these spectra.
The C»N absorption was measured in each case for
the pure compound and for a CCl^ solution. The band was
recorded using a scale of 5 inches per micron at a speed
of approximately 0.0004 microns per second. The wave-
length of the peak was recorded from the instrument's
counter reading. At least three measurements agreeing
within 0.001 micron were taken for each compound.
The CCl^ solutions were prepared in a 10 ml
volumetric flask by weighing sample sufficient to give an
absorption between 50 and 70 per cent transmission and
diluting to volume. The more volatile samples were weighed

6
in a flask containing a small amount of CCl^ to reduce
loss by evaporation. The wavelength measurements were
made using a 0.212 mm cell calibrated by the interference
fringe method and the molar absorptivities calculated
using Beer's law.
It was noted throughout the investigation that
many of the compounds reacted with CCl^ upon standing to
produce a white, crystalline product. To reduce errors
from this reaction the solutions were run within 30
minutes of preparation. The nature of the product is not
known at this time although a reaction between triethyl-
amine and CCl^ producing an amine hydrochloride has been
noted by Collins.
The pure liquids, except N-ethylidenemethylamine
measured in the gas phase, and N-methylene-tert-butylamine
whose absorption was unusually weak, absorbed too strongly
for accurate wavelength measurement using the smallest
available fixed cell, 0.01 mm, and were too volatile to
run directly between two sodium chloride plates. To
overcome these difficulties, a simple demountable cell
was assembled from the parts shown in Figure 1. The
inside diameter of the teflon ring was made with a 1-degree
taper to permit easy insertion and removal of the sodium
chloride plates while still forming a tight seal.

7
Fig.
1.
-Demount
able
cell
for
pure
liquids

8
Synthesis of Compounds
The compounds needed for this investigation were
not available commercially and were, therefore, prepared
by the following methods. All starting materials, unless
otherwise indicated, were used as available from stock
without further purification. Methyl amine solution was
prepared by dissolving the gas in water cooled externally
by an ice bath.
The Schiff's bases produced by the reaction of an
aldehyde and an amine, illustrated by the equation
RCHO + R*HH2
RCH=ffR' + HgO
were prepared as follows, according to the procedures of
Campbell, Sommers and Campbell. x
Four-tenths mole of the amine was placed in a
250 ml, round-bottom, three-neck flask equipped with a
reflux condenser, stirrer and addition funnel. The flask
was surrounded by an ice bath, and 0.4 mole of aldehyde was
added dropwise with stirring over a period of one to two
hours. The reaction mixture was stirred for an additional
15 to 30 minutes after addition was completed. Solid KOH
pellets were added and the mixture allowed to stand
quietly until the removal of water seemed complete. The
organic layer was separated, placed over a mixture of BaO

9
and crushed KOH, and refrigerated overnight. The material
was decanted and purified by distillation from a small
amount of BaO through a spinning band column.
Table 1 lists the compounds prepared by this
method together with their boiling points experimentally
measured during the course of this work as well as
boiling points listed in the literature. All boiling
points are uncorrected and at atmospheric pressure,
unless otherwise indicated, in this and subsequent tables.
Figure 2 shows the apparatus used for the reactions
as modified for the use of acetaldehyde. Circulation of
ice water through the cold finger inserted into the
addition funnel maintained acetaldehyde below its boiling
point and permitted its addition without modification of
the procedure.
It was found that the drying mixture of KOH and BaO
was not completely effective in removing water from the
compounds prepared from propionaldehyde, and the branched
amines. For these compounds, it was necessary to dry over
and distill from Ca^.
Ketones and amines undergo essentially the same
reaction illustrated previously except that addition of
* PPan acid is necessary to catalyze the reaction. The
22following procedure, modified slightly from that of Norton

COMPOUNDS
PREPARED
FROM
ALDEHYDES
AND
AMINES
10
© ©«H o© t*« ©
dss?dH POH dP<H H© O OCSPSUiO
Q
a1
HPh dH HO OW(1»0
0
§0
1o
d
©«d
&©•d
3
CA ia ia fA iaCVJ CM (VI CM
Q d d O d^ N N VD if\
C^- (N IN JN £S
ON
ITS COv£> <M
lA ON
CO i 1
d Cn. R
IA
IA IA tACM CM CM
R S 8A A IN
IPs tA• •
CM (AlA Cn
lA lA lA
IA tA IN d H H CnCO CM d IN vO CO CO
tA
gCM
CM 813 '>
fA CM K\s-> IAkn m ^n m iaw
/-N 6 CM o us oIA fA CM US n-» O wB 8 gSg^gn> 523 Jss Sz? S5 U5 $25
0 B B H B U H
1 g g g g g gO IA (A K\ IA IA IA
uT>8 8 8 8 8 8
CM IA CnlA Cn ON
fA
fA CM
zni525 fe!
D It N
g g gCM CM CM
g g gfA IA fA
g g g
CM
CM IA
CM ID i Cvj 88 a'
1^ £ I WO £ CM O <3 OIA CM CMU3 CM fA CM
''-n W US O /-n jxj
tAg O v-/ fA fAOfA fA fAUJ US IA
US US US O OO O O N^ N^
o o o o o o0888888US fA fA tA fA fA tAO US US US US USus o o o o o
©CMK
© 5 CMCM CM US
g g §IA fA fA
g g g
OOOg g gCM CM CM
g g gfA IA IA
US US USOOO
©
Seventy
per
cent
aqueous
solution

Table
1
(Continued)
11
A© ©«M O 4- KN KN KN KN ON KN© d CM CM CM CM CM OJ« ©
i CO CM CN O <2 KN OJ•d IN lO VO IN VO oo IN
SfIN IN IN IN Cn- IN
H -HO rH « IN to to KN tOft-H-H 1 • • 1 I
© O O VO ON g UN Q r—
1
«r«P0ft o 00 vO H O to CM
0 rH H rH
a»s & KN
sJ-
•H -Pr-l Cl UN 4-
•H *H • •
O O to O O ON co KN 00 H KN«ft O 00 O H tO 55 H ON 4*
0 H rl rH
tJ
Io
fo
0)
rt
<D
IO*CJ
KN
KN g
JPOJ OKN^*n KNW kn« KNO w o wvx O O8v W t5
P O "
a Ss {a;
8 8 8 8(\J <M CM CVI
8 8 8 ^NN K\ KN
8 8 8
OJ
OJWO
KV>KN CU KN/-v KN
g ^g w^g «
KN
8 w
WBpfe fe5
n n
8 88 8
o w w w VOo o o p$25 $25 feH It R
8 8 88 8 8
&H
88
OJ CM OJ OJ CM CMr\ /*% /-n ^KN KN KN KN KN KN
g g g g g g
CM
CM
OJ
CMKN
OJ
OJ O O O OJW OJ KN OJ WO ^ W g
KN KNO lf\
KNW W KNWg S S g o'
0
o o o o o« w w « wo o o o o« n w « ao o o o oCM OJ CM CM OJ
/"-\ ^ ^KN KN KN KN KN
8 8 8 8 8
ao•HP3HOCO
CO
3o0)
5
©o
u©ft
rt
I©coa

Table
1
(
Continued)
12
l© ©<H O© Clw ©
tl
2 %f-t *H POH dPi*H H© O O«PQP<0
o
I!
o oPQPMO
e
©0
&©•©
3
cm
LfN
HCM
CM
H OMAffl O' lf\
CM
fO\ fC\
8 8K\ CM CM
8 gfe; «R fl
SSuO O RK\ rov 1x3Ok> k> u"\
g g gflV-/ o
CM
©CM CMw ^
rt
(M CM
l §8KN K\ K\
b g b
o o8 8o o oKN KNJUrv O
K\ K\ ITS
g g goW O
g•rl
Pcs
HO©
©3O©
©
pcl©o
u©o.
t©>%©

13
Fig. 2. -Reaction vessel modified for addition ofacetaldehyde

14
and his co-workers in the procedure of dehydration, was
used to prepare the compounds listed in Table 2.
The ketone and amine, each in 0.4 molar amounts,
were placed in a 500 ml glass-stoppered, Erlenmeyer flask
and 1 ml of concentrated HC1 was added dropwise. When
necessary the flask was cooled under running water to
prevent loss of reactants. The flask was loosely
stoppered until cooled to room temperature and then
tightly stoppered and allowed to stand at least 24 hours.
KOH pellets were added and the mixture stirred magnetically
until the KOH no longer seemed to dissolve. The organic
layer was separated; fresh KOH was added; and the mixture
was stirred as before. This process was repeated until
water removal was complete. The product was then purified
by distillation through a spinning band column.
The compounds prepared by Haury’s method1 ^ of
reacting a Schiff's base with an amine boiling higher than
the one originally used in preparation are listed in Table
3 .
%+ R^HHg
%+ R,NH
2
SCHIST'S
BASES
PREPARED
BY
DIRECT
REACTIONS
OP
A
KETONE
AND
AN
AMINE
© 4- OJ OJOJ Ol
n &
£» 1
sh*h -pOH Cl VO OJ UN0»H-H X • •© O O ts KNWfflPiO vO o CO
0
g I
»—
1
r) pH
•H -P^
*h d 4 rH•ri *H 1 vDO O KN NN 4- Ol 4* 4^ 1
VO CO o <JV iH UN IN0 pH rH UN
p0
1oo
NN
g
OJ
OJ KN
as
OJ CM
I 8OJ OJ
g gK\ KN KN B
f 8 OJ OJ
B »o o Bo
b 4" 4-
O B BOJ OJ vO vO
PN B o OKN O pH rHB KN o OO
VPBo A. si
CO vOCO O
kn
Ol p\ P—
V
KNKN B 4- 4 Bw OJ o B„ B oO PV P-v vO VD 65
KN OJ KN KN O O 8B PN B b pH pH Oo Ol o O O O pv
KN OJ B VP v_p 1 1 KNB 1 o B B Ol si Bo o o o VP VP O65 K 65 65 65 65 65 v^a it a a I a a PVo o o o O o o OJOJ Ol CM OJ OJ OJ OJ Bp\ p\ <P\ P\ PV p> OKN KN KN KN KN KN KN KNn B w B B B Bo o O o O O O OVP w VP w vp vp VP
65IO^KN
a
OJ
OJ
KN KNB *
O
o«o
oao
p—
\
O o o o O O o gVP
8 1 a a 1 a a P-vO o o o o o o Ol© OJ Ol OJ OJ OJ CM CM B1 p> PV p-v P~V p-v P-v P-v OO KN KN KN KN KN KN KN KNP B B B B B B B B© O O O O o O o oM VP VP v_p VP VP VP VP VP
15
a]
Seventy
per
cent
aqueous
solution

t
*4<D
w
•d
ssfc*H-POHflft«H «H© O OWttftO
o
2 I•H-Prl fl•H *rl
o om Ph o
o
§
«g43©M
OJ CM CVI
CM <M CM
CM UN lf\• • •
CTn KN 4"CM H KVrl rl H
RITS
CM KVLTV iH
KV
aCM
O'
R
1CMITS
KV (N KV KV4 IO 4 4CM ITS• •
O- VO KV CVKV sf VO VD
KVw CM 8
rev
Wo y\ oCM rev rev CM
W W KV WCM«
Bvy
o 8 oyv
O w w KV CM rev
vy p p 8 Ofe ten no o o
S3ii
KV KV KV
CMKV (\l W V8 8 3 8S3 S3 65 S3
« w a II a 8 8o o o O o O Ov/ vy CM CM CM CMrv r~\ y\ /TV y> yv
| nT1 CM« af tf
CMw
CM
|o o O o O O O Oft rev rev rev rev rev rev rev
s W W w « wo o o o o o o oo vy vy vy vy vy vy v_y
CM
CM KV
« S 8CM CM
©CM CM
CMCM
rev W rev KV rev
tt O » « WO vy o O o
O O O8 U 8O o Oyv y> y-\
rev rev KV o ow w 8 1o o o O ovy vy vy CM CMyv yv yv yv />CM
BCM
B 8CM
B 8"KV rev KV rev rev
n M « W Wo O O o ovy vy vy vy vy
o o< Io o
CM
do•rl
43dHOm
©do©
&©
ri
©0
(4©P«
»43
g1CQ©
16

Table
2
(Continued')
«H©
*d
p afc-H POHtlCVrl *H® O OAm o
a i•H P33o omo.o|
o
Oo,
o
©rt
1p©M
3 CO
K\
fc 3
K\ K\
g gCM CM
yxCM CM CM
K\ yx yx yX
# S’ #CM fe
g A*; fta
o• Afe5 KN
oK\ KC
g g gKN yx
g <x-/ lOyx obT dd° ii
vy vyyx yx
ij*
tu SSvO kDo od dIt III
£ £ £ £CM CM C\J CM
r\ /-% rs
rf*g" £ £^ W
K\ rev KN fCN
g g g
0 o o1 # »o o oyx yx yx
O K\ fCV K\
{ 5 g g
gKS yx yx yx
4- shW S3 W_s»y CO CO CDyx O O O.CfN r) rl Hm p o Gco 7. i. iO Ol S| 0.1
17

COMPOUNDS
PREPARED
BY
REACTING
SCHIFF'S
BASE
WITH
A
PI
©«
•p
ss?1
fc-HO rMCM-H O© OO« «
KN
9•H-g
d .3o o o« CM o
©CS
1
C^OCM KNH
3! tITS lAKN H
O- IN CMsf O KN 00
KN
8CM
KN «a O CMo /^\ KNCM KN KN
a KNCM B o aK o
*2 b a a vy IfN
a o B O ap a $25 a a MOo a a a a OQ> a a a a a0 5 B B o ao o o o o oo KN KN KN KN CM
—> /’'v /*"N
KN KN KN KN KNa a a a aO o o o o
vy »-/ v-/
CM
CM
CM K\
@ 8 Bw
(\1 B ffi
^CVJ o o oW CM CM KNO tc /~sv-/ O (Oi IC\ tf\KN KN a a a8 8 2 °-*
CM
O
KN«CM KN KN CM
a a o© CM B B KN© KN a CM CM a©a ao o g g
Ba a a a a© a a a a B•
•H § 8 1 8© o o o oKN KN KN KN CM
rta /-n /'-'V /-n
§ KN KN KN KN KNU1 a a a a ao o o o o
V-y v-/ v-/ w
18

19
Equimolar amounts of Schiff*s base and amine were
refluxed in a spinning band column. Gaseous amine products
were trapped in dilute HC1 solution. When the amine
product was a liquid, it was distilled off at such a rate
that the distillation temperature varied no more than one
degree from the boiling point of the amine. The reaction
was complete when gas was no longer evolved or the boiling
point could no longer be maintained. The products were
then purified by distillation through the column.
Di-tert-butylketimine was synthesized according to
12the method generally outlined by Hansley. The following
equations illustrate the reactions:
2 (CH5)5CN + 2 Na -» [(CH^CjgC-NNa + NaCN
[(CH5)5C] 2
C«Ma + H20
[(CH^jC^C-N-H + Na+ + 0H~
Finely divided sodium was prepared in a 500 ml,
three-neck, round-bottom flask by rapid stirring of
25.5 g of the metal in 100 ml of boiling xylene and
allowing the mixture to cool. The xylene was decanted
and the sodium washed three times with anhydrous ether.
The sodium was placed under 525 ml of dry hexane and 67 g
of trimethylacetonitrile was added dropwise at room
temperature with stirring over a period of about two hours.
The reaction was completed by refluxing overnight. The

20
mixture was cooled to ice bath temperature, and an excess
of water was added very slowly with stirring until all
solid material had dissolved. The organic layer was
separated and dried over KOH in a refrigerator for a
period of 24 hours. Hexane was removed by distillation
at atmospheric pressure through a spinning band column,
and the product finally purified by distillation at
reduced pressure, bp ?1° at 34 mm; reported as 164-70°
12at atmospheric pressure.

CHAPTER III
RESULTS AND DISCUSSION
The Schiff's bases studied containing non-aryl
substituents on the carbon and nitrogen atoms are listed
in Table 4, together with the fundamental C»N frequency,
the overtone frequency, molar absorptivity, and the
known literature values. Interference by the water vapor
present in the atmosphere on the recorded spectra was
noted frequently during the investigation as a false
splitting of the fundamental C*»N peak. The interference
was reduced to a minimum by careful adjustment of the
instrument and by keeping the maximum intensity between
30 and 70 per cent transmission. This interference is
attributed to the high humidity conditions and the great
dispersion of the calcium fluoride prism. Because of
this interference, the values are considered accurate to
—1 -1+ 3 cm rather than the + 1 cm which should be possible
with the instrument. The overtone frequency is accurate
to + 10 cm-1
. Literature values quoted are for infrared
measurements unless otherwise indicated and are considered
to be accurate to no better than + 6 cm”1
corresponding
to the calibrated accuracy of + 0.02 microns generally
21

SPECTRAL
DATA
FOR
NON-ARYL
SCHIST'S
BASES
0
| A•>
KN0-VDHA A
#> •* »> •>
ivD•H
h5as CD VO 00 H VDU 00 H
HKNINvO
H HKN°k
CNCN VDVDVO VO
r
~vQ
8Hcfe!8S
tA> H H i-4 H H c-t H
£V
»!H O0.0
8\S3
0 ori 0H 0 *
00 CMO 0 t VA CM H CM <M UN Op s a INKs
KN KN CNJ rl rl H CVS CMO* O H KN KN KN KN KN KN KN KN
0 0
-H
KN KN KN KN KN KN KN KN KN KN
1
Ioo
oo vD
§ s s 8 8 s R R 8 Rrl <M f\l H r-1 rl
UN ON 00 00 «* CM IN IN UN CMO C'- N C"- IN VD vD CN INVD vD VD VD VD vD vD VD VD VDr-1 rH rH r-
1
H r-l «—
1
H rl H
0$ CIS
ITS lAas 00- CMN CNvDvD vDr-f H «H
s00IN tNVD VOrl r-l
H £N CS LPv KN
vDIN
vD VDH rl
CJnKN
r\KN NN
8 8S 8i—i aO *25
a kn
8 8
KN
8CM
KN
8« af^ 8
KVx O KN KN CM
B g B
woa
S25
KN
_ _ KN KN CMW W8 o B B B V Vw a v a &o o o o o C\J OJ
A A A A A § BKN KN KN KN KN KN KN
22
phase

23
©
fi
©© 9S3t-3 >
£3
9&Oro vS
K m '-4
® ort rtHo © ip sj
U c*© ©
6£ .
'O©3
P§
:©
«
C\J
ON
sH
VD pH O vO pHON pH CVJ rH rH OJ
§rHCS tOvOCN(SvO tStSvOVOvD vOvOcO
r—t (—I rH r)HH
8 8 s 8 8 8 8H eg CM rH H pH CM
O vO eg O Q CO KNeg o rH rH O CM CMKN KN KN KN KN KN KNKN KN KN KN KN KN KN
CM ON r) rH UN ai-
CN. CD vO VO VO <S lSVO vD © VO vO VO vDH H rH rH pH rH pH
ai- ON ts pH rH UN ai-
ts vO VO vO VO (S tSvO VD VD vO VO VO VDp-J H r) rH pH pH H
KN
CVJ
KNKN/'-n
B KN CM'
KN
8 i
s_/ V
o8
$25 .
CVJ t\|
O
§BOM
O
4CM *^NJ "CM
gggKN KN KN
8 8 8
oh aB BCM CM
§ 8KN KN KNBo
KN
KN
(\l H rl
& H KNH rH
KN KN KNKN KN KN
KN H IS
VO CD VDH rl rl
KN
8KN
8<
8NJ
j
N-^ UB N/O O
> CM
8 8A.
8B
| 8 88 8» *3.
CMKN
KNr"NW KN CVJO W -N
on
^ /-nCVJ CVJeg cm cm eg c
8 8 8 8 8w w wKN KN KNB WO O
©to
3 .
* S
c*j PiaT p

Table
4
(Continued)
0)
IpvS
S 3S7j»-4 >
J?
t-P
rt 6
32e-°
0)
8•PfH
§
&S'?
!©uO to
g
&8S3 ©D* k© p
8•HPPHOXli
O
fo
o
fo
O OLTN UNH H
& 8KN KNKN KN
H HcD COCD CD
§if\
|iH H
KN
CM CMw ^O KN
X gKN CM
g so o« Hte PaCM CM
CM CM
g gv/ wKN K\
g g
iHCDO HCM H CM CM«TCMIN CMvO INC- INcDcDcO CDrl rt rl i—
I
CM
8H
00INVD
£NCO
K\
woH
CM
res
8 8 3 3 ° S 8INH CM CM tA H
o IN IN H N Q> H CMCM rl rH H O rH CMKN kn KN KN KN KN K\ KNKN KN KN KN KN KN KN kn
ON
8 8: $ O'tA 8
4-IN
CO» CD CD CD CDH H1 H H H
%
HH rl rl
O' O' ID CD H rl UN
8 8 8 8 $ 8 &H rl rl rl H rl rl
rev
CMNN
KN KV\W W KN CMO O MOJw 6
td W trj m {3dG G o G G G
CM CM KN
g dXgX g g
KN KN CM #
g opp*1
Or\kn
B § gs o o o oCM CM CM CM CM CM CM
K\ KN K\ lf\ KN K\
g ggggggpfO' v-/ O' O' ov s_^ o' O
24
©CD
«S
.3to
fRaman

25
a
Iu ©© pS3
&5,
flHON£3 ESi
t>>© O0 ClrHO © I
f 5,s
o» o© ©
Sfi*•
cvj cvj O'IN ONOvO vO CNV0 VDvO
8 8H CVJ
4- C£>
& S
CVJ (\J Ho O C3 o o rHvO CN 5^ cvj CVJ CVJ
H rl H H H
00 4 CVJ O ON H KV KV CO CMHI H rH CM O H CVJ CM CM rHKV KV KV KV rev KN KV KV KV KV |
KV KV KV KV KV K\ KV KV KV KV
CVJ KV 4- M3 KVIN IN IN Cl3 irv
VO VO vO Vl3 vOH rl H H H
4&
Ov
S s «sVJ3 VO vO
tnINVO
4&
LTVCNVO
H rH rH rH rH rH rH rH H
Os~\ r-'. r\KV KV KV KV
g 8 g gW ^$Wtf*KN K\ K\ KNW W W £0o o o o
CM _/~v KVKV kv^vW W ic\
o o ffi
KV (\|w Ojxj Ixj K wO O O O CVJ
g gw »o oit n n
5 S3 SS5
o o0
S3oKV KN KN K\ KN
/> /~\ ^ ^K\ KN KV K\ K\
g 8 B B §
d p“Gas
phase
'Raman.

26
attainable by sodium chloride prisms. The accuracy of
the Raman data is unknown. Since molar absorptivities
depend upon the condition of the instrument at the time
the measurement is made and vary from instrument to
instrument, they were not determined more accurately
than + 10 per cent.
In general the determined frequencies are higher
than those reported previously for the same compounds.
16The Raman data reported by Kahovec and by Kirrmann and
18Laurent for several of the compounds studied in this
investigation are consistently lower by 5 cm-1
than the
data determined by the author. This difference is
attributed to the different methods of measurement. The
reported frequency value of 1666 cm-1
for N-ethylidene-
methylamine is believed to be in error since this value
is inconsistent with the C»N frequencies of structurally
similar compounds. The infrared data of Suydam'*1
generally—1 *
agree within the + 10 cm expected in this region when
comparing data obtained with sodium chloride and calcium
fluoride prisms.
T
This includes the + 6 cm error in wavelength
calibration and the + 3 cm“^ error in reproducibility for
sodium chloride, plus the + 1 cm-
'*' error in calciumfluoride calibration.

27
The frequencies resulting from different combinations
of alkyl substituents on the carbon and nitrogen atoms are
shown in Table 5. The values measured for pure liquids
appear above the diagonal, and those measured in solution
and the calculated absorptivlties appear below.
The azomethines, RCH»NR* , were found to have a
slightly greater frequency range, 1680 to 1665 cm1
, than
reported previously. * If the compounds containing an
isopropyl group are excluded, the general trends of the
C=N frequencies shown in Table 5 are (1) a slight drop of
about 4 cm”1 when R represents a tert-butyl group and R'
is unbranched, and (2) a drop of about the same magnitude
for a given R group when R’ is a substituent other than a
methyl group. An isopropyl group substituted on the
carbon atom follows the trend indicated for the other R
groups as R* is varied until combined with itself or with
a sec-butyl group. A drop in frequency occurs when either
of these two groups is substituted on the nitrogen atom,
and a rise in frequency occurs when a tert-butyl group
is the nitrogen substituent.
Further anomalous behavior occurs when the isopropyl
group is R* • Comparison of the values for the isopropyl
group when combined with a methyl or an ethyl group with
those obtained for a sec-butyl or tert-butyl group in the
same combination shows an unusually high and low value,

28
TABLE 5
C=N FREQUENCIES AND ABSORPTIVITIES FOR VARIOUSCOMBINATIONS OF SUBSTITUENTS

29
respectively. Even if one assumes that the value for the
isopropyl-methyl combination should be about 3 cm”1
lower,
the low value obtained when H is an ethyl group still
seems inconsistent. However, resynthesis of the compound
and remeasurement of the frequency confirms the value.
No explanation for the behavior of the isopropyl group
can be set forth at this time. The close agreement
between the solution and pure liquid frequencies seems to
indicate that the behavior is not due to an intermolecular
interaction.
The Schiff's bases of the structure absorb at a
R'
Nsc®n
//R"
R 1
lower frequency range, 1672 to 1660 cm”1
, than the azo-
methines. This is much higher than the range of 1662 to
164-9 cm”1 quoted by Fabian, Legrand, and Poirier
11 based
on compounds containing the hydroxyethyl group on the
Qnitrogen. The infrared data reported by Emmons ' for four
compounds similar to those studied fall within the quoted
range.
The trends in the data are similar and slightly
more regular than with the azomethlnes. A drop in
frequency occurs for a given R" when R and R' are not

30
both methyl groups. When R" is different from methyl, the
frequency drops to essentially the same value for a given
combination of R and R' . The difference between the
liquid and solution frequencies of N-sec-butylidenepropyl-
amine and N-2-pentylidenepropylamine is attributed to the
greater intermolecular interaction possible in the liquid
state. Attempts to prepare the compounds having the tert-
butyl group as R" by the methods described in Chapter II
were unsuccessful. Molecular models indicate that there
is little space for such a large group on the nitrogen
atom.
The molar absorptivities listed in Table 5 range
in value from 120 to 510 M/i/cm and do not seem to show
any well defined trends except in the case of the Schiff’s
base analogues of ketones. The ketone analogues have
molar absorptivities comparable in magnitude to those
?values quoted by Bellamy for ketones and have roughly
the same trend as the frequencies, namely, a decrease in
value when one or both methyl groups is replaced by an
ethyl group.
The range of absorptivities tabulated and the
number of compounds represented suggested that the appli-
cation of elementary statistics to the grouping of the
data might reveal some general effects of the substituents.

31
The number of intervals or classes needed to group
the data was estimated by the following equation1 ^ in
which "k" represents the number of intervals and "n"
represents the number of values comprising the data:
k » 1 + 3.3 log10
n .
By combining the value obtained from the equation with the
range of the data, it was determined that seven intervals
of 30 units were needed. The result of the grouping is
shown graphically by the frequency polygon, Figure 3,
obtained by plotting the statistical frequency, the number
of values in each interval, against the midpoint of the
interval
•
The compounds are classified according to
absorptivity interval and decreasing absorptivities
within the interval in Table 6. The compounds having two
methyl groups on the carbon atom in general show the
highest intensities, and these further seem to be dependent
on the branched nature of the group substituted on the
nitrogen atom as shown by the comparison of the values
for the isopropyl and sec-butyl groups.
Comparison of the azomethines having absorptivities
between 210 and 240 M/j?/cm with those having absorptivities
between 120 and 150 M/i/cm reveals one alkyl group, the
tert-butyl , common to both intervals. In general, the
32
TABLE 6
INTERVAL GROUPINGS OP THE SCHIFP'S BASES ACCORDINGTO THEIR ABSORPTIVITY VALUES
CompoundMolar Absorptivity
(M/jycm)
Interval 300-329
(ch3)2c«nch(ch
5)2
None
Interval 270-299
Interval 240-269
(ch5)2c-nch
5
(ch5)2c«nch
2ch
3
(ch3)2c»nch(ch
3)ch
2ch
3
Interval 210-239
( ch3)5cch-nch ( ch
3) ch2ch3
(ch3)5cch»nch
5
(CH3)3CCH«NCH(CH
3) 2
310
240
240
230
230
220
210

33
CompoundMolar Absorptivity
(M/^/cm)
Interval 180-209
(ch5)5cch«nch
2ch
5200
(ch5)2chch«n(ch
2 )2ch
3200
(ch5
)2chch-nch(ch
5)2 200
(CH5)2CHCH«NCH(CH
5)CH
2CH
5200
(CH5)2CHCH«NCH
2OH
5190
(CH5)2C»N(CH
2 )2CH
5190
(CH3)2CHCH-NCH
5180
(CH5)5CCH«N(CH
2 )2CH
5180
CH5CH-N(CH
2 )5CH
5180
CH5CH=NCH(CH
5)CH
2CH
5180
Interval 150-179
CH5CH»NCH
2CH
5
CH5CH»NC(CH
5)5
CH5CH»NCH
5
CH5CH2CH-NCH5
CH5CH
2CH»NCH( CH
5)2
(CH5CH
2 ) ( CH5)C-NCH ( CH
5)CH2CH5
( CH3CH
2 )2C-NCH( CHj ) CH
2CH
3
170
170
180
160
160
160
160

34
Table 6 (Continued.)
CompoundMolar Absorptivity
(M/y/cm)
Interval 150-179 continued
CH5CH
2CH«NCH
2CH
5150
(CH5CH
2)(CH
5)C«NCH
3150
( CH3CH
2 ) ( CH3
) c»n( ch2 ) 2CH
3150
(CH3CH
2 )2C-NCH
5150
( CH3CH
2 )2c-n ( ch
2 ) 2CH
3150
(CH3CH
2 )2C-NCH(CH
3)2
150
( CH3CH
2 )2C-NCH ( CH
3)CH
2CH
3150
Interval 120-149
CH3CH-NCH(CH
3)2
140
CH3CH
2CH«NC(CH
3)3
140
CH3CH
2CH-NCH( CH
3) CH
2CH
3140
( CH3CH
2 ) ( CH3
) c-NCH2CH3140
(CH3CH
2 )2C-NCH
2CH
3140
(CH3)2CHCH-NC(CH
3)3
120
(CH3)2CHCH-NC(CH
3)3
120

14
r
35
./Couonb ea:& ieoTq.sT4eq.s
120
150
180
210
240
270
300
Absorptivity
(M/£/cm)
Fig.
3.
-Frequency
Polygon

36
tert-butyl group produces an extreme enhancement when
substituted on the carbon atom and an opposite effect
when substituted on the nitrogen atom.
In addition to their use in quantitative analysis,
absorptivities may be considered qualitatively as a
measure of the detectability of a particular functional
group. The dependence of molar absorptivity on frequency
allows only a general comparison. A much better comparison
of the inherent absorption of a specific group is possible
with integrated intensities. Unfortunately, instruments
which plot the function of absorbancy versus frequency
needed for convenient integration are not readily
available.
An unexpected result was the consistent appearance
of a peak in the region of 3300 cm”1 which is attributed
to the first overtone of the C»N fundamental. The
assignment of this peak is of some importance since peaks
in this region have been quoted as evidence of eneamine-
imine tautomerism.^’2^ An absorption in the vicinity of
3300 cm”1
is usually attributed to an N—H stretching
frequency and is considered as evidence of an N—H grouping.
For the compounds investigated, an N—H group may arise in
three possible ways. First, some of the amine starting
material may not have been completely separated from the

37
product. The constancy of the boiling point and the lack
of the two peaks associated with the NHg absorption of the
amine seemed to rule out this possibility. Vapor phase
chromatography gave no evidence of the presence of the
amine starting material.
The second way an N—H group can arise is by the
compounds undergoing the following dimerization similar toQ
that postulated by Emerson, Hess, and Uhle.
2(H)
H H
>C—C*N—
R
H
(r)2c-c-n-r
H H
(r)2-c-c-n-r
A third possibility is that the Schiff’s base may
exist in the following tautomeric equilibrium.
H H H H
R—C—C=*N—R ^ R—C»G—N—R
R R
The latter two possibilities require the presence
of a hydrogen atom on the carbon alpha to the double bond.
As can be seen in Table 4, those compounds having no
hydrogen in this position still show an absorption in the
3300 cm"1 region which can only be attributed to the first
overtone of the C«*N fundamental stretching frequency. The
overtone frequency also follows the same general trends as

38
the fundamental and, as expected for overtone frequencies,
is always slightly less than twice the fundamental.
Table 7 lists the Schiff's bases having an aryl or
a chloro-substituted aryl group on the doubly bonded
carbon atom. As would be expected, the phenyl group
causes a marked lowering of the frequency for the azo-
methines. Substitution of an alkyl group for the hydrogen
attached to the carbon produces a further decrease in
frequency which is consistent with the behavior found in
the case of the totally alkyl substituted compounds.
Chlorine substitution at the ortho or para position
does not produce the further lowering of the CaN frequency
which one might predict on the basis of the following
resonance structures s

SPECTRAL
DATA
FOR
CARBON
SUBSTITUTED
ALKYL-ARYL
SCHIFF'S
BASES
I$
£t
si*.3,8 ^
© Og dHp d aho1 o© ©
§
5
do
03t>>
o© «dd © -h0*d 3©do*^ PM-H
39
OCMOtACO
CM S cR S tAtA H rl rl rl
d-ft
C'- CA oCN co 4- IACM CM CM CM CMIA tA tA IA tA
•H ON D»ft+> tA lA fA
d CD CD CD CD CDrH r-
•
H rH f—
1
rH
CNd’C^-IN-d-
S tA IA IA IACO CD CD COH rl rl rl rl
<*•«*j*w w WCD CD CDO O O
CArH r—I r-H
w o o oCD I I, IO ol Ptl
vyiA/^nW IA IA IA IA
J>8 B 8 gM w w v>o o o o oH B H K Rfc fe fe {25
CM CM CM CM CMrN r\ r\CM CM CM CM CM
gggggV-/ w V-/IA KN fCi K\ IA
B 8 0 g g

*
40
The inductive effect of the chlorine in the para position
apparently raises the frequency sufficiently to overcome
the lowering expected from the above contribution, and as
a consequence, the absorption frequency is about the same
as the unsubstituted compound.
The high frequency of the ortho substituted compound
can be accounted for in two ways. Figure 4 shows a
molecular model with the N-l-methyl-o-chlorobenzylidene-
propylamine with the chlorophenyl group and the C-N in a
planar configuration. In this position the field effect
ppostulated by Bellamy to explain the shift to higher
frequency for alpha-chloro substituted acetones, mutual
induction of opposite charges in the chlorine and oxygen
reducing the polarity of the 0»0, could cause a rise in
frequency. Secondly, rotation of the ring from the plane
of the double bond, presumably caused by the mutual
repulsion of the chlorine's electrons and the nitrogen's
lone pair, can reduce the conjugation and shift the
frequency upward.
Of the two possibilities the latter seems most
likely although both effects may be operating simultaneously.
Bergmann, Zimkin, and Pinchas^ report frequencies of
1633 cm-1
for N-l-methylbenzylidene cyclohexylamine,
CgH^CH
,
and 1650 cm"1
for N-l-methyl-o-methyl-
benzylidene cyclohexylamine (o-CH^OgH^)(OHj)CaNCgH11 .
r—
I
<D
TjO& <1)
fl
cts arH TO
3 rHO f>5
<D ftO
0B
1
ft

42
The 17 cm”1 difference comparable in magnitude to the
23 cm”1 for the o-chloro substitution supports this
conclusion since a methyl group would not be expected to
show a field effect.
A similar ortho effect does not seem to be observed
for azomethines. Daasch and Hanninen' quote values of
1645 cm”1
and 1640 cm”1
for N-(2-hydroxyethyl)-benzalamine,
C6H5CH«N(CH2 )2
OH and N- (2-hydroxyethyl )-2-chlorobenzalamine
,
o-C1C6H^CH»1T(CH
2 )2OH, respectively. Figure 5 shows the
interference of the methyl group with the rotation of the
o-chlorophenyl substituent. This prevents the ortho
position orientating cis to the nitrogen group. Manipula-
tion of the models with a hydrogen in place of the methyl
indicates that the steric hindrance to rotation no longer
exists permitting a planar configuration and producing
the similar reported values.
The overtone frequency is also present in these
compounds and follows the same trend in general as does
the fundamental. Bergmann^ and his co-workers attribute
an otherwise unexplained peak at 1682 cm”1 for N-l-methyl-p-
fluorobenzylidene hydroxyethylamine (p-FCgH^)(CH^)C=N(CH2 )2
OH,
to the following eneamine-imine tautomerism.

43
44
CEL
c=n-(ch2 )2
-oh
CEU/=\ II
2?
f-4/Vc-n-(ch2 )2-oh
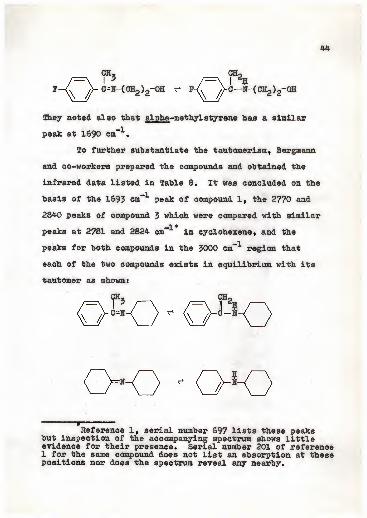
They noted also that alpha-methyl styrene has a similar
peak at 1690 cm*’"1'.
To further substantiate the tautomerism, Bergmann
and co-workers prepared the compounds and obtained the
infrared data listed in Table 8, It was concluded on the
basis of the 1693 cm”1 peak of compound 1, the 2770 and
2840 peaks of compound 3 which were compared with similar
—1 *peaks at 2781 and 2824 cm in cyclohexene* and the
peaks for both compounds in the 3000 cm”1region that
each of the two compounds exists in equilibrium with its
tautomer as shown:
Reference 1, serial number 697 lists these peaksbut inspection of the accompanying spectrum shows littleevidence for their presence. Serial number 201 of reference1 for the same compound does not list an absorption at thesepositions nor does the spectrum reveal any nearby.

TABLE
8
INFRARED
ABSORPTION
DATA
FOR
COMPOUNDS
REPORTED
TO
EXIST
AS
ENEAMINE-IMINE
TAUTOMERS^
45
ao
& 8 S4 cmKN KNkn
<0
<D
•HOd©2
ao•Hto
a* «
I Jg•HP
OININCM
OCO
5 gK>®Wteio
sKNCT>VOrH
KN OKN ON
ON
VO VO VO•“I «“4 i—
I
urf
vOorH 52;
w"* O HVD /"> rHO KN W
ffl VO« O Oo se;
IKN d- O—i« W dhO VOo CM
KN wtA w oW o wvo 1. o—o o| OJ
v> W
• • •
rH CM KN
lAW
rtvoo*5H
8IA«VOo

46
On the basis of the weak ”NH" absorption and the absence
of a peak at about 1690 cm-1
the equilibrium of compound 2
was assumed to be displaced largely toward the imine form
due to the ortho methyl group.
All the peaks reported can be interpreted differently.
The 1690 cm”1
absorptions of compounds 1 and 3 and the lack
thereof in compound 2 can be correlated with the overtone-
combination peaks characteristic of an aromatic group.
Uncorrelated peaks often appear in the 2700 cm”1
region.
The frequencies near 3000 cm”1may of course be overtones
although the absence of such an absorption for compound 4
cannot be explained and is unusual when compared with the
compound in Table 7 differing only in a propyl group
instead of a cyclohexyl.
There were no peaks appearing in any of the
compounds studied which would lend support to such a
tautomerism. This does not exclude, however, the possi-
bility but only indicates that the concentration may be
too low to detect. Since the existence of an overtone
which might easily be confused with an N—H stretching
vibration has been demonstrated, due caution should be
exercised when quoting an absorption in this region as
evidence of tautomerism even in cases where it may
reasonably be expected to exist.

47
Table 9 lists the data for compounds in which a
phenyl or chloro-substituted phenyl group is attached to
the nitrogen. The azomethine shows a drop in frequency
as might be expected showing that conjugation can occur
through the nitrogen as well as through the carbon. The
dimethyl substitution on the carbon atom of the double
bond raises the frequency to that shown by the N-alkyl
substituted compounds listed in Table 5« The molecular
model of N-isopropylidene-o-chloroaniline, Figure 6,
shows that the presence of two methyl groups prevents the
phenyl group from attaining sufficient planarity for
conjugation, hence the rise in frequency. Further
evidence for this configuration comes from the infrared
absorption of the C-N vibration which is expected to
occur between 1360 and 1310 cm”^ for aromatic amines due
to the partial double bond character of the linkage.
The absorption peak due to the C—N split into a doublet
at about 1235 cm1
in the region expected for aliphatic
amines and is almost identical in position with the C-N
frequencies of the similar N-alkyl substituted compounds.
The C—N frequencies for both the N-alkyl and N-aryl
compounds are listed for comparison in Table 10.

SPECTRAL
DATA
FOR
ARYL
NITROGEN
SUBSTITUTED
SCHIFF'S
BASES
48
p•rl
>
P S
ar-l mXOflSS <W
• t?fl tinO <D IP 3 I
f4 o* O<D <J)
o o o oH H K\ ITS
(\l N K\ IT\
<d
OJHK\K\
cd at
58 Fl FlvO vD VDrl H rl H
OJOJ OJ
<r>
r\ rf\ K\K\
8 OJ<r>k
fflo gK\ o o
W « 1 •O O a aw d- «*•
o o «1 1 vo vDa a o OITS lf\ #H rlW w o o
Vf> 1. Lo o ol a
0)
0
3I•rl
(0
a>
fH
If
g•dd•rl

49
TABLE 10
C—N STRETCHING FREQUENCIES OF DIMETHYL SUBSTITUTEDSCHIFF'S BASES
Compound C-N Frequencies in cm”1
ch3n«c(ch
5)2 1248
•
ch5ch
2n-c(ch
5)2 1239
(ch3)2chn-c(ch3 ) 2 1238
CH3CH
2CH(CH
3)N»C(CH
3)2 1232
06H5N.0«3Hj)
2 1241 1228
o-C1C6H4N-C(CH3 )2 1245 1221
m-ClC6H4N-C(CH3 )2 1241 1224

50
-Molecular
model
of
N-isopropylideneaniline

51
Further study of the model shown in Figure 6
reveals that if the compound existed in this configuration,
it would have an enantiomorph by virtue of the ortho
substitution. Resolution of this or other similar compounds
having ortho or meta substitution would lend further
support to the configuration.

CHAPTER IV
SUMMARY
Schiff's bases, having various combinations of
substituents, were synthesized, and the C»N stretching
frequencies were measured for the compounds as pure liquids
and as CCl^ solutions. The molar absorptivities of the C»N
absorption were also calculated as a quantitative
indication of the intensity of the absorption.
The C»N stretching frequencies for the azomethines
containing only alkyl groups on the nitrogen and carbon
atoms were found to be in the wavenumber range from 1680
to 1666 cm”1
. Substitution of a phenyl group on the
nitrogen or carbon atom lowered the frequency through
conjugation to 1650 cm”1
.
The C=*N stretching frequency of the Schiff's bases
classifiable as N-substituted ketimines were in the wave-
number range from 1672 to 1660 cm”1 for the compounds
having only alkyl substituents. Unlike the case of the
azomethines, an aryl substituent on the carbon or
nitrogen atom in the ketimine compounds did not produce
the same frequency effect. Aryl substitution for one of
the alkyl groups attached to the carbon lowered the
52

53
frequency by conjugation with the C=*N. Steric factors
influenced the extent of the lowering when the phenyl
ring was substituted in the ortho position. Substitution
of an alkyl group on the nitrogen atom by an aryl group
did not produce any significant change in the C«N stretch-
ing frequency because conjugation was inhibited by the
alkyl group in the els position.
A weak absorption in the 3300 cm"*1 region occurring
in all spectra of the compounds studied, including those
compounds in which tautomerization could not occur, was
assigned as an overtone of the C»N vibration.
The molar absorptivities ranged from 120 to 230
M/i/cm for the azomethines, 150 to 310 M/^/cm for the
F-alkyldialkyl ketimines, 210 to 350 M///cm for N-aryldi-
alkyl ketimines, and 140 to 190 M/i/cm for N-alkylarylalkyl
ketimines.

BIBLIOGRAPHY
1. American Petroleum Institute Project 44. "InfraredSpectral Data.
"
2. Bellamy, L. J., "The Infrared Spectra of ComplexMolecules.'* Second Edition, John Wiley and Sons,Inc., New York (1958).
3. Bergmann, Ernst D., Zimkin, E. , and Pinchas, S.
,
Rec . Trav . Chlm . . 21, 168-9 (1952).
4. Blomberg, Richard N. and Bruce, William F., U. S.Patent 2,700,681 (Jan. 25, 1955).
5. Campbell, Kenneth N. , Sommers, Armiger H. , andCampbell, Barbara K., J. Am. Chem . Soc., 66, 82-4 (1944).
6. Collins, R. F., Chem . Ind. (London), 1957 . 704.
7. Daasch, L. W. and Hanninen, Urho E. , J. Am. Chem. Soc..22, 3673-6 (1950).
8. Emerson, William S., Hess, S. M. . and Uhle, F. C.
,
J. Am. Chem . Soc . . 63 . 872 (1941).
9. Emmons, William D., J. Am. Chem. Soc., 79, 5739-54(1957).
~ ““
10. Fabian, Joyce and Legrand, Maurice, Bull . Soc . Chim .
France, 1956 . 1461-3.
11. Fabian, Joyce, Legrand, Maurice, and Poirier, Pierre,Bull . Soc . Chim . France . 1956 . 1499-1509.
12. Hansley, Virgil L., U. S. Patent 2,742,503 (Apr. 17*
13. Haury, Vernon B *» S. Patent 2,513,996 (July 4,
14. Hires, J. and Balog, J., Acta Univ. Szegediensis,Acta Phys . et Chem . [N.S.], 2, 87-94 (1956).
54

55
15. Huntsberger, David V. , "Elements of StatisticalInference." Allyn and Bacon, Inc., Boston (1961).
16. Kahovec, L. , Acta Phys . Austriaca, 1, 507-16 (1948).
17. Kabovec, L. , Z. Physik . Chem . (Leipzig), B4£, 364-74 (1939).
~
18. Kirrmann, A. and Laurent, P. , Bull . Soc . Chim . Prance ,
6, 1657-65 (1939).
19. Pijanowski, Leon S. , Dissertation, University ofFlorida (1963).
20. Snyder, H. R. and Matteson, D. S., J. Am. Chem . Soc .
,
22, 2217-21 (1957).
21. Suydam, Fred H., Anal . Chem . . 35 . 193-5 (1963).
22. Norton, Douglas G. , Haury, Vernon E. , Davis, FrankC. , Mitchell, Lloyd J., and Ballard, Seaver A.,J. Chem . . 1£, 1054-66 (1954).
25. Tiollais, Rene, Bull . Soc . Chim . France , 1947 . 708-13*
24. Tiollais, Rene and Guillerm, Henri, Bull . Soc . Chim .
France , 1953 . 937-9.
25. Witkop, Bernhard, J. Am. Chem . Soc . . 7B , 2873-82(1956).
“

BIOGRAPHICAL SKETCH
William Leroy Steele was born August 1, 1932, at
Alliance, Ohio, In June, 1950, he was graduated from the
Alliance High School.
After serving in the United States Navy from 1951
to 1955, he enrolled in Kent State University, Kent, Ohio,
graduating summa cum laude in June, 1959, with the degree
of Bachelor of Science. He entered the Graduate School
at the University of Florida in 1959 and worked for the
Department of Chemistry as a graduate assistant, teaching
assistant and interim instructor while pursuing the degree
of Doctor of Philosophy. He was the DuPont Teaching
Fellow from September, 1962, to June, 1963*
He is a member of Alpha Chi Sigma Chemical Fraternity
and the American Chemical Society.
56

This dissertation was prepared under the direction
of the chairman of the candidate's supervisory committee
and has been approved by all members of that committee* It
was submitted to the Dean of the College of Arts and
Sciences and to the Graduate Council, and was approved as
partial fulfillment of the requirements for the degree of
Doctor of Philosophy.
August 10, 1963
Dean, Graduate School
Supervisory Committee: