Embed Size (px)
Citation preview
An information-theoretical approach to phylogeography
BRYAN C. CARSTENS, HOLLY N. STOUTE and NOAH M. REIDDepartment of Biological Sciences, 202 Life Sciences Building, Louisiana State University, Baton Rouge, LA 70803, USA
Abstract
Data analysis in phylogeographic investigations is typically conducted in either aqualitative manner, or alternatively via the testing of null hypotheses. The former, whereinferences about population processes are derived from geographical patterns of geneticvariation, may be subject to confirmation bias and prone to overinterpretation. Testingthe predictions of null hypotheses is arguably less prone to bias than qualitativeapproaches, but only if the tested hypotheses are biologically meaningful. As it isdifficult to know a priori if this is the case, there is the general need for additionalmethodological approaches in phylogeographic research. Here, we explore an alternativemethod for analysing phylogeographic data that utilizes information theory to quantifythe probability of multiple hypotheses given the data. We accomplish this byaugmenting the model-selection procedure implemented in IMA with calculations ofAkaike Information Criterion scores and model probabilities. We generate a ranking of17 models each representing a set of historical evolutionary processes that may havecontributed to the evolution of Plethodon idahoensis, and then quantify the relativestrength of support for each hypothesis given the data using metrics borrowed frominformation theory. Our results suggest that two models have high probability given thedata. Each of these models includes population divergence and estimates of ancestral hthat differ from estimates of descendent h, inferences consistent with prior work in thissystem. However, the models disagree in that one includes migration as a parameter andone does not, suggesting that there are two regions of parameter space that producemodel likelihoods that are similar in magnitude given our data. Results of a simulationstudy suggest that when data are simulated with migration, most of the optimal modelsinclude migration as a parameter, and further that when all of the shared polymorphismresults from incomplete lineage sorting, most of the optimal models do not. The resultscould also indicate a lack of precision, which may be a product of the amount of data thatwe have collected. In any case, the information-theoretic metrics that we have applied tothe analysis of our data are statistically rigorous, as are hypothesis-testing approaches,but move beyond the ‘reject ⁄ fail to reject’ dichotomy of conventional hypothesis testingin a manner that provides considerably more flexibility to researchers.
Keywords: Coalescent, hypothesis-testing, Information theory, phylogeography
Received 23 March 2009; revision received 10 June 2009; accepted 28 June 2009
Geographical patterns of intraspecific variation havelong been central to evolutionary biology (Wallace 1858;Darwin 1859; Mayr 1942), and descriptive figures thatsummarize such patterns of genetic variation are clearlyvaluable to researchers [e.g. Fig. 3 of Avise et al. (1987)and its imitators]. However, inferences regarding theevolutionary processes that have produced a particular
pattern of genetic variation can be complicated by sev-eral factors. They may be subject to confirmation bias, aphenomenon where people interpret novel informationin a manner that is consistent with their preconceivedideas (Nickerson 1998), and are also thought to beprone to over-interpretation (Knowles & Maddison2002). Additionally, any inference about a given speciesis inherently dependent upon the capacity of individualresearchers to envision realistic and meaningful histori-cal demographic processes.
Correspondence: Bryan C. Carstens, Fax: 225 578 2597;E-mail: [email protected]
! 2009 Blackwell Publishing Ltd
Molecular Ecology (2009) 18, 4270–4282 doi: 10.1111/j.1365-294X.2009.04327.x
In response to the ubiquity of qualitative phylogeo-graphic studies at the turn of the century, severalresearchers promoted the statistical testing of a priorihypotheses as an alternative to descriptive data analy-sis. For example, Sullivan et al. (2000) tested the predic-tions of hypotheses pertaining to the response ofMesoamerican rodents to climatic fluctuations using sta-tistical approaches such as parametric bootstrappingrather than qualitative comparisons of tree topology.(Knowles (2001) made explicit predictions concerningthe structure of Pleistocene refugia, and tested thesepredictions using simulations conducted under a coales-cent model. Nielsen & Wakeley (2001) developed MDIVin large part to differentiate a model of population iso-lation strictly due to genetic drift from a model thatincluded divergence with gene flow. The developmentof these methods, and others like them, was concurrentwith the realization that estimates of many of theparameters that are important to phylogeography maycontain a large amount of variance (Smouse 1998;Edwards & Beerli 2000; Arbogast et al. 2002; Hey &Machaho 2003; Hudson & Turelli 2003). In phylogeogra-phy, statistical approaches to hypothesis testing weredesigned to minimize inference error by accounting forthe statistical error inherent to phylogenetic parameterestimation (Hickerson & Cunningham 2005), as well asthe stochasticity associated with the process of alleliccoalescence (Knowles & Maddison 2002). Accountingfor both types of error is necessary for statistical tests ofphylogeographic hypotheses (Carstens et al. 2005a).However, while a rigorous statistical framework fortesting a priori phylogeographic hypotheses has theoret-ical advantages, it can be difficult to apply in systemsthat lack the extrinsic information required to develophypotheses. Hypotheses are most easily developed insystems with external information pertaining to the his-torical range of a species, for example those with fossilor paleoenvironmental data (Cruzan & Templeton 2000;Brunhoff et al. 2003; Cognato et al. 2003; Tribsch &Schonswetter 2003; McCormack et al. 2008), or in spe-cific habitats that shift in predictable ways with climatechange (Knowles 2001; DeChaine & Martin 2005). Whilepaleoenvironmental niche modelling can aid in thedevelopment of hypotheses in systems impacted byrecent environmental events (Carstens & Richards 2007;Richards et al. 2007), many researchers seek to investi-gate systems where, for a variety of reasons, a priorihypotheses are not readily developed. Furthermore, theintrinsic utility of null hypothesis testing is dependentupon the quality of the hypotheses; rejecting a hypothe-sis that does not capture meaningful information con-cerning the biology of the system provides nothing ofvalue to a researcher (Knowles 2004). For these reasons,the community of phylogeographers would benefit
from considering alternatives to descriptive andhypothesis testing approaches.Phylogeographic research seeks to identify historical
processes that have been important to the evolution ofthe focal taxon and to identify how these processeshave contributed to the formation of population geneticstructure. As such, phylogeography is clearly a histori-cal rather than an experimental science. While descrip-tive investigations are widely used across the historicalsciences and are valuable, approaches that seek to iden-tify the hypothesis that best explains the historical dataare desirable (Cleland 2001). For example, Chamberlin(1890) advocated a method of testing multiple workinghypotheses in the historical sciences where several plau-sible hypotheses are evaluated on the basis of thestrength of the evidence in their favour. Phylogeogra-phy is a discipline well-suited to Chamberlin’sapproach, because any combination of a number of his-torical processes (e.g. population subdivision, popula-tion divergence, population size change, recombination,migration ⁄hybridization) may have contributed to theevolution of a given species. As the primary objectiveof any phylogeographic investigation is to identify therelative contributions of these processes, we could con-ceptualize our discipline as one that seeks to identifythe most appropriate model of population demographichistory for the focal taxon because the selection of thismodel will aid us in identifying the historical processesthat have been most important in its evolution. Adopt-ing this approach requires a subtle reversal in the rela-tionship between hypotheses and data, in comparisonto that used in testing null hypotheses.When null hypotheses are tested in phylogeography,
the P-value represents the probability that the test statis-tic (which is estimated from the empirical data) is greaterthan expected given that the null hypothesis is true (e.g.Sokal & Rohlf 1994). However, if the data are collected toevaluate multiple working hypotheses, it is desirable toreverse this relationship and calculate the probability ofeach hypothesis given the data (Anderson 2008). Revers-ing the relationship between data and hypotheses has anadditional benefit to the historical sciences because itallows a set of n models (representing n hypotheses) tobe ranked. In this manner, the probability of the hypothe-sis given the data can be calculated for any number ofhypotheses, these probabilities can be compared andevaluated using approaches from information theory(Kullback 1959). In contrast, if we use P-values to test theset of n hypotheses, we would reject some portion andfail to reject the others, but would be unable to differenti-ate among those that could not be rejected.An information-theoretical approach to phylogeo-
graphic research would proceed by ranking a set ofhypotheses in terms of their probability given the data,
INFORMATION-THEORETICAL PHYLOGEOGRAPHY 4271
! 2009 Blackwell Publishing Ltd
rather than describing patterns in the data and derivinghypotheses from these patterns or calculating theprobability of some parameter while assuming aparticular hypothesis is true. In information-theoreticalapproaches, information is anything that decreases ouruncertainty about the relative contributions of historicalprocesses (Burnham & Anderson 1998; Anderson 2008).In the context of phylogeographic research, historicalprocesses (represented by parameters) can be incorpo-rated into a mathematical model and can be comparedby calculating the likelihood of a model given the data.Thus, any software for genetic data analysis that calcu-lates the likelihood of the full model and also allowsusers to calculate this likelihood using only a subset ofthe total parameters in the model could potentially beused for an information-theoretical approach. In fact,Nielsen & Wakeley (2001) used an information-theoreticstatistic to evaluate models when they introducedMDIV; basically they calculated Akaike InformationCriterion (AIC) scores for models that included and didnot include gene flow (Nielsen & Wakeley 2001).Akaike (1973) defined AIC = )2log(model|data) + 2k,where k is the number of estimated parameters in themodel. By taking the exponential of the differencebetween the AIC score of the best model and the AICscore of model i, and the weighting across all models,the model probability (wi) of model i given the data canbe calculated and compared to other models (Anderson2008). Any number of models can be ranked using AICscores, and further this approach is not limited to
comparisons of a single nested model to a full model,as are likelihood ratio tests.Until recently, one major impediment to the applica-
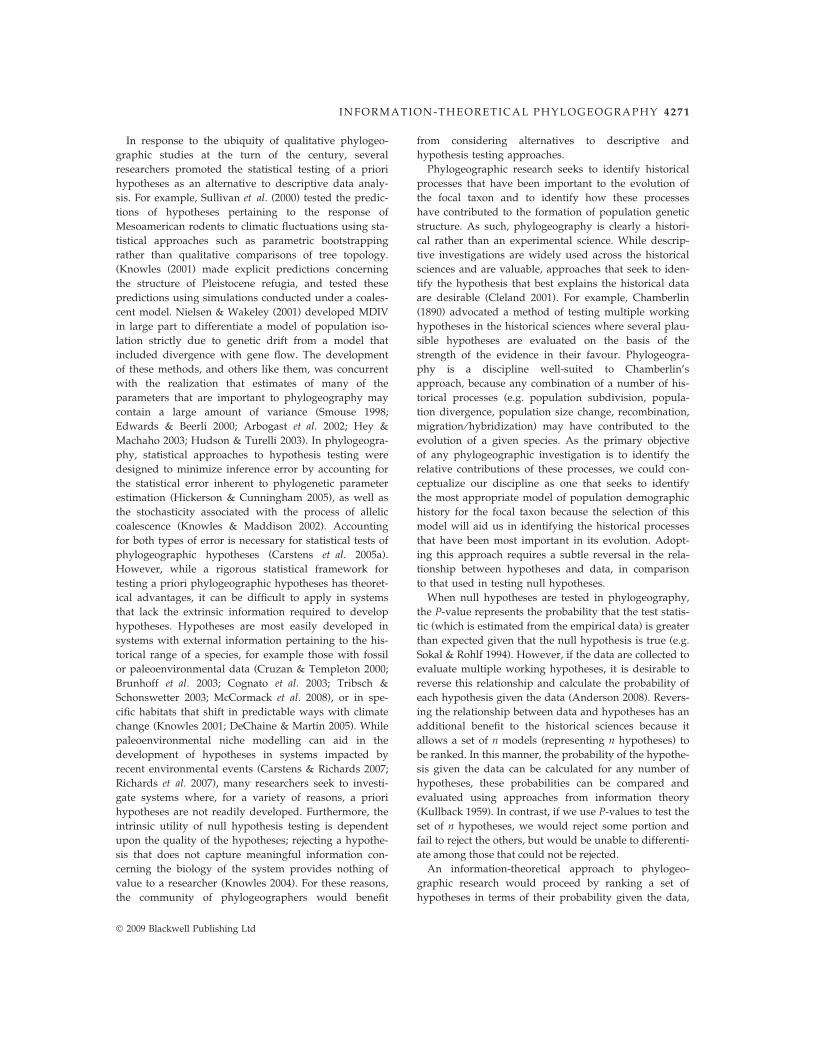
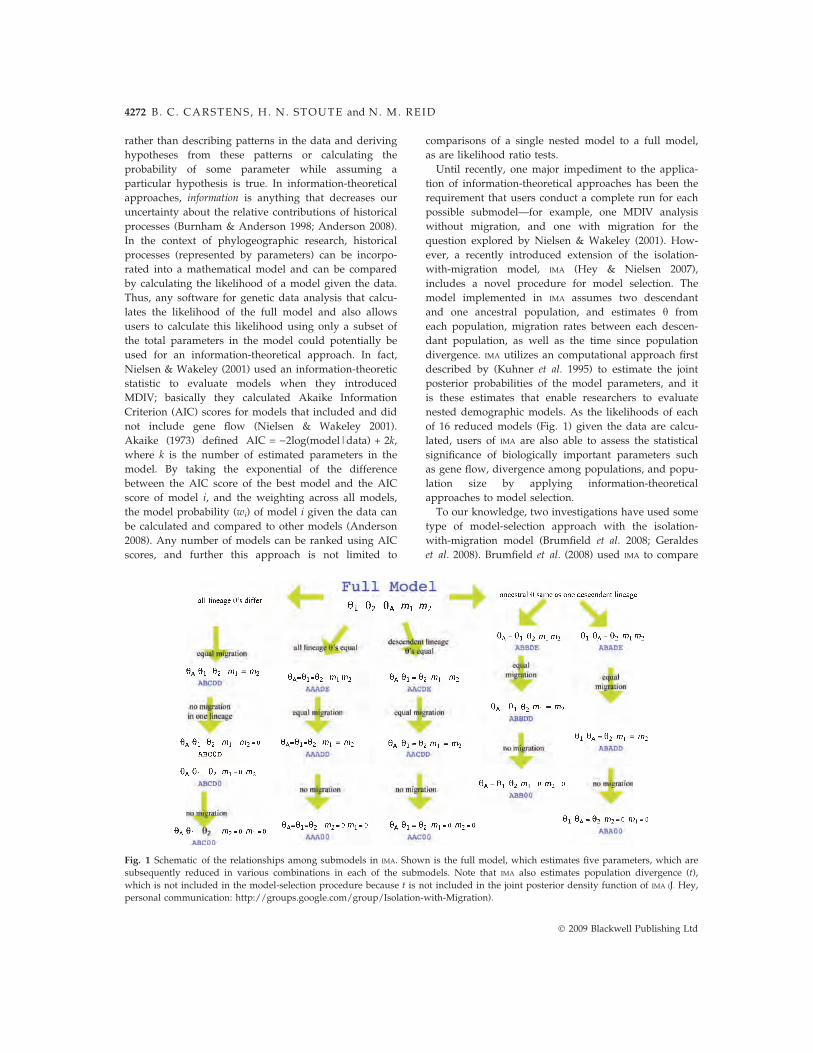
tion of information-theoretical approaches has been therequirement that users conduct a complete run for eachpossible submodel—for example, one MDIV analysiswithout migration, and one with migration for thequestion explored by Nielsen & Wakeley (2001). How-ever, a recently introduced extension of the isolation-with-migration model, IMA (Hey & Nielsen 2007),includes a novel procedure for model selection. Themodel implemented in IMA assumes two descendantand one ancestral population, and estimates h fromeach population, migration rates between each descen-dant population, as well as the time since populationdivergence. IMA utilizes an computational approach firstdescribed by (Kuhner et al. 1995) to estimate the jointposterior probabilities of the model parameters, and itis these estimates that enable researchers to evaluatenested demographic models. As the likelihoods of eachof 16 reduced models (Fig. 1) given the data are calcu-lated, users of IMA are also able to assess the statisticalsignificance of biologically important parameters suchas gene flow, divergence among populations, and popu-lation size by applying information-theoreticalapproaches to model selection.To our knowledge, two investigations have used some
type of model-selection approach with the isolation-with-migration model (Brumfield et al. 2008; Geraldeset al. 2008). Brumfield et al. (2008) used IMA to compare
Fig. 1 Schematic of the relationships among submodels in IMA. Shown is the full model, which estimates five parameters, which aresubsequently reduced in various combinations in each of the submodels. Note that IMA also estimates population divergence (t),which is not included in the model-selection procedure because t is not included in the joint posterior density function of IMA (J. Hey,personal communication: http://groups.google.com/group/Isolation-with-Migration).
4272 B. C. CARSTENS, H. N. STOUTE and N. M. REID
! 2009 Blackwell Publishing Ltd
a model where migration was symmetrical and popula-tion hs were equal (h1 = h2 = hA and m12 = m21) for sev-eral pairwise comparisons of Amazonian birds.Geraldes et al. (2008) compared models with and with-out gene flow to test hypotheses related to introgressionof the Y-chromosome in European rabbits. Both studieswere motivated by the desire to ascertain the biologicalimportance of the various parameters; for example, wasit justifiable to treat population hs as equal (Brumfieldet al. 2008), or has gene flow historically occurred at ahigh level (Geraldes et al. 2008). Given that many inves-tigations use the isolation-with-migration model toexplore gene flow between divergent populations (Niku-la et al. 2007; Kotlik et al. 2008; Lee & Edwards 2008;McCormack et al. 2008; Niemiller et al. 2008; Szovenyiet al. 2008), as well as introgression ⁄hybridization (Car-ling & Brumfield 2008; Good et al. 2008; Hird & Sullivan2009), the model-selection approach implemented withinIMA has broad application to phylogeography. However,the greatest value of this approach is that it allows phy-logeographic researchers to evaluate multiple workingmodels in the spirit of Chamberlin (1890), thereby quan-tifying the relative strength of support for various com-binations of historical processes. Rather than describingthe pattern of genetic variation or testing a priorihypotheses, researchers can identify processes that havebeen important in structuring the genetic diversitywithin a given species by evaluating competing modelsusing approaches such as AIC (Burnham & Anderson1998). Here, we collect data from a representative empir-ical system, analyse these data and evaluate modelsusing IMA, explore the performance of the model selec-tion using simulated data, and provide an example ofhow information theory can be used to identify hypothe-ses that are well-supported given the data.
Methods
Empirical data
Over 250 Plethodon idahoensis were collected from north-ern Idaho, Montana, and British Columbia as part of abroader comparative phylogeographic investigation intothe Pacific Northwest mesic forest ecosystem (Carstenset al. 2004, 2005b). Data from the cytochrome b (cyt b)mitochondrial gene suggest that significant populationstructure within the species is found between the twosouthern-most river drainages (the Lochsa and SelwayRivers) and the remaining northern drainages. Descrip-tive evidence supports this finding, for example there ismonophyly of individuals from the southern drainages,and results from an analysis of molecular variance (Car-stens et al. 2004) suggest that southern populationshave historically been isolated from northern popula-
tions. Coalescent-based tests of null hypotheses havealso been conducted (Carstens et al. 2005b; Carstens &Richards 2007), and generally these tests support theidea that populations were restricted to multiple glacialrefugia during the Pleistocene. Furthermore, there isevidence for restricted gene flow between these popula-tions (Carstens et al. 2005c) and population expansion(Carstens et al. 2004). Consequently, the P. idahoensissystem provides an opportunity to explore the utility ofan information-theoretical approach to phylogeographyusing the model-selection procedure implemented inIMA because the set of parameters included in thismodel encompass the two most relevant questions tothis system: (i) has migration between populations his-torically occurred at high levels between the southernand northern groups within P. idahoensis and (ii) hasthere been a substantial change in the size of the ances-tral populations (as would be predicted under a refu-gial model). In P. idahoensis, answering these questionswill improve our understanding of how historicaldemographic processes that occurred as a result ofPleistocene climatic fluctuations.To explore these questions, we add data from two
nuclear genes to a previously collected 669-bp fragmentof cyt b (Carstens et al. 2004). Additional data were col-lected from the internally transcribed spacer of the16SrRNA gene (Hillis & Dixon 1991) and from the recom-bination activating protein (RAG) 1 gene (Wiens et al.2006). We gathered data from 30 P. idahoensis, twelveindividuals from the Lochsa or Selway drainages, andeighteen from the North Fork of the Clearwater and othernorthern drainages. Samples were chosen at randomfrom available tissue samples, not on the basis of infor-mation from the previously collected cyt b data. In devel-oping this sampling strategy, we sought to balance theanticipated improvement in accuracy of the parameterestimates that usually accompanies an increase in thenumber of loci (Edwards & Beerli 2000; Carling & Brum-field 2007; Carstens & Knowles 2007) with the computa-tional demands of large multilocus data sets. In choosingthree loci and thirty individuals, we hope to collectenough data to estimate parameters reasonably well inan amount of time that is short enough to allow a sensi-tivity analysis to be conducted using simulated data andreplication (details of this analysis below). Sequence datawere phased to alleles either by polymerase chain reac-tion (PCR) subcloning (using high fidelity Taq) and sub-sequently sequencing eight clones from each sample, orthrough the use of PHASE (Stephens et al. 2001).The isolation-with-migration model in IMA assumes
that loci are evolving in a neutral manner, and also thatthere is no recombination within each locus. To explorethese assumptions, we calculated Tajima’s (1989) D ineach of the populations. While a significantly negative
INFORMATION-THEORETICAL PHYLOGEOGRAPHY 4273
! 2009 Blackwell Publishing Ltd
value of D can result from natural selection or fromdemographic effects (such as population expansion orstructure), values that are not significant suggest to usthat these loci are not inappropriate to use in an IMA
analysis. However, this test may have low power givenour samples sizes (36 and 24 chromosomes as collectedhere in the northern and Lochsa ⁄Selway populations)and subsequently the protein-coding genes used in thisanalysis could be subject to weak purifying selectionthat may not be detected by Tajima’s D (Hammer et al.2003). We also conducted the four-gamete test in eachpopulation using DnaSP (Rozas & Rozas 1999) to testfor recombination.Gene flow, population divergence, and h = 4Nel were
estimated using IMA (Hey & Nielsen 2007) for all thedata. Initially, 25 runs of IMA were conducted with vary-ing prior values for the theta, migration and divergencetime parameters with a fixed run length of 25 h and sixcoupled Markov chains. Once optimal priors were iden-tified, we experimented by varying the number of cou-pled Markov chains (2–10) and the heating scheme. Viathis process, we settled on prior values of h1 = 25,h2 = 25, hA = 50, m12 = 1, m21 = 1, t = 10, and determinedthat four coupled Markov chains and a geometric heat-ing with parameters that varied between )g1 = 0.05 and)g2 = 10.0. We then conducted two sets of IMA runswith varying run times (25, 50 and 100 h) on a 3.0 GHzMacPro, using random number seeds for each and aburn-in period of 100 000 steps. In these runs, we analy-sed our data using the full isolation-with-migrationmodel and conducted the model-selection procedureindependently on each run to explore the effects of run-time variation on the selection procedure. The posteriordensity function of the full isolation-with-migrationmodel is maximized to generate parameter estimates inIMA (Hey & Nielsen 2007) and the model-selection pro-cedure repeats this process for each of 16 reduced mod-els (Fig. 1). Due to reasons discussed by Hey & Nielsen(2007), the population divergence parameter (t) is notincluded in this procedure. Hey & Nielsen (2007) con-duct model selection by comparing the results of thelikelihood ratio test (LRT) to an appropriate chi-squareddistribution, and also imply that a correction for multi-ple comparisons is appropriate. As a result, we con-ducted model selection using both uncorrected LRTsand a Bonferroni correction for multiple comparisons.We also computed the AIC scores (Akaike 1973), AICdifferences, model likelihoods and probabilities follow-ing Anderson (2008).
Simulation study
Once we were confident that we had good estimates ofparameters from our empirical data, we used MS
(Hudson 2002) to simulate genealogies for each locusunder three coalescent models. The first of these corre-sponded to the full isolation-with-migration model (AB-CDE), with values of h1, h2, hA, m12, m21, and t thatmatched those estimated from our empirical data. Thesecond model did not include migration (ABC00), butwas simulated using values of h1, h2, hA, and t thatmatched those from our empirical data. The thirdmodel also did not include migration (AAA00), and didnot incorporate differences in h among the ancestraland descendant populations (e.g. h1 = h2 = hA and t).For the third model, h1 = h2 = hA was set to the arith-metic mean of the empirical estimates. For each set ofgenealogies, we used SEQ-GEN (Rambaut & Grassly 1997)to simulate sequence data with characteristics (model ofsequence evolution, number of segregating sites) match-ing our empirical data. Once these data were simulated,we assembled input files for IMA using UNIX and PERL
scripts. In this way, we were able to produce data thateither did not differ appreciably from the empirical data(the full model), or differed in known ways (the nomigration or no migration with equal theta models). Thesesimulated data were then analysed using the model-selection protocol implemented in IMA in order toexplore the sensitivity of the program. We conducted100 replicates, including the model-selection protocol,for each model.
Results
Analysis of empirical data
Sequence data were collected from 30 individuals,including 884 bp from the ITS of the 16s rRNA gene,and 1210 bp from the RAG-1 gene and are deposited inGenBank under Accession numbers GQ337923–GQ337954 (ITS) and GQ247792–GQ247811 (RAG-1).Sequence data were resolved to alleles using either PCRsubcloning (nITS = 13; nRag1 = 12) or PHASE. While levelsof polymorphism in these genes were not as high as inthe mitochondrial DNA, they nevertheless exhibitedconsiderable variation (Table 1). Results from the Taj-ima’s D-test (Table 1) and the four-gamete test suggestthat the assumptions of the isolation-with-migrationmodel are not violated by these data. Sequencealignment of all loci was unambiguous and conductedmanually.Our preliminary analysis suggested that optimal mix-
ing occurred with four coupled Markov chains and ageometric heating scheme ()g1 = 0.05 and )g2 = 2.0).All metrics suggested that the Markov chains convergedbefore the end of the burn-in and were adequately sam-pling the posterior distribution of parameter space. Forexample, the lowest ESS value, which was recorded
4274 B. C. CARSTENS, H. N. STOUTE and N. M. REID
! 2009 Blackwell Publishing Ltd
during one of the 25-h runs, was ESS = 99, and forlonger runs this value was considerably higher (e.g.ESS = 563 for one of the 100-h runs). Similarly, therewas no discernable pattern to the plots of parametertrend lines. After examining the IMA output of all runs,we are convinced that there is no evidence that suggeststhat the Markov chain have not converged by the endof the burn-in period.Estimates of parameters from the IMA analysis
(Table 2) have at least three biologically importantimplications. First, estimates of ancestral h are lowerthan estimates of descendent h, this could indicate isola-tion in a small ancestral population. Second, estimatesof divergence time between populations are muchgreater than zero, which supports earlier findings ofpopulation structure. Mean migration rates, while small,
are nonzero, implying that divergence has occurredwith gene flow. One plausible interpretation of valuesof this magnitude is population divergence with lowrates of gene flow. Since these parameters are reportedin terms of coalescent units, conversion to values thatare more easily interpreted requires some assumptionsabout the mutation rate, which we can not calculatedirectly. However, divergence between Plethodon idaho-ensis and its sister taxon Plethodon vandykei is probablybetween 5 and 2 Myr (Carstens et al. 2005b; Wiens et al.2006); given this value the temporal divergence betweenthe Lochsa ⁄Selway populations and the northern drain-ages is between 27 000 and 68 000 generations, andmigration rates are something on the order of one indi-vidual per 1000 generations. This suggests that there isnot a strong pattern of ongoing gene flow betweenthese populations.Results of model selection across each of the runs
were similar, and for ease of discussion we combinedthe posterior distributions from the two long runs (cor-responded to more than 3.5 · 108 steps in the Markovchain) and repeated the model-selection procedure(Table 3). These results illustrate the complex nature ofthe joint estimates of model parameters. For example,using an uncorrected likelihood ratio test, there are ninemodels that can be rejected and seven which can not berejected. Other than models that force population h val-ues to be equal (e.g. AAA– models; which were allrejected), it is difficult to draw generalities about whichparameters are ‘important’ to include in a model ofP. idahoensis population demography from these results.For example, some of the models which can not berejected do not include a migration parameter, whileothers which can not be rejected include one or twomigration parameters. Further, some of the models
Table 1 Sequence data statisticsGene bp s h p hw Fixed D P-value
Cyt bAll 669 27 13 0.00822 0.01093 2 )0.9358 >0.10LS 10 6 0.0045 0.0041 0 0.3353 >0.10ND 15 13 0.00474 0.0060 0 )0.7415 >0.10
ITSAll 884 14 25 0.00482 0.00390 0 0.7483 >0.10LS 13 15 0.00536 0.00422 0 0.9210 >0.10ND 9 16 0.00337 0.00273 0 0.7727 >0.10
Rag1All 1210 13 17 0.00217 0.00253 0 )0.4347 >0.10LS 8 8 0.0016 0.00188 0 )0.4918 >0.10ND 8 11 0.00773 0.00183 0 )0.1751 >0.10
Characteristics of sequence data 675 for three loci are shown, for 676 all the data as wellas the Lochsa/Selway (LS) and northern drainages (ND) populations. 677 Characteristicsinclude the length (bp), number of segregating sites (s), heterozygosity (h), 678 nucleotidediversity (p), Waterson’s theta (hw), the number of fixed differences between 679populations, Tajima’s D and its P-value.
Table 2 Parameter estimates from the empirical data usingIMA
h1 h2 hA m1 m2 t
HiPtRun1 9.5137 8.8014 1.5263 0.0005 0.0295 1.905Run2 9.4119 8.8014 1.5263 0.0005 0.0245 1.905
MeanRun1 10.892 9.7872 5.0007 0.1382 0.1166 2.2543Run2 10.8813 9.7741 5.3667 0.1406 0.1156 2.2874
HPD90Lo
Run1 5.6472 5.3419 0.1018 0.0005 0.0005 1.195Run2 5.6472 5.3419 0.1018 0.0005 0.0005 1.175
HPD90Hi
Run1 15.924 13.9907 5.5963 0.3055 0.2455 3.025Run2 15.924 13.9907 5.7998 0.3125 0.2445 3.075
For each parameter, the high point, mean, and boundaries ofthe highest posterior density are given. Results of two longruns are shown.
INFORMATION-THEORETICAL PHYLOGEOGRAPHY 4275
! 2009 Blackwell Publishing Ltd
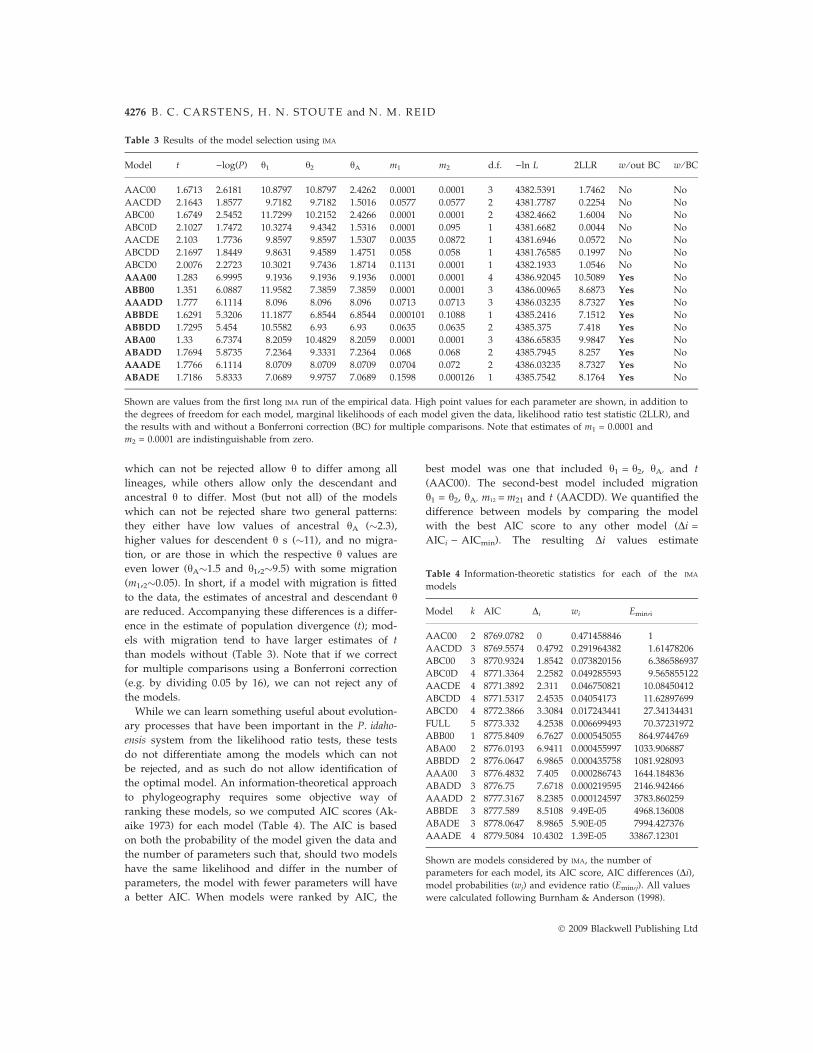
which can not be rejected allow h to differ among alllineages, while others allow only the descendant andancestral h to differ. Most (but not all) of the modelswhich can not be rejected share two general patterns:they either have low values of ancestral hA (!2.3),higher values for descendent h s (!11), and no migra-tion, or are those in which the respective h values areeven lower (hA!1.5 and h1,2!9.5) with some migration(m1,2!0.05). In short, if a model with migration is fittedto the data, the estimates of ancestral and descendant hare reduced. Accompanying these differences is a differ-ence in the estimate of population divergence (t); mod-els with migration tend to have larger estimates of tthan models without (Table 3). Note that if we correctfor multiple comparisons using a Bonferroni correction(e.g. by dividing 0.05 by 16), we can not reject any ofthe models.While we can learn something useful about evolution-
ary processes that have been important in the P. idaho-ensis system from the likelihood ratio tests, these testsdo not differentiate among the models which can notbe rejected, and as such do not allow identification ofthe optimal model. An information-theoretical approachto phylogeography requires some objective way ofranking these models, so we computed AIC scores (Ak-aike 1973) for each model (Table 4). The AIC is basedon both the probability of the model given the data andthe number of parameters such that, should two modelshave the same likelihood and differ in the number ofparameters, the model with fewer parameters will havea better AIC. When models were ranked by AIC, the
best model was one that included h1 = h2, hA, and t(AAC00). The second-best model included migrationh1 = h2, hA, m12 =m21 and t (AACDD). We quantified thedifference between models by comparing the modelwith the best AIC score to any other model (Di =AICi ) AICmin). The resulting Di values estimate
Table 3 Results of the model selection using IMA
Model t )log(P) h1 h2 hA m1 m2 d.f. )ln L 2LLR w ⁄ out BC w ⁄BC
AAC00 1.6713 2.6181 10.8797 10.8797 2.4262 0.0001 0.0001 3 4382.5391 1.7462 No NoAACDD 2.1643 1.8577 9.7182 9.7182 1.5016 0.0577 0.0577 2 4381.7787 0.2254 No NoABC00 1.6749 2.5452 11.7299 10.2152 2.4266 0.0001 0.0001 2 4382.4662 1.6004 No NoABC0D 2.1027 1.7472 10.3274 9.4342 1.5316 0.0001 0.095 1 4381.6682 0.0044 No NoAACDE 2.103 1.7736 9.8597 9.8597 1.5307 0.0035 0.0872 1 4381.6946 0.0572 No NoABCDD 2.1697 1.8449 9.8631 9.4589 1.4751 0.058 0.058 1 4381.76585 0.1997 No NoABCD0 2.0076 2.2723 10.3021 9.7436 1.8714 0.1131 0.0001 1 4382.1933 1.0546 No NoAAA00 1.283 6.9995 9.1936 9.1936 9.1936 0.0001 0.0001 4 4386.92045 10.5089 Yes NoABB00 1.351 6.0887 11.9582 7.3859 7.3859 0.0001 0.0001 3 4386.00965 8.6873 Yes NoAAADD 1.777 6.1114 8.096 8.096 8.096 0.0713 0.0713 3 4386.03235 8.7327 Yes NoABBDE 1.6291 5.3206 11.1877 6.8544 6.8544 0.000101 0.1088 1 4385.2416 7.1512 Yes NoABBDD 1.7295 5.454 10.5582 6.93 6.93 0.0635 0.0635 2 4385.375 7.418 Yes NoABA00 1.33 6.7374 8.2059 10.4829 8.2059 0.0001 0.0001 3 4386.65835 9.9847 Yes NoABADD 1.7694 5.8735 7.2364 9.3331 7.2364 0.068 0.068 2 4385.7945 8.257 Yes NoAAADE 1.7766 6.1114 8.0709 8.0709 8.0709 0.0704 0.072 2 4386.03235 8.7327 Yes NoABADE 1.7186 5.8333 7.0689 9.9757 7.0689 0.1598 0.000126 1 4385.7542 8.1764 Yes No
Shown are values from the first long IMA run of the empirical data. High point values for each parameter are shown, in addition tothe degrees of freedom for each model, marginal likelihoods of each model given the data, likelihood ratio test statistic (2LLR), andthe results with and without a Bonferroni correction (BC) for multiple comparisons. Note that estimates of m1 = 0.0001 andm2 = 0.0001 are indistinguishable from zero.
Table 4 Information-theoretic statistics for each of the IMA
models
Model k AIC Di wi Emin,i
AAC00 2 8769.0782 0 0.471458846 1AACDD 3 8769.5574 0.4792 0.291964382 1.61478206ABC00 3 8770.9324 1.8542 0.073820156 6.386586937ABC0D 4 8771.3364 2.2582 0.049285593 9.565855122AACDE 4 8771.3892 2.311 0.046750821 10.08450412ABCDD 4 8771.5317 2.4535 0.04054173 11.62897699ABCD0 4 8772.3866 3.3084 0.017243441 27.34134431FULL 5 8773.332 4.2538 0.006699493 70.37231972ABB00 1 8775.8409 6.7627 0.000545055 864.9744769ABA00 2 8776.0193 6.9411 0.000455997 1033.906887ABBDD 2 8776.0647 6.9865 0.000435758 1081.928093AAA00 3 8776.4832 7.405 0.000286743 1644.184836ABADD 3 8776.75 7.6718 0.000219595 2146.942466AAADD 2 8777.3167 8.2385 0.000124597 3783.860259ABBDE 3 8777.589 8.5108 9.49E-05 4968.136008ABADE 3 8778.0647 8.9865 5.90E-05 7994.427376AAADE 4 8779.5084 10.4302 1.39E-05 33867.12301
Shown are models considered by IMA, the number ofparameters for each model, its AIC score, AIC differences (Di),model probabilities (wj) and evidence ratio (Emin,j). All valueswere calculated following Burnham & Anderson (1998).
4276 B. C. CARSTENS, H. N. STOUTE and N. M. REID
! 2009 Blackwell Publishing Ltd
Kullback & Leibler (1951) information (e.g. the distancebetween the best model and model i), and are easy tointerpret; models improve relative to the best model asDi approaches zero. The AIC Di between the two bestmodels (AAC00 and AACDD) is !0.5, and other mod-els are substantially worse. Two other statistics are usedto transform AIC values into metrics that are more eas-ily interpreted. We calculated Akaike weights (wi), thenormalized relative likelihoods of the models given thedata, and evidence ratios (wmin ⁄wi) following Burnham& Anderson (2002). Akaike weights provide a way toquantify how much of the total evidence favours a par-ticular model—for example, some 76% of the total like-lihood is contributed by the AAC00 and AACDDmodels. Evidence ratios provide a way to conceptualizethe relative odds that a model is best given the data. Ifthe Akaike weights of model i and the best model are0.12 and 0.6, respectively, then the evidence ratio is0.6 ⁄ 0.12 = 5, and the odds against model i being thebest model are 5:1. When applied to our data, evidenceratios suggest that the second-best model (AACDD) has1.6:1 odds compared to the best model (AAC00), adegree of support that we consider sufficient to con-sider strongly (Table 4).
Simulation study
Simulated data were analysed in order to evaluate thesensitivity of the model-selection procedure in IMA givenparameter values similar to those observed in ourempirical data. With one exception (total run time), weused the same settings as in our empirical IMA runs. Asresults of the long runs of the empirical data were notappreciably different from the shorter runs, we set runlength on the simulated data to 24 h, which corre-sponded to an average of 4.3 · 106 steps in the Markovchain for each replicate. Simulated data were analysedusing the Louisiana State University High PerformanceComputing network on a cluster computer with multi-ple 2.33 GHz nodes.Two important results follow from this sensitivity
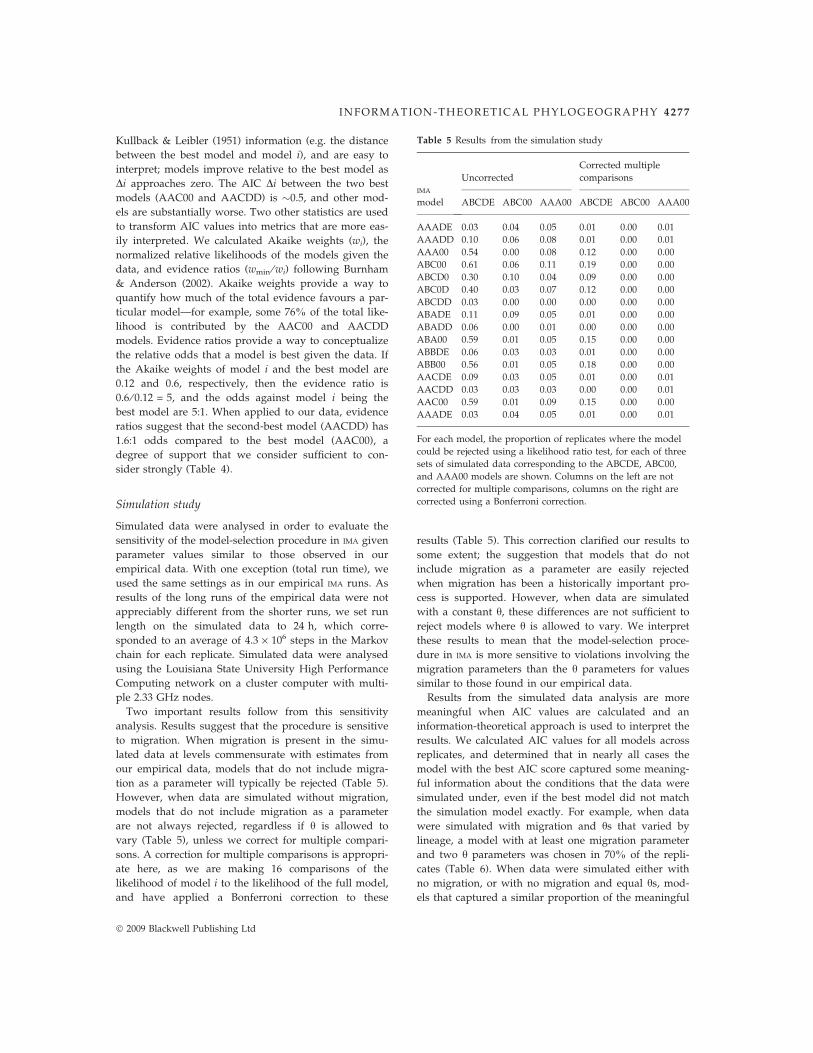
analysis. Results suggest that the procedure is sensitiveto migration. When migration is present in the simu-lated data at levels commensurate with estimates fromour empirical data, models that do not include migra-tion as a parameter will typically be rejected (Table 5).However, when data are simulated without migration,models that do not include migration as a parameterare not always rejected, regardless if h is allowed tovary (Table 5), unless we correct for multiple compari-sons. A correction for multiple comparisons is appropri-ate here, as we are making 16 comparisons of thelikelihood of model i to the likelihood of the full model,and have applied a Bonferroni correction to these
results (Table 5). This correction clarified our results tosome extent; the suggestion that models that do notinclude migration as a parameter are easily rejectedwhen migration has been a historically important pro-cess is supported. However, when data are simulatedwith a constant h, these differences are not sufficient toreject models where h is allowed to vary. We interpretthese results to mean that the model-selection proce-dure in IMA is more sensitive to violations involving themigration parameters than the h parameters for valuessimilar to those found in our empirical data.Results from the simulated data analysis are more
meaningful when AIC values are calculated and aninformation-theoretical approach is used to interpret theresults. We calculated AIC values for all models acrossreplicates, and determined that in nearly all cases themodel with the best AIC score captured some meaning-ful information about the conditions that the data weresimulated under, even if the best model did not matchthe simulation model exactly. For example, when datawere simulated with migration and hs that varied bylineage, a model with at least one migration parameterand two h parameters was chosen in 70% of the repli-cates (Table 6). When data were simulated either withno migration, or with no migration and equal hs, mod-els that captured a similar proportion of the meaningful
Table 5 Results from the simulation study
IMA
model
UncorrectedCorrected multiplecomparisons
ABCDE ABC00 AAA00 ABCDE ABC00 AAA00
AAADE 0.03 0.04 0.05 0.01 0.00 0.01AAADD 0.10 0.06 0.08 0.01 0.00 0.01AAA00 0.54 0.00 0.08 0.12 0.00 0.00ABC00 0.61 0.06 0.11 0.19 0.00 0.00ABCD0 0.30 0.10 0.04 0.09 0.00 0.00ABC0D 0.40 0.03 0.07 0.12 0.00 0.00ABCDD 0.03 0.00 0.00 0.00 0.00 0.00ABADE 0.11 0.09 0.05 0.01 0.00 0.00ABADD 0.06 0.00 0.01 0.00 0.00 0.00ABA00 0.59 0.01 0.05 0.15 0.00 0.00ABBDE 0.06 0.03 0.03 0.01 0.00 0.00ABB00 0.56 0.01 0.05 0.18 0.00 0.00AACDE 0.09 0.03 0.05 0.01 0.00 0.01AACDD 0.03 0.03 0.03 0.00 0.00 0.01AAC00 0.59 0.01 0.09 0.15 0.00 0.00AAADE 0.03 0.04 0.05 0.01 0.00 0.01
For each model, the proportion of replicates where the modelcould be rejected using a likelihood ratio test, for each of threesets of simulated data corresponding to the ABCDE, ABC00,and AAA00 models are shown. Columns on the left are notcorrected for multiple comparisons, columns on the right arecorrected using a Bonferroni correction.
INFORMATION-THEORETICAL PHYLOGEOGRAPHY 4277
! 2009 Blackwell Publishing Ltd
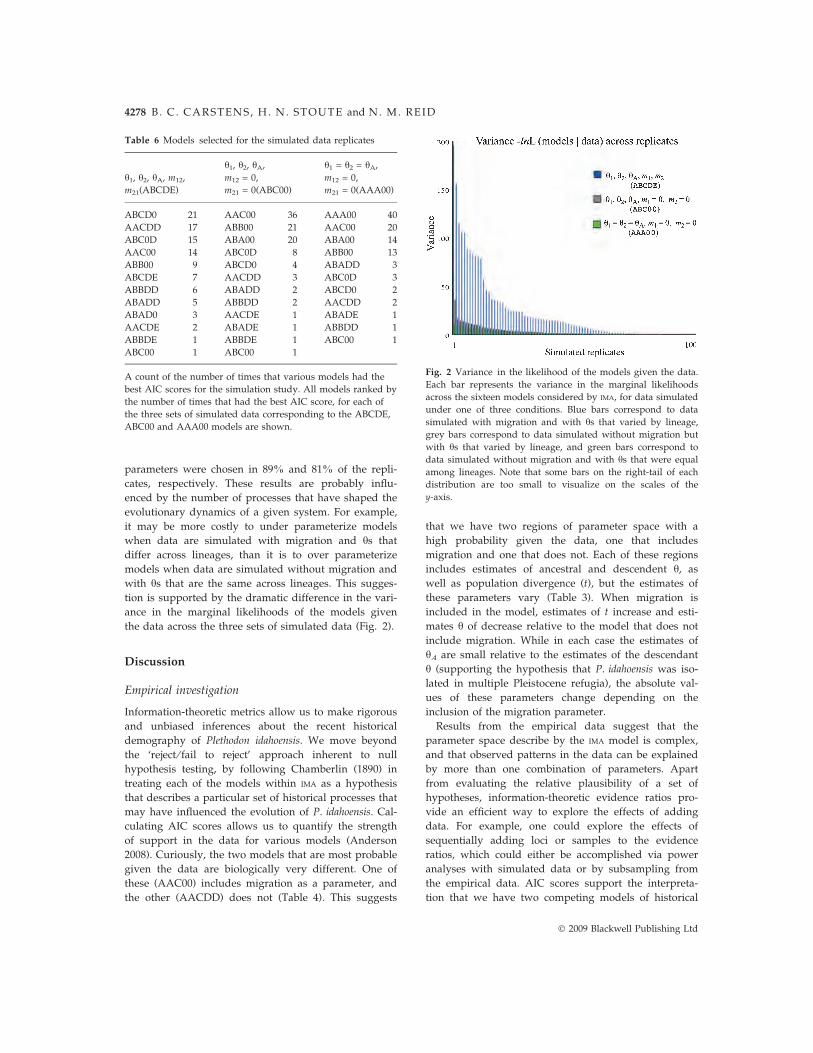
parameters were chosen in 89% and 81% of the repli-cates, respectively. These results are probably influ-enced by the number of processes that have shaped theevolutionary dynamics of a given system. For example,it may be more costly to under parameterize modelswhen data are simulated with migration and hs thatdiffer across lineages, than it is to over parameterizemodels when data are simulated without migration andwith hs that are the same across lineages. This sugges-tion is supported by the dramatic difference in the vari-ance in the marginal likelihoods of the models giventhe data across the three sets of simulated data (Fig. 2).
Discussion
Empirical investigation
Information-theoretic metrics allow us to make rigorousand unbiased inferences about the recent historicaldemography of Plethodon idahoensis. We move beyondthe ‘reject ⁄ fail to reject’ approach inherent to nullhypothesis testing, by following Chamberlin (1890) intreating each of the models within IMA as a hypothesisthat describes a particular set of historical processes thatmay have influenced the evolution of P. idahoensis. Cal-culating AIC scores allows us to quantify the strengthof support in the data for various models (Anderson2008). Curiously, the two models that are most probablegiven the data are biologically very different. One ofthese (AAC00) includes migration as a parameter, andthe other (AACDD) does not (Table 4). This suggests
that we have two regions of parameter space with ahigh probability given the data, one that includesmigration and one that does not. Each of these regionsincludes estimates of ancestral and descendent h, aswell as population divergence (t), but the estimates ofthese parameters vary (Table 3). When migration isincluded in the model, estimates of t increase and esti-mates h of decrease relative to the model that does notinclude migration. While in each case the estimates ofhA are small relative to the estimates of the descendanth (supporting the hypothesis that P. idahoensis was iso-lated in multiple Pleistocene refugia), the absolute val-ues of these parameters change depending on theinclusion of the migration parameter.Results from the empirical data suggest that the
parameter space describe by the IMA model is complex,and that observed patterns in the data can be explainedby more than one combination of parameters. Apartfrom evaluating the relative plausibility of a set ofhypotheses, information-theoretic evidence ratios pro-vide an efficient way to explore the effects of addingdata. For example, one could explore the effects ofsequentially adding loci or samples to the evidenceratios, which could either be accomplished via poweranalyses with simulated data or by subsampling fromthe empirical data. AIC scores support the interpreta-tion that we have two competing models of historical
Table 6 Models selected for the simulated data replicates
h1, h2, hA, m12,m21(ABCDE)
h1, h2, hA,m12 = 0,m21 = 0(ABC00)
h1 = h2 = hA,m12 = 0,m21 = 0(AAA00)
ABCD0 21 AAC00 36 AAA00 40AACDD 17 ABB00 21 AAC00 20ABC0D 15 ABA00 20 ABA00 14AAC00 14 ABC0D 8 ABB00 13ABB00 9 ABCD0 4 ABADD 3ABCDE 7 AACDD 3 ABC0D 3ABBDD 6 ABADD 2 ABCD0 2ABADD 5 ABBDD 2 AACDD 2ABAD0 3 AACDE 1 ABADE 1AACDE 2 ABADE 1 ABBDD 1ABBDE 1 ABBDE 1 ABC00 1ABC00 1 ABC00 1
A count of the number of times that various models had thebest AIC scores for the simulation study. All models ranked bythe number of times that had the best AIC score, for each ofthe three sets of simulated data corresponding to the ABCDE,ABC00 and AAA00 models are shown.
Fig. 2 Variance in the likelihood of the models given the data.Each bar represents the variance in the marginal likelihoodsacross the sixteen models considered by IMA, for data simulatedunder one of three conditions. Blue bars correspond to datasimulated with migration and with hs that varied by lineage,grey bars correspond to data simulated without migration butwith hs that varied by lineage, and green bars correspond todata simulated without migration and with hs that were equalamong lineages. Note that some bars on the right-tail of eachdistribution are too small to visualize on the scales of they-axis.
4278 B. C. CARSTENS, H. N. STOUTE and N. M. REID
! 2009 Blackwell Publishing Ltd
demography that are highly probable given the data(AAC00 and AACDD). To some degree, these modelseach are supported by specific patterns in each locus;the models with the highest AIC scores for the ITS,Rag1 and cyt b loci were the ABCDE, AAC00, andAAC00, respectively. When data from ITS ⁄ cyt b andITS ⁄Rag1 were combined, the AACDD model had thebest AIC value, and when data from Rag1 ⁄ cyt b werecombined, the AAC00 model was best.
Simulation study
As the model-selection approach included in IMA has todate only been used on a handful of systems, we usedsimulated data to assess the performance of the model-selection procedure given our data. Our results(Table 5) suggest that the procedure implemented inIMA is able to reject models without migration whenmigration has been historically important in a large pro-portion of the replicates. Data that were simulated with-out migration, but with different population sizes, weremore problematic for model selection (Table 5). We sus-pect that some combination of the following explana-tions can account for these results. First, data weresimulated under values of t, h, and m matching ourempirical data, and it is possible, particularly in thecase of the h1 and h2 values, that these were too similarto one another to easily differentiate the AAC– from theABC– models. Second, our run times for the simulationstudy were shorter than those used in the empiricalstudy. While ESS values suggest that the Markov chainshad reached stationarity, it may be that our sample ofthe posterior distribution is inadequate to compute themarginal likelihoods of the models accurately. Toexplore this issue, we repeated five of the ABCDE runswhile doubling the run time, and obtained similarresults, which suggested to us that our run times wereadequate for this simulation study. Finally, it is conceiv-able that we have not collected data from a sufficientnumber of loci, or from a large enough number of indi-viduals, to actually differentiate the AAC00 from theAACDD and other models.
Are information-theoretical approaches broadly usefulto phylogeography?
Phylogeographic research aims to understand theunique combination of historical processes that haveshaped the evolution of the focal taxon (Avise et al.1987). The isolation-with-migration model is increas-ingly important to the discipline, as evidence by theover 300 citations of the manuscripts that introduced IM
and IMA since 2004 (Web of Science). This suggests to usthat the information-theoretical approach described
above should be broadly useful, even if it can not cur-rently be applied to every phylogeographic systembecause these systems do not match the model used inIMA. Examples of inappropriate systems include thosewhere one of the descendent lineages is founded by asmall subset of the ancestral population (a splittingparameter is included in IM but not IMA) and those thatare divided into more than two populations. It is alsoworth noting that this approach can be extended toquestions beyond those that fit the isolation-with-migra-tion model. For example, the computer program LAMARC
allows users to include or exclude parameters such asmigration and population size change in its calculationof the relative likelihood of the model given the data(Kuhner 2006), and as such could be applicable to phy-logeographic systems with more than two populationsto evaluate the relative contributions of gene flow andpopulation expansion if these relative likelihoods werecomparable. Other questions are amenable to this infor-mation-theoretic framework; for example Fitzpatricket al. (2008) used Bayes factors to compare two modelsimplemented in Structure to see if they could reject amodel of hybridization at a contact zone (Pritchardet al. 2000; Fitzpatrick et al. 2008). In essence,approaches that seek to identify the best demographicmodel given the data are similar to the model-selectionprocedures used by phylogenetists to identify modelsof sequence evolution (e.g. Sullivan & Joyce 2005), andin general model-selection approaches are broadlyapplicable across ecology and evolutionary biology(Johnson & Omland 2004). While no current methodimplements that phylogeographic equivalent of theGTR+I+C model of sequence evolution, such a model istheoretically possible. Alternatively, methods such asapproximate Bayesian computation could provide phy-logeographers with the flexibility to evaluate a widerange of hypotheses (Nielsen & Beaumont 2009). Whilecertain biological processes (e.g. gene flow, demo-graphic expansion, genetic drift) are more easily incor-porated into a likelihood framework than others (e.g.selection), we nevertheless remain hopeful that upcom-ing methological advances will allow us to considermore complex models. Certainly the release of IMA 2.0(J. Hey, personal communication) while this manuscriptwas in revision is a positive sign that more complexmodels can be evaluated with information-theoreticalapproaches.Phylogeographic research seeks to identify the histori-
cal processes that have influenced genetic variationwithin populations. In practice, many investigators gath-ered data in order to develop or test hypotheses that areessentially models of historical population demography.For example, Carstens et al. (2005b) posited that isolationin multiple refugia during Pleistocene glacial periods, fol-
INFORMATION-THEORETICAL PHYLOGEOGRAPHY 4279
! 2009 Blackwell Publishing Ltd
lowed by postglacial expansion, was a likely explanationfor the pattern of genetic diversity observed in P. idahoen-sis. This scenario is essentially a model of the historicaldemography, albeit one that is rather short on specifics,that has been developed over the course of severalpublications. While it may be unfair to characterize thisapproach as laborious, it necessarily involves a numberof different types of analyses, each with some specificaim. Will phylogeography proceed in this manner in thefuture, as sequence data become increasingly easier tocollect, as multilocus data sets grow into genomic datasets, and as more complex analytical methods becomeavailable? We hope not. Rather, we envision a futurewhere a structured coalescent model can incorporate allof the historical processes that may influence geneticdiversity, where one can estimate parameters associatedwith these models, and one where phylgeographicresearchers apply information-theoretical approaches toevaluate the strength of support for particular hypothe-ses contained within the full model. This approachwould be as broadly applicable as the conventionaldescriptive approach, but at least as rigorous as statisticalapproaches to hypothesis testing.
Acknowledgements
This research was supported in part by a Howard HughesMedical Institute grant through the Undergraduate BiologicalSciences Education Program to Louisiana State University toH.N. Stoute and by the Louisiana Board of Regents who pro-vided N.M. Reid with a Doctoral Fellowship. Many of the anal-yses were conducted using computational resources providedby the Louisiana Optical Network and by the Louisiana StateUniversity High Performance Computing system. We thankJ.D. McVay, M.M. Koopman, and T. Pelletier for providingcomments on drafts of this manuscript, and J.K. Carstens forassistance collecting the sequence data. We are grateful to par-ticipants in the 2009 AMNH-SWRS Statistical Phylogeographyworkshop for their extensive discussions related to this topic.We thank Remy Petit and four anonymous referees for theirhelpful comments and suggestions on the initial submission ofthis manuscript.
References
Akaike H (1973) Information theory as an extension of themaximum likelihood principle. In: Second InternationalSymposium on Information Theory (eds Petrov BN, Csaki F),pp. 267–281. Akademiai Kiado, Budapest.
Anderson DR (2008) Model Based Inference in the Life Sciences.Springer, New York.
Arbogast BS, Edwards SV, Wakeley J, Beerli P, Slowinski J(2002) Estimating divergence times from molecular data onphylogenetic and population genetic timescales. AnnualReview of Ecology and Systematics, 33, 707–740.
Avise JC, Arnold J, Ball RM et al. (1987) Intraspecificphylogeography: the mitochondrial DNA bridge between
population genetics and systematics. Annual Reviews ofEcology, Evolution, and Systematics, 18, 489–522.
Brumfield RT, Liu L, Lum DE, Edwards SV (2008) Comparisonof species tree methods for reconstructing the phylogeny ofBearded Manakins (Aves: Pipridae, Manacus) frommultilocus sequences data. Systematic Biology, 57, 719–731.
Brunhoff C, Galbreath E, Federov VB, Cook JA, Jaarola M(2003) Holarctic phylogeography of the root vole (Microtusoeconomus): implications for late Quaternary biogeography ofhigh latitudes. Molecular Ecology, 12, 957–968.
Burnham KP, Anderson DR (1998)Model Selection and MultimodelInference: A Practical Information-Theoretic Approach. Springer,New York.
Burnham KP, Anderson DR (2002) Model Selection andMultimodel inference: A practical Information-Theoretic Approach.Springer, New York.
Carling MD, Brumfield RT (2007) Gene sampling strategies formulti-locus population estimates of genetic diversity. PLoSONE, e160, 1–6.
Carling MD, Brumfield RT (2008) Integrating phylogenetic andpopulation genetic analyses of multiple loci to test speciesdivergence hypotheses in Passerina buntings. Genetics, 178,363–377.
Carstens BC, Knowles LL (2007) Shifting distributions andspeciation: species divergence during rapid climate change.Molecular Ecology, 16, 619–627.
Carstens BC, Richards CL (2007) Integrating coalescent andecological niche modeling in comparative phylogeography.Evolution, 61, 1439–1454.
Carstens BC, Stevenson AL, Degenhardt JD, Sullivan J (2004a)Testing nested phylogenetic and phylogeographichypotheses in the Plethodon vandykei species group.Systematic Biology, 53, 781–792.
Carstens BC, Degenhardt JD, Stevenson AL, Sullivan J (2005a)Accounting for coalescent stochasticity in testingphylogeographical hypotheses: modelling Pleistocenepopulation structure in the Idaho giant salamanderDicamptodon aterrimus. Molecular Ecology, 14, 255–265.
Carstens BC, Brunsfeld SJ, Demboski JR, Good JM, Sullivan J(2005b) Investigating the evolutionary history of the PacificNorthwest mesic forest ecosystem: hypothesis testing withina comparative phylogeographic framework. Evolution, 59,1639–1652.
Carstens BC, Bankhead A III, Joyce P, Sullivan J (2005c)Testing population genetic structure using parametricbootstrapping. Genetica, 124, 71–75.
Chamberlin TC (1890) The method of multiple workinghypotheses. Journal of Geology, 5, 937.
Cleland CA (2001) Historical science, experimental science, andthe scientific method. Geology, 29, 987–990.
Cognato AI, Harlin AD, Fisher ML (2003) Genetic structureamong Pinyon Pine Beetle populations (Scolytinae: Ipsconfusus). Environmental Entomology, 32, 1262–1270.
Cruzan MB, Templeton AR (2000) Paleoecology andcoalescence: phylogeographic analysis of hypotheses fromthe fossil record. Trends in Ecology and Evolution, 15, 491–496.
Darwin C (1859) On the Origin of Species. A Facsimile of the FirstEdition. Harvard University Press, Cambridge, MA.
DeChaine EG, Martin AP (2005) Historical biogeography oftwo alpine butterflies in the Rocky Mountains: broad-scale
4280 B. C. CARSTENS, H. N. STOUTE and N. M. REID
! 2009 Blackwell Publishing Ltd
concordance and local-scale discordance. Journal ofBiogeography, 32, 1943–1956.
Edwards SV, Beerli P (2000) Perspective: gene divergence,population divergence, and the variance in coalescent timein phylogeographic studies. Evolution, 54, 1839–1854.
Fitzpatrick BM, Placyk JS Jr, Niemiller ML, Casper GS,Burghardt GM (2008) Distinctiveness in the face of geneflow: hybridization between specialist and generalistgartersnakes. Molecular Ecology, 17, 4107–4117.
Geraldes A, Carneiro M, Delibes-Mateos M et al. (2008)Reduced introgression of the Y chromosome betweensubspecies of the European rabbit (Oryctolagus cuniculus) inthe Iberian peninsula. Molecular Ecology, 17, 4489–4499.
Good JM, Hird S, Reid N et al. (2008) Ancient hybridizationand mitochondrial capture between two species ofchipmunks. Molecular Ecology, 17, 1313–1327.
Hammer MF, Blackmer F, Garrigan D, Nachman MW, WilderJA (2003) Human population structure and its effects onsampling Y chromosome sequence variation. Genetics, 164,1495–1509.
Hey J, Machaho CA (2003) The study of structuredpopulations—new hope for a difficult and divided science.Nature Reviews Genetics, 4, 535–543.
Hey J, Nielsen R (2007) Integration within the Felsensteinequation or improved Markov chain Monte Carlo methodsin population genetics. Proceedings of the National Academy ofSciences, USA, 104, 2785–2790.
Hickerson MJ, Cunningham CW (2005) Contrasting Quaternaryhistories in an ecologically divergent sister pair of low-dispersing intertidal fish (Xiphister) revealed by multilocusdna analysis. Evolution, 59, 344–360.
Hillis DM, Dixon MT (1991) Ribosomal DNA: molecularevolution and phylogenetic inference. Quarterly Review ofBiology, 66, 411–453.
Hird S, Sullivan J (2009) Assessment of gene flow across ahybrid zone in red-tailed chipmunks (Tamias ruficaudis).Molecular Ecology, 18, 3097–3109
Hudson RR (2002) Generating samples under a Wright-Fisherneutral model of genetic variation. Bioinformatics, 18, 337–338.
Hudson RR, Turelli M (2003) Stochasticity overrules the‘‘three-times rule’’: genetic drift, genetic draft, and coalescenttimes for nuclear loci versus mitochondrial DNA. Evolution,57, 182–190.
Johnson JB, Omland KE (2004) Model selection in ecologyand evolution. Trends in Ecology and Evolution, 19, 101–108.
Knowles LL (2001) Did the Pleistocene glaciations promotedivergence? Tests of explicit refugial models in montanegrasshoppers. Molecular Ecology, 10, 691–701.
Knowles LL (2004) The burgeoning field of statisticalphylogeography. Journal of Evolutionary Biology, 17, 1–10.
Knowles LL, Maddison DR (2002) Statistical phylogeography.Molecular Ecology, 11, 2623–2635.
Kotlik P, Markova S, Choleva L et al. (2008) Divergence withgene flow between Ponto-Caspian refugia in an anadromouscyprinid Rutilus frissi revealed by multiple genephylogeography. Molecular Ecology, 17, 1076–1088.
Kuhner MK (2006) LAMARC 2.0: maximum likelihood andBayesian estimation of population parameters. Bioinformatics,22, 768–770.
Kuhner MK, Yamato J, Felsenstein J (1995) Estimating effectivepopulation size and mutation rate from sequence data
using Metropolis-Hasting sampling. Genetics, 140, 1421–1430.
Kullback S (1959) Information Theory and Statistics. John Wiley,New York.
Kullback S, Leibler RA (1951) On information and sufficiency.Annals of Mathematical Statistics, 22, 79–86.
Lee JY, Edwards SV (2008) Divergence across Australia’sCarpentarian Barrier: statistical phylogeography of the Red-backed Fairy Wren (Malurus melanocephalus). Evolution, 62,3117–3134.
Mayr E (1942) Systematics and the Origin of the Species.Columbia University Press, New York, NY.
McCormack JE, Bowen BS, Smith TB (2008) Integratingpaleoecology and genetics of bird populations in two skyisland archipelagos. BMC Biology, 6, 1–12.
Nickerson RS (1998) Confirmation bias: a ubiquitousphenomenon in many guises. Review of General Psychology, 2,175–220.
Nielsen R, Beaumont MA (2009) Statistical inferences inphylogeography. Molecular Ecology, 18, 1034–1047.
Nielsen R, Wakeley J (2001) Distinguishing migration fromisolation: a Markov chain monte carlo approach. Genetics,158, 885–896.
Niemiller ML, Fitzpatrick BM, Miller BT (2008) Recentdivergence with gene flow in Tennessee cave salamanders(Plethodontidae: Gyrinophilus) inferred from genegenealogies. Molecular Ecology, 17, 2258–2275.
Nikula R, Stelkov P, Valnola R (2007) Diversity and trans-Arctic invasion history of mitochondrial lienages in theNorth Atlantic Macoma balthica complex (Bivalvia:Tellinidae). Evolution, 61, 928–941.
Pritchard JK, Stephens M, Donnelly P (2000) Inference ofpopulation structure using multilocus genotype data.Genetics, 155, 945–959.
Rambaut A, Grassly NC (1997) SEQ-GEN: an application for theMonte Carlo simulation of DNA sequence evolution alongphylogenetic trees. Computational Applications to Biosciences,13, 235–238.
Richards CL, Carstens BC, Knowles LL (2007) Distributionmodelling and statistical phylogeography: an integrativeframework for generating and testing alternativebiogeographic hypotheses. Journal of Biogeography, 34, 1833–1845.
Rozas J, Rozas R (1999) DnaSP version 3: an integratedprogram for molecular population genetics and molecularevolution analysis. Bioinformatics, 15, 174–175.
Smouse P (1998) To tree or not to tree. Molecular Ecology, 7,399–412.
Sokal RR, Rohlf FJ (1994) Biometry: The Principles and Practicesof Statistics in Biological Research, 3rd edn. W. H. Freeman,New York.
Stephens M, Smith NJ, Donnelly P (2001) A new statisticalmethod for haplotype reconstruction from population data.Genetics, 68, 978–989.
Sullivan J, Joyce P (2005) Model selection in phylogenetics.Annual Reviews of Ecology, Evolution, and Systematics, 36, 445–466.
Sullivan J, Arellano E, Rogers DS (2000) Comparativephylogeography of Mesoamerican highland rodents:concerted versus independent response to past climaticfluctuations. The American Naturalist, 155, 755–768.
INFORMATION-THEORETICAL PHYLOGEOGRAPHY 4281
! 2009 Blackwell Publishing Ltd
Szovenyi P, Terracciano S, Ricca M, Giordano S, Shaw AJ(2008) Recent divergence, intercontinental dispersal andshared polymorphism are shaping the genetic structure ofamphi-Atlantic peatmoss populations. Molecular Ecology, 17,5364–5377.
Tajima F (1989) The effect of change in population size onDNA polymorphism. Genetics, 105, 437–460.
Tribsch A, Schonswetter P (2003) Patterns of endemism andcomparative phylogeography confirm palaeoenvironmentalevidence for Pleistocene refugia in the Eastern Alps. Taxon,52, 477–497.
Wallace AR (1858) On the tendency of varieties to departindefinitely from the original type. Journal of the Proceedingsof the Linnean Society: Zoology, 3, 53–62.
Wiens JJ, Engstrom TN, Chippindale PT (2006) Rapiddiversification, incomplete isolation, and the ‘‘speciation
clock’’ in North American salamanders (Genus Plethodon):testing the hybrid swarm hypothesis of rapid radiation.Evolution, 60, 2585–2603.
Bryan Carstens is interested in methodological approaches tophylogenetics and phylogeography, particularly in how theapproaches that are adopted while analyzing phylogeographicdata can influence our confidence in the results. Noah Reid isinterested in phylogentic theory and comparative phylogeogra-phy of neotropical insects. Holly Stoute conducted this researchwhile supported as a summer researcher by the HHMI; she isinterested in evolutionary genetics and developmental biology,and hopes to enter a Ph.D. program in the Fall of 2010.
4282 B. C. CARSTENS, H. N. STOUTE and N. M. REID
! 2009 Blackwell Publishing Ltd
Corrigendum
Contributed by BRYAN C. CARSTENS, HOLLY N. STOUTE and NOAH REIDDepartment of Biological Sciences, 202 Life Sciences Building, Louisiana State University, Baton Rouge, LA 70803, USA
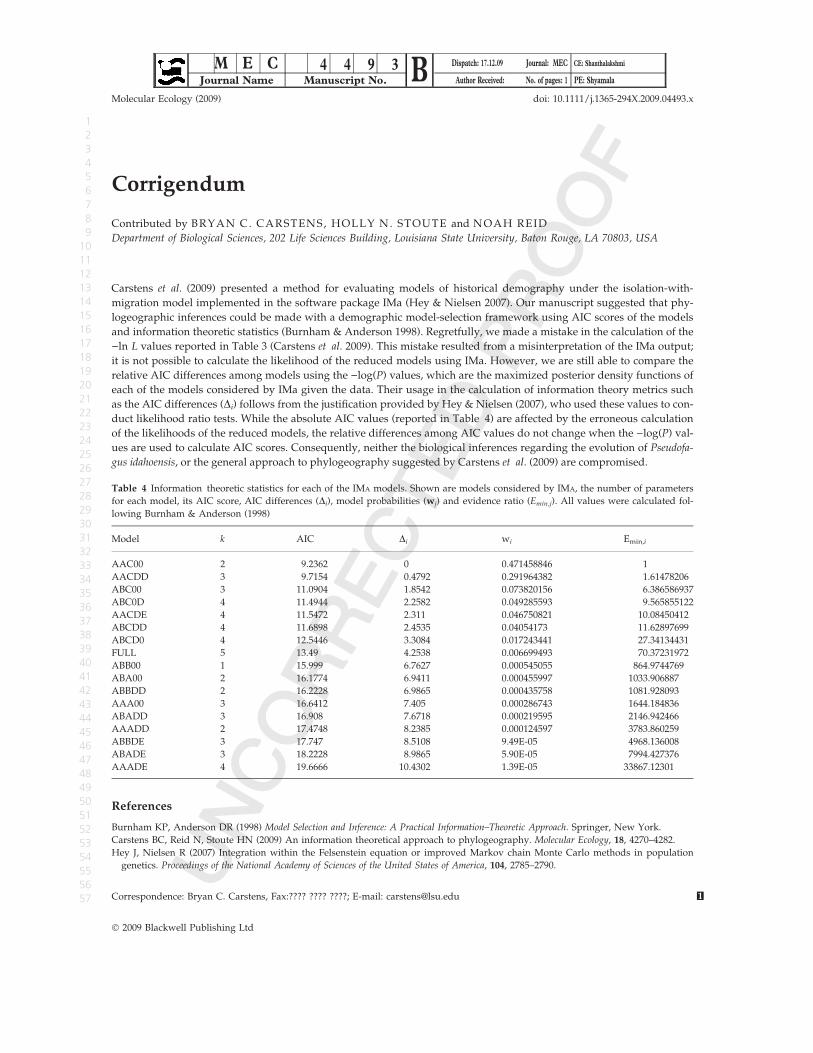
Carstens et al. (2009) presented a method for evaluating models of historical demography under the isolation-with-migration model implemented in the software package IMa (Hey & Nielsen 2007). Our manuscript suggested that phy-logeographic inferences could be made with a demographic model-selection framework using AIC scores of the modelsand information theoretic statistics (Burnham & Anderson 1998). Regretfully, we made a mistake in the calculation of the)ln L values reported in Table 3 (Carstens et al. 2009). This mistake resulted from a misinterpretation of the IMa output;it is not possible to calculate the likelihood of the reduced models using IMa. However, we are still able to compare therelative AIC differences among models using the )log(P) values, which are the maximized posterior density functions ofeach of the models considered by IMa given the data. Their usage in the calculation of information theory metrics suchas the AIC differences (Di) follows from the justification provided by Hey & Nielsen (2007), who used these values to con-duct likelihood ratio tests. While the absolute AIC values (reported in Table 4) are affected by the erroneous calculationof the likelihoods of the reduced models, the relative differences among AIC values do not change when the )log(P) val-ues are used to calculate AIC scores. Consequently, neither the biological inferences regarding the evolution of Pseudofa-gus idahoensis, or the general approach to phylogeography suggested by Carstens et al. (2009) are compromised.
References
Burnham KP, Anderson DR (1998) Model Selection and Inference: A Practical Information–Theoretic Approach. Springer, New York.Carstens BC, Reid N, Stoute HN (2009) An information theoretical approach to phylogeography. Molecular Ecology, 18, 4270–4282.Hey J, Nielsen R (2007) Integration within the Felsenstein equation or improved Markov chain Monte Carlo methods in population
genetics. Proceedings of the National Academy of Sciences of the United States of America, 104, 2785–2790.
M E C 4 4 9 3 B Dispatch: 17.12.09 Journal: MEC CE: Shanthalakshmi
Journal Name Manuscript No. Author Received: No. of pages: 1 PE: Shyamala
Correspondence: Bryan C. Carstens, Fax: 1???? ???? ????; E-mail: [email protected]
Table 4 Information theoretic statistics for each of the IMA models. Shown are models considered by IMA, the number of parametersfor each model, its AIC score, AIC differences (Di), model probabilities (wj) and evidence ratio (Emin,j). All values were calculated fol-lowing Burnham & Anderson (1998)
Model k AIC Di wi Emin,i
AAC00 2 9.2362 0 0.471458846 1AACDD 3 9.7154 0.4792 0.291964382 1.61478206ABC00 3 11.0904 1.8542 0.073820156 6.386586937ABC0D 4 11.4944 2.2582 0.049285593 9.565855122AACDE 4 11.5472 2.311 0.046750821 10.08450412ABCDD 4 11.6898 2.4535 0.04054173 11.62897699ABCD0 4 12.5446 3.3084 0.017243441 27.34134431FULL 5 13.49 4.2538 0.006699493 70.37231972ABB00 1 15.999 6.7627 0.000545055 864.9744769ABA00 2 16.1774 6.9411 0.000455997 1033.906887ABBDD 2 16.2228 6.9865 0.000435758 1081.928093AAA00 3 16.6412 7.405 0.000286743 1644.184836ABADD 3 16.908 7.6718 0.000219595 2146.942466AAADD 2 17.4748 8.2385 0.000124597 3783.860259ABBDE 3 17.747 8.5108 9.49E-05 4968.136008ABADE 3 18.2228 8.9865 5.90E-05 7994.427376AAADE 4 19.6666 10.4302 1.39E-05 33867.12301
! 2009 Blackwell Publishing Ltd
Molecular Ecology (2009) doi: 10.1111/j.1365-294X.2009.04493.x
1
2
3
4
5
6
7
8
9
10
11
12
13
14
15
16
17
18
19
20
21
22
23
24
25
26
27
28
29
30
31
32
33
34
35
36
37
38
39
40
41
42
43
44
45
46
47
48
49
50
51
52
53
54
55
56
57