Embed Size (px)
Citation preview
COMPUTATIONAL NEUROSCIENCEMethods Article
published: 30 March 2011doi: 10.3389/fncom.2011.00015
Here, we present a novel approach for evaluating neuronal tun-ing functions. Using a probabilistic tuning function description, we propose a model-free alternative to regression analysis. By maxi-mizing the mutual information between the neuronal activity and any combination of explanatory variables, the presented method allows the estimation of neuronal latency and gives a measure for the dependence of neuronal activity on different combinations of the explanatory variables. This stands in contrast with typical appli-cations of information-theoretic techniques in neural data analysis (see, e.g., Rieke et al., 1997), which investigate the relevance of spike timing or the influence of correlations in neural populations.
In the following, we demonstrate the application of this novel method on data from MSTd and show that neuronal activity in this cortical area is determined by combinations of retinal (e.g., image velocity) and extraretinal variables (e.g., eye velocity and position).
2 Methods2.1 evaluating probabilistic tuning functionsThe method proposed here consists of two components: first, a Bayesian approach for the determination of probabilistic tuning functions, and second, an information-theoretic technique for evaluating these tuning functions by estimating neuronal laten-cies and selecting those variables that show the greatest dependence on the neuronal activity.
2.1.1 Bayesian approach for tuning function determinationLet S be a binary random variable for the observation of a spike or non-spike, with p
S(s) denoting the probability mass function
of spike occurrence. The discrete random variable V denotes the observation of a specific combination of explanatory variables with
1 introductionDefining the dependence of neuronal activity on certain variables, e.g., presented stimuli, is often the major aim of studies attempting to define neural mechanisms supporting sensory-motor behavior. A neuronal tuning function defines the functional relation between the spiking activity and uni- or multivariate explanatory variables. Virtually every sensory system, from the vertebrate visual cortex to wind-detecting neurons in the cricket cercal system, has been char-acterized in this way (Rieke et al., 1997; Dayan and Abbott, 2001).
One common approach to determine the dependence of neu-rons on these variables is regression analysis, in which the spike density function is approximated by one or multiple explanatory variables using linear or other models (Ilg et al., 2004; Ono et al., 2004; Wu et al., 2006). It remains questionable, however, what model assumptions can be made when analyzing neuronal data.
Another difficulty in the analysis of neuronal data is the accu-rate estimation of latencies between any given variable and associ-ated neuronal activity (Seal et al., 1983; Friedman and Priebe, 1998; Bollimunta et al., 2007). For example, when visual information arrives in cortical area MSTd, which is the dorsal part of the medial superior temporal cortex, it has passed a number of processing stages resulting in a considerable delay with respect to the stimu-lus. Depending on the properties of the visual input, retinal delay alone accounts for a latency of up to 50 ms (Schmolesky et al., 1998). On the way through thalamus and primary visual areas, the signal propagates with a velocity on the order of 10–100 m/s. Additionally, synaptic transmission produces delays of several mil-liseconds. Therefore, a proper model of this system has to account for the fact that neuronal activity is a delayed function of the input variables.
An information-theoretic approach for evaluating probabilistic tuning functions of single neurons
Lukas Brostek1,2*, Thomas Eggert3, Seiji Ono4, Michael J. Mustari 4, Ulrich Büttner 2,5 and Stefan Glasauer1,2,5
1 Clinical Neurosciences, Ludwig-Maximilians-Universität München, Munich, Germany2 Bernstein Center for Computational Neuroscience, Munich, Germany3 Department of Neurology, Ludwig-Maximilians-Universität München, Munich, Germany4 Washington National Primate Research Center, University of Washington, Seattle, WA, USA5 Integrated Center for Research and Treatment of Vertigo, Ludwig-Maximilians-Universität München, Munich, Germany
Neuronal tuning functions can be expressed by the conditional probability of observing a spike given any combination of explanatory variables. However, accurately determining such probabilistic tuning functions from experimental data poses several challenges such as finding the right combination of explanatory variables and determining their proper neuronal latencies. Here we present a novel approach of estimating and evaluating such probabilistic tuning functions, which offers a solution for these problems. By maximizing the mutual information between the probability distributions of spike occurrence and the variables, their neuronal latency can be estimated, and the dependence of neuronal activity on different combinations of variables can be measured. This method was used to analyze neuronal activity in cortical area MSTd in terms of dependence on signals related to eye and retinal image movement. Comparison with conventional feature detection and regression analysis techniques shows that our method offers distinct advantages, if the dependence does not match the regression model.
Keywords: information theory, mutual information, neuronal tuning, neuronal latency, MSTd
Edited by:Karen A. Moxon, Drexel University, USA
Reviewed by:Karim Oweiss, Michigan State University, USAAlessandro Scaglione, Drexel University, USA
*Correspondence:Lukas Brostek, Department of Neurology, Ludwig-Maximilians-Universität München, Marchioninistraße 23, 81377 Munich, Germany. e-mail: [email protected]
Frontiers in Computational Neuroscience www.frontiersin.org March 2011 | Volume 5 | Article 15 | 1
associated probability mass function pV(v). Then, p
S|V (s|v) expresses
the conditional probability of observing a spike given any combina-tion of variable values. By multiplying with the sampling rate, this probability translates directly into an expectation value of the rate of spiking activity, and therefore describes a neuronal tuning func-tion. Using Bayes’ theorem, p
S|V (s|v) can be expressed as the quotient
of the joint probability mass function pV,S
(v,s) divided by pV(v):
p s vp v s
p vS VV S
V
|,( | )
( , )
( ).=
The normalization on pV(v) allows the estimation of the tuning
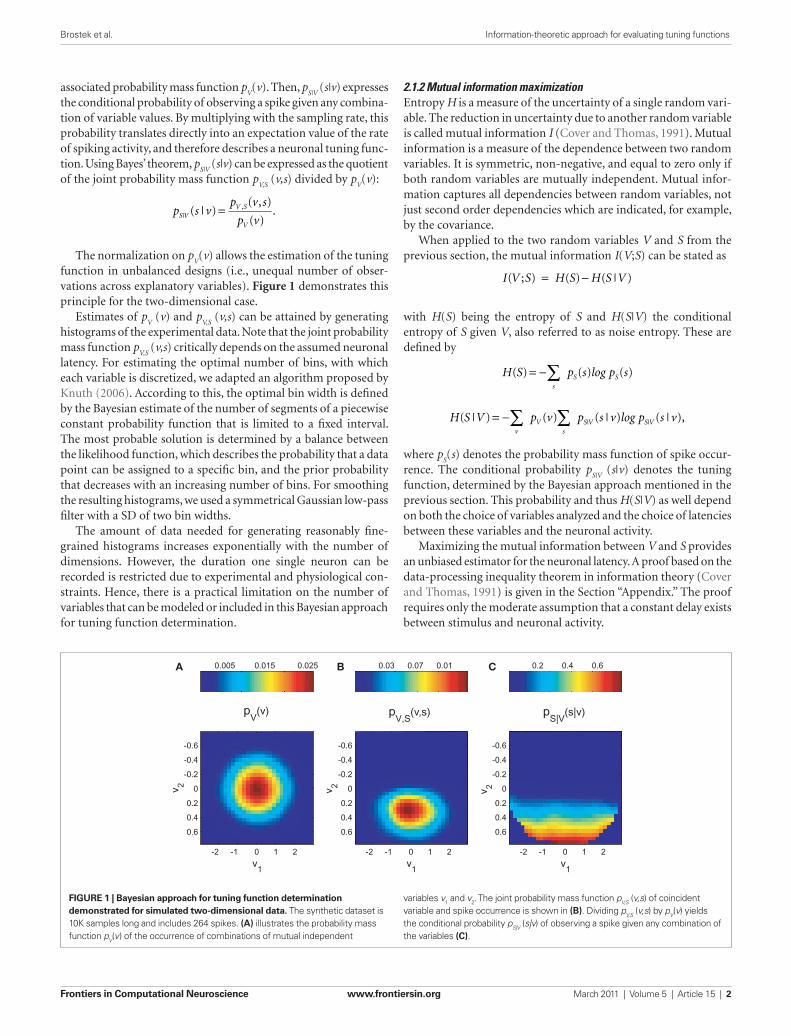
function in unbalanced designs (i.e., unequal number of obser-vations across explanatory variables). Figure 1 demonstrates this principle for the two-dimensional case.
Estimates of pV (v) and p
V,S (v,s) can be attained by generating
histograms of the experimental data. Note that the joint probability mass function p
V,S (v,s) critically depends on the assumed neuronal
latency. For estimating the optimal number of bins, with which each variable is discretized, we adapted an algorithm proposed by Knuth (2006). According to this, the optimal bin width is defined by the Bayesian estimate of the number of segments of a piecewise constant probability function that is limited to a fixed interval. The most probable solution is determined by a balance between the likelihood function, which describes the probability that a data point can be assigned to a specific bin, and the prior probability that decreases with an increasing number of bins. For smoothing the resulting histograms, we used a symmetrical Gaussian low-pass filter with a SD of two bin widths.
The amount of data needed for generating reasonably fine-grained histograms increases exponentially with the number of dimensions. However, the duration one single neuron can be recorded is restricted due to experimental and physiological con-straints. Hence, there is a practical limitation on the number of variables that can be modeled or included in this Bayesian approach for tuning function determination.
2.1.2 Mutual information maximizationEntropy H is a measure of the uncertainty of a single random vari-able. The reduction in uncertainty due to another random variable is called mutual information I (Cover and Thomas, 1991). Mutual information is a measure of the dependence between two random variables. It is symmetric, non-negative, and equal to zero only if both random variables are mutually independent. Mutual infor-mation captures all dependencies between random variables, not just second order dependencies which are indicated, for example, by the covariance.
When applied to the two random variables V and S from the previous section, the mutual information I(V;S) can be stated as
I V S H S H S V( ; ) ( ) ( | ) = −
with H(S) being the entropy of S and H(S|V) the conditional entropy of S given V, also referred to as noise entropy. These are defined by
H S p s log p ss
S S( ) ( ) ( )= −∑
H S V p v p s v log p s vv
Vs
S V S V( | ) ( ) ( | ) ( | ),| |= −∑ ∑
where pS(s) denotes the probability mass function of spike occur-
rence. The conditional probability pS|V
(s|v) denotes the tuning function, determined by the Bayesian approach mentioned in the previous section. This probability and thus H(S|V) as well depend on both the choice of variables analyzed and the choice of latencies between these variables and the neuronal activity.
Maximizing the mutual information between V and S provides an unbiased estimator for the neuronal latency. A proof based on the data-processing inequality theorem in information theory (Cover and Thomas, 1991) is given in the Section “Appendix.” The proof requires only the moderate assumption that a constant delay exists between stimulus and neuronal activity.
pV
(v)
v1
v 2
-2 -1 0 1 2
-0.6
-0.4
-0.2
0
0.2
0.4
0.6
v1
v 2
pV,S
(v,s)
-2 -1 0 1 2
-0.6
-0.4
-0.2
0
0.2
0.4
0.6
v1
v 2
pS|V
(s|v)
-2 -1 0 1 2
-0.6
-0.4
-0.2
0
0.2
0.4
0.6
0.005 0.015 0.025 0.03 0.07 0.01 0.2 0.4 0.6A CB
Figure 1 | Bayesian approach for tuning function determination demonstrated for simulated two-dimensional data. The synthetic dataset is 10K samples long and includes 264 spikes. (A) illustrates the probability mass function pV(v) of the occurrence of combinations of mutual independent
variables v1 and v2. The joint probability mass function pV,S (v,s) of coincident variable and spike occurrence is shown in (B). Dividing pV,S (v,s) by pV(v) yields the conditional probability pS|V (s|v) of observing a spike given any combination of the variables (C).
Brostek et al. Information-theoretic approach for evaluating tuning functions
Frontiers in Computational Neuroscience www.frontiersin.org March 2011 | Volume 5 | Article 15 | 2
For the simulation of neuronal activity, we used a Poisson proc-ess model as described in Rieke et al. (1997). The Poisson model is characterized by the statistical independence of events in disjoint time intervals. The probability distribution for k events in the time interval ∆ is
P kt
ke
kt
l
ll( )
( ( ))
!,( ( ))= −∆ ∆
where l(t) denotes the time-dependent firing rate. To simulate a neuron that resembles the two-dimensional tuning function p
S|V(s|v), l(t) was set to
l t t( ) ( | ( ), ( )) ,| ,t p s v t v t fS V V s= − − ⋅1 2 1 1 2 2
with sampling rate fs, and v
1(t) and v
2(t) being time shifted by the
estimated neuronal latencies t1 and t
2.
2.3 applicationThe data reported in this paper were recorded in cortical area MSTd from two behaving monkeys (Macaca mulatta, 5–7 kg). The experi-ments were performed at the Yerkes National Primate Research Center (Atlanta, GA, USA) in compliance with National Institutes of Health Guide for the Care and Use of Laboratory Animals and protocols were reviewed and approved by the Institutional Animal Care and Use Committee at Emory University. For verifying MSTd location we used functional, histological, and MRI criteria. During the experiments monkeys were seated in a primate chair with their head fixed in the horizontal stereotaxic plane in a completely dark room. Only those neurons that showed significant response to moving visual stimuli were analyzed. Visual receptive fields of neurons were mapped by moving a probe stimulus at regularly spaced eccentricities across the visual field. Most receptive fields were large (>30°) and had their center in the contralateral hemi-field in accordance with known MSTd properties. Experimental procedures are explained in detail in Ono et al. (2010).
2.3.1 Visual stimuliVisual large field (LF) stimuli (35° × 35° random dot patterns) were rear projected on a tangent screen. Data were acquired only for those movement directions that were previously identified to be the pre-ferred direction of the neuron, i.e., the direction which elicits maxi-mal spiking activity for a moving LF stimulus in the analyzed neuron.
For each neuron two kinds of paradigms were tested:
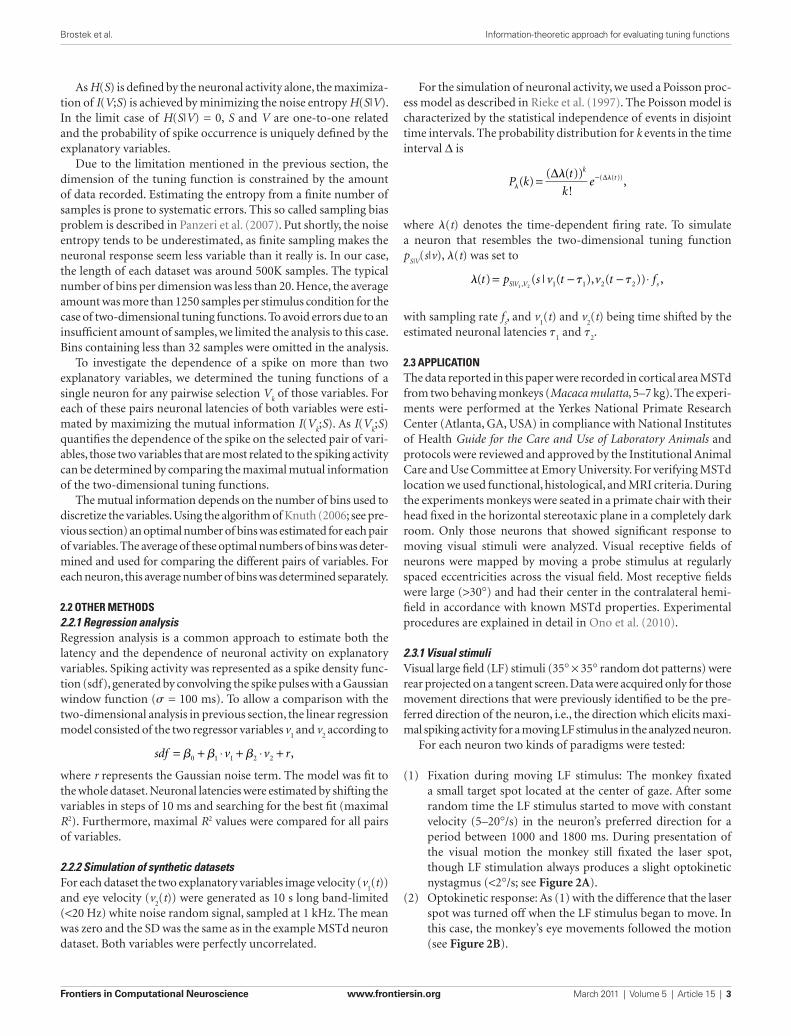
(1) Fixation during moving LF stimulus: The monkey fixated a small target spot located at the center of gaze. After some random time the LF stimulus started to move with constant velocity (5–20°/s) in the neuron’s preferred direction for a period between 1000 and 1800 ms. During presentation of the visual motion the monkey still fixated the laser spot, though LF stimulation always produces a slight optokinetic nystagmus (<2°/s; see Figure 2A).
(2) Optokinetic response: As (1) with the difference that the laser spot was turned off when the LF stimulus began to move. In this case, the monkey’s eye movements followed the motion (see Figure 2B).
As H(S) is defined by the neuronal activity alone, the maximiza-tion of I(V;S) is achieved by minimizing the noise entropy H(S|V). In the limit case of H(S|V) = 0, S and V are one-to-one related and the probability of spike occurrence is uniquely defined by the explanatory variables.
Due to the limitation mentioned in the previous section, the dimension of the tuning function is constrained by the amount of data recorded. Estimating the entropy from a finite number of samples is prone to systematic errors. This so called sampling bias problem is described in Panzeri et al. (2007). Put shortly, the noise entropy tends to be underestimated, as finite sampling makes the neuronal response seem less variable than it really is. In our case, the length of each dataset was around 500K samples. The typical number of bins per dimension was less than 20. Hence, the average amount was more than 1250 samples per stimulus condition for the case of two-dimensional tuning functions. To avoid errors due to an insufficient amount of samples, we limited the analysis to this case. Bins containing less than 32 samples were omitted in the analysis.
To investigate the dependence of a spike on more than two explanatory variables, we determined the tuning functions of a single neuron for any pairwise selection V
k of those variables. For
each of these pairs neuronal latencies of both variables were esti-mated by maximizing the mutual information I(V
k;S). As I(V
k;S)
quantifies the dependence of the spike on the selected pair of vari-ables, those two variables that are most related to the spiking activity can be determined by comparing the maximal mutual information of the two-dimensional tuning functions.
The mutual information depends on the number of bins used to discretize the variables. Using the algorithm of Knuth (2006; see pre-vious section) an optimal number of bins was estimated for each pair of variables. The average of these optimal numbers of bins was deter-mined and used for comparing the different pairs of variables. For each neuron, this average number of bins was determined separately.
2.2 other Methods2.2.1 Regression analysisRegression analysis is a common approach to estimate both the latency and the dependence of neuronal activity on explanatory variables. Spiking activity was represented as a spike density func-tion (sdf), generated by convolving the spike pulses with a Gaussian window function (s = 100 ms). To allow a comparison with the two-dimensional analysis in previous section, the linear regression model consisted of the two regressor variables v
1 and v
2 according to
sdf v v r= + ⋅ + ⋅ +b b b0 1 1 2 2 ,
where r represents the Gaussian noise term. The model was fit to the whole dataset. Neuronal latencies were estimated by shifting the variables in steps of 10 ms and searching for the best fit (maximal R2). Furthermore, maximal R2 values were compared for all pairs of variables.
2.2.2 Simulation of synthetic datasetsFor each dataset the two explanatory variables image velocity (v
1(t))
and eye velocity (v2(t)) were generated as 10 s long band-limited
(<20 Hz) white noise random signal, sampled at 1 kHz. The mean was zero and the SD was the same as in the example MSTd neuron dataset. Both variables were perfectly uncorrelated.
Brostek et al. Information-theoretic approach for evaluating tuning functions
Frontiers in Computational Neuroscience www.frontiersin.org March 2011 | Volume 5 | Article 15 | 3
datasets using both the information-based method and regression analysis. Finally, we end this section with the population results for 49 MSTd neurons.
3.1 analysis of an exaMple Mstd neuronWe begin with the detailed analysis of an example neuron. The 763 s long dataset contained 19452 detected spikes. The explanatory variables were slightly correlated, with a maximal Pearson corre-lation coefficient of 0.23 for the pair of variables (image velocity and eye position).
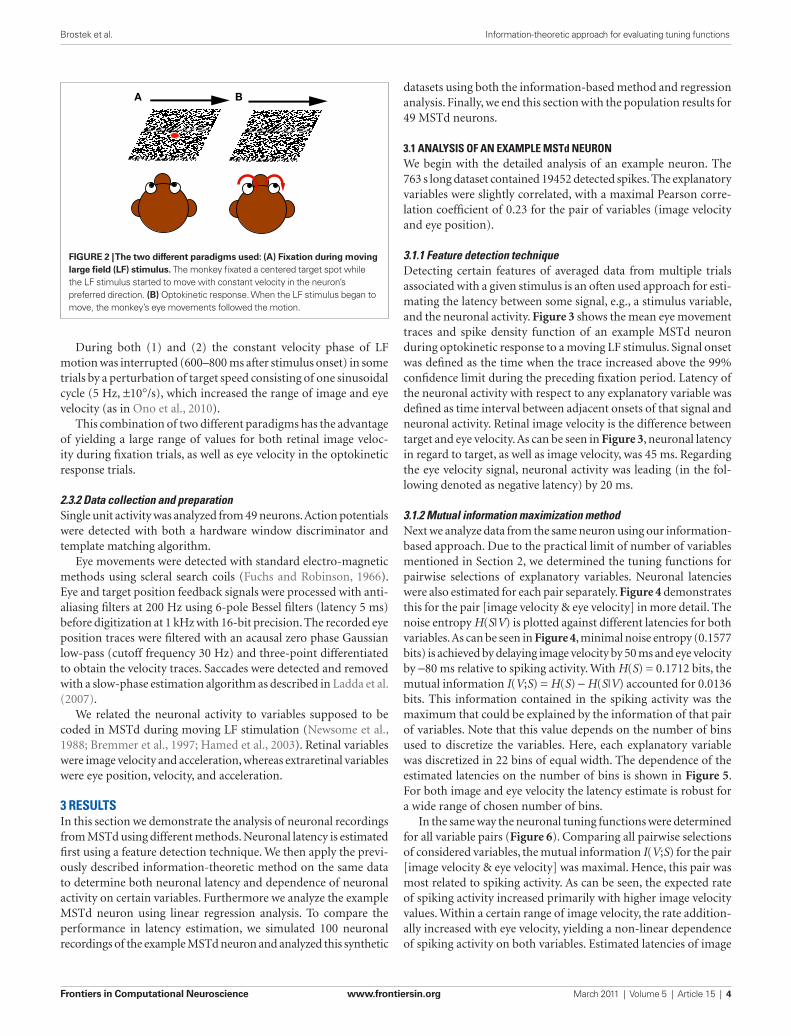
3.1.1 Feature detection techniqueDetecting certain features of averaged data from multiple trials associated with a given stimulus is an often used approach for esti-mating the latency between some signal, e.g., a stimulus variable, and the neuronal activity. Figure 3 shows the mean eye movement traces and spike density function of an example MSTd neuron during optokinetic response to a moving LF stimulus. Signal onset was defined as the time when the trace increased above the 99% confidence limit during the preceding fixation period. Latency of the neuronal activity with respect to any explanatory variable was defined as time interval between adjacent onsets of that signal and neuronal activity. Retinal image velocity is the difference between target and eye velocity. As can be seen in Figure 3, neuronal latency in regard to target, as well as image velocity, was 45 ms. Regarding the eye velocity signal, neuronal activity was leading (in the fol-lowing denoted as negative latency) by 20 ms.
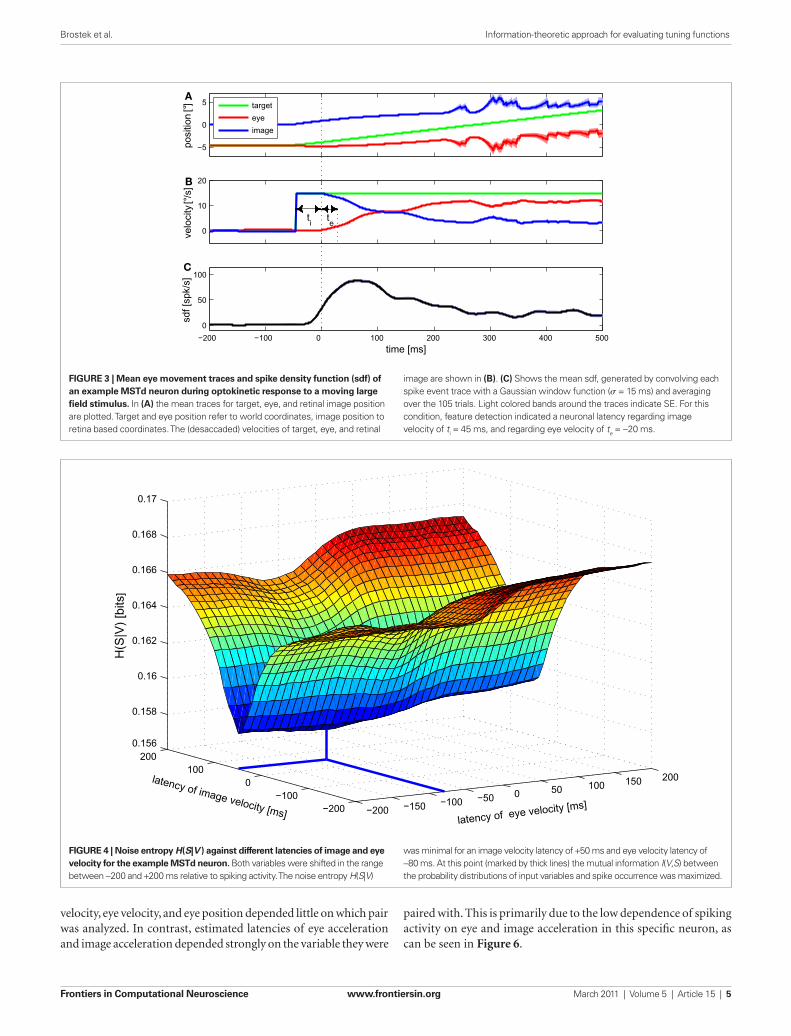
3.1.2 Mutual information maximization methodNext we analyze data from the same neuron using our information-based approach. Due to the practical limit of number of variables mentioned in Section 2, we determined the tuning functions for pairwise selections of explanatory variables. Neuronal latencies were also estimated for each pair separately. Figure 4 demonstrates this for the pair [image velocity & eye velocity] in more detail. The noise entropy H(S|V) is plotted against different latencies for both variables. As can be seen in Figure 4, minimal noise entropy (0.1577 bits) is achieved by delaying image velocity by 50 ms and eye velocity by −80 ms relative to spiking activity. With H(S) = 0.1712 bits, the mutual information I(V;S) = H(S) − H(S|V) accounted for 0.0136 bits. This information contained in the spiking activity was the maximum that could be explained by the information of that pair of variables. Note that this value depends on the number of bins used to discretize the variables. Here, each explanatory variable was discretized in 22 bins of equal width. The dependence of the estimated latencies on the number of bins is shown in Figure 5. For both image and eye velocity the latency estimate is robust for a wide range of chosen number of bins.
In the same way the neuronal tuning functions were determined for all variable pairs (Figure 6). Comparing all pairwise selections of considered variables, the mutual information I(V;S) for the pair [image velocity & eye velocity] was maximal. Hence, this pair was most related to spiking activity. As can be seen, the expected rate of spiking activity increased primarily with higher image velocity values. Within a certain range of image velocity, the rate addition-ally increased with eye velocity, yielding a non-linear dependence of spiking activity on both variables. Estimated latencies of image
During both (1) and (2) the constant velocity phase of LF motion was interrupted (600–800 ms after stimulus onset) in some trials by a perturbation of target speed consisting of one sinusoidal cycle (5 Hz, ±10°/s), which increased the range of image and eye velocity (as in Ono et al., 2010).
This combination of two different paradigms has the advantage of yielding a large range of values for both retinal image veloc-ity during fixation trials, as well as eye velocity in the optokinetic response trials.
2.3.2 Data collection and preparationSingle unit activity was analyzed from 49 neurons. Action potentials were detected with both a hardware window discriminator and template matching algorithm.
Eye movements were detected with standard electro-magnetic methods using scleral search coils (Fuchs and Robinson, 1966). Eye and target position feedback signals were processed with anti-aliasing filters at 200 Hz using 6-pole Bessel filters (latency 5 ms) before digitization at 1 kHz with 16-bit precision. The recorded eye position traces were filtered with an acausal zero phase Gaussian low-pass (cutoff frequency 30 Hz) and three-point differentiated to obtain the velocity traces. Saccades were detected and removed with a slow-phase estimation algorithm as described in Ladda et al. (2007).
We related the neuronal activity to variables supposed to be coded in MSTd during moving LF stimulation (Newsome et al., 1988; Bremmer et al., 1997; Hamed et al., 2003). Retinal variables were image velocity and acceleration, whereas extraretinal variables were eye position, velocity, and acceleration.
3 resultsIn this section we demonstrate the analysis of neuronal recordings from MSTd using different methods. Neuronal latency is estimated first using a feature detection technique. We then apply the previ-ously described information-theoretic method on the same data to determine both neuronal latency and dependence of neuronal activity on certain variables. Furthermore we analyze the example MSTd neuron using linear regression analysis. To compare the performance in latency estimation, we simulated 100 neuronal recordings of the example MSTd neuron and analyzed this synthetic
A B
Figure 2 | The two different paradigms used: (A) Fixation during moving large field (LF) stimulus. The monkey fixated a centered target spot while the LF stimulus started to move with constant velocity in the neuron’s preferred direction. (B) Optokinetic response. When the LF stimulus began to move, the monkey’s eye movements followed the motion.
Brostek et al. Information-theoretic approach for evaluating tuning functions
Frontiers in Computational Neuroscience www.frontiersin.org March 2011 | Volume 5 | Article 15 | 4
paired with. This is primarily due to the low dependence of spiking activity on eye and image acceleration in this specific neuron, as can be seen in Figure 6.
velocity, eye velocity, and eye position depended little on which pair was analyzed. In contrast, estimated latencies of eye acceleration and image acceleration depended strongly on the variable they were
−5
0
5
posi
tion
[°]
0
10
20ve
loci
ty [°
/s]
target
eye
image
−200 −100 0 100 200 300 400 500
0
50
100
time [ms]
sdf [
spk/
s]
A
B
C
ti
te
Figure 3 | Mean eye movement traces and spike density function (sdf) of an example MSTd neuron during optokinetic response to a moving large field stimulus. In (A) the mean traces for target, eye, and retinal image position are plotted. Target and eye position refer to world coordinates, image position to retina based coordinates. The (desaccaded) velocities of target, eye, and retinal
image are shown in (B). (C) Shows the mean sdf, generated by convolving each spike event trace with a Gaussian window function (s = 15 ms) and averaging over the 105 trials. Light colored bands around the traces indicate SE. For this condition, feature detection indicated a neuronal latency regarding image velocity of ti = 45 ms, and regarding eye velocity of te = −20 ms.
−200 −150 −100 −50 0 50 100 150 200
−200−100
0100
2000.156
0.158
0.16
0.162
0.164
0.166
0.168
0.17
latency of eye velocity [ms]
latency of image velocity [ms]
H(S
|V)
[bits
]
Figure 4 | Noise entropy H(S|V ) against different latencies of image and eye velocity for the example MSTd neuron. Both variables were shifted in the range between −200 and +200 ms relative to spiking activity. The noise entropy H(S|V)
was minimal for an image velocity latency of +50 ms and eye velocity latency of −80 ms. At this point (marked by thick lines) the mutual information I(V,S) between the probability distributions of input variables and spike occurrence was maximized.
Brostek et al. Information-theoretic approach for evaluating tuning functions
Frontiers in Computational Neuroscience www.frontiersin.org March 2011 | Volume 5 | Article 15 | 5
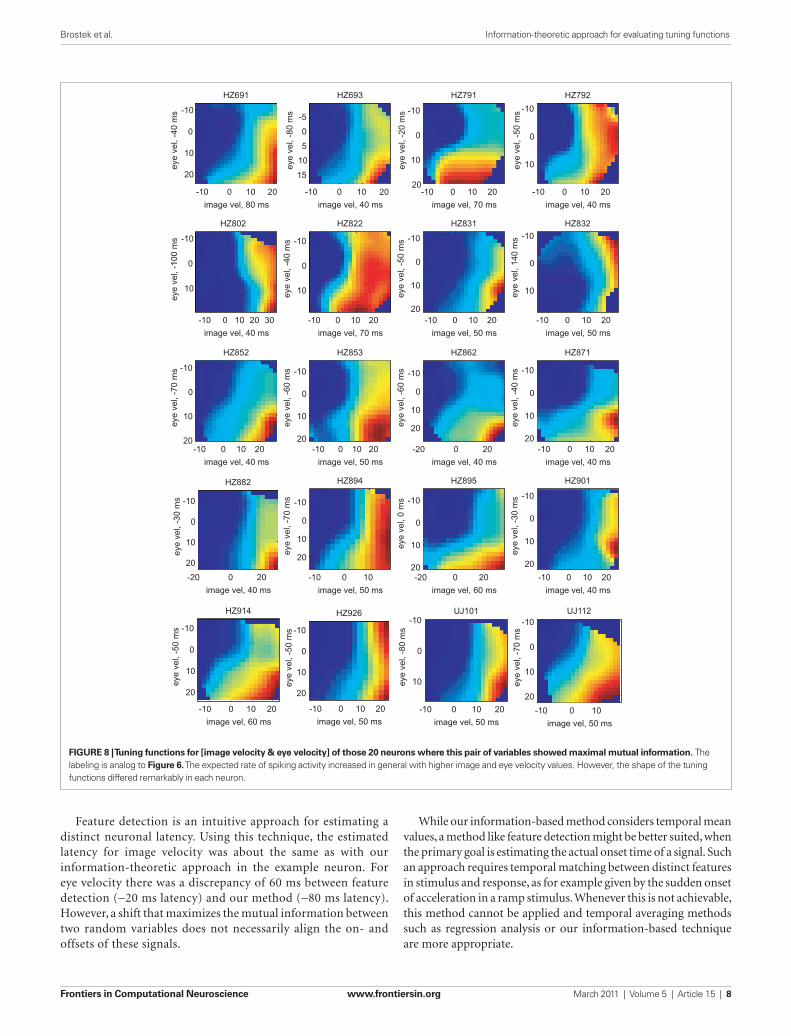
20 (41%), 15 (30%), 13 (27%), and 1 (2%) neurons, respectively. The tuning functions of those 20 neurons in which [image velocity & eye velocity] showed maximum I(V;S) are illustrated in Figure 8. The tuning to these variables was highly non-linear and differed across the neurons.
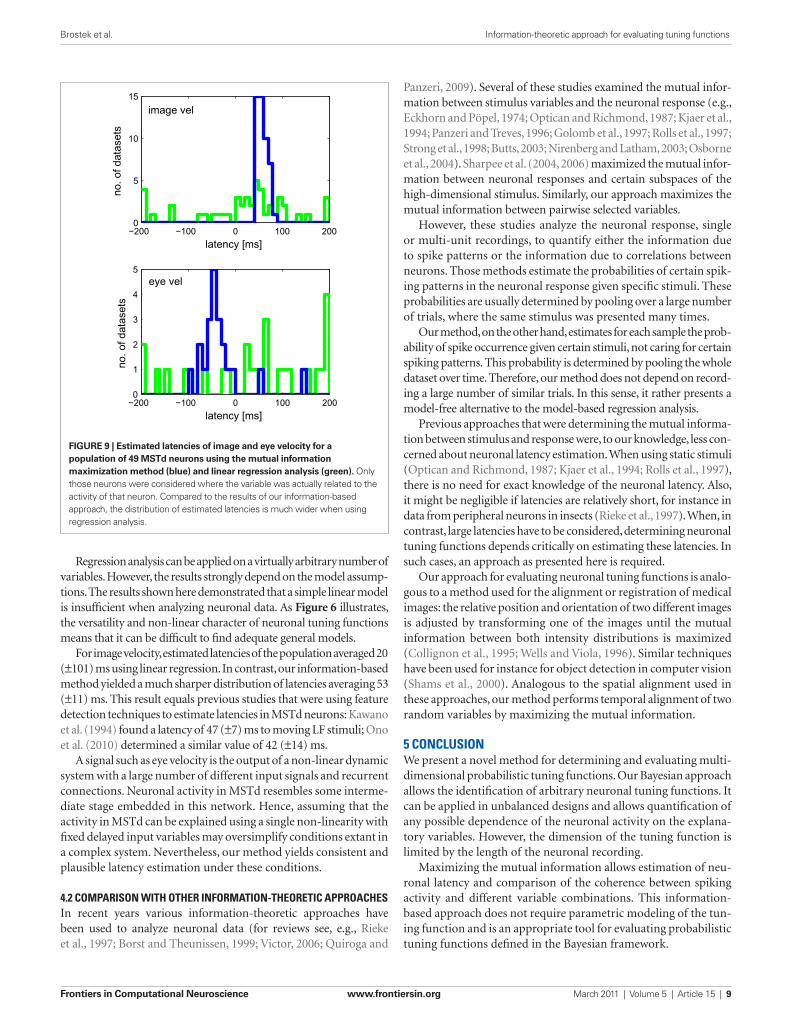
Figure 9 shows the estimated latencies of the variables image velocity and eye velocity. To ensure that for each variable only those neurons were selected, in which this variable was actually related to the activity of that neuron, only those cells were considered that belonged to the pair that showed maximum I(V;S). Each histogram contains the latencies of the neurons for which the corresponding variable belonged to this optimal combination. For instance, image velocity was one of the optimal pair in 20 + 15 + 13 = 48 neurons. Average estimated latencies for image velocity, and eye velocity were 52.5, and −37.1 ms, respectively. For image velocity the SD within the population was very small (11.2 ms). For eye velocity it was larger (50.6 ms).
3.3.2 Regression analysisFor comparison with our previous results we show the results for linear regression analysis of the same MSTd population data.
The pairs of variables [image velocity & eye velocity], [image velocity & eye position], [image velocity & eye acceleration], and [eye velocity & eye position] showed maximal R2 in 23 (47%), 14 (29%), 9 (18%), and 3 (6%) neurons, respectively. Therefore, both approaches, information maximization, and linear regression, agreed in concluding that a combination of an image velocity and an eye movement variable is most related to spiking activity in MSTd.
Figure 9 shows the results of latency estimation, using an analo-gous selection criterion as previous section. Instead of maximal I(V;S), those combinations were selected that showed maximum R2 of all combinations. For both variables image and eye velocity the SD was much larger in the regression estimates than with the information-based approach.
4 discussionWe showed that our novel information-theoretic approach is capable of estimating and evaluating probabilistic neuronal tun-ing functions. By maximizing the mutual information between the probability distributions of spike occurrence and the variables, their neuronal latency can be estimated and the dependence of neuronal activity on different combinations of variables can be measured. In the following we discuss the various techniques for neuronal latency estimation. Finally, we compare our method with other information-theoretic approaches for analyzing neuronal data.
4.1 estiMation of neuronal latencyNumerous methods for estimating the latency of spiking activity relative to some variable on a trial-by-trial basis have been pub-lished (e.g., Seal et al., 1983; Friedman and Priebe, 1998; Bollimunta et al., 2007). Because the latency can vary for each trial, such detailed analysis is often necessary and might yield better results than the feature detection technique based on averaging as used here. Nonetheless, averaging techniques are widely used in the neuro-physiological literature, and many applications, for instance tuning function determination as presented here, require the estimation of a distinct latency for each neuron.
3.1.3 Regression analysisAnalogous to the result of the information-based approach, lin-ear regression analysis determined the pair [image velocity & eye velocity] as being most related to spiking activity (R2=0.40). The estimated neuronal latencies, however, differed from the previous results. The best fit was obtained for delaying image velocity by 70 ms and eye velocity by 170 ms.
3.2 analysis of synthetic datasetsTo further compare the performances of latency estimation for both the information-based and the regression approach, we simulated 100 neuronal recordings based on the non-linear tuning function for [image velocity & eye velocity] of the example MSTd neuron (details are explained in Section 2.2.2). This allowed the a priori definition of the neuronal latency, which was set to the previously estimated values of 50 and −80 ms, respectively.
Results for both approaches are shown in Figure 7. Linear regres-sion analysis was not able to correctly estimate the latencies of 50 and −80 ms. The broad distributions of estimates around 67 (±68) and −61 (±110) ms for image and eye velocity, respectively, demonstrate that a linear model is insufficient for analyzing this example neuron. The information-based approach, on the other hand, was capable of estimating the proper latencies for both variables in all datasets.
3.3 Mstd population resultsWe applied our information-theoretic approach to 49 cells recorded in area MSTd. The mean recording length per neuron was about 500 s, with an average spike count of approximately 18K. The explanatory variables were slightly correlated. The combination [image velocity & eye velocity] for instance exhibited an average Pearson correlation coefficient of −0.23 ± 0.11.
3.3.1 Mutual information maximization methodThe pairs of variables [image velocity & eye velocity], [image veloc-ity & eye position], [image velocity & eye acceleration], and [eye velocity & eye position] showed maximal mutual information in
0 20 40 60 80−200
−150
−100
−50
0
50
100
150
200
number of bins
late
ncy
[ms]
image veleye vel
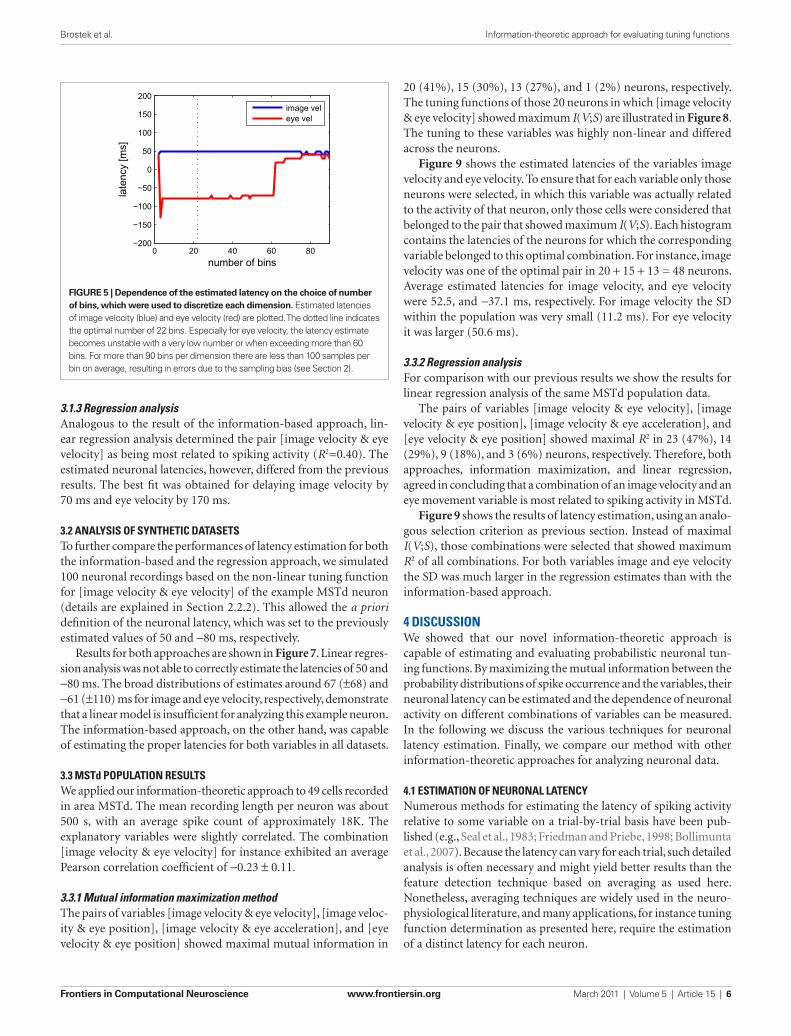
Figure 5 | Dependence of the estimated latency on the choice of number of bins, which were used to discretize each dimension. Estimated latencies of image velocity (blue) and eye velocity (red) are plotted. The dotted line indicates the optimal number of 22 bins. Especially for eye velocity, the latency estimate becomes unstable with a very low number or when exceeding more than 60 bins. For more than 90 bins per dimension there are less than 100 samples per bin on average, resulting in errors due to the sampling bias (see Section 2).
Brostek et al. Information-theoretic approach for evaluating tuning functions
Frontiers in Computational Neuroscience www.frontiersin.org March 2011 | Volume 5 | Article 15 | 6
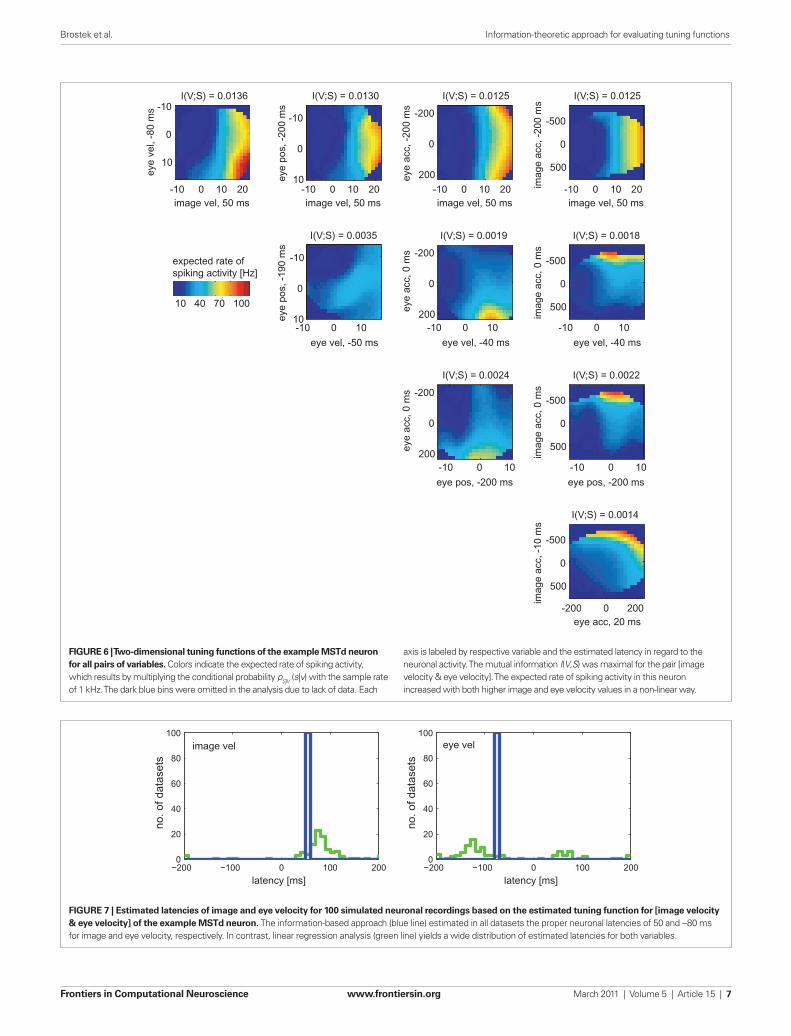
image vel, 50 ms
eye
vel,
-80
ms
I(V;S) = 0.0136
-10 0 10 20
-10
0
10
image vel, 50 ms
eye
pos,
-20
0 m
s
I(V;S) = 0.0130
-10 0 10 20
-10
0
10
image vel, 50 ms
eye
acc,
-20
0 m
s
I(V;S) = 0.0125
-10 0 10 20
-200
0
200
image vel, 50 ms
imag
e ac
c, -
200
ms
I(V;S) = 0.0125
-10 0 10 20
-500
0
500
eye vel, -50 ms
eye
pos,
-19
0 m
s
I(V;S) = 0.0035
-10 0 10
-10
0
10
eye vel, -40 ms
eye
acc,
0 m
s
I(V;S) = 0.0019
-10 0 10
-200
0
200
eye vel, -40 ms
imag
e ac
c, 0
ms
I(V;S) = 0.0018
-10 0 10
-500
0
500
eye pos, -200 ms
eye
acc,
0 m
s
I(V;S) = 0.0024
-10 0 10
-200
0
200
eye pos, -200 ms
imag
e ac
c, 0
ms
I(V;S) = 0.0022
-10 0 10
-500
0
500
eye acc, 20 ms
imag
e ac
c, -
10 m
s
I(V;S) = 0.0014
-200 0 200
-500
0
500
10 40 70 100
expected rate ofspiking activity [Hz]
Figure 6 | Two-dimensional tuning functions of the example MSTd neuron for all pairs of variables. Colors indicate the expected rate of spiking activity, which results by multiplying the conditional probability pS|V (s|v) with the sample rate of 1 kHz. The dark blue bins were omitted in the analysis due to lack of data. Each
axis is labeled by respective variable and the estimated latency in regard to the neuronal activity. The mutual information I(V,S) was maximal for the pair [image velocity & eye velocity]. The expected rate of spiking activity in this neuron increased with both higher image and eye velocity values in a non-linear way.
−200 −100 0 100 2000
20
40
60
80
100
latency [ms]
no. o
f dat
aset
s
image vel
−200 −100 0 100 2000
20
40
60
80
100
latency [ms]
no. o
f dat
aset
s
eye vel
Figure 7 | estimated latencies of image and eye velocity for 100 simulated neuronal recordings based on the estimated tuning function for [image velocity & eye velocity] of the example MSTd neuron. The information-based approach (blue line) estimated in all datasets the proper neuronal latencies of 50 and −80 ms for image and eye velocity, respectively. In contrast, linear regression analysis (green line) yields a wide distribution of estimated latencies for both variables.
Brostek et al. Information-theoretic approach for evaluating tuning functions
Frontiers in Computational Neuroscience www.frontiersin.org March 2011 | Volume 5 | Article 15 | 7
While our information-based method considers temporal mean values, a method like feature detection might be better suited, when the primary goal is estimating the actual onset time of a signal. Such an approach requires temporal matching between distinct features in stimulus and response, as for example given by the sudden onset of acceleration in a ramp stimulus. Whenever this is not achievable, this method cannot be applied and temporal averaging methods such as regression analysis or our information-based technique are more appropriate.
Feature detection is an intuitive approach for estimating a distinct neuronal latency. Using this technique, the estimated latency for image velocity was about the same as with our information-theoretic approach in the example neuron. For eye velocity there was a discrepancy of 60 ms between feature detection (−20 ms latency) and our method (−80 ms latency). However, a shift that maximizes the mutual information between two random variables does not necessarily align the on- and offsets of these signals.
image vel, 80 ms
eye
vel
, -40
ms
HZ691
-10 0 10 20
-10
0
10
20
image vel, 40 ms
eye
vel
, -80
ms
HZ693
-10 0 10 20
-5
0
5
10
15
image vel, 70 ms
eye
vel
, -20
ms
HZ791
-10 0 10 20
-10
0
10
20
image vel, 40 ms
eye
vel
, -50
ms
HZ792
-10 0 10 20
-10
0
10
image vel, 40 ms
eye
vel
, -10
0 m
s
HZ802
-10 0 10 20 30
-10
0
10
image vel, 70 ms
eye
vel
, -40
ms
HZ822
-10 0 10 20
-10
0
10
image vel, 50 ms
eye
vel
, -50
ms
HZ831
-10 0 10 20
-10
0
10
20
image vel, 50 ms
eye
vel
, 140
ms
HZ832
-10 0 10 20
-10
0
10
image vel, 40 ms
eye
vel
, -70
ms
HZ852
-10 0 10 20
-10
0
10
20
image vel, 50 ms
eye
vel
, -60
ms
HZ853
-10 0 10 20
-10
0
10
20
image vel, 40 ms
eye
vel
, -60
ms
HZ862
-20 0 20
-10
0
10
20
image vel, 40 ms
eye
vel
, -40
ms
HZ871
-10 0 10 20
-10
0
10
20
image vel, 40 ms
eye
vel
, -30
ms
HZ882
-20 0 20
-10
0
10
20
image vel, 50 ms
eye
vel
, -70
ms
HZ894
-10 0 10
-10
0
10
20
image vel, 60 ms
eye
vel
, 0 m
s
HZ895
-20 0 20
-10
0
10
20
image vel, 40 ms
eye
vel
, -30
ms
HZ901
-10 0 10 20
-10
0
10
20
image vel, 60 ms
eye
vel
, -50
ms
HZ914
-10 0 10 20
-10
0
10
20
image vel, 50 ms
eye
vel
, -50
ms
HZ926
-10 0 10 20
-10
0
10
20
image vel, 50 ms
eye
vel
, -80
ms
UJ101
-10 0 10 20
-10
0
10
image vel, 50 ms
eye
vel
, -70
ms
UJ112
-10 0 10
-10
0
10
20
Figure 8 | Tuning functions for [image velocity & eye velocity] of those 20 neurons where this pair of variables showed maximal mutual information. The labeling is analog to Figure 6. The expected rate of spiking activity increased in general with higher image and eye velocity values. However, the shape of the tuning functions differed remarkably in each neuron.
Brostek et al. Information-theoretic approach for evaluating tuning functions
Frontiers in Computational Neuroscience www.frontiersin.org March 2011 | Volume 5 | Article 15 | 8
Panzeri, 2009). Several of these studies examined the mutual infor-mation between stimulus variables and the neuronal response (e.g., Eckhorn and Pöpel, 1974; Optican and Richmond, 1987; Kjaer et al., 1994; Panzeri and Treves, 1996; Golomb et al., 1997; Rolls et al., 1997; Strong et al., 1998; Butts, 2003; Nirenberg and Latham, 2003; Osborne et al., 2004). Sharpee et al. (2004, 2006) maximized the mutual infor-mation between neuronal responses and certain subspaces of the high-dimensional stimulus. Similarly, our approach maximizes the mutual information between pairwise selected variables.
However, these studies analyze the neuronal response, single or multi-unit recordings, to quantify either the information due to spike patterns or the information due to correlations between neurons. Those methods estimate the probabilities of certain spik-ing patterns in the neuronal response given specific stimuli. These probabilities are usually determined by pooling over a large number of trials, where the same stimulus was presented many times.
Our method, on the other hand, estimates for each sample the prob-ability of spike occurrence given certain stimuli, not caring for certain spiking patterns. This probability is determined by pooling the whole dataset over time. Therefore, our method does not depend on record-ing a large number of similar trials. In this sense, it rather presents a model-free alternative to the model-based regression analysis.
Previous approaches that were determining the mutual informa-tion between stimulus and response were, to our knowledge, less con-cerned about neuronal latency estimation. When using static stimuli (Optican and Richmond, 1987; Kjaer et al., 1994; Rolls et al., 1997), there is no need for exact knowledge of the neuronal latency. Also, it might be negligible if latencies are relatively short, for instance in data from peripheral neurons in insects (Rieke et al., 1997). When, in contrast, large latencies have to be considered, determining neuronal tuning functions depends critically on estimating these latencies. In such cases, an approach as presented here is required.
Our approach for evaluating neuronal tuning functions is analo-gous to a method used for the alignment or registration of medical images: the relative position and orientation of two different images is adjusted by transforming one of the images until the mutual information between both intensity distributions is maximized (Collignon et al., 1995; Wells and Viola, 1996). Similar techniques have been used for instance for object detection in computer vision (Shams et al., 2000). Analogous to the spatial alignment used in these approaches, our method performs temporal alignment of two random variables by maximizing the mutual information.
5 conclusionWe present a novel method for determining and evaluating multi-dimensional probabilistic tuning functions. Our Bayesian approach allows the identification of arbitrary neuronal tuning functions. It can be applied in unbalanced designs and allows quantification of any possible dependence of the neuronal activity on the explana-tory variables. However, the dimension of the tuning function is limited by the length of the neuronal recording.
Maximizing the mutual information allows estimation of neu-ronal latency and comparison of the coherence between spiking activity and different variable combinations. This information-based approach does not require parametric modeling of the tun-ing function and is an appropriate tool for evaluating probabilistic tuning functions defined in the Bayesian framework.
Regression analysis can be applied on a virtually arbitrary number of variables. However, the results strongly depend on the model assump-tions. The results shown here demonstrated that a simple linear model is insufficient when analyzing neuronal data. As Figure 6 illustrates, the versatility and non-linear character of neuronal tuning functions means that it can be difficult to find adequate general models.
For image velocity, estimated latencies of the population averaged 20 (±101) ms using linear regression. In contrast, our information-based method yielded a much sharper distribution of latencies averaging 53 (±11) ms. This result equals previous studies that were using feature detection techniques to estimate latencies in MSTd neurons: Kawano et al. (1994) found a latency of 47 (±7) ms to moving LF stimuli; Ono et al. (2010) determined a similar value of 42 (±14) ms.
A signal such as eye velocity is the output of a non-linear dynamic system with a large number of different input signals and recurrent connections. Neuronal activity in MSTd resembles some interme-diate stage embedded in this network. Hence, assuming that the activity in MSTd can be explained using a single non-linearity with fixed delayed input variables may oversimplify conditions extant in a complex system. Nevertheless, our method yields consistent and plausible latency estimation under these conditions.
4.2 coMparison with other inforMation-theoretic approachesIn recent years various information-theoretic approaches have been used to analyze neuronal data (for reviews see, e.g., Rieke et al., 1997; Borst and Theunissen, 1999; Victor, 2006; Quiroga and
−200 −100 0 100 2000
5
10
15
latency [ms]
no. o
f dat
aset
simage vel
−200 −100 0 100 2000
1
2
3
4
5
latency [ms]
no. o
f dat
aset
s
eye vel
Figure 9 | estimated latencies of image and eye velocity for a population of 49 MSTd neurons using the mutual information maximization method (blue) and linear regression analysis (green). Only those neurons were considered where the variable was actually related to the activity of that neuron. Compared to the results of our information-based approach, the distribution of estimated latencies is much wider when using regression analysis.
Brostek et al. Information-theoretic approach for evaluating tuning functions
Frontiers in Computational Neuroscience www.frontiersin.org March 2011 | Volume 5 | Article 15 | 9
individual response properties to the same variables. For this reason, the model-free approach proposed here is particularly suitable for this analysis.
acknowledgMentsThis work was supported by the German Federal Ministry of Education and Research Grants 01 GQ 0448, 01 EO 0901, and National Institutes of Health Grants EY013308, RR000166.
Model-based approaches like regression analysis critically depend on the validity of model assumptions. As demonstrated here, simple approaches, such as the linear model evaluated above, are often insufficient for analyzing neuronal data.
By applying this novel technique to data from MSTd neurons, we show that they are tuned for non-linear combinations of reti-nal image and eye movement signals. Though latencies are quite consistent across neurons, single neurons differ remarkably in their
natural signals: maximally informa-tive dimensions. Neural Comput. 16, 223–250.
Sharpee, T. O., Sugihara, H., Kurgansky, A. V., Rebrik, S. P., Stryker, M. P., and Miller, K. D. (2006). Adaptive filtering enhances information transmission in visual cortex. Nature 439, 936–942.
Strong, S. P., Koberle, R., de Ruyter van Steveninck, R. R., and Bialek, W. (1998). Entropy and information in neural spike trains. Phys. Rev. Lett. 80, 197–200.
Victor, J. D. (2006). Approaches to infor-mation-theoretic analysis of neural activity. Biol. Theory 1, 302–316.
Wells, W. M., and Viola, P. (1996). Multi-modal volume registration by maxi-mization of mutual information. Med. Image Anal. 1, 35–51.
Wu, M. C.-K., David, S. V., and Gallant, J. L. (2006). Complete functional characterization of sensory neurons by system identification. Annu. Rev. Neurosci. 29, 477–505.
Conflict of Interest Statement: The authors declare that the research was con-ducted in the absence of any commercial or financial relationships that could be construed as a potential conflict of interest.
Received: 22 October 2010; accepted: 07 March 2011; published online: 30 March 2011.Citation: Brostek L, Eggert T, Ono S, Mustari MJ, Büttner U and Glasauer S (2011) An information-theoretic approach for evaluating probabilistic tuning functions of single neurons. Front. Comput. Neurosci. 5:15. doi: 10.3389/fncom.2011.00015Copyright © 2011 Brostek, Eggert, Ono, Mustari, Büttner and Glasauer. This is an open-access article subject to a non-exclusive license between the authors and Frontiers Media SA, which permits use, dis-tribution and reproduction in other forums, provided the original authors and source are credited and other Frontiers conditions are complied with.
dimensional patterns by single units in primate inferior temporal cortx. iii. Information theoretic analysis. J. Neurophysiol. 57, 162–178.
Osborne, L. C., Bialek, W., and Lisberger, S. G. (2004). Time course of information about motion direction in visual area MT of macaque monkeys. J. Neurosci. 24, 3210–3222.
Panzeri, S., Senatore, R., Montemurro, M. A., and Petersen, R. S. (2007). Correcting for the sampling bias prob-lem in spike train information meas-ures. J. Neurophysiol. 98, 1064–1072.
Panzeri, S., and Treves, A. (1996). Analytical estimates of limited sam-pling biases in different information measures. Network 7, 87–107.
Quiroga, R. Q., and Panzeri, S. (2009). Extracting information from neuro-nal populations: information theory and decoding approaches. Nat. Rev. Neurosci. 10, 173–185.
Rieke, F., Warland, D., de Ruyter van Steveninck, R., and Bialek, W. (1997). Spikes: Exploring the Neural Code. Cambridge, MA: MIT Press.
Rolls, E. T., Treves, A., Tovee, M. J., and Panzeri, S. (1997). Information in the neuronal representation of indi-vidual stimuli in the primate temporal visual cortex. J. Comput. Neurosci. 4, 309–333.
Schmolesky, M. T., Wang, Y., Hanes, D. P., Thompson, K. G., Leutgeb, S., Schall, J. D., and Leventhal, A. G. (1998). Signal timing across the macaque visual sys-tem. J. Neurophysiol. 79, 3272–3278.
Seal, J., Commenges, D., Salamon, R., and Bioulac, B. (1983). A statistical method for the estimation of neu-ronal response latency and its func-tional interpretation. Brain Res. 278, 382–386.
Shams, L. B., Brady, M. J., and Schaal, S. (2000). Graph matching vs mutual information maximization for object detection. Neural Netw. 14, 345–354.
Sharpee, T., Rust, N. C., and Bialek, W. (2004). Analyzing neural responses to
basis functions for the population encoding of heading direction. J. Neurophysiol. 90, 549–558.
Ilg, U. J., Schumann, S., and Thier, P. (2004). Posterior parietal cortex neurons encode target motion in world-centered coordinates. Neuron 43, 145–151.
Kawano, K., Shidara, M., Watanabe, Y., and Yamane, S. (1994). Neural activity in cortical area MST of alert monkey during ocular following responses. J. Neurophysiol. 71, 2305–2324.
Kjaer, T. W., Hertz, J. A., and Richmond, B. J. (1994). Decoding cortical neuronal signals: network models, informa-tion estimation and spatial tuning. J. Comput. Neurosci. 1, 109–139.
Knuth, K. H. (2006). Optimal Data-based Binning for Histograms. ArXiv Physics e-prints.
Ladda, J., Eggert, T., Glasauer, S., and Straube, A. (2007). Velocity scaling of cue-induced smooth pursuit accel-eration obeys constraints of natural motion. Exp. Brain Res. 182, 343–356.
Newsome, W. T., Wurtz, R. H., and Komatsu, H. (1988). Relation of cor-tical areas MT and MST to pursuit eye movements. ii. Differentiation of retinal from extraretinal inputs. J. Neurophysiol. 60, 604–620.
Nirenberg, S., and Latham, P. E. (2003). Decoding neuronal spike trains: how important are correlations? Proc. Natl. Acad. Sci. U.S.A. 100, 7348–7353.
Ono, S., Brostek, L., Nuding, U., Glasauer, S., Büttner, U., and Mustari, M. J. (2010). The response of MSTd neu-rons to perturbations in target motion during ongoing smooth-pursuit eye movements. J. Neurophysiol. 103.
Ono, S., Das, V. E., Economides, J. R., and Mustari, M. J. (2004). Modeling of smooth pursuit-related neuronal responses in the DLPN and NRTP of the rhesus macaque. J. Neurophysiol. 93, 108–116.
Optican, L. M., and Richmond, B. J. (1987). Temporal encoding of two-
referencesBollimunta, A., Knuth, K. H., and Ding,
M. (2007). Trial-by-trial estimation of amplitude and latency variability in neuronal spike trains. J. Neurosci. Methods 160, 163–170.
Borst, A., and Theunissen, F. E. (1999). Information theory and neural cod-ing. Nat. Neurosci. 2, 947–957.
Bremmer, F., Ilg, U. J., Thiele, A., Distler, C., and Hoffmann, K.-P. (1997). Eye position effects in monkey cortex. i. Visual and pursuit-related activity in extrastriate areas MT and MST. J. Neurophysiol. 77, 944–961.
Butts, D. A. (2003). How much informa-tion is associated with a particular stimulus? Network 14, 177–187.
Collignon, A., Maes, F., Delaere, D., Vandermeulen, D., Suetens, P., and Marchal, G. (1995). Automated multi-modality image registration based on information theory. Inf. Process. Med. Imaging 3, 263–274.
Cover, T. M., and Thomas, J. A. (1991). Elements of Information Theory. Hoboken, NJ: Wiley-Interscience.
Dayan, P., and Abbott, L. F. (2001). Theoretical Neuroscience. Cambridge, MA: MIT Press.
Eckhorn, R., and Pöpel, B. (1974). Rigorous and extended application of information theory to the afferent visual system of the cat. i. basic con-cepts. Kybernetik 16, 191–200.
Friedman, H. S., and Priebe, C. E. (1998). Estimating stimulus response latency. J. Neurosci. Methods 83, 185–194.
Fuchs, A. F., and Robinson, D. A. (1966). A method for measuring horizontal and vertical eye movement chroni-cally in the monkey. J. Appl. Physiol. 21, 1068–1070.
Golomb, D., Hertz, J., Panzeri, S., Treves, A., and Richmond, B. (1997). How well can we estimate the information car-ried in neuronal responses from limited samples? Neural Comput. 9, 649–665.
Hamed, S. B., Page, W., Duffy, C., and Pouget, A. (2003). MSTd neuronal
Brostek et al. Information-theoretic approach for evaluating tuning functions
Frontiers in Computational Neuroscience www.frontiersin.org March 2011 | Volume 5 | Article 15 | 10
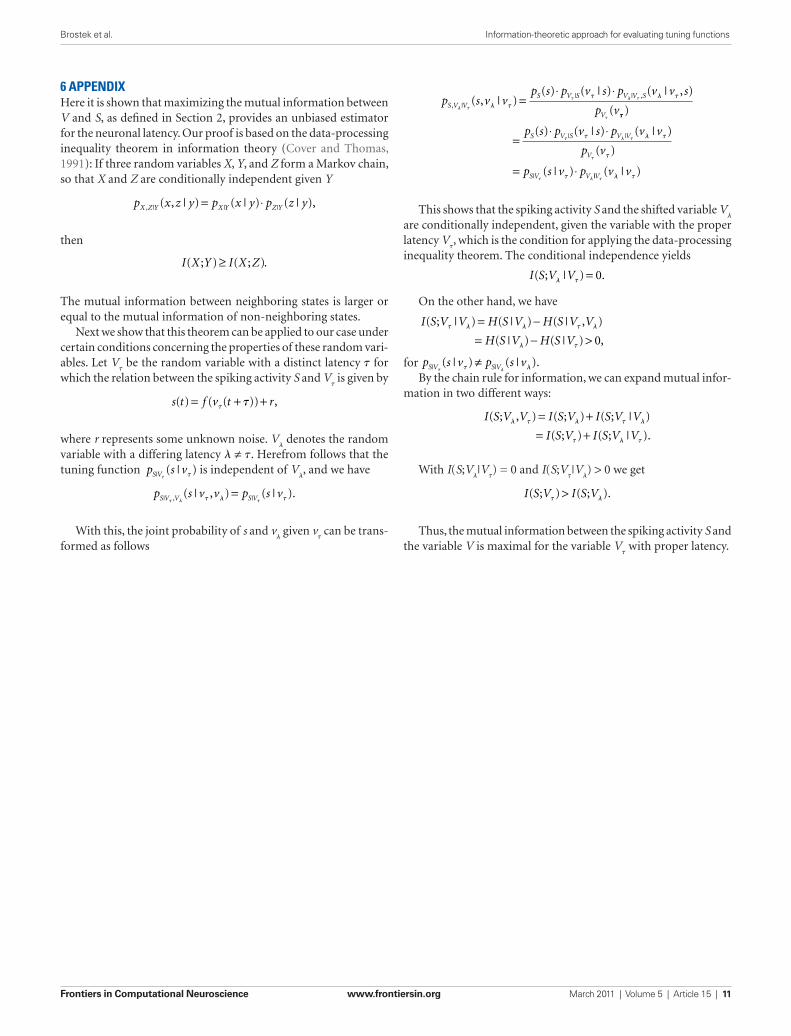
6 appendixHere it is shown that maximizing the mutual information between V and S, as defined in Section 2, provides an unbiased estimator for the neuronal latency. Our proof is based on the data-processing inequality theorem in information theory (Cover and Thomas, 1991): If three random variables X, Y, and Z form a Markov chain, so that X and Z are conditionally independent given Y
p x z y p x y p z yX Z Y X Y Z Y, | | |( , | ) ( | ) ( | ),= ⋅
then
I X Y I X Z( ; ) ( ; )≥ .
The mutual information between neighboring states is larger or equal to the mutual information of non-neighboring states.
Next we show that this theorem can be applied to our case under certain conditions concerning the properties of these random vari-ables. Let V
t be the random variable with a distinct latency t for
which the relation between the spiking activity S and Vt is given by
s t f v t r( ) ( ( )) ,= + +t t
where r represents some unknown noise. Vl denotes the random
variable with a differing latency l ≠ t. Herefrom follows that the tuning function p s vS V| ( | )
t t is independent of Vl, and we have
p s v v p s vS V V S V| , |( | , ) ( | ).t l tt l t=
With this, the joint probability of s and vl given v
t can be trans-
formed as follows
p s v vp s p v s p v v s
p vS V V
S V S V V S
V
, |
| | ,( , | )( ) ( | ) ( | , )
(l t
t l t
t
l t
t l t=⋅ ⋅
tt
t l t
t
t
t l t
t
t l
)
( ) ( | ) ( | )
( )
( | )
| |
|
=⋅ ⋅
= ⋅
p s p v s p v v
p v
p s v p
S V S V V
V
S V V || ( | )V v vt l t
This shows that the spiking activity S and the shifted variable Vl
are conditionally independent, given the variable with the proper latency V
t, which is the condition for applying the data-processing
inequality theorem. The conditional independence yields
I S V V( ; | ) .l t = 0
On the other hand, we have
I S V V H S V H S V V
H S V H S V
( ; | ) ( | ) ( | , )
( | ) ( | ) ,t l l t l
l t
= −= − > 0
for p s v p s vS V S V| |( | ) ( | ).t lt l≠
By the chain rule for information, we can expand mutual infor-mation in two different ways:
I S V V I S V I S V V
I S V I S V V
( ; , ) ( ; ) ( ; | )
( ; ) ( ; | ).l t l t l
t l t
= += +
With I(S;Vl|Vt) = 0 and I(S;V
t|Vl) > 0 we get
I S V I S V( ; ) ( ; ).t l>
Thus, the mutual information between the spiking activity S and the variable V is maximal for the variable V
t with proper latency.
Brostek et al. Information-theoretic approach for evaluating tuning functions
Frontiers in Computational Neuroscience www.frontiersin.org March 2011 | Volume 5 | Article 15 | 11