Embed Size (px)
Citation preview
doi.org/10.26434/chemrxiv.8947427.v1
An In-Depth Mechanistic Study of Ru Catalysed Aqueous MethanolDehydrogenation and Prospects for Future Catalyst DesignNitish Govindarajan, Vivek Sinha, Monica Trincado, Hansjörg Grützmacher, E.J. Meijer, Bas de Bruin
Submitted date: 17/07/2019 • Posted date: 18/07/2019Licence: CC BY-NC-ND 4.0Citation information: Govindarajan, Nitish; Sinha, Vivek; Trincado, Monica; Grützmacher, Hansjörg; Meijer,E.J.; de Bruin, Bas (2019): An In-Depth Mechanistic Study of Ru Catalysed Aqueous MethanolDehydrogenation and Prospects for Future Catalyst Design. ChemRxiv. Preprint.
Herein we provide mechanistic insights into the dehydrogenation of aqueous methanol catalysed by the[Ru(trop2dae)] complex (which is in-situ generated from [Ru(trop2dad)]), established by density functionaltheory based molecular dynamics (DFT-MD) and static DFT calculations incorporating explicit solventmolecules. The aqueous solvent proved to participate actively in various stages of the catalytic cycle includingthe catalyst activation process, and the key reaction steps involving C-H activation and hydrogen production.The aqueous solvent forms an integral part of the reactive system for the C-H activation steps in the[Ru(trop2dae)] system, with strong hydrogen bond interactions with the anionic oxygen (RO-, R = CH3,CH2OH, HCO) and hydride moieties formed along the reaction pathway. In contrast to the [Ru(trop2dad)]catalyst, C-H activation and hydrogen production does not proceed via a metal-ligand cooperative pathway forthe [Ru(trop2dae)] system. The pKa of the coordinated amine donors in these complexes provides a rationalefor the divergent reactivity, and the obtained mechanistic information provides new guidelines for the rationaldesign of active and additive free catalytic systems for aqueous methanol dehydrogenation.
File list (2)
download fileview on ChemRxivManuscript-trop2-04-07-2019_B_EJM_chemRxiv.pdf (1.69 MiB)
download fileview on ChemRxivSI-M4-06-07-2019_B-EJM.pdf (2.35 MiB)

An In-Depth Mechanistic Study of Ru Catalysed Aqueous
Methanol Dehydrogenation and Prospects for Future
Catalyst Design Nitish Govindarajan†a, Vivek Sinha†b, Monica Trincadoc, Hansjörg Grützmacher*c, Evert Jan Meijer*a, and Bas de Bruin*b
Herein we provide mechanistic insights into the dehydrogenation of aqueous methanol catalysed by the [Ru(trop2dae)]
complex (which is in-situ generated from [Ru(trop2dad)]), established by density functional theory based molecular dynamics
(DFT-MD) and static DFT calculations incorporating explicit solvent molecules. The aqueous solvent proved to participate
actively in various stages of the catalytic cycle including the catalyst activation process, and the key reaction steps involving
CH activation and hydrogen production. The aqueous solvent forms an integral part of the reactive system for the CH
activation steps in the [Ru(trop2dae)] system, with strong hydrogen bond interactions with the anionic oxygen (RO, R = CH3,
CH2OH, HCO) and hydride moieties formed along the reaction pathway. In contrast to the [Ru(trop2dad)] catalyst, CH
activation and hydrogen production does not proceed via a metal-ligand cooperative pathway for the [Ru(trop2dae)] system.
The pKa of the coordinated amine donors in these complexes provides a rationale for the divergent reactivity, and the
obtained mechanistic information provides new guidelines for the rational design of active and additive free catalytic
systems for aqueous methanol dehydrogenation.
Introduction
The energy infrastructure centred around renewable energy
resources will be key to achieve a substantial reduction of
greenhouse gas emission in the coming decades. Owing to the
intermittent nature of energy production by renewable sources
such as wind and solar energy, the development of better
means to store and transport energy is required for a large scale
sustainable implementation of renewable energy
technologies.1 Reversible storage of energy in the form of stable
and easy to transport chemicals, driven by cheap electricity
(produced by renewable sources) during peak hour production
can address these challenges. Hydrogen equivalents stored in
the form of aqueous methanol is one relevant example of
chemically stored energy, which can also be transported using
existing infrastructure. To actually use aqueous methanol as an
energy storage vector, it is of importance to develop catalytic
systems capable of generating hydrogen from aqueous
methanol on demand to enable hydrogen based electricity
production in fuel cells.2,3 In this work, we focus on
homogeneous molecular complexes that can generate three
equivalents of hydrogen from aqueous methanol under mild
conditions (1 atm, < 100 C).4,5 A number of highly active and
selective complexes have been reported in literature for this
conversion.4–11 For large scale industrial applications, it will be
crucial to develop highly active, additive-free and stable
catalytic systems based on non-toxic elements (preferably
abundant) that can operate under mild conditions.12 The
discovery of such catalytic systems requires a detailed
mechanistic understanding of the catalysed aqueous methanol
dehydrogenation. Here, we provide such mechanistic insights
for the [Ru(trop)2dad]/[Ru(trop)2dae] catalytic system, which is
the only one that can achieve this transformation in the absence
of additives (acid, base or secondary catalyst) under mild
conditions.5
Dehydrogenation of aqueous methanol to CO2 by the
[Ru(trop2dad)] catalytic system occurs in four distinct steps, as
shown in Figure 1a. In the first step, methanol is
dehydrogenated to form formaldehyde, which subsequently
undergoes hydration to form methanediol. The third step
involves dehydrogenation of methanediol to produce formic
acid (FA). In the final step, FA dehydrogenation results in the
release CO2. In total, three equivalents of hydrogen and one
equivalent of CO2 are produced. The catalysts for these
transformations typically includes a Lewis acidic site (metal
centre) which accepts the hydride formed upon CH bond
activation. A Brønsted base is needed to deprotonate the OH
moiety, which can be a part of the catalyst (internal Brønsted
a. Van ‘t Hoff Institute for Molecular Sciences and Amsterdam Center for Multiscale Modeling, Science Park 904, 1098 XH, Amsterdam, The Netherlands. E-mail: [email protected]
b. Homogeneous, Supramolecular and Bio-Inspired Catalysis, Van ‘t Hoff Institute for Molecular Sciences, Science Park 904, 1098 XH, Amsterdam, The Netherlands. E-mail: [email protected]
c. Department of Chemistry and Applied Biosciences, ETH Zürich, Zürich CH-8093, Switzerland. E-mail: [email protected]
d. †These authors contributed equally to this work

2
base, typically an amido ligand) or an external base.13,14 Such
heterolytic bond cleavages involve formation of charge
separated ionic intermediates, and therefore solvent effects
can play an important role in these transformations. Solvent
effects are expected to be more pronounced in a polar protic
medium, where solvent molecules can participate actively and
are part of reaction intermediates. A realistic modelling study of
these reactions therefore requires to include explicit solvent
molecules.13-16 Previous studies from our group have uncovered
the key aspects of methanol dehydrogenation catalysed by
[Ru(trop2dad)].18 Complex 1H is the precursor of the active
catalyst complex [Ru(trop2dad)] ,complex 1 (see Scheme 1a).
Density functional theory (DFT) calculations showed that the
dehydrogenation of aqueous methanol catalysed by complex 1
proceeds via a Noyori-Morris type metal-ligand cooperative
pathway. Complex 1 can also undergo hydrogenation of the dad
ligand via a side reaction in the catalytic system to form the
hydrogenated Ru0 complex [Ru(trop2dae)] (2). This complex
exhibits similar catalytic activity to complex 1H in the aqueous
methanol dehydrogenation reaction (TON = 426, 90 °C, ambient
pressure). Complex 2 undergoes a solvent mediated
rearrangement to form complex 2' containing a RuII center.18–20
We used static DFT models with a small number of solvent
molecules to demonstrate that solvent molecules participate
directly in the dehydrogenation of methanol to formaldehyde
catalysed by complex 2', involving several hydrogen bond
interactions with the anionic oxygen and hydride moieties (in
CH3O). Interestingly, explicit solvent effects did not play an
important role in the computed mechanism of aqueous
methanol dehydrogenation by [Ru(trop2dad)] complex 1.18
These observations indicated the need for an in-depth
investigation of solvent effects on the mechanism of hydrogen
production from aqueous methanol promoted by complex 2’.
The importance of an explicit description of the solvent had also
been demonstrated for aqueous methanol dehydrogenation
catalysed by the [Ru(PNP)],14 in addition to a number of other
catalytic systems including water oxidation21–24 and transfer
hydrogenation of ketones.15,16,25
In order to gain a detailed understanding of the effects of
solvent on aqueous methanol dehydrogenation catalysed by
complex 2’, we performed extensive mechanistic studies using
a combination of density functional theory based molecular
dynamics (DFT-MD) simulations and static DFT models
incorporating explicit solvent (water) molecules. The DFT-MD
model consisted of the catalyst complexes with 108 explicit
water molecules in a cubic periodic system (L = 16 Å) and the
electronic structure was determined using the BLYP
functional,26,27 supplemented with a dispersion correction.28
The static DFT microsolvation calculations using explicit water
solvent molecules were performed at the RI-DFT-D3/BP86/def2-
TZVP level of theory, including a dispersion contribution
(disp3).26,28,29 In this paper, the representation “BP86//XC(Water)”
stands for single-point SCF calculations performed using XC
functional (XC = B3LYP or BLYP) with implicit solvent corrections
(COSMO) for water on DFT optimized geometry using the BP86
functional, with a dispersion correction (disp3).28,30 An example for
the naming convention for complexes in this study: 2’-TS-1-CH3OH3w
indicates the transition state for dehydrogenation of CH3OH in the
presence of complex 2’ with three explicit solvent water molecules
considered in the static DFT model. Full details on the computational
methods are provided in Section S1 in the ESI. Our results reveal
the active participation of solvent in various stages of the
catalytic cycle. In particular, we show that the solvent
environment is essential for an accurate description of the
catalyst activation step (protonation of complex 1H to form
complex 1), and in modelling the dehydrogenation of methanol,
methanediol and formic acid catalysed by complex 2' (Scheme
1). Our results show, in marked contrast to complex 1, that
dehydrogenation of methanol catalysed by complex 2’ does not
proceed via a Noyori-Morris type metal-ligand cooperative
pathway. Rather it proceeds via a metal-centered pathway
without the direct involvement of the ligand moiety. Moreover,
we find divergent hydrogen production pathways for complex
1B ([Ru(H)(tropNH-CH=CH-Ntrop)]) and complex 2'B
([Ru(H)(tropNH-CH2-CH2-NHtrop)]). The former releases H2 via a
direct (unassisted) pathway,18 while the latter expels H2 via a solvent
assisted pathway leaving the ligand nitrogen (Ndae) in a protonated
state throughout the entire process. Based on these detailed
mechanistic insights, we propose principles that can enable rational
design of highly active additive free catalytic systems for aqueous
methanol dehydrogenation.
Figure 1. (a) Elementary steps in dehydrogenation of methanol-water
mixtures to three equivalents of H2 and CO2. (b) Complexes relevant for this
study.

3
Scheme 1. a) Catalyst activation and in-situ generation of complex 2/2'. b)
Proposed mechanism for dehydrogenation of methanol to formaldehyde
catalysed by complex 2'. A similar mechanism underlies the dehydrogenation
of methanediol and formic acid. Transient bonds are shown as red dashed
lines.
Results
Catalyst Activation
Experimentally, the anionic hydride 1H (Figure 1b) was shown to react with a slight excess of water or an acid to produce the active catalyst complex 1 and H2 (Scheme 1a).5 Stoichiometric reaction of
complexes 1H or 1 with an alcohol or alcohol/water mixtures leads to the full hydrogenation of the ligand, forming complex 2. The
protonation of complex 1H to produce the active catalytic complex 1 can be studied using the reaction as described by equation (1):
1H— + (H2O)n H2 + OH— (H2O)n-1 + 1 (1)
A previous computational study based on DFT and CCSD(T)
calculations suggested that the formation of complex 1 is not
feasible, and therefore an alternative reaction pathway based on
anionic intermediates derived from complex 1H was considered.31
However, experimental data clearly indicated formation of complex
1 as the active species.5 In terms of electrostatics, the stoichiometric
reaction in equation (1) results in transfer of a delocalized negative
charge on complex 1H to the (solvated) hydroxide species OH—
·(H2O)n-1, in which the negative charge is more localized due to the
small size of the resulting anion (especially for small values of n).
Therefore, we studied the effect of increasing the number water
molecules (increasing n) around OH— on the relative Gibbs free
energy (G298K) and enthalpy (H298K) of protonation of complex 1H.
As expected, DFT calculations show that the free energy change upon
protonation of complex 1H is strongly dependent on the number of
solvent molecules considered (see Figure 2). While the process is
calculated to be uphill by +32 kcal mol-1 with one water molecule, the
presence of six water molecules lowers the free energy difference to
only +11.5 kcal mol-1. These results clearly reveal the importance of
considering an appropriate number of explicit solvent molecules to
describe the catalyst activation step.
To gain deeper insight into the catalyst activation pathway, we
performed DFT based molecular dynamics (DFT-MD) with an explicit
description of the water solvent. We studied the protonation
pathway of complex 1H by a solvent water molecule in an explicit
solvent box using the method of constrained molecular dynamics
(CMD), where the proton-transfer reaction coordinate (Q) involves
the cleavage of the OH bond of a water molecule with simultaneous
formation of the NdadH bond.32 The calculated barrier for this
protonation is +9.3 ± 0.6 kcal mol-1, with the overall process being
endergonic by only +5.1 ± 0.6 kcal mol-1 as shown in Figure 3a.
Figure 2. Gibbs free energy and enthalpy of protonation of complex 1H by
water to form complex 1 with the release of H2.
The protonation of Ndad by a solvent water molecule results in the
formation of complex 1B and an OH anion, that diffuses away into
the solution via the Grotthuss mechanism (Figure 3b).33 Clearly, such
a realistic picture of the protonation can only be captured by
incorporating explicit solvent simulations and accounting for thermal
fluctuations. Dehydrogenation of complex 1B generates complex 1,
the active catalytic species in this catalytic system. A detailed
mechanism including solvent effects for this transformation is
discussed in the hydrogen production section (vide infra).
4
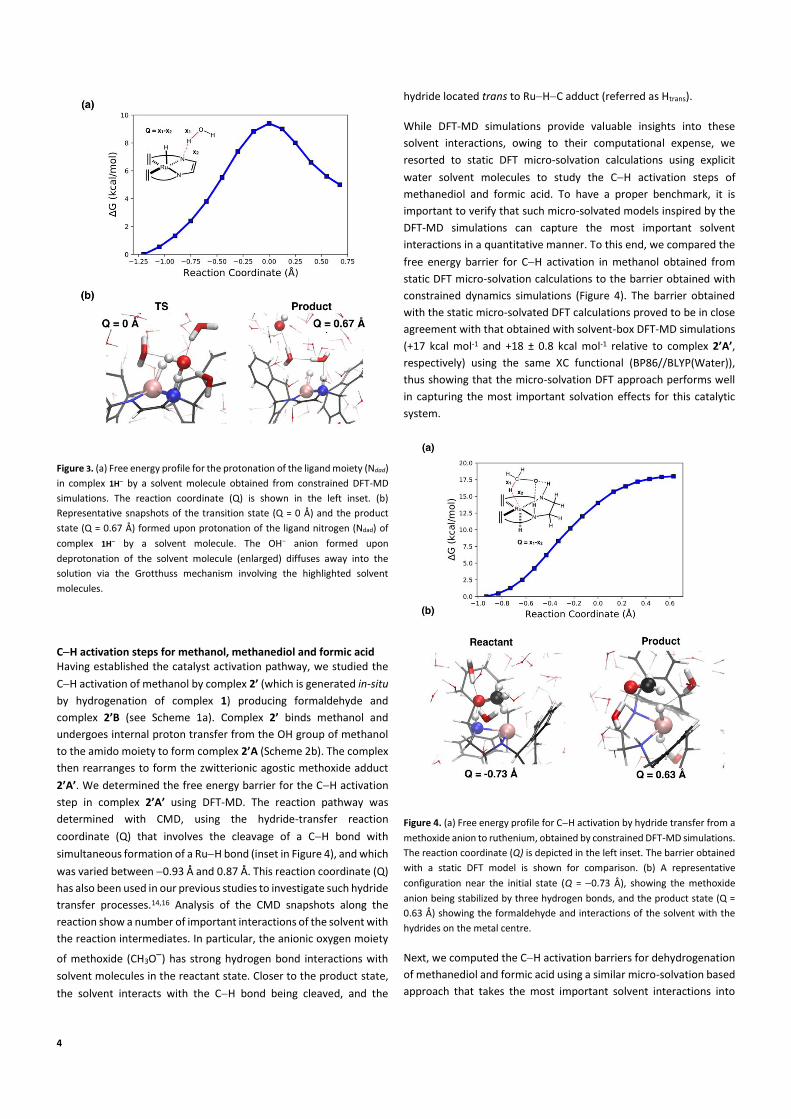
Figure 3. (a) Free energy profile for the protonation of the ligand moiety (Ndad)
in complex 1H by a solvent molecule obtained from constrained DFT-MD
simulations. The reaction coordinate (Q) is shown in the left inset. (b)
Representative snapshots of the transition state (Q = 0 Å) and the product
state (Q = 0.67 Å) formed upon protonation of the ligand nitrogen (Ndad) of
complex 1H by a solvent molecule. The OH anion formed upon
deprotonation of the solvent molecule (enlarged) diffuses away into the
solution via the Grotthuss mechanism involving the highlighted solvent
molecules.
CH activation steps for methanol, methanediol and formic acid Having established the catalyst activation pathway, we studied the
CH activation of methanol by complex 2’ (which is generated in-situ
by hydrogenation of complex 1) producing formaldehyde and
complex 2’B (see Scheme 1a). Complex 2’ binds methanol and
undergoes internal proton transfer from the OH group of methanol
to the amido moiety to form complex 2’A (Scheme 2b). The complex
then rearranges to form the zwitterionic agostic methoxide adduct
2’A’. We determined the free energy barrier for the CH activation
step in complex 2’A’ using DFT-MD. The reaction pathway was
determined with CMD, using the hydride-transfer reaction
coordinate (Q) that involves the cleavage of a CH bond with
simultaneous formation of a RuH bond (inset in Figure 4), and which
was varied between 0.93 Å and 0.87 Å. This reaction coordinate (Q)
has also been used in our previous studies to investigate such hydride
transfer processes.14,16 Analysis of the CMD snapshots along the
reaction show a number of important interactions of the solvent with
the reaction intermediates. In particular, the anionic oxygen moiety
of methoxide (CH3O) has strong hydrogen bond interactions with
solvent molecules in the reactant state. Closer to the product state,
the solvent interacts with the CH bond being cleaved, and the
hydride located trans to RuHC adduct (referred as Htrans).
While DFT-MD simulations provide valuable insights into these
solvent interactions, owing to their computational expense, we
resorted to static DFT micro-solvation calculations using explicit
water solvent molecules to study the CH activation steps of
methanediol and formic acid. To have a proper benchmark, it is
important to verify that such micro-solvated models inspired by the
DFT-MD simulations can capture the most important solvent
interactions in a quantitative manner. To this end, we compared the
free energy barrier for CH activation in methanol obtained from
static DFT micro-solvation calculations to the barrier obtained with
constrained dynamics simulations (Figure 4). The barrier obtained
with the static micro-solvated DFT calculations proved to be in close
agreement with that obtained with solvent-box DFT-MD simulations
(+17 kcal mol-1 and +18 ± 0.8 kcal mol-1 relative to complex 2’A’,
respectively) using the same XC functional (BP86//BLYP(Water)),
thus showing that the micro-solvation DFT approach performs well
in capturing the most important solvation effects for this catalytic
system.
Figure 4. (a) Free energy profile for CH activation by hydride transfer from a
methoxide anion to ruthenium, obtained by constrained DFT-MD simulations.
The reaction coordinate (Q) is depicted in the left inset. The barrier obtained
with a static DFT model is shown for comparison. (b) A representative
configuration near the initial state (Q = 0.73 Å), showing the methoxide
anion being stabilized by three hydrogen bonds, and the product state (Q =
0.63 Å) showing the formaldehyde and interactions of the solvent with the
hydrides on the metal centre.
Next, we computed the CH activation barriers for dehydrogenation
of methanediol and formic acid using a similar micro-solvation based
approach that takes the most important solvent interactions into
5
account (Figure 5). In Figure 5, the relative activation energy barriers
obtained with BP86//B3LYP(Water) are reported with respect to the
alkoxide/formate adduct 2’A (Figure 2b). CH activation of methanol
to formaldehyde is the rate-limiting step in the overall process, with
a computed barrier of +26.2 kcal mol-1. A common feature of all three
activated complexes 2'TS-1-CH3OH3w, 2'TS-1-(CH2(OH)2)5w and 2'TS-1-
HCOOH5w at the corresponding transition states (TS) involving CH
activation of methanol, methanediol and formic acid is the strong
interaction of the anionic oxygen moiety and the Htrans center with
the solvent (Figure 5). Interestingly, the CH bond being cleaved also
shows strong interactions with the solvent, except for formic acid
where such interactions are sterically hindered (see Section S4 in the
ESI). In fact, it was not possible to locate a TS for the hydride transfer
process in the absence of explicit solvent molecules for the
dehydrogenation of methanol to formaldehyde. In the absence of
solvent molecules the potential energy surface (PES) scans showed a
completely uphill profile for the cleavage of the CH bond in the
methoxide moiety, and the resulting CH2O adduct was not found to
be a minimum on the PES (see section S3 in the ESI).
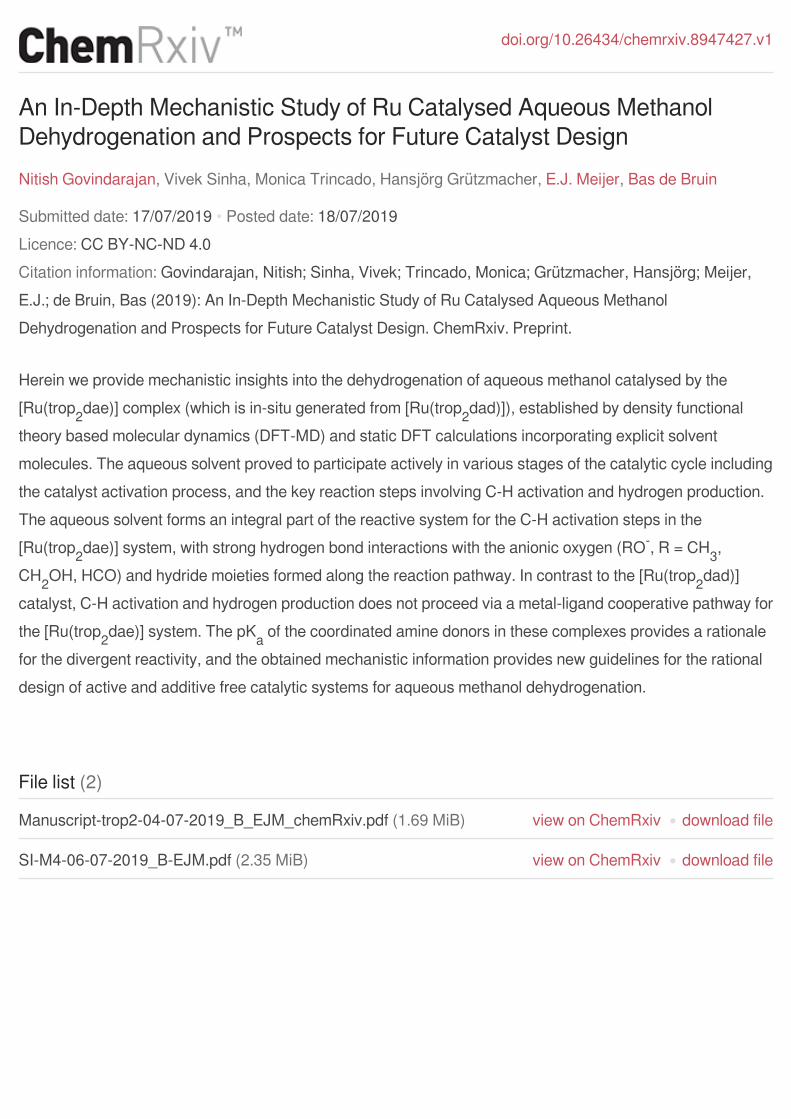
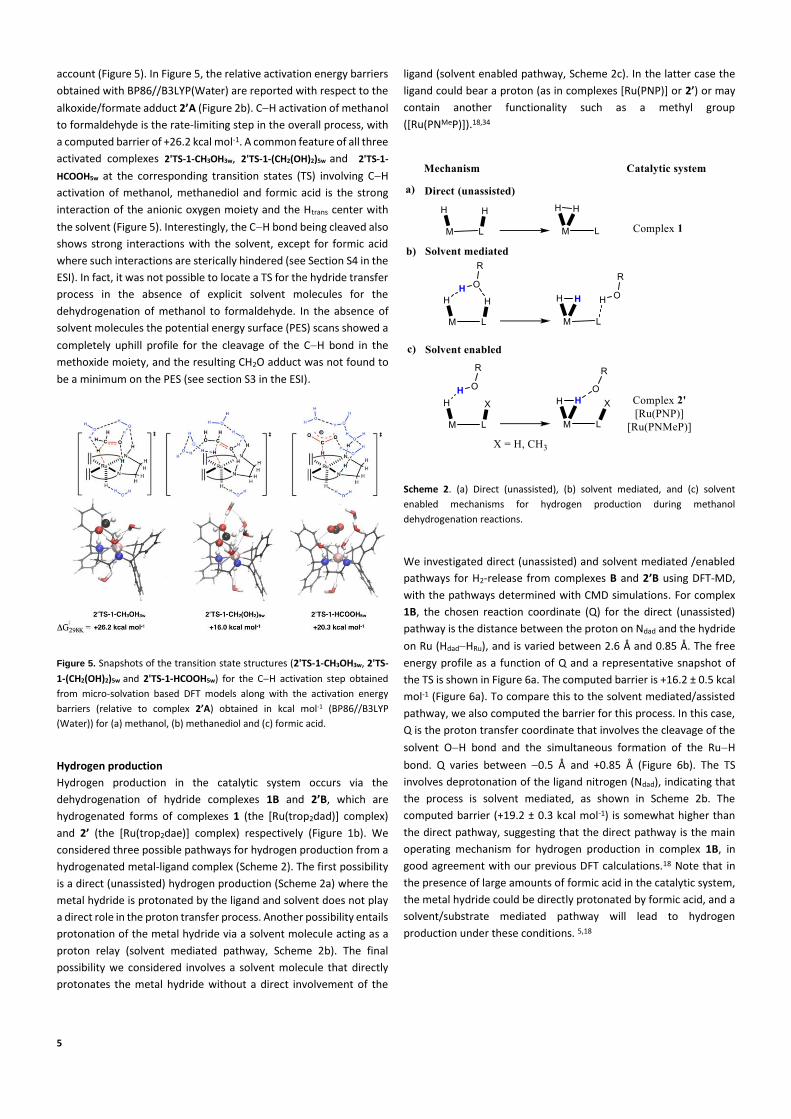
Figure 5. Snapshots of the transition state structures (2'TS-1-CH3OH3w, 2'TS-
1-(CH2(OH)2)5w and 2'TS-1-HCOOH5w) for the CH activation step obtained
from micro-solvation based DFT models along with the activation energy
barriers (relative to complex 2’A) obtained in kcal mol-1 (BP86//B3LYP
(Water)) for (a) methanol, (b) methanediol and (c) formic acid.
Hydrogen production
Hydrogen production in the catalytic system occurs via the
dehydrogenation of hydride complexes 1B and 2’B, which are
hydrogenated forms of complexes 1 (the [Ru(trop2dad)] complex)
and 2’ (the [Ru(trop2dae)] complex) respectively (Figure 1b). We
considered three possible pathways for hydrogen production from a
hydrogenated metal-ligand complex (Scheme 2). The first possibility
is a direct (unassisted) hydrogen production (Scheme 2a) where the
metal hydride is protonated by the ligand and solvent does not play
a direct role in the proton transfer process. Another possibility entails
protonation of the metal hydride via a solvent molecule acting as a
proton relay (solvent mediated pathway, Scheme 2b). The final
possibility we considered involves a solvent molecule that directly
protonates the metal hydride without a direct involvement of the
ligand (solvent enabled pathway, Scheme 2c). In the latter case the
ligand could bear a proton (as in complexes [Ru(PNP)] or 2’) or may
contain another functionality such as a methyl group
([Ru(PNMeP)]).18,34
Scheme 2. (a) Direct (unassisted), (b) solvent mediated, and (c) solvent
enabled mechanisms for hydrogen production during methanol
dehydrogenation reactions.
We investigated direct (unassisted) and solvent mediated /enabled
pathways for H2-release from complexes B and 2’B using DFT-MD,
with the pathways determined with CMD simulations. For complex
1B, the chosen reaction coordinate (Q) for the direct (unassisted)
pathway is the distance between the proton on Ndad and the hydride
on Ru (HdadHRu), and is varied between 2.6 Å and 0.85 Å. The free
energy profile as a function of Q and a representative snapshot of
the TS is shown in Figure 6a. The computed barrier is +16.2 ± 0.5 kcal
mol-1 (Figure 6a). To compare this to the solvent mediated/assisted
pathway, we also computed the barrier for this process. In this case,
Q is the proton transfer coordinate that involves the cleavage of the
solvent OH bond and the simultaneous formation of the RuH
bond. Q varies between 0.5 Å and +0.85 Å (Figure 6b). The TS
involves deprotonation of the ligand nitrogen (Ndad), indicating that
the process is solvent mediated, as shown in Scheme 2b. The
computed barrier (+19.2 ± 0.3 kcal mol-1) is somewhat higher than
the direct pathway, suggesting that the direct pathway is the main
operating mechanism for hydrogen production in complex 1B, in
good agreement with our previous DFT calculations.18 Note that in
the presence of large amounts of formic acid in the catalytic system,
the metal hydride could be directly protonated by formic acid, and a
solvent/substrate mediated pathway will lead to hydrogen
production under these conditions. 5,18

6
Figure 6. Free energy profile for hydrogen production from complex 1B obtained from DFT-MD simulations, via (a) direct pathway with the reaction coordinate (Q) depicted in the left inset. A representative configuration of the transition state at Q = 1.25 Å is shown in the right inset. (b) Solvent mediated pathway with the chosen Q depicted in the left inset, and a representative configuration of the activated complex at Q = 0.6 Å shown in the right inset. Here, the ligand nitrogen (Ndad) is deprotonated along the reaction, resulting in a solvent mediated pathway.
For complex 2’B, DFT-MD in combination with CMD was used to
compute the barrier for H2-release via a solvent mediated/enabled
pathway. A direct pathway for hydrogen production was also
explored, but was found to have a very high activation barrier (see
Section S6 in the ESI). The chosen proton-transfer reaction
coordinate (Q) involves the cleavage of a solvent OH bond with
simultaneous formation of the RuH bond and was varied between
0.5 Å and +1.27 Å. The free energy profile along with a
representative snapshot of the product state (Q = 1.27 Å) is shown in
Figure 7, with a rather low barrier of +8.2 ± 0.4 kcal mol-1. The
product state still has a protonated ligand nitrogen (Ndae), and the
overall mechanism is clearly solvent assisted (Scheme 2c). It results
in the formation of an OH anion that diffuses away into solution.
Dehydrogenation of complex 2’B using static DFT calculations with
explicit solvent molecules also shows a solvent enabled pathway with
similar barriers.18 Such a hydrogen production pathway for complex
2’B is reminiscent of Beller’s [Ru(PNP)] complex, for which DFT-MD
simulations indicated that it also operates via a solvent facilitated
mechanism where the ligand nitrogen moiety remains protonated
throughout the reaction.14
Figure 7. (a) Free energy profile for hydrogen production from complex 2’B
obtained from DFT-MD simulations, via a solvent enabled pathway with the
chosen Q depicted in the left inset and (b) a representative configuration of
the transition state at Q = 0.6 Å and the product state at Q = 1.27 Å. The OH
anion formed upon deprotonation of the solvent molecule (enlarged) diffuses
away into the solution via the Grotthuss mechanism involving the highlighted
solvent molecules. The ligand nitrogen (Ndae) remains protonated throughout
the process.
Based on the model calculations we summarize in Scheme 3 the
overall mechanism for methanol dehydrogenation and hydrogen
production catalysed by complex 2’ along with the corresponding
relative Gibbs free energy (G298) values (BP86//B3LYP(Water)) is
shown. Refer also to Section S5 in the ESI for MERP involving
methanediol and formic acid dehydrogenation. The origin of
different hydrogen production pathways in complexes B and 2’B and
their implications for the overall catalytic mechanism is discussed in
detail in the next section.

7
Scheme 3. Overall mechanism with an explicit solvation model for
dehydrogenation of methanol to formaldehyde catalyzed by complex 2’ along
with the corresponding Gibbs free energy values (G298) in kcal mol-1
(BP86//B3LYP (Water)).35
Discussion
We have studied the mechanism of catalytic dehydrogenation of
aqueous methanol mediated by the [Ru(trop2dad)] and
[Ru(trop2dae)] complexes, using a combination of DFT-MD
simulations and static DFT calculations taking explicit solvation
effects into consideration. We found that explicit description of the
bulk solvent environment is essential for an accurate description of
the catalyst activation process, that involves the protonation of an
Ndad moiety in complex 1H by a solvent water molecule to produce
complex 1B. H2-loss from complex 1B yields the active catalyst
complex 1 ([Ru(trop2dad)]). The mechanism of methanol
dehydrogenation by catalyst 1 was investigated in detail in our
previous studies,18 but in addition to complex 1 another complex 2’
([Ru(trop2dae)]) is experimentally known to be generated in-situ
under catalytic conditions, and both are catalytically active. Our
previous studies indicated that (unlike for [Ru(trop2dad)] complex 1)
explicit solvation effects are important to describe correctly the
mechanistic features of the catalytic methanol dehydrogenation by
[Ru(trop2dae)] complex 2. Herein we investigated the mechanism for
aqueous methanol dehydrogenation to CO2 and three equivalents of
dihydrogen by complex 2 taking explicit solvation effects into
consideration. DFT-MD simulations that include explicit solvent
molecules show that the solvent is an integral part of the reactive
system. The solvent actively participates in the reaction via hydrogen
bond interactions. We observed two contrasting effects of explicit
solvent molecules in modelling the CH activation steps: (1) The
solvent stabilizes the anionic RO moiety in the reactant species (R =
CH3, CH2OH, CHO) via hydrogen bonding interactions and thereby
increases the barriers for the CH activation step compared to gas-
phase models without such hydrogen bonding interactions. (2)
Similar hydrogen bonding interactions of the solvent with the
RuHC bond (of the incoming hydride) stabilizes 2'TS-1-CH3OH3w
and 2'TS-1-(CH2(OH)2)5w, thereby assisting the CH activation process.
For 2'TS-1-HCOOH5w, we note that the steric hindrance caused by the
O=C=O moiety prevents hydrogen bonding interactions between the
hydride moiety and surrounding water molecules (see Section S4 in
the ESI). Moreover, the repulsive interactions of the hydride moieties
on the metal centre in complex 2’B increases the energy penalty for
hydride transfer to complex 2’, thus resulting in higher TS barriers for
the CH activation steps.36 However, hydrogen bond interactions of
the solvent with the Htrans moiety facilitates CH activation by
stabilizing 2'TS-1-CH3OH3w, 2'TS-1-(CH2(OH)2)5w and 2'TS-1-HCOOH5w.
To summarize, in aqueous solution solvent molecules can assist and
mitigate CH activation via hydrogen bonding interactions as
discussed above. Thus, the solvent molecules constitute an integral
part of the reactive system and must be included for a more accurate
description of this process.
Next, we compared the mechanisms for hydrogen production by
complexes 1B, 2’B and Beller’s [Ru(PNP)] complex,14 which occur via
distinctly different reaction steps. H2-loss from complex 1B proceeds
via the direct (unassisted) pathway (see Scheme 2), while complex
2’B and Beller’s [Ru(PNP)] complex both lose H2 via a solvent assisted
pathway without direct involvement of the ligand. The latter is a
result of the high pKa of the ligand NH moiety. Collectively, the pKa of
the NH moiety and the hydricity of the metal hydride are the key
factors in determining the energetics, thermodynamics, activation
barrier, and the underlying mechanism for hydrogen production. We
anticipate that the natural charge on the hydride is a good measure
of its hydricity. The higher the negative natural charge, the higher the
hydricity. We show that ligand pKa (computed using DFT-MD with
explicit water solvent) and our measure of natural charge for the
hydricity of the metal-hydride bond can be used to differentiate
between the (direct) unassisted, solvent mediated, and solvent
enabled mechanisms (Scheme 2) of different catalysts.
8
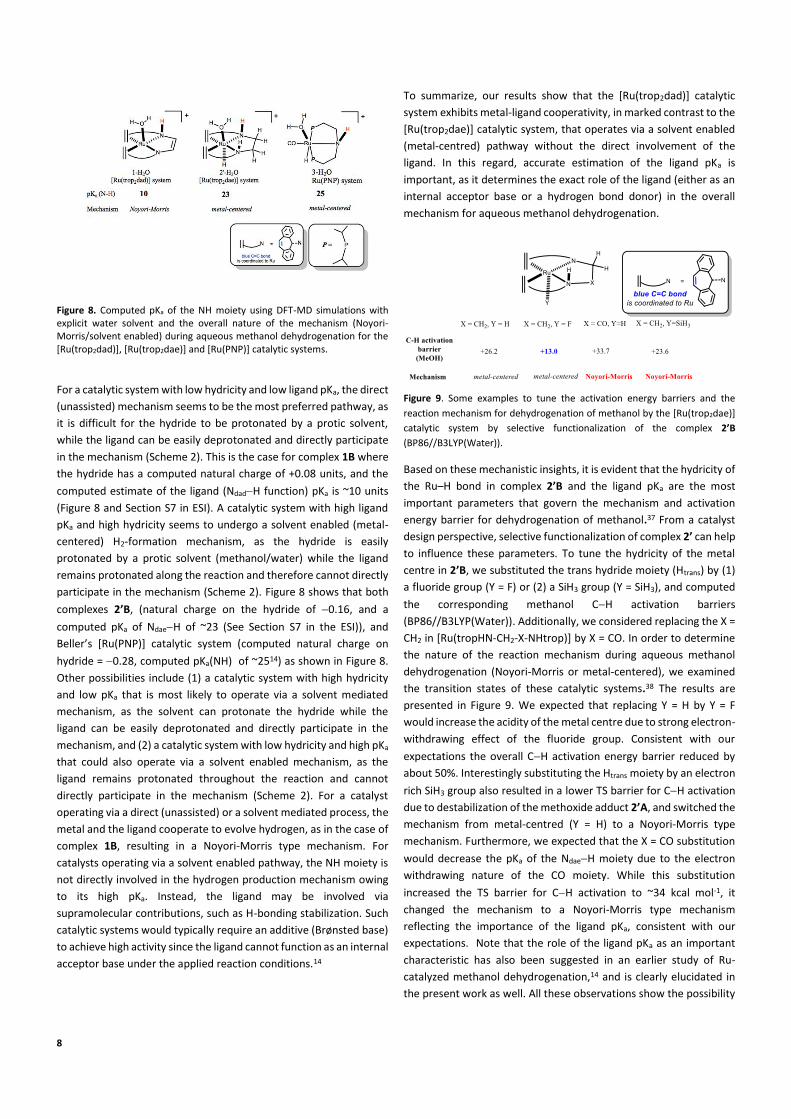
Figure 8. Computed pKa of the NH moiety using DFT-MD simulations with explicit water solvent and the overall nature of the mechanism (Noyori-Morris/solvent enabled) during aqueous methanol dehydrogenation for the [Ru(trop2dad)], [Ru(trop2dae)] and [Ru(PNP)] catalytic systems.
For a catalytic system with low hydricity and low ligand pKa, the direct
(unassisted) mechanism seems to be the most preferred pathway, as
it is difficult for the hydride to be protonated by a protic solvent,
while the ligand can be easily deprotonated and directly participate
in the mechanism (Scheme 2). This is the case for complex 1B where
the hydride has a computed natural charge of +0.08 units, and the
computed estimate of the ligand (NdadH function) pKa is ~10 units
(Figure 8 and Section S7 in ESI). A catalytic system with high ligand
pKa and high hydricity seems to undergo a solvent enabled (metal-
centered) H2-formation mechanism, as the hydride is easily
protonated by a protic solvent (methanol/water) while the ligand
remains protonated along the reaction and therefore cannot directly
participate in the mechanism (Scheme 2). Figure 8 shows that both
complexes 2’B, (natural charge on the hydride of 0.16, and a
computed pKa of NdaeH of ~23 (See Section S7 in the ESI)), and
Beller’s [Ru(PNP)] catalytic system (computed natural charge on
hydride = 0.28, computed pKa(NH) of ~2514) as shown in Figure 8.
Other possibilities include (1) a catalytic system with high hydricity
and low pKa that is most likely to operate via a solvent mediated
mechanism, as the solvent can protonate the hydride while the
ligand can be easily deprotonated and directly participate in the
mechanism, and (2) a catalytic system with low hydricity and high pKa
that could also operate via a solvent enabled mechanism, as the
ligand remains protonated throughout the reaction and cannot
directly participate in the mechanism (Scheme 2). For a catalyst
operating via a direct (unassisted) or a solvent mediated process, the
metal and the ligand cooperate to evolve hydrogen, as in the case of
complex 1B, resulting in a Noyori-Morris type mechanism. For
catalysts operating via a solvent enabled pathway, the NH moiety is
not directly involved in the hydrogen production mechanism owing
to its high pKa. Instead, the ligand may be involved via
supramolecular contributions, such as H-bonding stabilization. Such
catalytic systems would typically require an additive (Brønsted base)
to achieve high activity since the ligand cannot function as an internal
acceptor base under the applied reaction conditions.14
To summarize, our results show that the [Ru(trop2dad)] catalytic
system exhibits metal-ligand cooperativity, in marked contrast to the
[Ru(trop2dae)] catalytic system, that operates via a solvent enabled
(metal-centred) pathway without the direct involvement of the
ligand. In this regard, accurate estimation of the ligand pKa is
important, as it determines the exact role of the ligand (either as an
internal acceptor base or a hydrogen bond donor) in the overall
mechanism for aqueous methanol dehydrogenation.
Figure 9. Some examples to tune the activation energy barriers and the
reaction mechanism for dehydrogenation of methanol by the [Ru(trop2dae)] catalytic system by selective functionalization of the complex 2’B
(BP86//B3LYP(Water)).
Based on these mechanistic insights, it is evident that the hydricity of
the Ru–H bond in complex 2’B and the ligand pKa are the most
important parameters that govern the mechanism and activation
energy barrier for dehydrogenation of methanol.37 From a catalyst
design perspective, selective functionalization of complex 2’ can help
to influence these parameters. To tune the hydricity of the metal
centre in 2’B, we substituted the trans hydride moiety (Htrans) by (1)
a fluoride group (Y = F) or (2) a SiH3 group (Y = SiH3), and computed
the corresponding methanol CH activation barriers
(BP86//B3LYP(Water)). Additionally, we considered replacing the X =
CH2 in [Ru(tropHN-CH2-X-NHtrop)] by X = CO. In order to determine
the nature of the reaction mechanism during aqueous methanol
dehydrogenation (Noyori-Morris or metal-centered), we examined
the transition states of these catalytic systems.38 The results are
presented in Figure 9. We expected that replacing Y = H by Y = F
would increase the acidity of the metal centre due to strong electron-
withdrawing effect of the fluoride group. Consistent with our
expectations the overall CH activation energy barrier reduced by
about 50%. Interestingly substituting the Htrans moiety by an electron
rich SiH3 group also resulted in a lower TS barrier for CH activation
due to destabilization of the methoxide adduct 2’A, and switched the
mechanism from metal-centred (Y = H) to a Noyori-Morris type
mechanism. Furthermore, we expected that the X = CO substitution
would decrease the pKa of the NdaeH moiety due to the electron
withdrawing nature of the CO moiety. While this substitution
increased the TS barrier for CH activation to ~34 kcal mol-1, it
changed the mechanism to a Noyori-Morris type mechanism
reflecting the importance of the ligand pKa, consistent with our
expectations. Note that the role of the ligand pKa as an important
characteristic has also been suggested in an earlier study of Ru-
catalyzed methanol dehydrogenation,14 and is clearly elucidated in
the present work as well. All these observations show the possibility

9
to tune the CH activation barriers and the nature of the operating
mechanism by modifying the hydricity of the metal center and the
ligand pKa via selective ligand functionalization of the [Ru(trop2dae)]
complex. This is by no means a comprehensive study of all possible
substituents that can be incorporated, but we expect it to serve as a
guideline for future high-throughput screening studies.39,40
Conclusions
To summarise and conclude, we have investigated aqueous
methanol dehydrogenation catalysed by the [Ru(trop2dad)] and
[Ru(trop2dae)] catalytic systems, using a combination of DFT-
MD simulations and static DFT models incorporating explicit
solvent molecules. The results demonstrate the active
participation of solvent in various stages of the catalytic cycle,
including catalyst activation, CH activation and hydrogen
production. Additionally, for hydrogen production we find
divergent pathways for the [Ru(trop2dad)] and the
[Ru(trop2dae)] catalytic systems. Analysis of hydricity and ligand
pKa of these complexes can help to rationalize the origin of
different hydrogen production pathways. We anticipate that
these descriptors may have a generic use in identifying, and
possible tune, the operating mechanism for hydrogen
production by other catalytic systems that operate in a protic
solvent environment. The present study constitutes an
interesting example of two active complexes in a catalytic
system that exhibit divergent pathways for aqueous methanol
dehydrogenation.
Conflicts of interest
There are no conflicts to declare.
Acknowledgements
This work is part of the Industrial Partnership Programme (IPP)
Computational Sciences for Energy Research (project
13CSER003 (V.S) and project 14CSER044 (N.G)) which is
financially supported by the Netherlands Organization for
Scientific Research (NWO) and Shell Global International
Solutions B.V. V.S and B.d.B acknowledge support from the
Research Priority Area Sustainable chemistry of the University
of Amsterdam. The calculations were carried out on the Dutch
national e-infrastructure (Cartesius) with the support of the
SURF cooperative. M. T. and H. G. acknowledge the support
from the Schweizer Nationalfonds (SNF, No. 2-77199-18) and
Eidgenössische Hochschule Zürich.
Notes and References
1 J. Rugolo and M. J. Aziz, Energy Environ. Sci., 2012, 5, 7151–7160.
2 S. P. Annen, V. Bambagioni, M. Bevilacqua, J. Filippi, A. Marchionni, W. Oberhauser, H. Schönberg, F. Vizza, C. Bianchini and H. Grützmacher, Angew. Chem. Int. Ed., 2010, 49, 7229–7233.
3 M. Bellini, M. Bevilacqua, J. Filippi, A. Lavacchi, A. Marchionni, H. A. Miller, W. Oberhauser, F. Vizza, S. P. Annen and H. Grützmacher, ChemSusChem, 2014, 7, 2432–2435.
4 M. Nielsen, E. Alberico, W. Baumann, H.-J. Drexler, H. Junge, S. Gladiali and M. Beller, Nature, 2013, 495, 85–89.
5 R. E. Rodríguez-Lugo, M. Trincado, M. Vogt, F. Tewes, G. Santiso-Quinones and H. Grützmacher, Nat Chem, 2013, 5, 342–347.
6 C. Prichatz, E. Alberico, W. Baumann, H. Junge and M. Beller, ChemCatChem, 2017, 9, 1891–1896.
7 M. Nielsen, Angew. Chem. Int. Ed., 2011, 50, 9593–9597.
8 P. Hu, Y. Diskin-Posner, Y. Ben-David and D. Milstein, ACS Catal., 2014, 4, 2649–2652.
9 S. Chakraborty, P. O. Lagaditis, M. Förster, E. A. Bielinski, N. Hazari, M. C. Holthausen, W. D. Jones and S. Schneider, ACS Catal., 2014, 4, 3994–4003.
10 M. Andérez-Fernández, L. K. Vogt, S. Fischer, W. Zhou, H. Jiao, M. Garbe, S. Elangovan, K. Junge, H. Junge, R. Ludwig and M. Beller, Angew. Chemie Int. Ed., 2017, 56, 559–562.
11 J. Campos, L. S. Sharninghausen, M. G. Manas and R. H. Crabtree, Inorg. Chem., 2015, 54, 5079–5084.
12 M. Trincado, D. Banerjee and H. Grützmacher, Energy Environ. Sci., 2014, 7, 2464–2503.
13 J. R. Khusnutdinova and D. Milstein, Angew. Chemie Int. Ed., 2015, 54, 12236–12273.
14 V. Sinha, N. Govindarajan, B. de Bruin and E. J. Meijer, ACS Catal., 2018, 8, 6908–6913.
15 J.-W. Handgraaf and E. J. Meijer, J. Am. Chem. Soc., 2007,
10
129, 3099–3103.
16 A. Pavlova and E. J. Meijer, ChemPhysChem, 2012, 13, 3492–3496.
17 A. Pavlova, E. Rösler and E. J. Meijer, ACS Catal., 2016, 6, 5350–5358.
18 V. Sinha, M. Trincado, H. Grützmacher and B. de Bruin, J. Am. Chem. Soc., 2018, 140, 13103–13114.
19 M. Trincado, V. Sinha, R. E. Rodriguez-Lugo, B. Pribanic, B. de Bruin and H. Grützmacher, Nat. Commun., 2017, 8, 14990.
20 NMR showed that complex 2 is thermally converted in low yield to a mixture of complex 1 and a new species with a hydride resonance at -7.74 ppm, which we assigned to complex 2’.
21 F. H. Hodel and S. Luber, ACS Catal., 2016, 6, 6750–6761.
22 C. Ma, S. Piccinin and S. Fabris, ACS Catal., 2012, 2, 1500–1506.
23 N. Govindarajan, A. Tiwari, B. Ensing and E. J. Meijer, Inorg. Chem., 57, 13063-13066.
24 S. Zhan and M. S. G. Ahlquist, J. Am. Chem. Soc., 2018, 140, 7498–7503.
25 P. A. Dub and T. Ikariya, J. Am. Chem. Soc., 2013, 135, 2604–2619.
26 A. D. Becke, Phys. Rev. A, 1988, 38, 3098–3100.
27 C. Lee, W. Yang and R. G. Parr, Phys. Rev. B, 1988, 37, 785–789.
28 S. Grimme, J. Antony, S. Ehrlich and H. Krieg, J. Chem. Phys., 2010, 132, 154104.
29 J. P. Perdew, Phys. Rev. B, 1986, 33, 8822–8824.
30 A. Klamt and G. Schuurmann, J. Chem. Soc.{,} Perkin Trans. 2, 1993, 799–805.
31 H. Li and M. B. Hall, J. Am. Chem. Soc., 2015, 137, 12330–12342.
32 We also considered direct protonation of the metal-hydride bond by a solvent water molecule. This pathway turned out to be thermodynamically and kinetically unfavourable (section S2 in the ESI).
33 D. Marx, ChemPhysChem, 2006, 7, 1848–1870.
34 E. Alberico, A. J. J. Lennox, L. K. Vogt, H. Jiao, W. Baumann, H.-J. Drexler, M. Nielsen, A. Spannenberg, M. P. Checinski, H. Junge and M. Beller, J. Am. Chem. Soc., 2016, 138, 14890–14904.
35 Hydrogen production from complex 2'B was reported in our previous study.18
36 Removing the Htrans moiety as a hydride from the catalytic
system generates a cationic complex 2’+. CH activation from complex 2’+ resulted in a low barrier pathway (< 20 kcal mol-1) for dehydrogenation of methanol, further demonstrating the repulsive nature of the Htrans moiety. See details in Section S7 in the ESI.
37 Equivalently one can state that the Lewis acidity of the metal center and Bronsted basicity of the ligand in complex 2' are the most important parameters that govern the mechanism and activation energy barrier for the dehydrogenation of methanol.
38 Noyori-Morris mechanism: Both Ru and Ndae participate directly in the mechanism with Ru receiving the hydride from C-H and Ndae receiving simultaneously the proton formed upon cleavage of the O-H bond in methanol/methanediol/formic acid. Metal-centered mechanism:The O-H bond in methanol/methanediol/formic acid is already deprotonated in a separated step. The transition state for C-H cleavage only involves transfer of a hydride moiety to the metal center. Ndae does not participate directly in the mechanism because it is protonated.
39 B. Meyer, B. Sawatlon, S. Heinen, O. A. von Lilienfeld and C. Corminboeuf, Chem. Sci., 2018, 9, 7069–7077.
40 M. Busch, M. D. Wodrich and C. Corminboeuf, Chem. Sci., 2015, 6, 6754–6761.

download fileview on ChemRxivManuscript-trop2-04-07-2019_B_EJM_chemRxiv.pdf (1.69 MiB)

S1
Supporting Information for:
An In-Depth Mechanistic Study of Ru Catalysed
Aqueous Methanol Dehydrogenation and Prospects
for Future Catalyst Design
Nitish Govindarajan†a, Vivek Sinha†b, Monica Trincadoc, Hansjörg Grützmacher*c,
Evert Jan Meijer*a, Bas de Bruin*b
a Amsterdam Center for Multiscale Modeling and Van ‘t Hoff Institute for Molecular Sciences.
Science Park 904, 1098 XH, Amsterdam, The Netherlands.
b Homogeneous, Supramolecular and Bio-Inspired Catalysis, Van ‘t Hoff Institute for Molecular
Sciences, Science Park 904, 1098 XH, Amsterdam, The Netherlands
c Department of Chemistry and Applied Biosciences, ETH Zürich, Zürich CH-8093, Switzerland
Corresponding Authors:
[email protected] (H. Grützmacher)
[email protected] (E. J. Meijer)
[email protected] (B. de Bruin)
† These authors contributed equally to this work
S2
Table of Contents
S1. COMPUTATIONAL METHODS 3
S2. CATALYST ACTIVATION 4
S3. POTENTIAL ENERGY SURFACE (PES) FOR CH ACTIVATION IN METHOXIDE FROM COMPLEX 2’A’ WITHOUT EXPLICIT SOLVENT 6
S4. STERIC HINDRANCE DURING FORMIC ACID DEHYDROGENATION 6
S5. MERP FOR DEHYDROGENATION OF METHANOL, METHANEDIOL AND FORMIC ACID 7
S6. MERP FOR HYDROGEN PRODUCTION VIA THE DIRECT PATHWAY 9
S7. MERP FOR METHANOL DEHYDROGENATION OVER THE CATIONIC COMPLEX 2’+ 9
S8. ESTIMATION OF PROTON AFFINITY (PKA) FOR COMPLEXES 1 AND 2’ USING DFT-MD 10
S8. CONSTRAINED FORCE PROFILES 12
S9. REVERSIBLE DEPROTONATION OF METHANOL 13
S10. ENERGY TABLES 13
S11. 3D REPRESENTATION OF ALL THE COMPLEXES 15
S12. XYZ COORDINATES 15
S3
S1. Computational Methods
All DFT geometry optimizations were carried out with the Turbomole1 program coupled to the
PQS Baker optimizer2 via the BOpt package.3 The BP86 functional4,5 with a Turbomole def2-
TZVP basis set for all atoms was used for optimization of geometries as minima or transition
states. The resolution-of-identity (ri) approximation6 was employed to speed up calculations in
conjunction with def2-TZVP/J auxiliary basis set.7 To include dispersion interactions, all
calculations include Grimme’s dispersion corrections (D3 version).8 Hessian matrix calculations
were performed to characterize all minima (no imaginary frequencies) and transition states (one
imaginary frequency). IRC calculations were performed to confirm the nature of the transition
states. Thermochemical parameters such as the zero-point energy, enthalpy, and Gibbs free energy
were calculated using the gas phase Hessian computed at the BP86/def2-TZVP level of theory.
Improved (free) energies were obtained with single-point calculations using the B3LYP hybrid
exchange functionals, together with implicit solvent corrections (COSMO)9 using the dielectric
constant of water (80.1) on the gas phase geometry optimized using the BP86 functional.
The reactions incorporating explicit water solvent were studied using DFT-based molecular
dynamics (DFT-MD) with the Born-Oppenheimer approach, as implemented in the CP2K
package.10 We used the BLYP functional supplemented by Grimme’s D3 dispersion
corrections,8,11 with GTH pseudopotentials for the nonvalance electrons (DZVP-GTH for Ru and
TZVP-GTH for all other atom types). 12 The auxiliary plane waves were expanded up to 280 Ry.
The system consisted of complexes in this study with 108 water molecules in a periodic cubic box
(L=16 Å) for the explicitly solvated periodic system. The temperature was controlled by a CSVR
thermostat and set at T = 360 K,13 and a time step of 0.5 fs was used in our simulations. We used
the constrained molecular dynamics (CMD) method to simulate the reactions and determine the
associated free energy profiles.14,15 In this method, using a chosen reaction coordinate, Q,
simulations are performed at several fixed values of this coordinate, ranging from Q1 to Q2. The
free-energy difference (∆G) upon changing from Q1 to Q2 is then computed according to Eq. (1) :
∆𝐺 = − ∫ ⟨𝐹(𝑄)⟩𝑑𝑄𝑄2
𝑄1 (1)

S4
Here, ⟨(Q)⟩ is the average constraint force measured for each value of Q during the DFT-MD
simulation. For each value of Q, a 3 ps equilibration run, followed by a 10-12 ps production run
was performed. The data from production runs was used to compute the average forces and the
resulting free energies, with the corresponding error bars. The constraint force profiles are
provided in S8.
S2. Catalyst Activation
For the catalyst activation pathway, in addition to the protonation of the ligand nitrogen (Ndad)
presented in the main text, we also considered the direct protonation of the RuH moiety by a
solvent molecule. Here, the chosen reaction coordinate (Q) involves the cleavage of the solvent
OH bond and the simultaneous formation of the RuH bond, and is varied between 0.5 Å and
0.85 Å. As shown in Figure S1, we find a higher barrier (+15.3 kcal mol-1) and the process is less
endergonic (+15.1 kcal mol-1) than the protonation of Ndad by a solvent molecule shown in the
main text, suggesting that the latter is the operating mechanism for catalyst activation.

S5
Figure S1. (a) Free energy profile for the direct protonation of the RuH moiety by a solvent molecule in complex
1H obtained from constrained DFT-MD simulations. The reaction coordinate (Q) is shown in the left inset and (b)
Representative snapshots of the reactant state (Q = 0.5 Å) and the product state (Q = 0.85 Å) formed upon protonation
of the RuH moiety of complex 1H by a solvent molecule, forming a Ru-H2 adduct. The OH formed upon
deprotonation of the solvent molecule (enlarged) diffuses away into the solution via the Grotthuss mechanism
involving the highlighted solvent molecules.

S6
S3. Potential energy surface (PES) for CH activation in methoxide from complex 2’A’ without explicit solvent
Figure S2. The potential energy surface (PES) obtained for CH activation in methoxide from complex 2’A’ without
the presence of explicit solvent molecules. An entirely uphill PES is obtained indicating that the presence of explicit
solvent molecules can be essential for this process in assisting the cleavage of the CH bond.
S4. Steric hindrance during formic acid dehydrogenation
Figure S3. (a) CPK representation of 2'TS-1-CH3OH, showing the possibility of the interaction of a solvent molecule
with the CH bond being cleaved during methanol dehydrogenation, and (b) CPK representation of 2'TS-1-HCOOH,
where the approach of a solvent molecule close to the CH bond being cleaved during formic acid dehydrogenation
is sterically hindered.

S7
S5. MERP for dehydrogenation of methanol, methanediol and formic acid
(a) MERP for dehydrogenation of methanol to formaldehyde
(b) MERP for dehydrogenation of methanediol to formic acid

S8
(c) MERP for dehydrogenation of formic acid to CO2
The MERPs for dehydrogenation of methanol, methanediol and formic acid for complex 2’ with
the corresponding free energies (G298) in kcal mol-1 (BP86//B3LYP(Water)).

S9
S6. MERP for hydrogen production via the direct pathway
As mentioned in the main text, the barrier for direct H2 production from complex 2’B (25.4 kcal
mol -1 (BP86//B3LYP (Water)) is much higher than solvent enabled pathways for H2 production.
S7. MERP for methanol dehydrogenation over the cationic complex 2’+

S10
(Top) Cationic complex 2’+ is generated by the removal of a Htrans moiety (from Ru-H bond) in complex 2’. (Bottom)
The computed MERP for methanol dehydrogenation to formaldehyde over the cationic complex with the
corresponding free energies (G298) in kcal mol-1 (BP86//B3LYP(Water)).
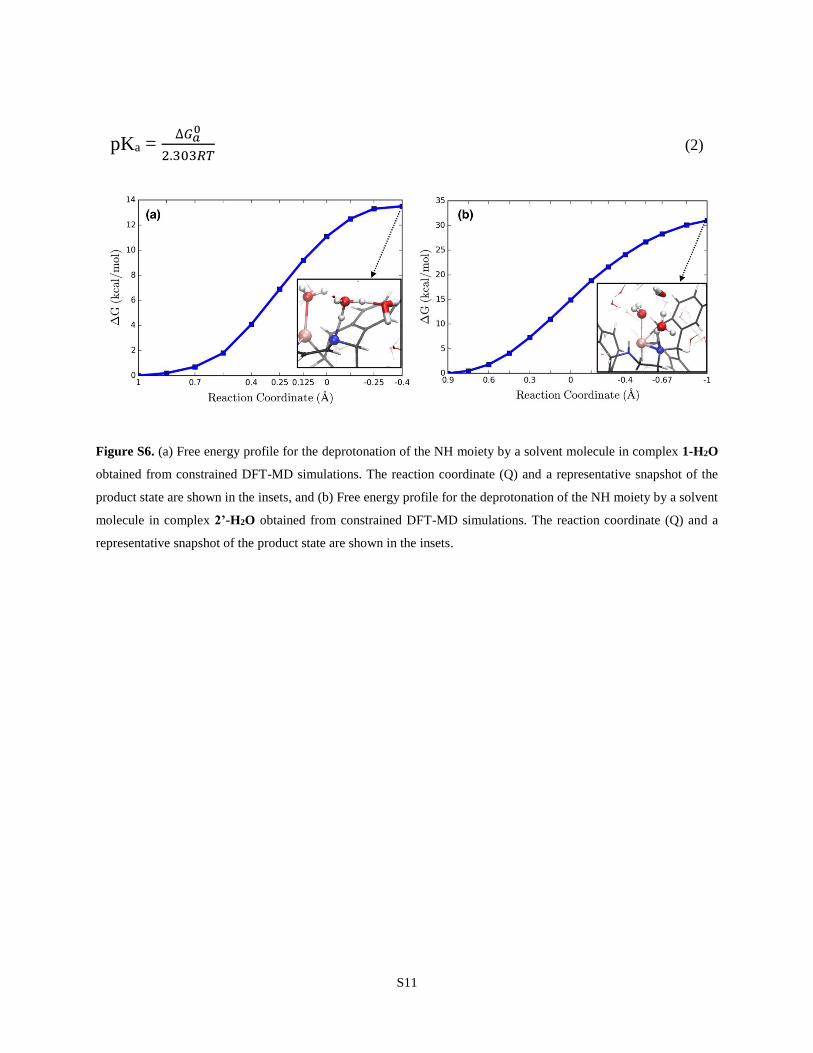
S8. Estimation of Proton Affinity (pKa) for Complexes 1 and 2’ using DFT-MD
As mentioned in the main text, estimating the proton affinities of the active catalytic complexes in
the Ru(trop)dad system is important to determine the role of the ligand NH moiety in the catalytic
cycle. In this regard, we used DFT-MD with an explicit water solvent to estimate the pKa of
complexes 1-H2O and 2’-H2O. We performed constrained dynamics simulations with the OHN
asymmetric stretch as the reaction coordinate (Q) to determine the associated free energies for
deprotonation of the NH moiety in these complexes (∆𝐺𝑎0). These simulations start with cationic
complexes 1-H2O and 2’-H2O (charge = +1). For 1-H2O, the free energy for deprotonation is
estimated to be +13.5 kcal mol-1 as shown in Figure S6. This results in a pKa of 10, computed
using Equation 2. For complex 2’-H2O, we find a much higher free energy for deprotonation (31
kcal mol-1), and the corresponding pKa is 23. These values are reported in the main text, along with
the pKa value of the [Ru(PNP)] system reported in our previous study.16
S11
pKa = ∆𝐺𝑎
0
2.303𝑅𝑇 (2)
Figure S6. (a) Free energy profile for the deprotonation of the NH moiety by a solvent molecule in complex 1-H2O
obtained from constrained DFT-MD simulations. The reaction coordinate (Q) and a representative snapshot of the
product state are shown in the insets, and (b) Free energy profile for the deprotonation of the NH moiety by a solvent
molecule in complex 2’-H2O obtained from constrained DFT-MD simulations. The reaction coordinate (Q) and a
representative snapshot of the product state are shown in the insets.

S12
S8. Constrained Force Profiles
(a) Catalyst Activation (b) C-H activation
(c) Hydrogen Production (Ru[(trop2)dad]) (d) Hydrogen Production (Ru[(trop2)dae])

S13
S9. Reversible deprotonation of methanol
We also computed a pathway for reversible deprotonation of an agnostic methanol adduct over
complex 2’. We have omitted this pathway in the main text for simplicity.
S10. Energy Tables
Species SCF ZPE Hcorr Gcorr SCF+ZPE H G
Md1 -2013.63186 0.68176 0.72834 0.60557 -2012.9501 -2012.90352 -2013.02629
Md2 -2013.614927 0.67957 0.72567 0.60565 -2012.935357 -2012.889257 -2013.009277
TSMd3 -2013.602494 0.67645 0.72272 0.60186 -2012.926044 -2012.879774 -2013.000634
Md4 -2013.623053 0.67891 0.7245 0.60502 -2012.944143 -2012.898553 -2013.018033
F1 -2012.464326 0.65946 0.70559 0.58412 -2011.804866 -2011.758736 -2011.880206
F2 -2012.448867 0.65844 0.70322 0.58488 -2011.790427 -2011.745647 -2011.863987
TSF3 -2012.428159 0.6546 0.69993 0.58024 -2011.773559 -2011.728229 -2011.847919
F4 -2012.434716 0.65572 0.70171 0.57916 -2011.778996 -2011.733006 -2011.855556
S3 -1438.720145 0.46141 0.4889 0.40625 -1438.258735 -1438.231245 -1438.313895
M1 -1785.494767 0.62718 0.66693 0.55826 -1784.867587 -1784.827837 -1784.936507
M2 -1785.497327 0.62889 0.66835 0.56186 -1784.868437 -1784.828977 -1784.935467
M3 -1785.475034 0.6247 0.66543 0.5551 -1784.850334 -1784.809604 -1784.919934
TSM4 -1785.471382 0.62117 0.66085 0.55349 -1784.850212 -1784.810532 -1784.917892
M5 -1785.473917 0.62348 0.66339 0.55546 -1784.850437 -1784.810527 -1784.918457
TSM6 -1785.451595 0.62322 0.66227 0.55682 -1784.828375 -1784.789325 -1784.894775
M7 -1785.457571 0.62321 0.66318 0.55591 -1784.834361 -1784.794391 -1784.901661
M8 -1670.944195 0.59474 0.63114 0.53089 -1670.349455 -1670.313055 -1670.413305
H1 -1441.597487 0.52241 0.55034 0.46751 -1441.075077 -1441.047147 -1441.129977
TSH2 -1441.549272 0.51553 0.54368 0.45983 -1441.033742 -1441.005592 -1441.089442
SF1 -1884.786485 0.62308 0.66336 0.55515 -1884.163405 -1884.123125 -1884.231335
SF2 -1884.759088 0.6186 0.65925 0.55036 -1884.140488 -1884.099838 -1884.208728

S14
TSSF3 -1884.762072 0.6187 0.65918 0.55101 -1884.143372 -1884.102892 -1884.211062
SCO1 -1859.527993 0.60713 0.64745 0.53751 -1858.920863 -1858.880543 -1858.990483
TSSCO2 -1859.484401 0.60284 0.64272 0.53565 -1858.881561 -1858.841681 -1858.948751
SCO3 -1859.491476 0.6029 0.64397 0.53333 -1858.888576 -1858.847506 -1858.958146
SSi1 -2076.154839 0.64449 0.68698 0.5737 -2075.510349 -2075.467859 -2075.581139
SSi2 -2076.146909 0.64231 0.68586 0.56991 -2075.504599 -2075.461049 -2075.576999
TSSi3 -2076.114826 0.64036 0.6825 0.57129 -2075.474466 -2075.432326 -2075.543536
M1_cat -1555.380097 0.54641 0.57872 0.4856 -1554.833687 -1554.801377 -1554.894497
TSM2_cat -1555.351621 0.54147 0.5719 0.48351 -1554.810151 -1554.779721 -1554.868111
M3_cat -1555.372133 0.54484 0.57702 0.4834 -1554.827293 -1554.795113 -1554.888733
ZPE = Zero-point energy correction
Hcorr = correction to enthalpy (H)
Gcorr = correction to Gibbs free energy (G)

S15
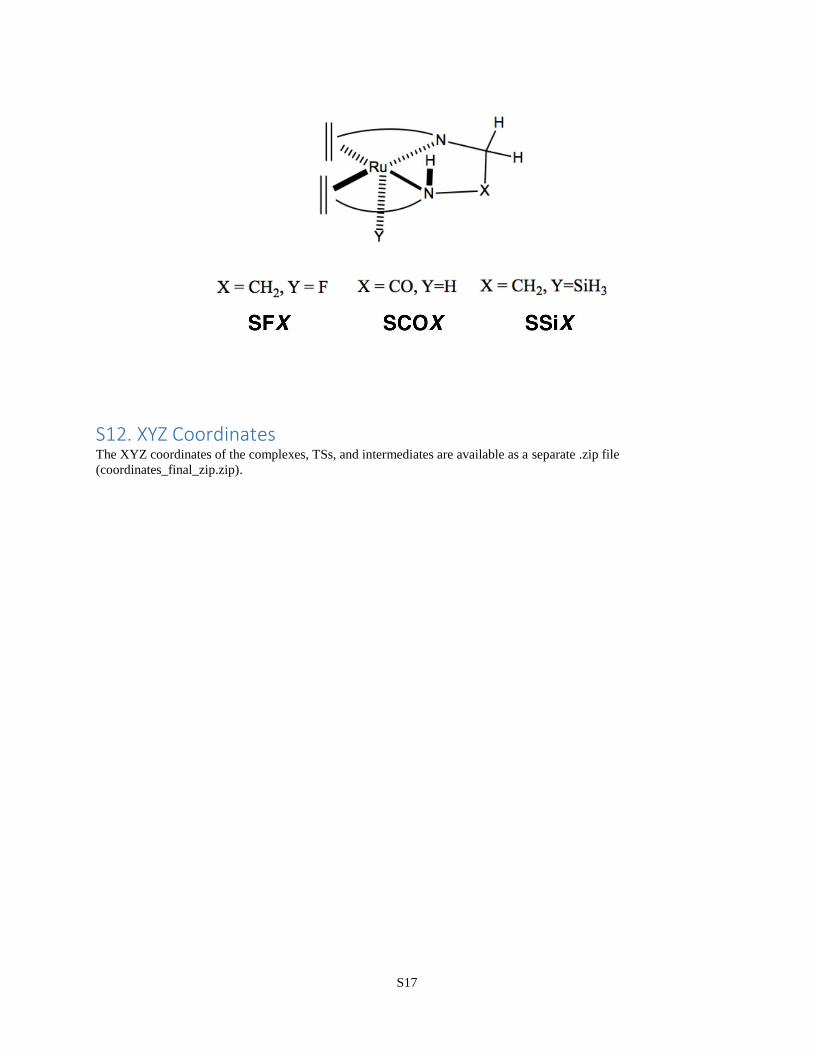
S11. 3D representation of all the complexes
We have used a different naming scheme compared to the main text in the ESI. The figure below which shows the
correspondence between the nomenclature used in the main text and the ESI for dehydrogenation of methanol
(intermediates named as MX (X = 1,2,3 …)). Corresponding intermediates in the catalytic cycle of methanediol and
formic acid are named as MdX and FX (X = 1,2,3 …) respectively.

S16
S17
S12. XYZ Coordinates The XYZ coordinates of the complexes, TSs, and intermediates are available as a separate .zip file
(coordinates_final_zip.zip).

S18
References in the Supporting Information
(1) University of Karlsruhe and Forschungszentrum Karlsruhe GmbH. TURBOMOLE V7.1; TURBOMOLE
GmbH, 2016
(2) Baker, J. An Algorithm for the Location of Transition States. J. Comput. Chem. 1986, 7 (4), 385–395.
(3) Budzelaar, P. H. M. Geometry Optimization Using Generalized, Chemically Meaningful Constraints. J.
Comput. Chem. 2007, 28 (13), 2226–2236.
(4) Perdew, J. P. Density-Functional Approximation for the Correlation Energy of the Inhomogeneous Electron
Gas. Phys. Rev. B 1986, 33 (12), 8822–8824.
(5) Becke, A. D. Density-Functional Exchange-Energy Approximation with Correct Asymptotic Behavior.
Phys. Rev. A 1988, 38 (6), 3098–3100.
(6) Sierka, M.; Hogekamp, A.; Ahlrichs, R. Fast Evaluation of the Coulomb Potential for Electron Densities
Using Multipole Accelerated Resolution of Identity Approximation. J. Chem. Phys. 2003, 118 (20), 9136–
9148.
(7) Weigend, F.; Ahlrichs, R. Balanced Basis Sets of Split Valence, Triple Zeta Valence and Quadruple Zeta
Valence Quality for H to Rn: Design and Assessment of Accuracy. Phys. Chem. Chem. Phys. 2005, 7 (18),
3297–3305.
(8) Grimme, S.; Antony, J.; Ehrlich, S.; Krieg, H. A Consistent and Accurate Ab Initio Parametrization of
Density Functional Dispersion Correction (DFT-D) for the 94 Elements H-Pu. J. Chem. Phys. 2010, 132
(15), 154104.
(9) Klamt, A.; Schuurmann, G. COSMO: A New Approach to Dielectric Screening in Solvents with Explicit
Expressions for the Screening Energy and Its Gradient. J. Chem. Soc.{,} Perkin Trans. 2 1993, No. 5, 799–
805.
(10) VandeVondele, J.; Krack, M.; Mohamed, F.; Parrinello, M.; Chassaing, T.; Hutter, J. Quickstep: Fast and
Accurate Density Functional Calculations Using a Mixed Gaussian and Plane Waves Approach. Comput.
Phys. Commun. 2005, 167 (2), 103–128.
(11) Lee, C.; Yang, W.; Parr, R. G. Development of the Colle-Salvetti Correlation-Energy Formula into a
Functional of the Electron Density. Phys. Rev. B 1988, 37 (2), 785–789.
(12) Goedecker, S.; Teter, M.; Hutter, J. Separable Dual-Space Gaussian Pseudopotentials. Phys. Rev. B 1996, 54
(3), 1703–1710.
(13) Bussi, G.; Donadio, D.; Parrinello, M. Canonical Sampling through Velocity Rescaling. J. Chem. Phys.
2007, 126 (1), 14101.
(14) Carter, E. A.; Ciccotti, G.; Hynes, J. T.; Kapral, R. Constrained Reaction Coordinate Dynamics for the
Simulation of Rare Events. Chem. Phys. Lett. 1989, 156 (5), 472–477.
(15) Sprik, M.; Ciccotti, G. Free Energy from Constrained Molecular Dynamics. J. Chem. Phys. 1998, 109 (18),
7737–7744.
(16) Sinha, V.; Govindarajan, N.; de Bruin, B.; Meijer, E. J. How Solvent Affects C–H Activation and Hydrogen
Production Pathways in Homogeneous Ru-Catalyzed Methanol Dehydrogenation Reactions. ACS Catal.
2018, 8 (8), 6908–6913.

download fileview on ChemRxivSI-M4-06-07-2019_B-EJM.pdf (2.35 MiB)