Embed Size (px)
Citation preview

An in-depth comparison of the porcine, murine and human immune responses; lessons from the
genome and transcriptome.
Harry Dawson

Porcine Models Used/Developed by DGIL Scientists
Animal Disease Models Novel Antihelminthics/Immunomodulators Foot and Mouth Disease Bt Crystal Protein Porcine Reproductive and Respiratory Syndrome Virus T. suis-derived Products
Animal and Human Disease Models Parasite Infection and Vaccine Efficacy Ascaris Anthrax Salmonella Circovirus Toxoplasma Mycoplasma Trichinella Trichuris Phytonutrients
Cocoa FlavenoidsHuman Disease Models Proanthocyanidins Obesity
Transgenic ModelsLipid Metabolism Targeted BCL2 Expression
Micronutrient Effects on Immunity Prebiotics and Probiotics Vitamin A Inulin Vitamin D Lactobacillus and Bifidobacteria

Animals Used For Experiments, European Union 2008

Controversy
Prototypic mouse M2 markers are not applicable (to humans) because there are no human homologs of particular genes (eg, Ym1 and Fizz1) or the gene is not regulated by these
cytokines in human macrophages (eg, Arginase 1)......the only gene regulated by IL-4 in the majority of conditions that was detectable with microarrays and proteomics was TGM2
(Martinez et al 2013).
In a direct comparison of mouse and human macrophages responding to LPS, only 30% of definitive orthologous genes that were induced in one species were
also induced in the other (Fairbairn 2011).

Swine are a scientifically and ethically acceptable intermediate species (rodent-human) for conducting scientific research relevant to humans.
Working Hypothesis

Comparative “omics” Analysis
2011 2012 2013
2015 2016 2016
Inflammasome Nutrigenomics Microbiome
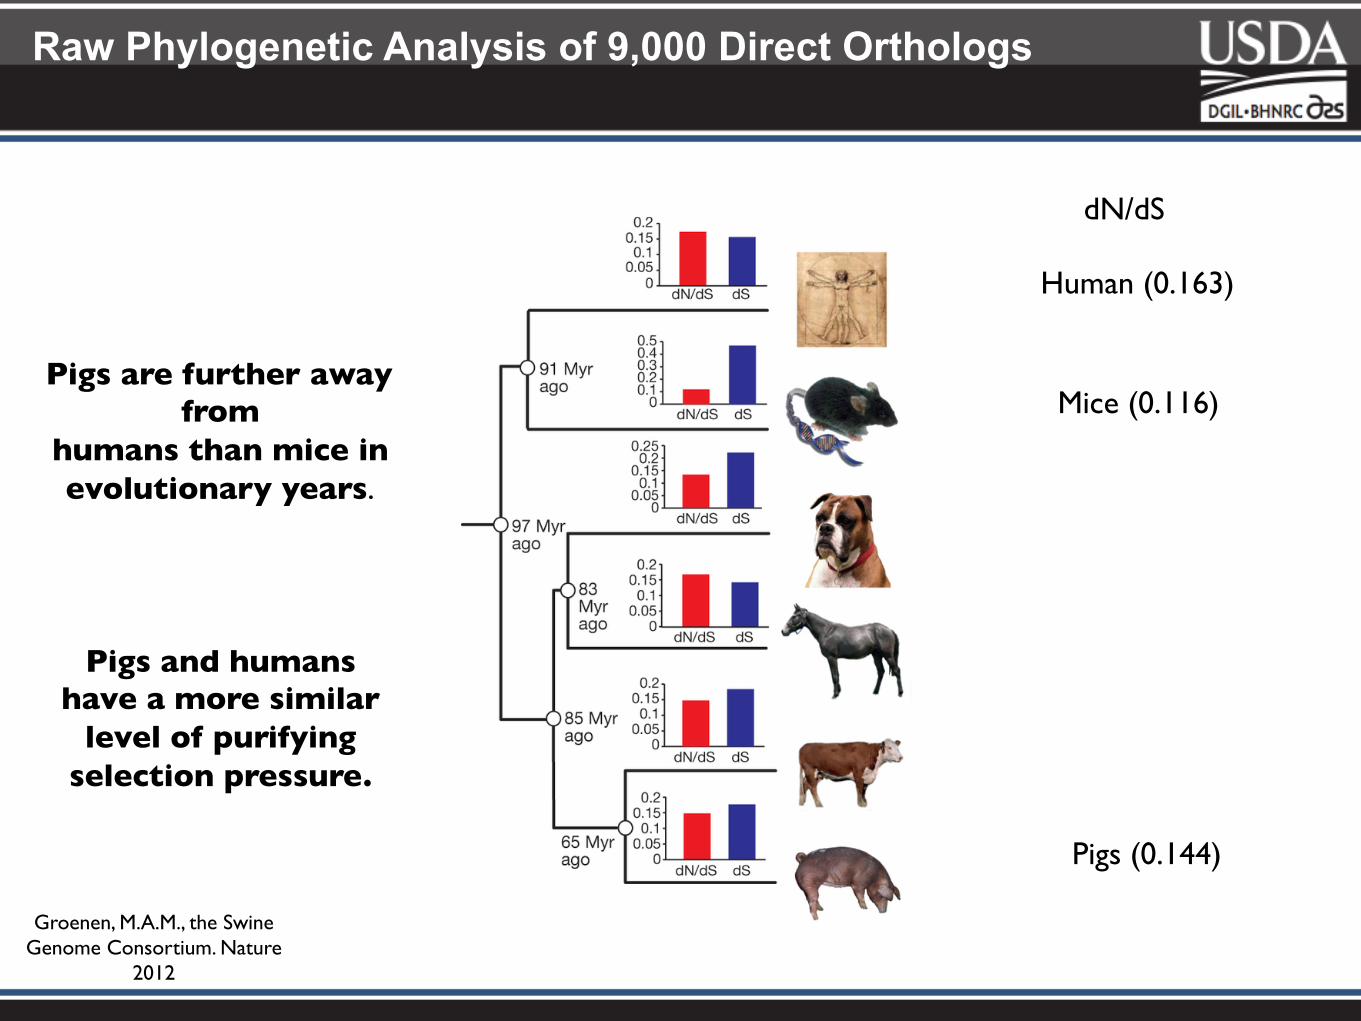
Raw Phylogenetic Analysis of 9,000 Direct Orthologs
Pigs are further awayfrom
humans than mice inevolutionary years.
Groenen, M.A.M., the Swine Genome Consortium. Nature
2012
Human (0.163)
Pigs (0.144)
Mice (0.116)
Pigs and humans have a more similar
level of purifying selection pressure.
dN/dS

Raw Protein Similarity Analysis for Immune Response Genes
Functional/Structural Category Pairs Pig Mouse Mean Pig vs. Mouse Significance
(N) (Identity ±
SE) (Identity ±
SE) Difference IL-3/CSF Receptors 3 55.7 ± 5.7 38.3 ± 7.4 -17.3 0.039 SIGLEC Family 3 68.3 ± 4.8 56.7 ± 8.2 -11.7 NS B7 Family 6 77.0 ± 5.5 65.7 ± 7.8 -11.3 0.032 Chemokine 28 72.8 ± 2.3 63.6 ± 2.4 -9.8 < 0.0001 Kiiller cell lectin-like receptor Subfamily 6 62.2 ± 2.3 52.5 ± 2.8 -9.7 0.0009 Interferon Receptor 4 61.3 ± 3.1 51.8 ± 2.5 -9.5 0.023 TNF Superfamily 13 79.8 ± 2.2 70.8 ± 3.4 -9.0 0.0003 CD Marker, LAMP Superfamily 4 69.2 ± 2.8 60.0 ± 3.0 -9.0 NS SLAM Family 9 63.4 ± 2.6 55.5 ± 3.1 -8.0 < 0.0001 Cytokine 25 75.7 ± 1.8 68.8 ± 2.4 -6.8 < 0.0001 Cytokine Receptor 63 79.3 ± 1.4 72.5 ± 1.8 -6.8 < 0.0001 C-type lectin-like Pattern Recognition Receptor 13 74.4 ± 3.1 68.5 ± 2.4 -5.9 0.005 Pattern Recognition Receptor (PRR) 38 77.3 ± 1.3 73.1 ± 1.6 -4.5 < 0.0001 ......... ......... .........
32 71.4 ± 2.1 67.3 ± 2.3 -4.1 0.0004 TREM and TREM-like Receptor Family 4 61.5 ± 4.8 57.8 ± 5.8 -3.8 NS Acute Phase Reactant 38 75.2 ± 1.4 71.8 ± 1.5 -3.3 0.0001 Transcription Factor 121 93.3 ± 0.5 90.4 ± 0.7 -2.9 < 0.0001 Adhesion Molecule 40 76.8 ± 2.2 74.3 ± 2.2 -2.5 0.018 CD Marker, Peptidase 10 84.2 ± 1.8 81.8 ± 2.2 -2.4 NS Cadherin Family 7 93.0 ± 3.3 91.1 ± 3.4 -2.0 0.018 Tetraspanin Superfamily 9 88.9 ± 2.9 87.7 ± 2.4 -1.4 NS Membrane-spanning 4-domains Family 8 66.0 ± 4.0 65.1 ± 4.0 -0.9 NS
Total 677 80.1 ± 0.5 75.6 ± 0.6 -4.4 < 0.0001
Dawson, H. Comparative assessment of the pig, mouse, and human genomes. 2011.
Pigs are closer tohumans than mice in protein similarity.

Greater Pig-Human Similarity Revealed by Structural Motif Analysis
Dawson, H. Comparative assessment of the pig, mouse, and human genomes. 2011.
Key Pig-‐Human Similarity Mouse-‐Human Similarity Pig-‐Mouse Similarity
Protein Mouse Human Pig Similarity Protein Mouse Human Pig Similarity
APOBEC3 Zinc Deaminase Domain A B B FCER2 CD21-Binding Region Present Present Absent CCL26 Functional Domains +/- ++ ++ FCGR1A Ig Domains 2 3 3 CD8A V-set Domains 0 1 1 HCST (DAP10) Extracellular Motif Absent Present Absent CD19 Ig Domains 1 2 1 MX1 Nuclear Localization Domain Present Absent Absent CD33 Ig Domains 1 2 1 NAT6 RGD Domain Absent Present Present CD33 V-set Domains 0 1 0 NFKBIA, Ankyrin Repeat Domain Insertion Present Absent Present
CD34 Casein Kinase Phosphorylation Sites 1 1 0
IL-2 Polyglutamine Motif Present Absent Absent
CD34 Potential N-glycosylation Sites 6 9 8 IL7 Gene Exon 5 Absent Present Present CD55 Short Consensus Repeats 4 4 3 IL25 Exon Present Absent Present CD69 Isoforms 1 1 2 IL22RA2 Exon 3 Absent Present Absent CD72 -3 AA/+-3 AA No No Yes LIF Gene Alternative Exon Present Absent Absent CD84 V-set Domains 1 0 1 SIRPA potential N-glycosylation Sites 17 10 5 CD93 EGF-like Domains 2 3 3 SIRPB1 C320 Homodimerization Residue Absent Present Absent CD96 COG5099 Domain 0 1 0 NOD2 Leucine Rich Repeats 8 7 7 CD97 EGF-like Domains 3 4 2 NR3C1 Polyglutamine Motif Present Absent Absent CD177 LU Domains 4 2 2 SELE Sushi Domains 1 and 4 Present Present Absent
CD300B Cytoplasmic Tyrosine Signaling Motif Absent Present Absent
SELP CCP Domains 8 9 6
CSF1R Ig Domains 4 2 4 SELP EGF-CA Domains 1 0 0 DLK1 Isoforms 6 1 2 STAT2 Mini-satellite Insertion Yes No No DLK1-D Present Absent Absent TNIP3 ABIN Domains 1 2 2 DLK-A Present Present Absent VCAM1 Ig Domains 5 5 4 DMBT1 SR Motifs 7 13 4 VSIG4 Extracellular Ig Domains 0 1 1 EMR1 EGF-like Domains 5 4 7 ZBP1 Central D3 Domain 1 0 1
EP300 Pat1 Domain Absent Present Absent
ZBP1 C-terminal TBK1/IRF3 Interacting Domain 1 0 1
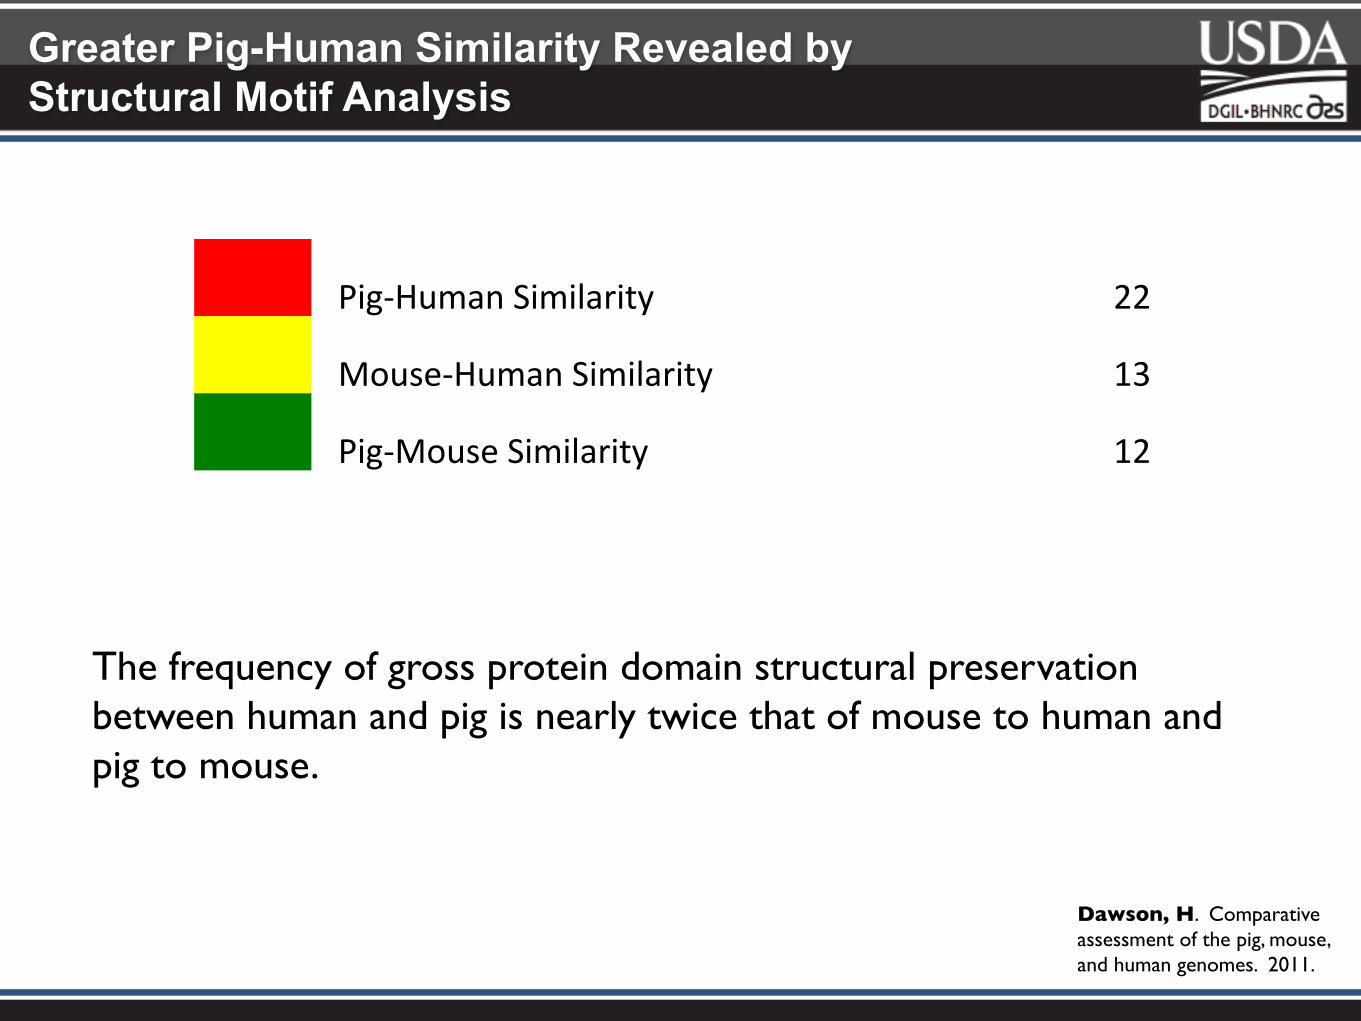
Greater Pig-Human Similarity Revealed by Structural Motif Analysis
Pig-‐Human Similarity 22
Mouse-‐Human Similarity 13
Pig-‐Mouse Similarity 12
The frequency of gross protein domain structural preservation between human and pig is nearly twice that of mouse to human and pig to mouse.
Dawson, H. Comparative assessment of the pig, mouse, and human genomes. 2011.

Greater Pig-Human Similarity Revealed by Unique Gene Analysis
A large scale analysis of immune response genes revealed that pigs have 11-, 6- and 2- fold less unique genes than do the mouse, cow or human Dawson H.D., the IRAG
Annotation GroupBMC Genomics 2013,

Greater Pig-Human Similarity Revealed by Gene Family Expansion Analysis
Key Expansion Contrac1on > 25% > 25% > 50% > 50% > 75% > 75%
Adapted and updated fromDawson H.D., the IRAG Annotation GroupBMC Genomics 2013,
Family Descrip1on Number
Human Pig Mouse ADP-‐ribosyltransferase/VIP2 Superfamily 4 4 5 Beta Defensin Superfamily 34 34 51 BPI Superfamily 12 14 16 C-‐type Lysozyme/LYZ1 Superfamily 9 7 9 Cathelicidin Superfamily 1 10 1 CCL Chemokine 28 21 39 CD1 Superfamily 5 4 2 CD163/WC1 Superfamily 3 4 4 CLECT Superfamily, Asialoglycoprotein and DC Receptor Subfamily 16 13 24 CLECT Superfamily, CollecWn Subfamily 7 7 7 CLECT Superfamily, NK Cell Receptor Subfamily 24 23 57 CLECT Superfamily, Reg Subfamily 5 3 7 CyWdine Deaminase-‐like Superfamily 11 5 5 GH18 ChiWnase Like Superfamily 6 7 9 Granzyme/Mast Cell Tryptase/Serine Protease Superfamily 17 18 26 Immunity Related Guanosine Triphosphatase Superfamily 3 4 19 NLR, Pyrin and AIM2-‐like Receptor Superfamily 29 21 43 ResisWn Superfamily 2 2 4 RNase A Family 14 13 22 SAA Superfamily 4 6 5 SLAM Superamily 9 11 9 Toll Like Receptor 10 10 12 TREM and TREM-‐like Receptor Superfamily; 7 6 10 TRIM E3 UbiquiWn-‐protein Ligase Superfamily, TRIM5 Subfamily 4 3 10 Type I Interferon, Alpha Subfamily 13 18 13 Type I Interferon, Beta Subfamily 1 1 1 Type I Interferon, Delta Subfamily 0 11 0 Type I Interferon, Epsilon Subfamily 1 1 1 Type I Interferon, Omega Subfamily 1 7 0 Type I Interferon, Tau Subfamily 0 0 0 Type I Interferon, Zeta Subfamily 0 0 9 ULBP Superfamily 6 7 2

Greater Pig-Human Similarity Revealed by Gene Family Expansion Analysis
Expansion Pig Mouse > 25% 4 8 > 50% 1 5 > 75% 3 5 Total 8 19
Contraction
> 25% 1 0 > 50% 3 0 > 75% 2 4 Total 6 4
Overall familial gene expansion of immune response genes in pigs relative to humans has occurred at less than half the rate of mice. Adapted and updated from
Dawson H.D., the IRAG Annotation GroupBMC Genomics 2013,

Greater Pig-Human Similarity Revealed by Gene Family Expansion Analysis of Pattern Recognition Receptors
Adapted and updated fromDawson H.D., the IRAG Annotation GroupBMC Genomics 2013,
Key Expansion Contrac1on > 25% > 25% > 50% > 50% > 75% > 75%
Familial gene expansion (>25%) of Pattern Recognition Receptors (PRRs) in mice occursin 7 out of 10 Superfamilies.
Family Descrip1on Number
Human Pig Mouse BPI Superfamily 12 14 16 CD1 Superfamily 5 4 2 CLECT Superfamily, Asialoglycoprotein and DC Receptor Subfamily 16 13 24 CLECT Superfamily, CollecWn Subfamily 7 7 7 CLECT Superfamily, NK Cell Receptor Subfamily 24 23 57 CLECT Superfamily, Reg Subfamily 5 3 7 NLR, AIM2-‐like Receptor and Pyrin Superfamiles 29 21 43 RIG-‐I-‐Like Receptor Superfamily 5 5 5 Toll Like Receptor 10 10 12 TREM and TREM-‐like Receptor Superfamily; 7 6 10

Recognition of E. coli MAMPs and PAMPS by Pattern Recognition Receptors (non exhaustive)
Superfamily Protein Ligand Referenece BPI LBP LPS Gutsmann 01 Complement C3 K capsular anWgen Van Dijk 79 DEXDc DDX33 Bacterial RNA Mitoma 13
NLR NLRP3
Bacterial mRNA, rRNA (h), tRNA (h), RNA:DNA hybrids Vanaja 13
NLR NOD1 Acetyl-‐muramyl-‐tripepWde (h), tetrapepWde (m) Pradipta 10
NLR NOD2 Muramyl dipepWde Girardin 03 TLR, NLR TLR2, NLRP3 E. coli curli amyloid Rapsinski 15 TLR, NLR TLR4, NLRP3 LPS Hoshino 99
TLR TLR7 tRNA (Phe, Lys), not (Tyr) or str. Nissle 1917 Gehrig 12, Jöckel 12
TLR TLR9 Unmethylated bacterial CpG DNA (species specific)
Bauer 01, Guzylack-‐Piriou 09
TLR TLR13 Unmethylated bacterial 23S rRNA (m) Li 13
TREM TREM2 LPS Daws 03

Comparison of NLR, AIM2-‐like Receptor and Pyrin Superfamily Associated
Inflammasomes

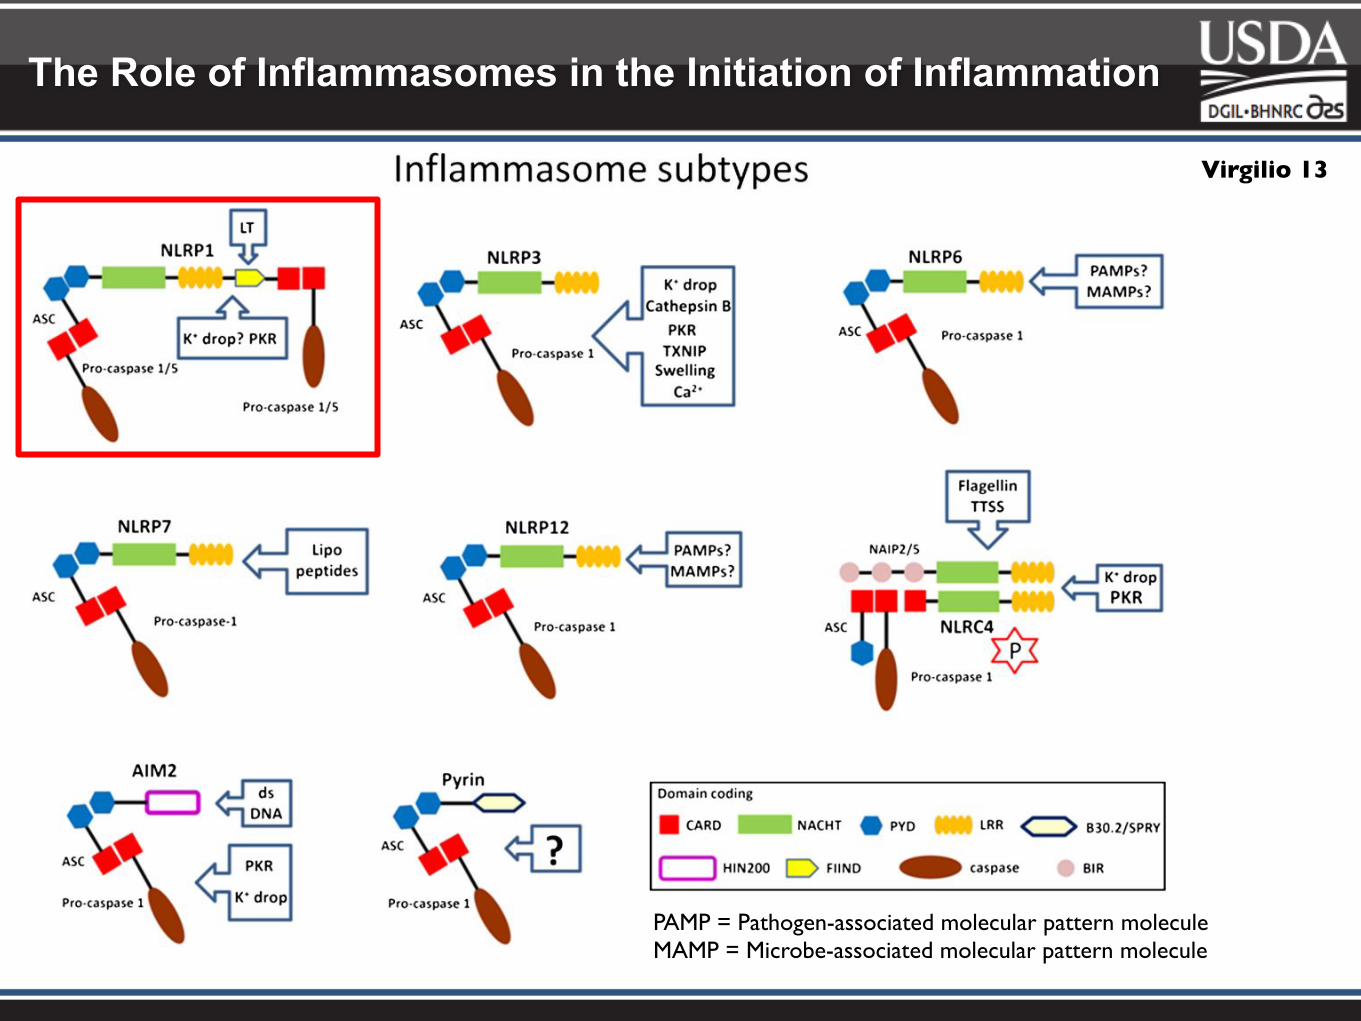
The Role of Inflammasomes in the Initiation of Inflammation
Virgilio 13
PAMP = Pathogen-associated molecular pattern molecule MAMP = Microbe-associated molecular pattern molecule
The Role of Inflammasomes in the Initiation of Inflammation
Virgilio 13
PAMP = Pathogen-associated molecular pattern molecule MAMP = Microbe-associated molecular pattern molecule

Comparison of NLRP1 Inflammasome Component Proteins
Domains
NACHT
LRR
FIIND
CARD
PYD
NAD
hNLRP1 1,473
pNLRP1 1,294
mNlrp1a 1,182
mNlrp1b 1,174
mNlrp1c 1,196
Protein Structure Size
193mPycard (Asc)
196hPYCARD (ASC)
195pPYCARD (ASC)

Mechanism of NLRP1 Activation in Human and Mice
Ratsimandresy 13

The Role of Inflammasomes in the Initiation of Inflammation
Virgilio 13
PAMP = Pathogen-associated molecular pattern molecule MAMP = Microbe-associated molecular pattern molecule

Comparison of Other PYD containing NLR Proteins
Domains
NACHT
LRR
FISNA
PYD
NAD
hNLRP4 994
933pNLRP4
982mNlrp4a
mNlrp4b 863
mNlrp4c 982
mNlrp4d 982
mNlrp4e 978
mNlrp4f 937
mNlrp4g 944
933pNLRP7
1,037hNLRP7
Protein Structure Size
1,060hNLRP12
1,058pNLRP12
pNLRP12L 1,050
1,054mNlrp12

The Role of Inflammasomes in the Initiation of Inflammation
Virgilio 13
PAMP = Pathogen-associated molecular pattern molecule MAMP = Microbe-associated molecular pattern molecule

Comparison of NLRC4 Inflammasome Component Proteins
Domains
NACHT
LRR
CARD
PYD
NAD
728pNLRC4
1,024hNLRC4
1,024mNlrc4
mNaip1 1,403
pNAIP
1,443mNaip2
mNaip5 1,403
mNaip6 1,403
mNaip7 1,402
hNAIP 1,403
Protein Structure Size

Deletion of the NLRC4 LRR from the Porcine Genomes

The Role of Inflammasomes in the Initiation of Inflammation
Virgilio 13
PAMP = Pathogen-associated molecular pattern molecule MAMP = Microbe-associated molecular pattern molecule

Phylogenetic Analysis of Pig, Mouse and Human AIM2 Receptor Superfamily Members
Porcine, human and mouseAIM2 Receptor Superfamilynomenclature doesn’t always correspond to protein homology.
Humans, rodents and horsesare the only species that possess AIM2

Comparison of Macrophage Transcriptomes

Simplified Schema1c of Macrophage Polariza1on
M1 macrophage
M2a macrophage
Resident macrophage LPS IFNγ
IL-‐4 IL-‐13
Promotes Th1 response: IL-‐12, TNFα IL-‐1b, IL-‐6
ReacWve oxygen intermediates Phagocytosis
Classic inflammatory
Promotes Th2 response:
Tissue remodeling
Allergic inflamma1on
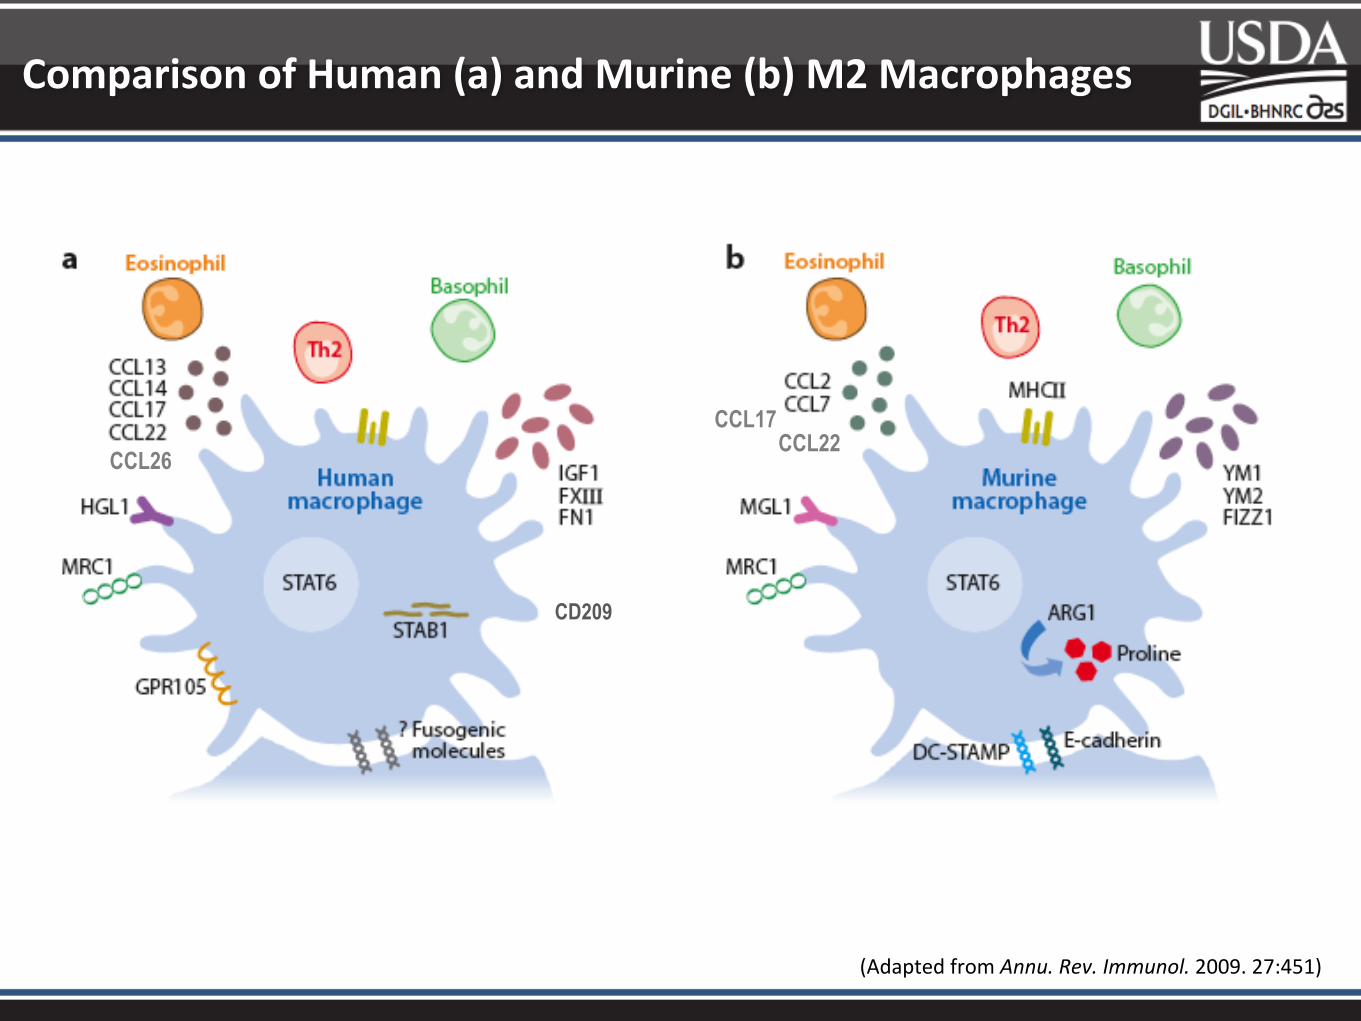
Comparison of Human (a) and Murine (b) M2 Macrophages
(Adapted from Annu. Rev. Immunol. 2009. 27:451)
CCL26
CD209
CCL17CCL22

Study Design
M1 macrophage
M2a macrophage
Alveolar macrophage (n = 4)
10 ng/ml E. coli. LPS +
5 ng/ml IFNγ
5 ng/ml IL-‐4
24 h Transcriptomes of mRNA and MicroRNA by Deep Sequencing
24, 48 and 74 h Transcriptomes by Real Wme PCR)
comparison to literature.
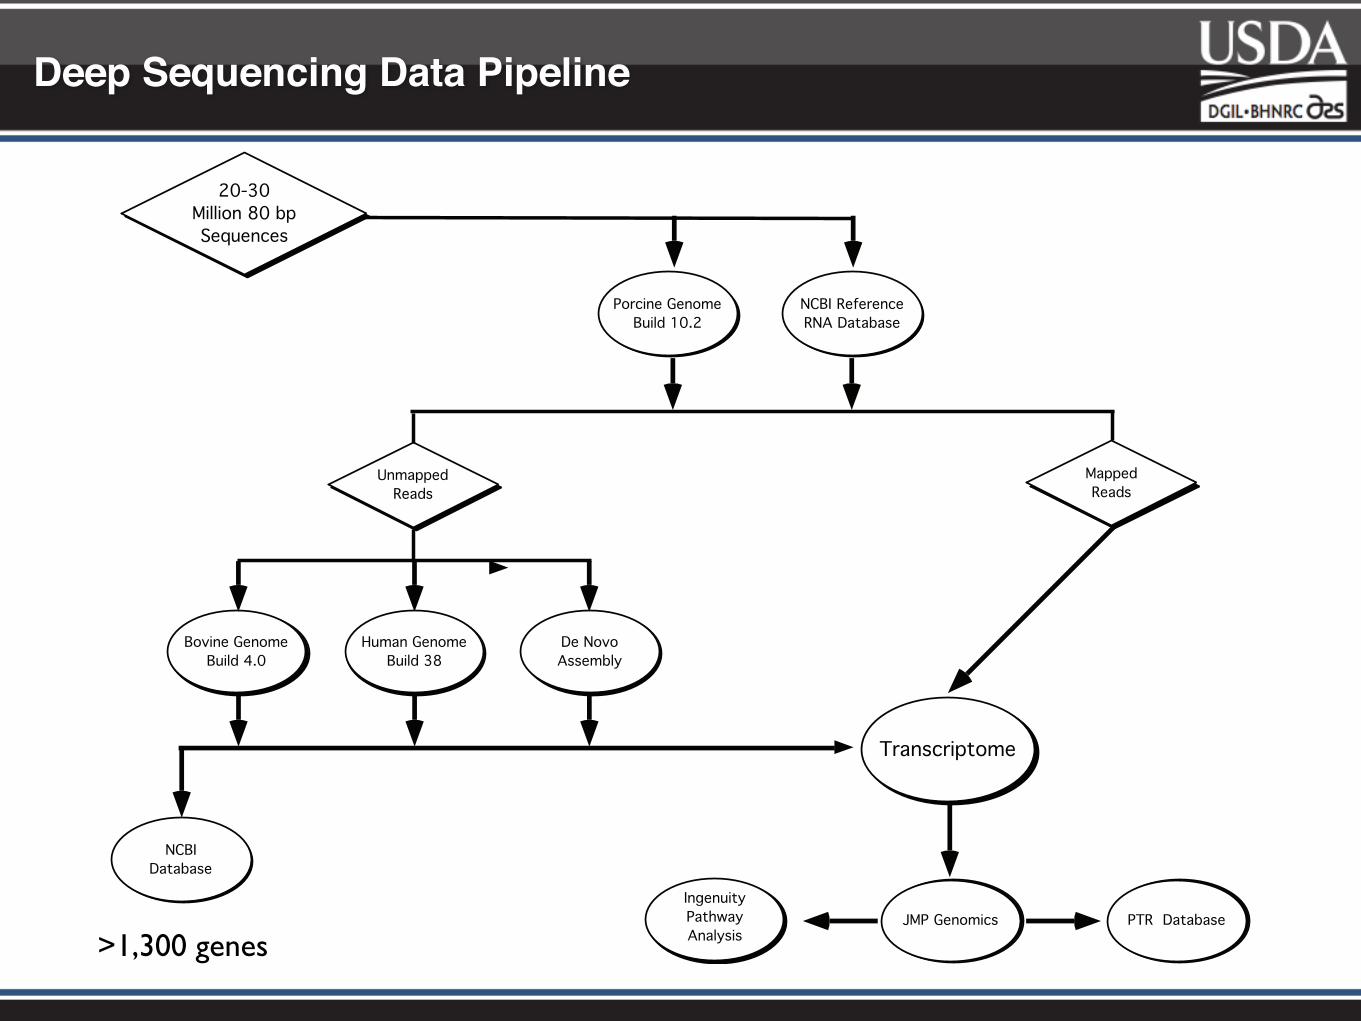
Deep Sequencing Data Pipeline
Transcriptome
Porcine GenomeBuild 10.2
NCBI ReferenceRNA Database
Bovine GenomeBuild 4.0
Human GenomeBuild 38
De NovoAssembly
MappedReads
IngenuityPathwayAnalysis
UnmappedReads
JMP Genomics
NCBIDatabase
20-30Million 80 bpSequences
PTR Database
>1,300 genes
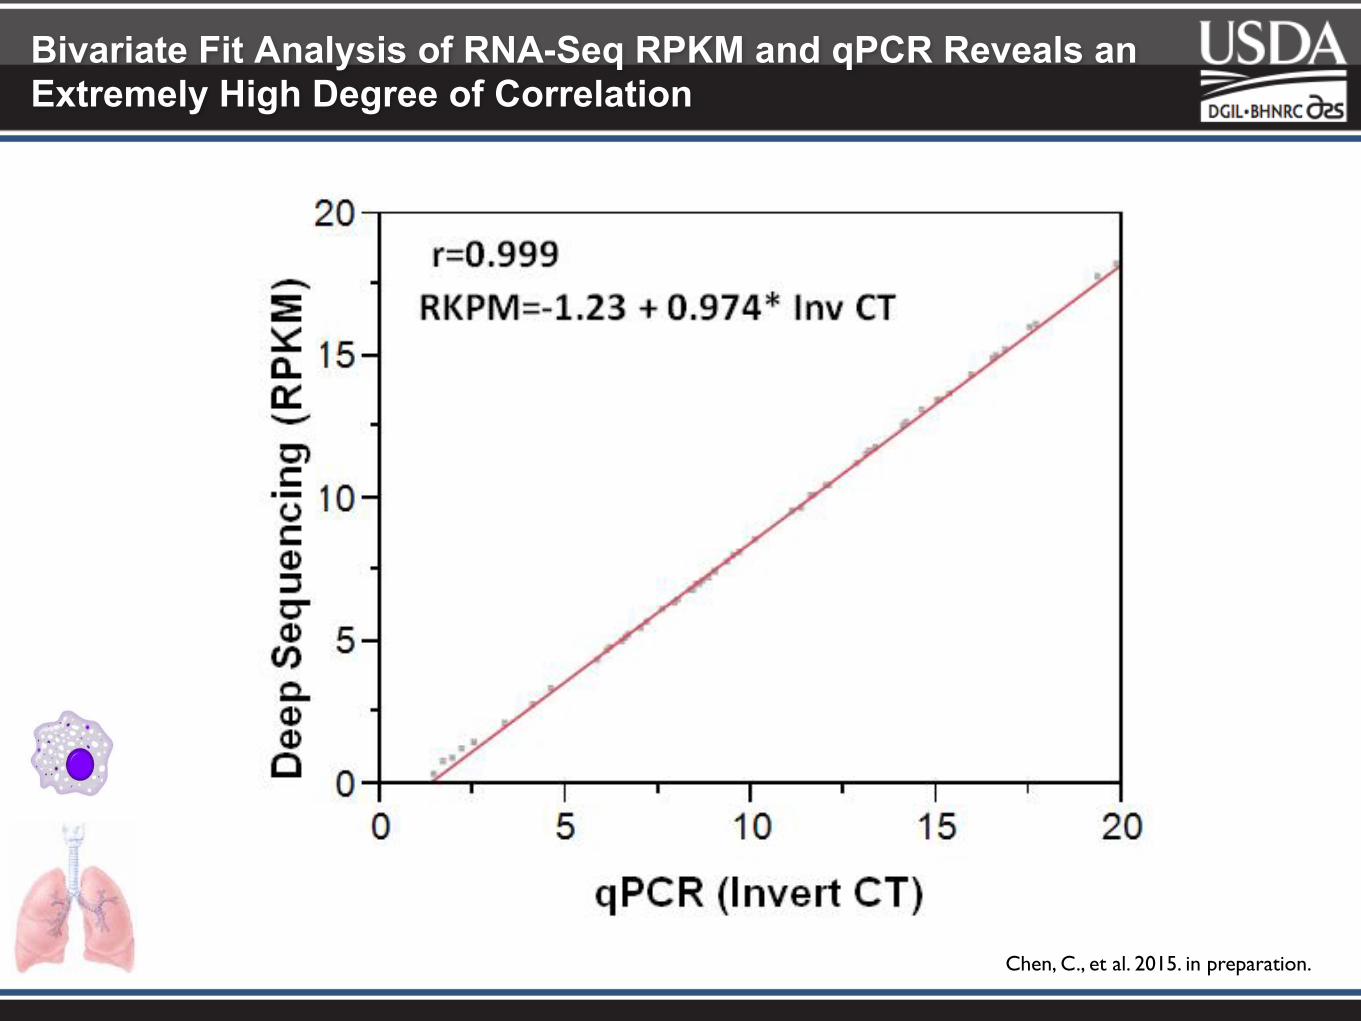
Bivariate Fit Analysis of RNA-Seq RPKM and qPCR Reveals an Extremely High Degree of Correlation
Chen, C., et al. 2015. in preparation.

-1.155 -0.924 -0.693 -0.462 -0.231
00.23090.46190.69280.92381.1547
WG 7,692 genes
IL4LPS/IFNG
Distribu1on of Differen1ally Expressed Genes

Gene M1&Fold Response Gene M2a&Fold ResponseTREM2 2105.9 H/M CCL21 276.1 H?/M?RAPGEF2 3.4 H EMR3 24.9 HSTAT4 3.5 H EMR4 22.2 MIFIT5 3.9 H TREM2 5.0 H/MPARP9 4.0 H TGM2 5.2 H/MIL7R 4.6 H NLRP12L 5.3 PGVIN1 5.5 M FN1 22.4 HIRF7 6.1 H SOCS1 31.3 H/MG0S2 7.2 H CD1A 31.6 HPPA1 9.5 H CCL17 41.6 H/MS100A9 10.9 H CD1E 92.1 HS100A12 11.0 H IL13RA2 301.6 H/MXAF1 13.3 H CD209 728.2 HTGM2 15.4 H?/M? NTRK1 1792.4 H?/M?IL8 59.3 HCCL20 762.2 HIL12B 1379.0 H/M
TNF 532.7 4.18E2164IL1B 643.2 5.61E284IL6 1391.0 8.36E218
Selected Differen1ally Expressed Genes
The transcriptomeinduced in porcine M1
and M2a macrophages at 24 h appears to be more
similar to humans

The Transcriptome of Pig M2a Macrophages are More Similar to Human
TREM2 *
IRF4 * *
5 to 15
15 to 45
45 to 135
-1.7 to 1.7
-15 to -45
-5 to -15
-1.7 to -5
-45 to -135
135 to 405
405 to 1215
1.7 to 5
-135 to -405
p < 0.05*
Fold Change
Significance
DCSTAMP n* * *
CCL2 ** *
CCL11 * * *
CCL17 * * *
7224 48
CCL22 ** *
TGM2 **
KDM6B *
CD209 ***
CCL26 * * *
Class/Molecule Human Mouse Pig C-‐type Lec1ns CD209 Y N Y Chemokines CCL2 N Y N CCL11 Y Y Y CCL17 Y Y Y CCL22 Y Y Y CCL26 Y N Y Miscellaneous DCSTAMP N Y N TGM2 Y Y Y TREM2 Y Y Y Transcip1on Factors IRF4 ? Y ?/Y Epigene1c Regulators KDM6B ? Y ?/Y Chi1nase/FIZZ Family Chi3l3 (Ym1) NA Y NA Chi3l4 (Ym2) NA Y NA Retnla (Fizz1) NA Y NA

Intraspecies Comparison of CD209
Feature Human Mouse PigGenes 1 6 1Isoforms 8 8 1Length CD209 (404) CD209a (238) CD209 (244)C Lectin/CRD 263-378 (115) 115-229 (114) 116-235 (119)Extracellular 345 165 178Neck Domain (AA) 205 43 50Regulation by IL-4 Y N* YDistribution DC > Mf DC > Mf DC > Mf
*Caminschi et al 11

Feature ID Fold
Change Control Means
LPS/IFG Means p-‐value Feature ID
Fold Change
Control Means
LPS/IFG Means p-‐value
miR-‐328-‐3p -‐3.7 2.8 0.8 1.37E-‐02 miR-‐141-‐3p 2.2 43.0 92.8 3.00E-‐02 miR-‐330-‐3p -‐2.6 3.3 1.3 1.90E-‐04 miR-‐155-‐5p 2.5 374.3 920.8 9.39E-‐07 miR-‐145-‐5p -‐2.4 5.5 2.3 2.34E-‐04 miR-‐2904 3.0 34.5 105.0 2.54E-‐03 miR-‐130b-‐5p -‐2.4 6.0 2.5 1.70E-‐02 miR-‐4792 3.0 181.5 547.8 9.28E-‐11 miR-‐744-‐5p -‐1.9 159.8 82.3 9.95E-‐04 miR-‐9-‐5p 3.0 11.3 33.3 2.54E-‐03 miR-‐194-‐5p -‐1.7 3.8 2.3 1.37E-‐02 miR-‐221-‐3p 3.6 737.0 2626.8 2.41E-‐04
miR-‐29b-‐1-‐5p -‐1.6 3.3 2.0 1.37E-‐02 miR-‐222-‐3p 3.6 112.5 406.5 2.04E-‐02 miR-‐151b -‐1.6 31.0 19.0 1.40E-‐02 miR-‐146a-‐5p 3.7 106.5 377.8 1.20E-‐02 miR-‐365-‐3p -‐1.6 47.5 30.0 1.37E-‐02 miR-‐6240 4.0 45.5 183.0 1.90E-‐04 miR-‐28-‐3p -‐1.6 1452.3 936.8 1.37E-‐02 miR-‐2889 4.2 5.8 24.8 1.70E-‐02 miR-‐28-‐5p -‐1.5 368.3 239.3 1.20E-‐02 miR-‐147-‐3p 5.1 123.8 613.5 1.60E-‐03 miR-‐301a-‐3p -‐1.5 95.8 63.0 1.20E-‐02 miR-‐222-‐5p 5.9 2.3 13.8 6.20E-‐06 miR-‐6724-‐5p 1.6 1.3 2.0 1.90E-‐04 miR-‐2340 6.0 1.0 6.5 5.37E-‐04 miR-‐215-‐5p 1.8 3.8 6.8 9.65E-‐03 miR-‐2487 6.1 1.5 9.8 4.51E-‐05 miR-‐4332 2.1 25.3 54.0 1.95E-‐02 miR-‐155-‐3p 20.3 0.3 7.5 5.85E-‐06
MicroRNA Expression in IFN-γ/LPS Treated Alveolar Mφs
The microRNAome induced in porcine M1 macrophages appears similar to humans
and mice.

The Role of miRNAs in the Resolution of Inflammation
The microRNAome induced in porcine M1
macrophages at 24 h appears to be between
the Immediate and Early Response

Automated and Manual Determination of Predicted Porcine Mir-155 Gene Targets
Fold Gene -‐5.7 PDCD4 -‐5.6 TP53INP1 -‐3.7 ZNF652 -‐2.4 INPP5D -‐1.9 FOXO3 -‐1.7 HIVEP2 -‐1.7 TM6SF1
AGO4 HSDL1 C1QL2 MPEG1 CA13 MYO1D CSF1R NFIA CYP51A1 OTUB2 F13A1 PODN FAM105A RGL1 FEZ2 RNF123 GNAS RNF149 GPM6B SGK3
Conserved Validated Targets in other Species (human, mouse)
Predicted from Ingenuity Pathway Analysis (human)

Conclusion
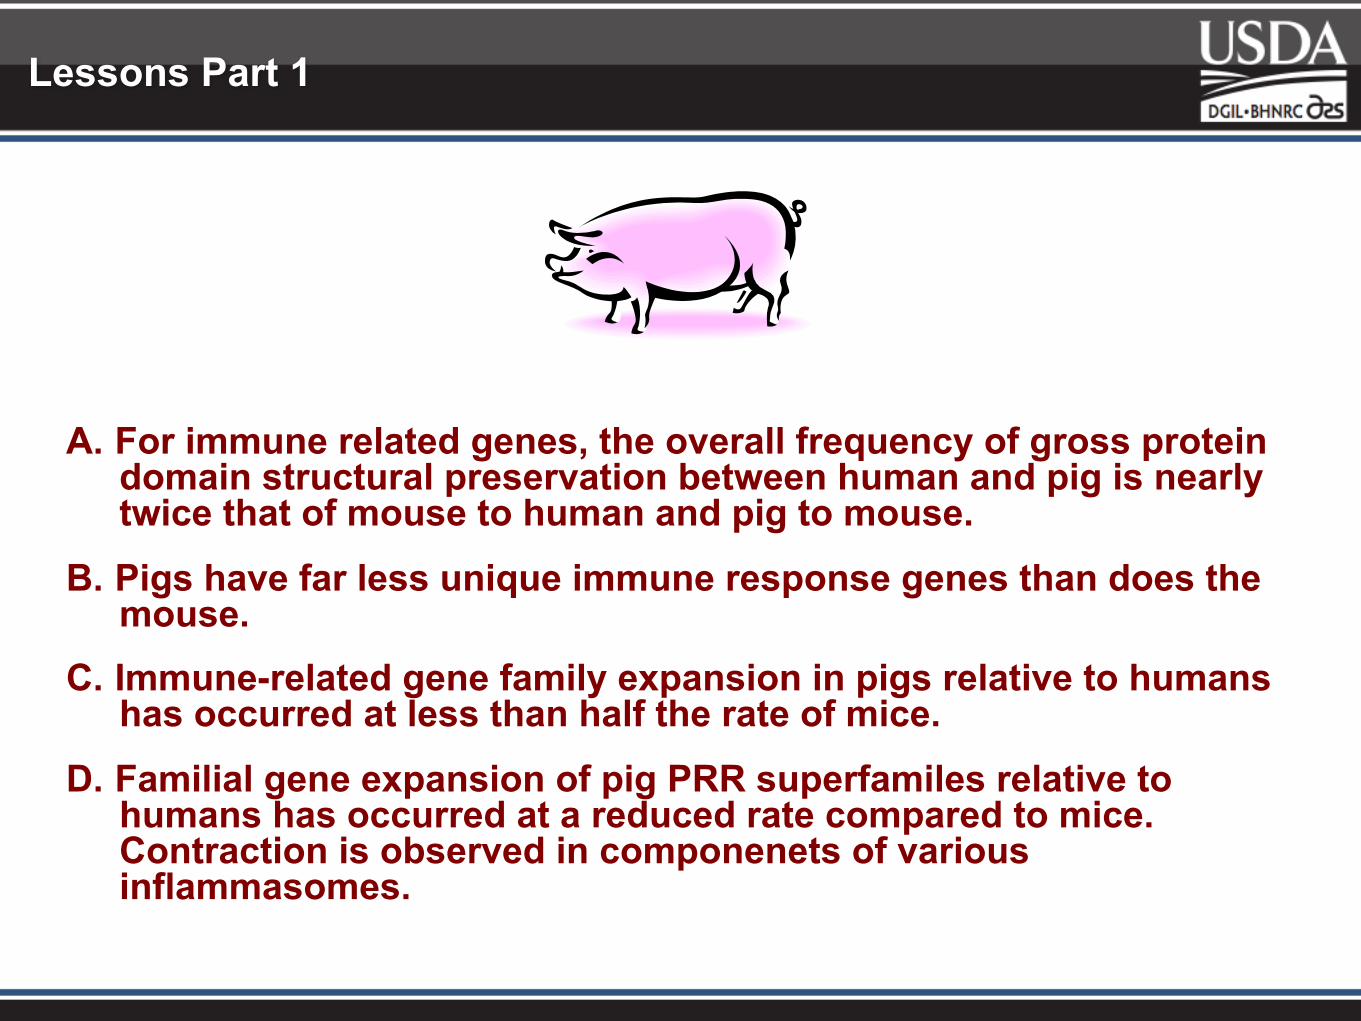
A. For immune related genes, the overall frequency of gross protein domain structural preservation between human and pig is nearly twice that of mouse to human and pig to mouse.
B. Pigs have far less unique immune response genes than does the mouse.
C. Immune-related gene family expansion in pigs relative to humans has occurred at less than half the rate of mice.
D. Familial gene expansion of pig PRR superfamiles relative to humans has occurred at a reduced rate compared to mice. Contraction is observed in componenets of various inflammasomes.
Lessons Part 1

E. Based upon shared functional domains and regulatory family members, the pig NLRP1 inflammasome is intermediate in similarity between the mouse and the human NLRP1 inflammasome.
F. The NLRC4 and AIM2 Inflammasomes are not conserved in pigs, the NLRP7 inflammasomes is not conserved in mice.
G. A preliminary analysis indicates that the LPS-induced transcriptome appears to be more conserved among humans and pigs while the LPS-induced microRNAome and targets appears similar in all 3 species.
H. The pig and human M2a macrophage transcriptomes are more similar.
Lessons Part 2

A. Functional characterization of the pattern recognition receptor repetoire to E. coli MAMPS and PAMPs in pigs, particularly those that interact with NLRP3.
B. Functional characterization of additional NLR and AIM2-like inflammasomes in all 3 species.
C. Characterization of C-type lectin inflammasomes in all 3 species.
D. Characterization and target mapping of the porcine miRNAome.
E. Protein reagents and informantics!
Future Directions

Status of NLRs in the Porcine Genome
Gene Status Provisional Status Final Status NLRP1 Missing GACC01000190.1 NLRP2 Missing Predicted full-‐length protein. NLRP3 Truncated NM_001256770.1 NLRP4 Truncated Predicted full-‐length protein. NLRP5 ArWfactually duplicated Predicted full-‐length protein. NLRP6 Truncated Predicted full-‐length protein. NLRP7 ArWfactually duplicated Predicted full-‐length protein. NLRP8 Truncated Predicted full-‐length protein. NLRP9 Normal Predicted full-‐length protein. NLRP10 Not present Expressed pseudogene NLRP11 Truncated Predicted full-‐length protein. NLRP12 Normal Full length protein NLRP12L Misannotated and truncated GACC01000011.1 NLRP13 ArWfactually duplicated Predicted full-‐length protein. NLRP14 Expressed pseudogene NLRX1 Normal NM_001204769.1

Porcine Translational Research Database
Related Topics
Publications
ARS Manuscripts
Search for a publication
ARS Software
About the database
DGIL Porcine Translational Research Database
Current Statistics (07/01/2015)
Gene entries 8,158
Genes with full-length RNA transcripts (full 5’ and 3’) 5,514% of genome (estimated) 28.3%
Full-length protein sequences 6,096% of genome (estimated) 32.2%
Error notations (# of entries) 3,236Artifactually duplicated genes 842Missing genes (from Ensembl 10.2) 963Truncated proteins 1,279
Real-time PCR Assays 2,231Taqman 1,860SYBR Green 371
Antibodies (reactive and non reactive) 1,149Antibodies (# entries) 508

Acknowledgements
Dawson Laboratory, BHNRC
- Dr. Celine Chen - Catherine Guidy
- Dr. Sandra Heibel - Vandana Vangimalla
Diet Genomics and Immunology Laboratory, BHNRC
- Dr. Joe Urban - Ethiopia Beshah- Dr. Gloria Solano-Aguilar
Animal Parasitic Disease Lab, ANRI, BARC- Dr. Joan Lunney Daniel Berman- Katherine Mann
International Swine Genome Consortium SGSC/Immune Response Annotation Group (IRAG)
Bovine Functional Genomics Laboratory, ANRI, BARC
- Dr. Steven Schroeder
Meat Animal Research Center, Reproduction Research Unit, Clay Center, Nebraska
- Dr. Anthony McNeel

Pro and Anti Inflammatory Effects of Human NLRP7


![CharacterizationoftheDeNovoBiosynthetic ...downloads.hindawi.com/journals/mi/2007/027683.pdf · 2 Mediators of Inflammation porcine spleen [11], as well as human neutrophils, human](https://img.pdfslide.us/doc/110x75/5ebcc167411abf034b14f909/characterizationofthedenovobiosynthetic-2-mediators-of-iniammation-porcine.jpg)

![Supramolecular Assembly of Aminoethylene‐Lipopeptide PMO ... · pLuc/705 based human hepatoma (Huh7), murine neuroblastoma (Neuro2A), and murine myoblast (C2C12) cells.[28] The](https://img.pdfslide.us/doc/110x75/60d7fc646a400246286a943a/supramolecular-assembly-of-aminoethylenealipopeptide-pmo-pluc705-based-human.jpg)