Embed Size (px)
Citation preview
ISSN: 2278 – 909X International Journal of Advanced Research in Electronics and Communication Engineering (IJARECE)
Volume 5, Issue 8, August 2016
2164
All Rights Reserved © 2016 IJARECE
AN IMPROVEMENT IN THRESHOLDING SEGMENTATION
METHODS FOR TUMOR DETECTION IN MRI IMAGES Aman lyall
1 (M.tech scholar) ([email protected])
Mr. Rajender singh yadav2 (Assistant professor) ([email protected])
Department of Electronics & Communication Engineering
GYAN GANGA COLLEGE
OF TECHNOLOGY (GGCT) JABALPUR
ABSTRACT
Tumor segmentation from magnetic resonance
imaging (MRI) data is an important but time
consuming manual task performed by medical
experts. Automating this process is a challenging task
because of the high diversity in the appearance of
tumor tissues among different patients and in many
cases similarity with the normal tissues. MRI is an
advanced medical imaging technique providing rich
information about the human soft-tissue anatomy.
There are different brain tumor detection and
segmentation methods to detect and segment a brain
tumor from MRI images. These detection and
segmentation approaches are research with an
importance placed on enlightening the advantages of
these methods for brain tumor detection and
segmentation. The use of MRI image detection and
segmentation in different procedures are also
described. Here a brief description of different edge
method with segmentation for detection of brain
tumor from MRI of brain has been discussed.
Keywords: Brain tumor, MRI image, segmentation,
Thresholding, Sobel, Edge detection technique etc.
I. INTRODUCTION
Image Processing is a method to convert an image
into digital form & perform some operation on it, in
order to get an enhanced image or to extract some
useful information from it. All the images used in
today‟s world are in the digital format. Medical
Imaging is the techniques, process & art of creating
visual representation of the interior of the body for
clinical analysis and medical intervention. In MRI,
CT scans are performed to analyze the internal
structure of various parts of human body which helps
doctors to visualize the inner portion of the body. CT
scanner, ultrasound, MRI took over conventional X-
ray imaging, by allowing the doctors to see the
body‟s third dimension. According to International
Agency for Research on Cancer (IARC)
approximately, more than 126000 people are
diagnosed for brain tumor per year around the world,
with more than 97000mortality rate. This paper
presents a research of the methods and techniques
used during brain tumor detection through MRI
image segmentation and we have proposed
segmentation of brain MRI image using segmentation
algorithm followed by morphological filtering.
The basic concept is that local textures in the
images can reveal the typical regularities of the
biological structures. Thus, the textural features have
been extracted using a co-occurrence matrix
approach. The level of recognition, among three
possible types of image areas: tumor, non-tumor and
back ground. We are into tumor image
segmentation.[1] Generally, human brain includes
three major parts controls different activity. [2]
A. Cerebrum
The cerebrum controls learning, thinking,
emotions, speech, problem solving, reading and
ISSN: 2278 – 909X International Journal of Advanced Research in Electronics and Communication Engineering (IJARECE)
Volume 5, Issue 8, August 2016
2165
All Rights Reserved © 2016 IJARECE
writing. It is divided into right and left cerebral
hemispheres. Muscles of left side of the body control
by right cerebral hemispheres and muscles of right
side of the body control by left cerebral hemispheres.
B. Cerebellum
The cerebellum controls movement,
standing, balance and complex actions.
C. Brain stem
Brain stem joints the brain with spinal cord.
Brain stem controls blood pressure, body temperature
and breathing and controls some basic functions.
II. STAGE OF IMAGE ENHANCEMENT
1. PRE-PROCESSING STAGE
In this phase image is enhanced in the way that
finer details are improved and noise is removed from
the image. Most commonly used enhancement and
noise reduction techniques are implemented that can
give best possible results. Enhancement will result in
more prominent edges and a sharpened image is
obtained, noise will be reduced thus reducing the
blurring effect from the image. In addition to
enhancement, image segmentation will also be
applied. This improved and enhanced image will help
in detecting edges and improving the quality of the
overall image. Edge detection will lead to finding the
exact location of tumor.
2. NOISE REMOVAL
Many filters are used to remove the noise from
the images. Linear filters can also serve the purpose
like Gaussian, averaging filters. For example average
filters are used to remove salt and pepper noise from
the image. Because in this filter pixel‟s value is
replaced with its neighborhood values. Median filter
is also used to remove the noise like salt and pepper
and weighted average filter is the variation of this
filter and can be implemented easily and give good
results. In the median filter value of pixel is
determined by the median of the neighboring pixels.
This filter is less sensitive than the outliers.
III. TYPES OF TUMOR
Tumor The word tumor is a synonym for a
word neoplasm which is formed by an abnormal
growth of cells Tumor is something totally different
from cancer. There are three common types of tumor:
1) Benign
2) Pre-Malignant
3) Malignant
1) Benign Tumor
A benign tumor is a tumor is the one that
does not expand in an abrupt way; it doesn‟t affect its
neighboring healthy tissues and also does not expand
to non-adjacent tissues. Moles are the common
example of benign tumors.
2) Pre-Malignant
Tumor Premalignant Tumor is a
precancerous stage, considered as a disease, if not
properly treated it may lead to cancer.
3) Malignant Tumor
Malignancy (mal- = "bad" and -ignis =
"fire") is the type of tumor, that grows worse with the
passage of time and ultimately results in the death of
a person. Malignant is basically a medical term that
describes a severe progressing disease. Malignant
tumor is a term which is typically used for the
description of cancer.
IV. PROPOSED IMPLEMENTATION
The location of brain tumor influences the
type of symptoms that occur. Identifying the presence
of a brain tumor is the initial step in determining the
course of treatment. To identify the location and size
of tumor the detection process involves various steps.
Firstly the MR image of the brain is obtained.
Imaging plays the central role in the diagnosis of
brain tumors. Brain scan is the picture of the internal
structures in the brain. A specialized machine takes a
scan in much the same way a digital camera takes a
photograph. MRI is scanning device that uses
magnetic fields and computers to capture images of
the brain on film. In medical image processing,
ISSN: 2278 – 909X International Journal of Advanced Research in Electronics and Communication Engineering (IJARECE)
Volume 5, Issue 8, August 2016
2166
All Rights Reserved © 2016 IJARECE
medical images are corrupted by different type of
noises. Low quality image is an obstacle for effective
[8] feature extraction, analysis, recognition and
quantitative measurements. Presence of noise during
image acquisition degrades the human interpretation,
or computer aided analysis of the images. Most
common type of noises that are usually found in
acquired medical images is salt and pepper or
Poisson noise. Salt and pepper noise appears as white
and black pixels in the image. Due to presence of
such noise, the tumor is sometimes not visible
properly especially in case of salt and pepper noise.
Also the tumor may not be located properly. In some
cases combination of both salt & pepper and poison
noise may also be present. So it becomes necessary to
remove such type of noise from these images. Thus
next step is the removal of noise which is very
important step in medical imaging applications [8] to
enhance and recover anatomical details that may be
hidden.
Gaussian filter is the appropriate technique
for removal of noise. In Gaussian filter each pixel is
set to median of the pixel values in the neighborhood
of the corresponding input pixels. Next step after
removal of noise is to identify the location of the
tumor. This is done by creating an edge detection
technique around the brain abnormality in MR image.
The edge detection method is based on the property
of the symmetrical structure of the brain [5, 9]. That
is left and right lobes are almost identical. The left
right parts are similar until an abnormality occurs in
any part of the brain. For creating edge detection,
first the skull is detected. Then line of symmetry [4]
is drawn to create leftright symmetry of brain.
Assumption is made that tumor is located in one of
the two halves of the brain. One half acts as reference
image while other as test image. The vertical and
horizontal scan is performed on both sides,
comparing to obtain the region of abnormality. This
is done by obtaining a score plot function „E‟ based
on average intensities of the region of abnormality.
All maximum and minimum points are obtained from
the graph. From all the pairs, the pair (m, n) is found
for which difference (E(m)-E(n)) is maximum. This
defines the boundary of edge detection.
A. SEGMENTATION USING THRESHOLDING
TECHNIQUE
After finding the image gradient, the next step is
to automatically find a threshold value so that edges
can be determined. The algorithm to automatically
determine image dependent threshold is as follows:
1. Let the initial threshold be Th0 which is
equal to the average intensity of gradient
image g(x, y), as defined in (1).
(1)
where, h and w are height and width of the image
under consideration.
2. Set iteration index l = 0, separate g(x,y)
into two classes, where the lower class
consists of those pixels of g(x,y) which have
gradient values less than Thl , and the upper
class contains rest of the pixels.
3. Compute the average gradient values mL
and mH of lower and upper classes
respectively.
4. Set iteration l = l+1 and update threshold
Value as:
(2)
Repeat steps 2 to 4 until [Thl-Thl-1] ≤ ϵ is satisfied,
where ϵ and take Thl as final threshold and denote it
by Th.
It means we follow the steps 2 to 4 because it need to
reach Threshold value to adjust the output image.
B. SOBEL OPERATOR
Sobel Operator uses a 3×3 mask shown in Fig. 1a and
applied on part of the image shown in Fig. 1b. Given
an image f (x, y), its gradient along x and y-axis are
calculated according to (3) and (4).
(3)
(4)
ISSN: 2278 – 909X International Journal of Advanced Research in Electronics and Communication Engineering (IJARECE)
Volume 5, Issue 8, August 2016
2167
All Rights Reserved © 2016 IJARECE
Then the gradient of image is defined
as: (
5)
Where, I and j are unit vectors along x and y axis
respectively. The magnitude of gradient is given by,
(6)
C. SIMULATION TABLE
Input parameter Technique
For segmentation Thresholding method
For Noise removal
in Images
Salt and Pepper
For Image
Filtering
Gaussian Filter
For edge detection Various technique like
(Prewitt, Canny, Sobel,
Robert, and Log )
Simulation tool MATLAB 2012a
V. RESULT
In this section, the results of each stage are shown
and how result obtained is better and accurate.
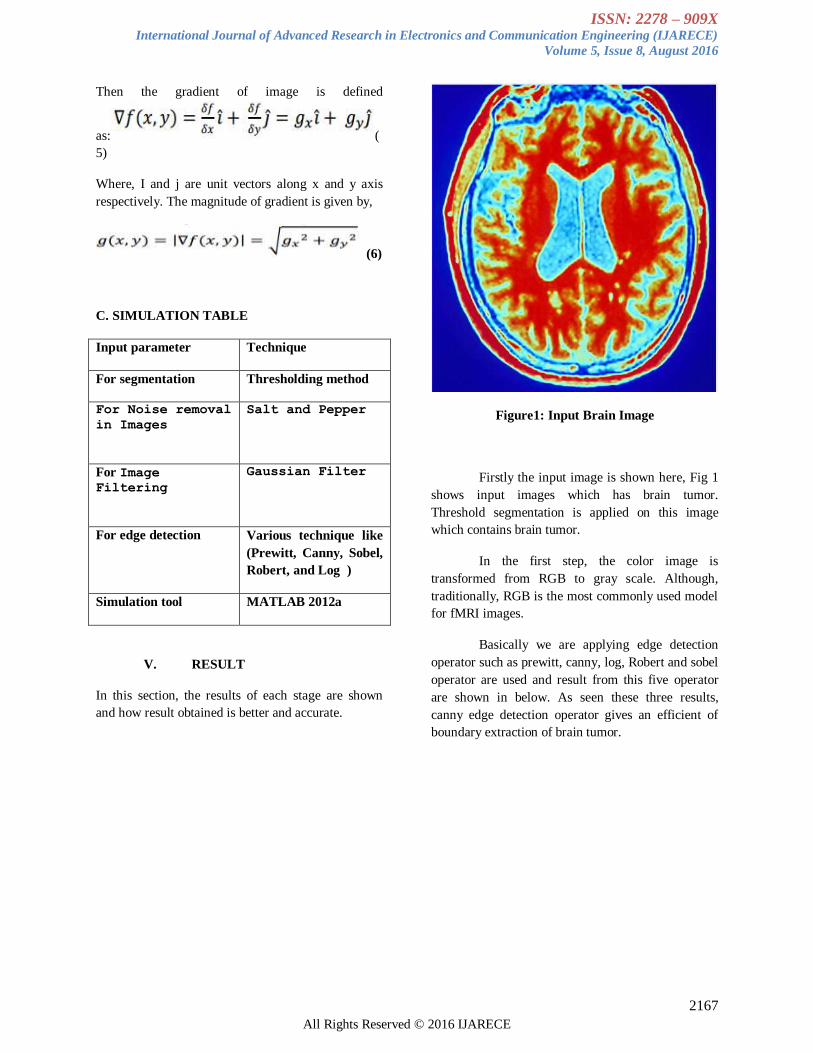
Figure1: Input Brain Image
Firstly the input image is shown here, Fig 1
shows input images which has brain tumor.
Threshold segmentation is applied on this image
which contains brain tumor.
In the first step, the color image is
transformed from RGB to gray scale. Although,
traditionally, RGB is the most commonly used model
for fMRI images.
Basically we are applying edge detection
operator such as prewitt, canny, log, Robert and sobel
operator are used and result from this five operator
are shown in below. As seen these three results,
canny edge detection operator gives an efficient of
boundary extraction of brain tumor.
ISSN: 2278 – 909X International Journal of Advanced Research in Electronics and Communication Engineering (IJARECE)
Volume 5, Issue 8, August 2016
2168
All Rights Reserved © 2016 IJARECE
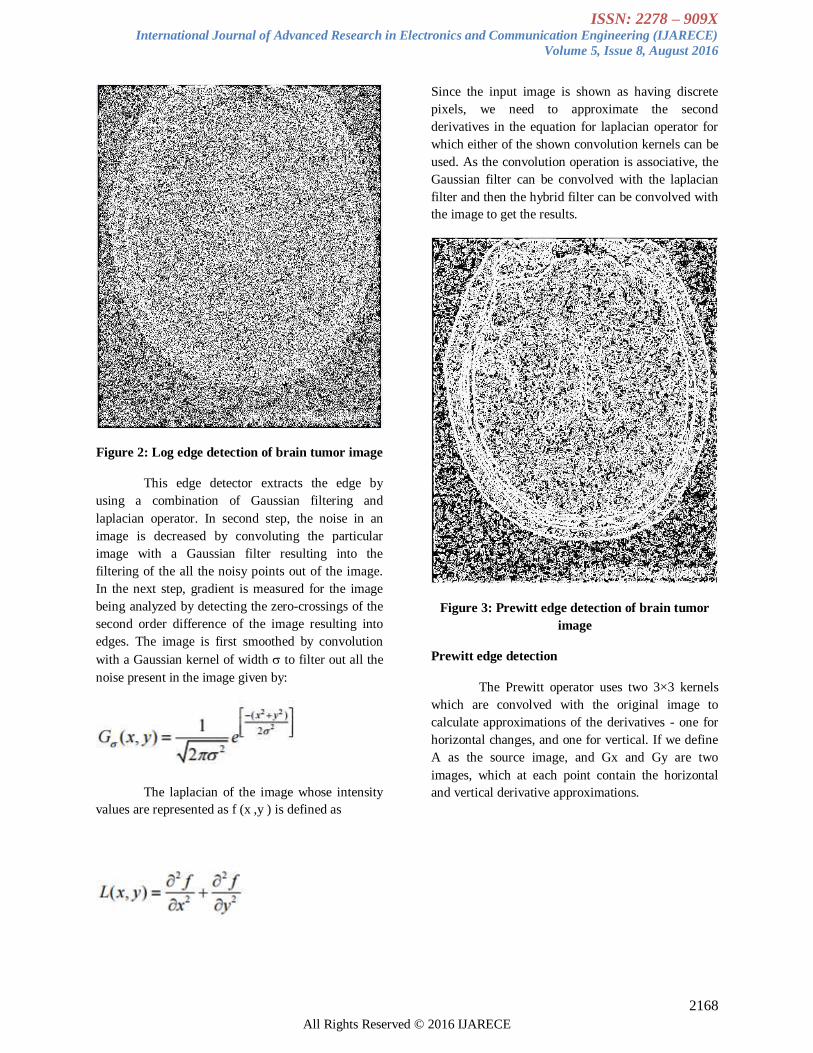
Figure 2: Log edge detection of brain tumor image
This edge detector extracts the edge by
using a combination of Gaussian filtering and
laplacian operator. In second step, the noise in an
image is decreased by convoluting the particular
image with a Gaussian filter resulting into the
filtering of the all the noisy points out of the image.
In the next step, gradient is measured for the image
being analyzed by detecting the zero-crossings of the
second order difference of the image resulting into
edges. The image is first smoothed by convolution
with a Gaussian kernel of width to filter out all the
noise present in the image given by:
The laplacian of the image whose intensity
values are represented as f (x ,y ) is defined as
Since the input image is shown as having discrete
pixels, we need to approximate the second
derivatives in the equation for laplacian operator for
which either of the shown convolution kernels can be
used. As the convolution operation is associative, the
Gaussian filter can be convolved with the laplacian
filter and then the hybrid filter can be convolved with
the image to get the results.
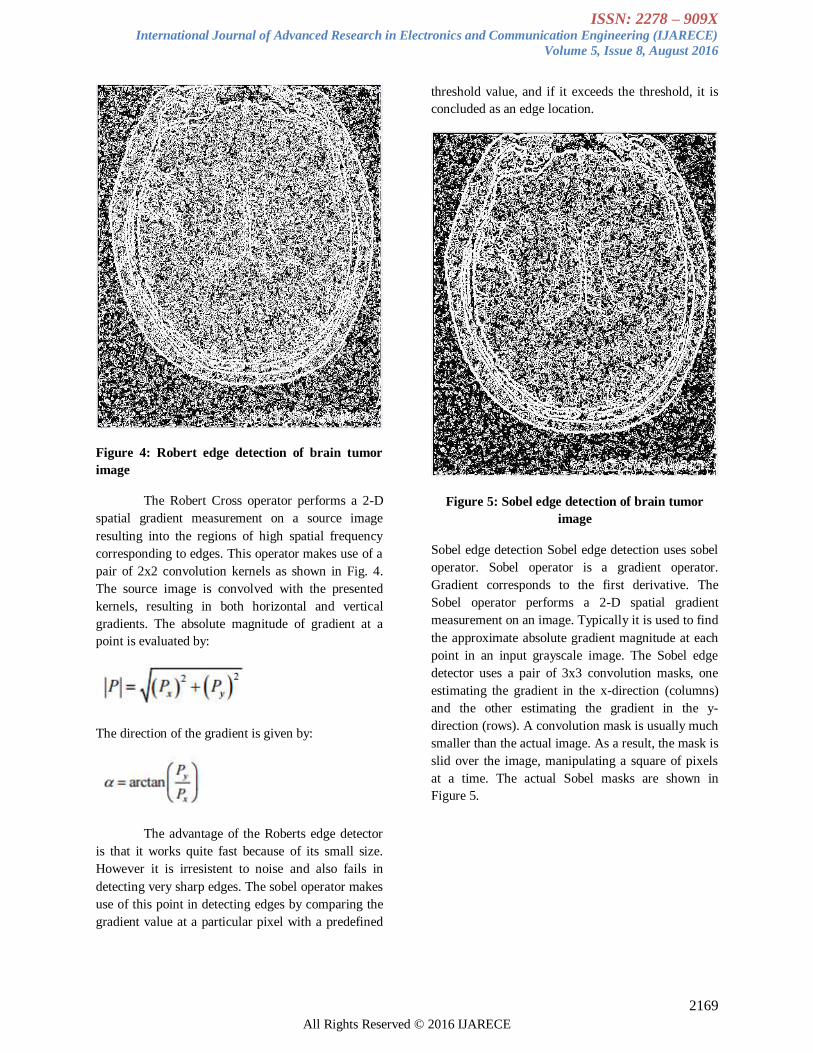
Figure 3: Prewitt edge detection of brain tumor
image
Prewitt edge detection
The Prewitt operator uses two 3×3 kernels
which are convolved with the original image to
calculate approximations of the derivatives - one for
horizontal changes, and one for vertical. If we define
A as the source image, and Gx and Gy are two
images, which at each point contain the horizontal
and vertical derivative approximations.
ISSN: 2278 – 909X International Journal of Advanced Research in Electronics and Communication Engineering (IJARECE)
Volume 5, Issue 8, August 2016
2169
All Rights Reserved © 2016 IJARECE
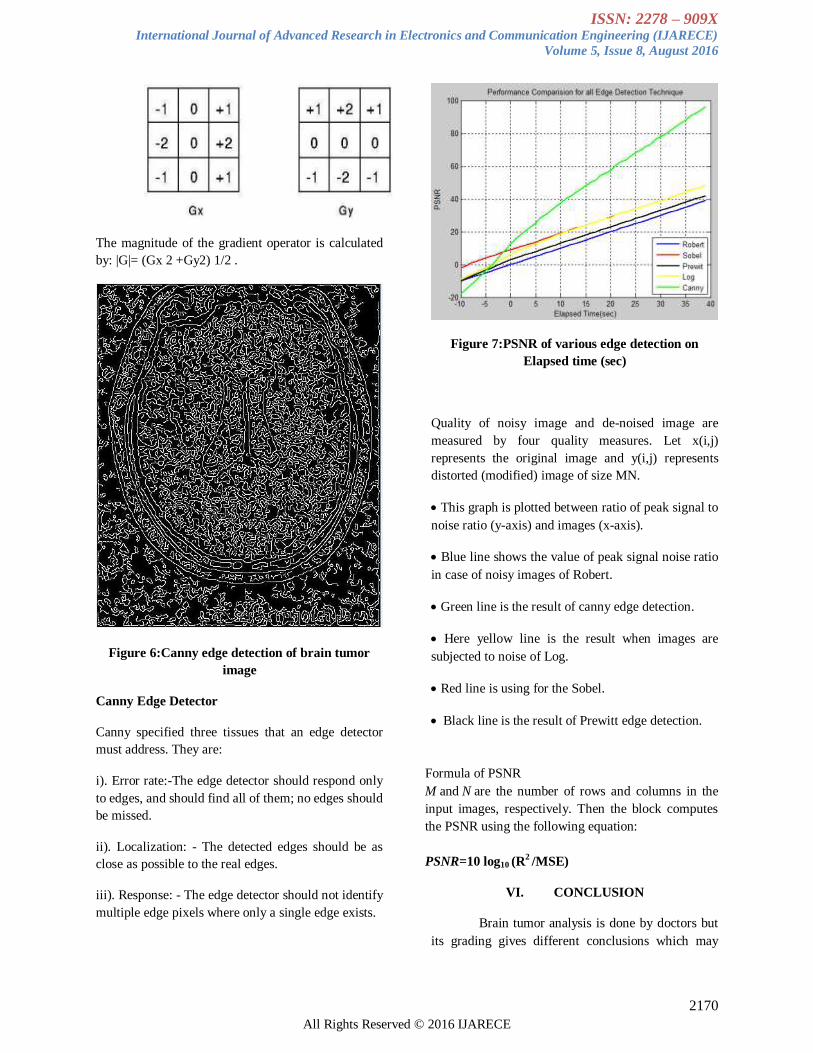
Figure 4: Robert edge detection of brain tumor
image
The Robert Cross operator performs a 2-D
spatial gradient measurement on a source image
resulting into the regions of high spatial frequency
corresponding to edges. This operator makes use of a
pair of 2x2 convolution kernels as shown in Fig. 4.
The source image is convolved with the presented
kernels, resulting in both horizontal and vertical
gradients. The absolute magnitude of gradient at a
point is evaluated by:
The direction of the gradient is given by:
The advantage of the Roberts edge detector
is that it works quite fast because of its small size.
However it is irresistent to noise and also fails in
detecting very sharp edges. The sobel operator makes
use of this point in detecting edges by comparing the
gradient value at a particular pixel with a predefined
threshold value, and if it exceeds the threshold, it is
concluded as an edge location.
Figure 5: Sobel edge detection of brain tumor
image
Sobel edge detection Sobel edge detection uses sobel
operator. Sobel operator is a gradient operator.
Gradient corresponds to the first derivative. The
Sobel operator performs a 2-D spatial gradient
measurement on an image. Typically it is used to find
the approximate absolute gradient magnitude at each
point in an input grayscale image. The Sobel edge
detector uses a pair of 3x3 convolution masks, one
estimating the gradient in the x-direction (columns)
and the other estimating the gradient in the y-
direction (rows). A convolution mask is usually much
smaller than the actual image. As a result, the mask is
slid over the image, manipulating a square of pixels
at a time. The actual Sobel masks are shown in
Figure 5.
ISSN: 2278 – 909X International Journal of Advanced Research in Electronics and Communication Engineering (IJARECE)
Volume 5, Issue 8, August 2016
2170
All Rights Reserved © 2016 IJARECE
The magnitude of the gradient operator is calculated
by: |G|= (Gx 2 +Gy2) 1/2 .
Figure 6:Canny edge detection of brain tumor
image
Canny Edge Detector
Canny specified three tissues that an edge detector
must address. They are:
i). Error rate:-The edge detector should respond only
to edges, and should find all of them; no edges should
be missed.
ii). Localization: - The detected edges should be as
close as possible to the real edges.
iii). Response: - The edge detector should not identify
multiple edge pixels where only a single edge exists.
Figure 7:PSNR of various edge detection on
Elapsed time (sec)
Quality of noisy image and de-noised image are
measured by four quality measures. Let x(i,j)
represents the original image and y(i,j) represents
distorted (modified) image of size MN.
This graph is plotted between ratio of peak signal to
noise ratio (y-axis) and images (x-axis).
Blue line shows the value of peak signal noise ratio
in case of noisy images of Robert.
Green line is the result of canny edge detection.
Here yellow line is the result when images are
subjected to noise of Log.
Red line is using for the Sobel.
Black line is the result of Prewitt edge detection.
Formula of PSNR
M and N are the number of rows and columns in the
input images, respectively. Then the block computes
the PSNR using the following equation:
PSNR=10 log10 (R2 /MSE)
VI. CONCLUSION
Brain tumor analysis is done by doctors but
its grading gives different conclusions which may
ISSN: 2278 – 909X International Journal of Advanced Research in Electronics and Communication Engineering (IJARECE)
Volume 5, Issue 8, August 2016
2171
All Rights Reserved © 2016 IJARECE
vary from one doctor to another. So for the ease of
doctors, a research was done which made the use of
software with edge detection and segmentation
methods, which gave the edge pattern and segment of
brain and brain tumor itself. Medical image
segmentation had been a vital point of research, as it
inherited complex problems for the proper diagnosis
of brain disorders. In this research, it provides a
foundation of segmentation and edge detection, as the
first step towards brain tumor grading. Current
segmentation approaches are reviewed with an
emphasis placed on revealing the advantages and
disadvantages of these methods for medical imaging
applications. The use of image segmentation in
different imaging modalities is also described along
with the difficulties encountered in each modality.
REFERENCES
[1] P.Tamije;V. Palanisamy T. Purusothaman:
“PerformanceAnalysis of Clustering Algorithms in Brain Tumor Detectionof MR Images” European
Journal of Scientific Research, ISSN1450-216X
Vol.62 No.3 (2011), pp. 321-330.
[2] Ratan, Rajeev, Sanjay Sharma, and S. K. Sharma.
"Braintumor detection based on multi-parameter MRI
imageanalysis." International Journal on Graphics,
Vision andImage Processing vol 9.no.3, pp.9-
17,2009.
[3] S.K.Bandyopadhyay and D.Saha, “Brain region extractionvolume calculation,” UNIASCIT, vol. 1,
no. 1, pp. 44-48,2011.
[4] Gopal, N.N.; Karnan, M., "Diagnose brain tumor
throughMRI using image processing clustering
algorithms such asFuzzy C Means along with
intelligent optimizationtechniques," IEEE
International Conference onComputational
Intelligence and Computing Research(ICCIC),vol.2,
no.3, pp.1-4, 2010.
[5] AmanpreetKaur; Gagan Jindal “Tumor Detection UsingGenetic Algorithm” International Journal on
ComputerScience and Technology, vol. 4, no.1,pp.
423-427 2013.
[6]S. Datta; M. Chakraborty. “Brain Tumor Detection
from Pre-Processed MR Images using
SegmentationTechniques”. Special Issue on 2nd
National Conference-Computing, Communication
and Sensor Network(CCSN) Published by
Foundation of Computer Science, NewYork, USA. vol.2, pp.1-5, 2011.
[6] P.TamijeSelvy, V. Palanisamy, T.Purusothaman,
“Performance Analysis of Clustering Algorithms in
Brain Tumor Detection of MR Images”,
EuropeanJournal of Scientific Research, Vol.63,
No.3, 2011
[7] Mrs. Bharati R. Jipkate, Dr. Mrs. V. V. Gohokar,
“ A Comparative Analysisof Fuzzy C-means
Clustering and K-means Clustering Algorithms”,International Journal of computational
Engineering Research, Vol.2, Issue 3,May-June
2012.
[8] R. C. Gonzalez and R. E. Woods, “Digital Image
Processing”, 2nd Ed.
[9] National cancer Institute, “What you need to
know about Brain tumors”.
[10] http://www.braintumor.org


![ISSN: 2278 909X International Journal of Advanced Research in …ijarece.org/wp-content/uploads/2017/05/IJARECE-VOL-6... · 2017-05-14 · McLean [3] derived relations for the minimum](https://img.pdfslide.us/doc/110x75/5ea04bb213d2e0694433d80b/issn-2278-909x-international-journal-of-advanced-research-in-2017-05-14-mclean.jpg)