Embed Size (px)
Citation preview
JOURNAL OF RESEARCH of the National Bureau of Standa rds - C. Engineering and Instrumentation
Vol. 73C, Nos. 3 & 4, July-December 1969
An Improved High-Precision Calibration Procedure For Reference Standard Hydrometers
Horace A. Bowman and William H. Gallagher
Institute for Basic Standards, National Bureau of Standards, Washington, D.C. 20234
(June 24, 1969)
This pape r describes a me thod of calibra ting hydromete rs whic h. a lthoug h no more accurate tha t the technique used he re tofore at the Na tiona l Burea u of S ta nd a rds, reduces calibration time from se ve ral days to a few hours. The p rocedure is based upon eas ily measured h yd rome ter we ight , s tem sca le geometry, and flotat ion leve l measurement s a t onl y one liquid density. The reliability of thi s s ingle leve l is improved by o bse rving the hydrome te r Rotation und er va ri ous we ight loads. The ca libra ti on ex pe riment is o ri en ted toward aut omati c data reduction so the fini shed ca libra ti o n report is of much wide r app li ca bility than the s imple co rrection ta ble de rived fro m t he old er experim e nt.
Key words: Ca lib ra ti o n; de ns it y; h yd romete r; hyd rometer ca libration ; refe rence hydrome ter ; s pec ifi c grav it y: s tanda rd h ydro me te r.
1. Objectives and Results
The re are two classes of hydrom eters, whic h although identical in construction , differ signifi cantly in their method of calibration and th e use to which they are put. Working hydrometers are used extensively in science a nd industry for moderate precision measurements of liquid dens ities . R eference standard hydrometers are used exclusively for the calibration of working hydrometers using compari son techniques described in the appendix. These reference sta ndard hydrometers are calibrated by comparing the ir observed fl otation levels to bath densities indepe ndently determined by hydrostatically weighing solid object de nsity s tandards.
The compari son experiment used in the past at NBS for calibration of reference standard hydrometers was fund ame ntally sound under specified conditions, but it was time-consuming and its range of applicability was restricted. Hydrometers were tested in the liquid in which they were to be used, and several baths of this liquid we re prepared covering the density range shown on the hydrometer stem scale. It was difficult to obtain more than five such co mparison s in a day, although the require me nts of so me calibrations were suc h that fifteen or more compari sons had to be performed. Additionally, if the hydrome ter was to be used in a liquid of different surface te nsion , a differe nt calibration was required.
We have devised a calibration procedure in whi ch only one co mpari so n bath is required which can be co mpleted in less than three hours, and the data are of s uc h form that co rrections can be dedu ced for any (or
57
all) points on th e s tem scale. Eve n though the hydrome te r is to be used in fluids of radically differe nt surface tension or temperature, additional calibration effort is not re quired.
This new procedure is based upon knowledge of the hydrometer weight and stem scale geometry (both eas ily meas ured to adequate accuracy) and knowledge of the level at which the hydrom eter float s in one bath of known properties. Hydrometer flotation levels are observed to one-tenth scale divi s ion . In es timating te nth s of divi sions, most observers are biased for or against ce rtain numbers, and when reading the same leve l repeatedly, they will us ually co ntinue to make the sa me estimate. As a result , multiple observations on th e same le vel are little better than a s in gle obse rvation. To minimize such reading errors, o nly one observation is made on the freely floatin g hydrometer. The reafter it is loaded by small weights, causing it to sink to lower le vels , each of whi c h is reco rded. From knowledge of the weights and s te m scale geometry it is possible to calculate inde pe nde nt values of the unloaded Aotation level. Averaging the single observed value with the various calc ulated values provides a more reliable fi gure for the true flotation level of the unload ed hydrom eter in the bath. This bath may be se t up to have id eal properties such as transparency, surface te ns ion, or any other characteris ti c considered important by th e experime nter. The requirement is that it Aoat th e hydrometer near the lower end of its scale_
Based upon lon g standing cus tom the de nsities of different classes of fluids are measured on different scales of density; for example, oils are usually measured in "degrees API," alcohol in "percent of proof
spirit," and acids in "specifi c gravity." This has forced NBS to mai ntai n an inventory of currently calibrated refe re nce standard hydrometers whose scales are graduated in different sys te ms but coveri ng the same density range. Our new calibration procedure is orie nted for automatic data reduction. This yields a byproduct. With appropriate computer instruction s, we are able to obtain a table of scale corrections to convert re adin gs into many other density scales with· out additional laboratory work, so a single calibration experim ent of the type described can take the place of several of the older ex periments.
The National Physical Laboratory [111 calibrates its reference hydrom eters by partially s uspending them from a balance while floatin g in a xylene bath at some previously selected scale graduation. The bath density is measured by a spec ial finely divided hydrometer. By varying th e suspensio n le ngth and the xylene level so th at each cardin al point is examined, comparison between gravitation al and buoyant forces provides the required correction.
2. The Calibration Experiment
There are four ste ps in the laboratory work demanded by the ne w procedure . As pointed out above, about three hours is required for completion.
1. The hydrometer is weighed on a laboratQry balance to de termine its apparent weight in air , W" , defined and discussed in section 4.
2. The hydrometer s te m scale of N card inal points is laid alongside a centimeter scale (actually a linear co m para tor, see fig. 1) and a table of values of L 1 , L 2 ,
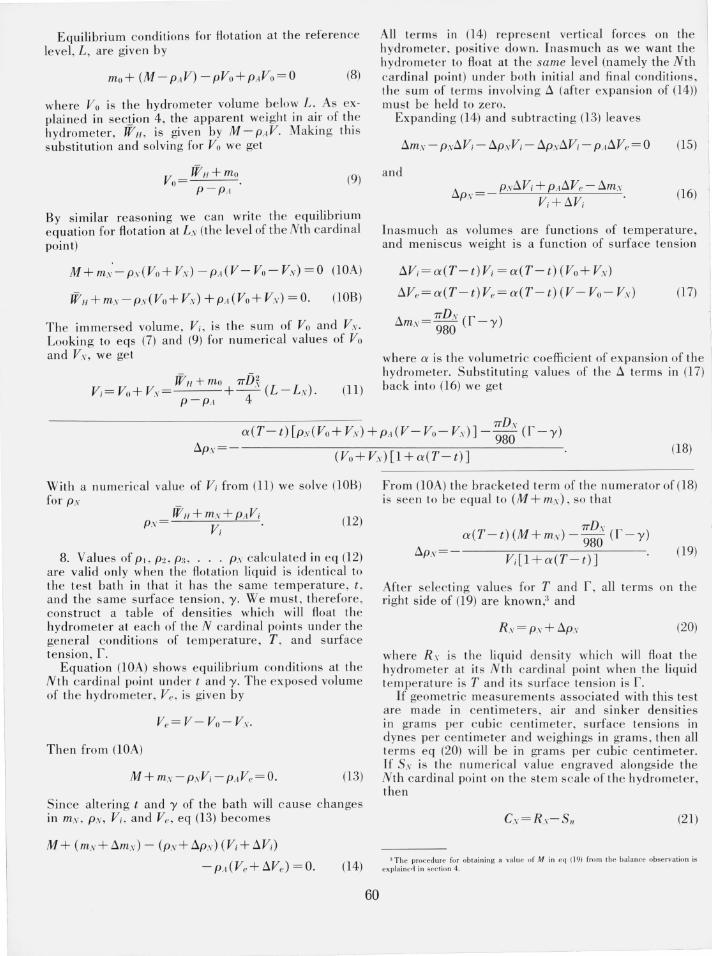
L1, ... L.,· is prepared indicating the di stan ce of each cardinal point from some arbitrary zero reference. At the same tim e the distance to the upper tip of th e hydrom eter, D,; is recorded.
3. An indicator micro meter, see fi gure 1, is used to measure the ste m diameter at each cardin al point. Two meas ure me nts, 90° apart, are averaged and a table of values Dt, Dz, D:l ... Dx is prepared showin g these average ste m diameters.
4. Th e hydrometer is flo ated in a bath of de nsity p , which is meas ured by hydros tatically weighing a solidobject densi ty standard as discussed in section 4. The hydrome ter flotation level is noted. After thLs , fQur (Qr more) h~lt- shaped objects of weights in air W.j , WII ,
We, and WIJ are placed on the upper tip of the hydrome ter , causing it to sink deeper into the b ath. The fl otation level with each hat in place is noted.
3. Data Recording and Reduction
Raw data are recorded on forms designed so that a typist can most conve ni ently transcribe the m on a punched tape accep table to the NBS ADP sys tem and receive the finished calibration report from the printout. This requires abo ut six minutes .
I Figures in brackets indica te the lit e rature re ft! rences on page
58
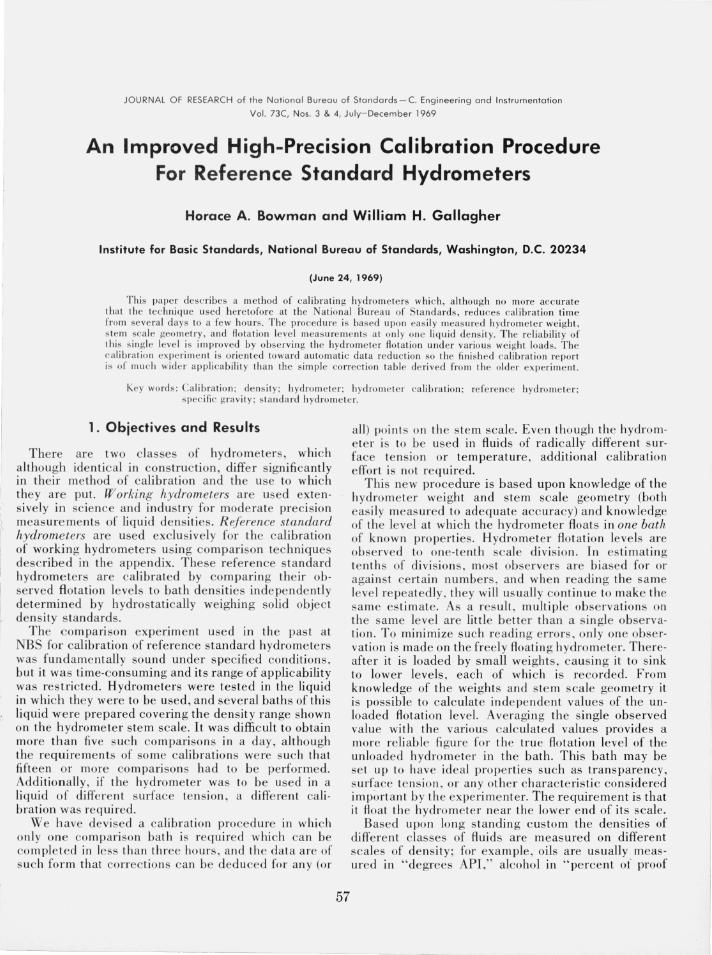
FIGURE 1. The two devices lIsed to measure hydrometer stem geometry.
The line ar compara tor on the left is lI sed to convert the stem scale grad ua tions f rom den sity indications to linear di slan ct:s . Ste m diame te rs are meas ured by the indica tor micrometer shown on the right.
The co mputer program is based upon the following arguments:
1. The fiv e equilibrium flotation levels observed during the flotation tes ts (sec. 2.4) are observed on the hydrometer stem scale in terms of the scale units. These levels must be expressed in ordinary length units , cen tim eters. This is accomplished by inte rpolation in the table of centimeter e quivale nts prepared in section 2.2, aft er whi c h we have Lo, L .. 1, LII , Lc, and LIJ representing the level in centimeters at whic h hydrometer fl otation occurs with no hat, with hat A , with hat B, with hat C, e tc . If the bath temperature is different from the room tem perature during geometric measure ments, th en the geometric meas ure ments are corrected to the bath temperature by suitable application of the thermal coefficient of ex pan sion of the hydrometer.
2. By similar interpolation we obtain from the table of stem diameters (sec. 2.3) the stem diameter at each flotation level. Values of Do, D..t , DII , Dc, and Df) are the ste m diameters at each of the five flotation levels no hat , with hat A, with hat B, with hat C, etc.
3. We now calculate the average stem diameter between th e "no hat" fl otation level and each of the "with hat" levels. Values of DA , D/I, Dc, DIJ are the average ste m diameter be tween Lo and L .. 1, between Lo and L/lo between Lo and Lc, and between Lo and LIJ.
4. From knowledge of the surface tension of the tes t bath, y, and the various ste m diameters involved , we calculate the weight in air of the meniscus, m, which would form at each flotation level an d cardinal point, thus
_7TDy m- 980
where D is th e ste m diameter a t the level of interes t. 2
Me ni scus we ights at th e variou s flotat ion leve ls are named Ino, 1n .1, 17111 , me , a nd Inn de pe ndin g upon th e hat in use. At th e cardinal points, they are labeled Inl , 1n2 , In:l . .. In.\".
5. The s ta ndard deviation of a s ingle observation on th e flotation le vel of a hydrome ter may be as large as 1/4 mm whe n observin g condition s are non·ideal. Step 2.4 in the experimental procedure yields only one value of the flotation le vel, Lo , of the hydrometer (by itself with no hat load) in the tes t bath . The objections to repeated observations of th e same stem scale graduation to improve ass urance were discussed above. We calculate an additional value of this flota· tion level from each of the " with hat" flotation level observations. These additional values are independent of the original observed value, and they are largely, but not entirely , independent of one another.
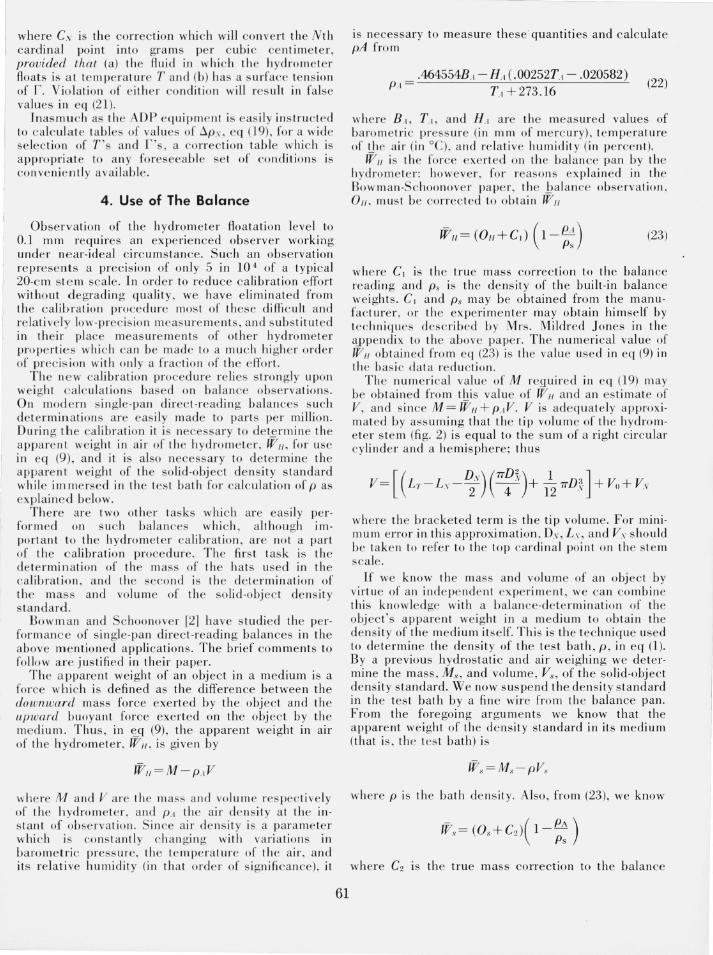
The flotation level under no load is taken under the followin g condition s of equilibrium , see figure 2:
M + lno-pVO-P.·I(V- Vo) =0 (1 )
where M and V are th e mass a nd volume of the hydrome ter, PI the air de ns ity, a nd Vo is th e imm ersed volume. The comparable equation of equilibrium for flotati on wh e n the hydrometer is loaded by hat "A" (with the hydrome ter flo ating a t s te m level L I ) is give n by
M + WI + 1n.·I- pVo- pVI - PA(V- Vo- VA) =0 (2)
where VA is the stem volume betwee n Lo a nd L.I •
Subtracti ng e q (2) from (1) we ge t a value for VI
VI=WI+InA-lnn P -PA
(3)
Based upon ste m geometry we can write a differe nt equa tion for V .I
(4)
wh ere D..I is the average stem diameter betwee n Lo and LA. Equati ng (3) and (4) yields a new value of Ln, thus
4(W I +m.'I- mo)
1TD3 (p - PAl (5)
Using thi s procedure, we calculate a value of Lo for each "with hat" observation and take the average to gi ve the reference level, L; thu s
2 If y is a pure fol'(,(" tlWIl III as defin ed here would be mass. 1101 we ight in air. However. air buoyancy is ignored in must surface tensiun measure-rnenls. so y is us ually all appar(' nl force. If y is a pure fUfcc. the menisc us wci~h l in air is
"Dy [I-e..cl 980 p
where P.I is air density and p I ll(' fluid densit y. For the aVf'J'age hydrometer . the difference bel ween meni scus weight and mass is about I ppm of the hydromet er weight - insignificant in this experiment.
59
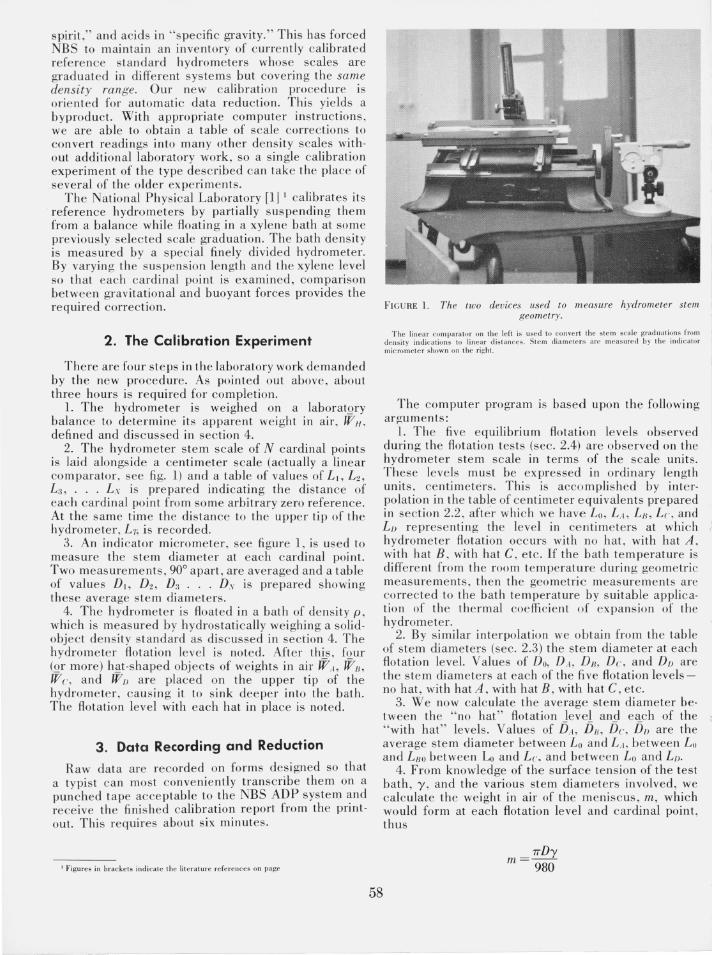
TOP CARDINAL POINT t:,. /
1
NTH CARD1NAL
STE M VOLUME ABOVE TOP CARD1NAL POINT ASSUMED EQUAL TO SUM OF R1GHT CYL1 NDER AND HEMISPHERE
HYPOTHETI CAL FLOTATIO N AT NTH CARDINAL POINT
~_L_
OBSE RVED ~ HAT . A· FLOTAT10N
PO~N~rON::~~_\ ~
STEM VOLUME LEVEL \ BETWEEN REFERENCE .-/ I'-__ ~~_
LEVEL AND NTH \ CARDINAL POINT
(EQN7) V,
CALCULATED REFERENCE LEvEL ( E Q N 6)
-'''--~---'I
TOTAL HYDROMETER VOLUME BELOW THE
REFERENCE LEvEL (EQN 9) ____ Vo
ST EM VOLU ME BETWEEN liND-HAT" AND tl HAT_A" FLOTATIO N LEVEL(EQN 3)
V./
OBSERVED "NO'HAT"
~~~E:::~-,:F,::LO~T..L~~T I ON LEVEL
-------CALCULATED VALUES OF IINO - HAT" FLOTAT ION LEVEL (EQUATION 5)
FIG URE 2. Various stern scale levels and volumes used in the data· reduction argument.
L = Lo(o bs) + Lo(hat A)+ Lo(hat B)+ Lo(hat C) + Lo(hatD) 5
(6)
The variability in these valu es of Lo is mos tl y random a nd is associated with imperfect fl o tati on a nd geome tri c observations.
6. We next calculate a table of stem volumes betw een the reference level, L, and each cardinal point on the s tem scale. Values of VI, V2 , Vl ... VI' are obtained from
(7)
where D." is th e average ste m diam e ter be twee n Land L,.
7. Based upon our knowledge that th e hydrometer fl oa ts at th e refe re nce level , L , under "no hat" condition s whe n tes t bath te mperature , density and surface ten sion are t, p , and y res pectively, we can calculate a table of bath densities PI, P2, P3, P4 .... ps which will float the hydrometer at each of the N cardinal points und er conditions of t and y.
Equilibrium conditions for Hotation a t the reference level, L, are given by
where Vo is the hydrometer volume below L. As explained in seclion 4, the apparent weig ht in air of the hydrometer , WI/ , is given by M - pAv. Making thi s substitution and solving for Vo we ge t
V - WII+mo 0-
P - PI (9)
By similar reasoning we can write the equilibrium equation for Rotation at Lv (the level of the Nth cardin al point)
M + m,'- p,(Vo+ V,) - PA(V - Vo- VI) =0 (lOA)
WI/ + m,-p, (Vo+ VI) + PA (Vo+ Vv) = 0_ (lOB)
The immersed volume, Vi, is the s um of Vo and VI. Looking to eqs (7) and (9) for numeri cal values of Vo and VI, we get
W" + mil 'TT[)~' Vi=VO+VI= +-(L - L.v ). (11)
P-PI 4
All te rms in (l4) represent vertical forces on the hydrometer, positive down. Inasmuch as we want the hydrometer to Roat at the same level (namely the Nth cardinal point) under both initial and final conditions, I
the sum of terms involving ~ (after expansion of (14)) must be held to zero.
Expanding (14) and subtracting (13) leaves
and
(16) 1
Inasmuch as volumes are functions of temperature, and meniscus weight is a function of s urface tension
~Vi= a(T- t) Vi = a(T- t) (Vo+ Vv)
~Ve= a(T- t)Ve= a(T- t) (V - VIl - Vv)
'TTDs ~m,= 980 (f-y)
(l7)
where a is the volumetric coefficient of expansion of the I hydrome ter. Substituting values of the ~ terms in (1 7) back into (16) we get
'TTDI a(T- t)[p v(Vo+ VI) + Pel (V - Vo- VI)] - 980 (f - y)
~p,=------------=------------ (18) , (Vo+V,)[l+a(T-t)]
With a num eri cal value of Vi from (11) we solve (lOB) for p,
(12)
8. Values of PI, P2, p:!, . . . P" calculated in eq (12) are valid only whe n the Rotation liquid is identical to the test bath in that it has the same temperature, t , and the same surface tension , y. W e must , therefore, co nstruct a table of de nsities which will Roat the hydrometer at each of the N cardinal points under the general conditions of temperature, T , and surface te nsion , f.
Equation (lOA) s hows equilibrium conditions at the Nth cardinal point und er t and y. The exposed volume of the hydrome ter, Ve , is given by
The n from (lOA)
M+ m.v- p.VVi - PAVP= O. (13)
Since altering t and y of the bath will cause chan ges in m" ps, Vi. and Vp , eq (13) becomes
M + (m,+ ~m,) - (P.I + ~PI) (Vi+ ~Vi )
- PA(Ve+ ~Ve ) = 0. (14)
60
From (lOA) the bracketed term of the numerator of (18) is seen to be equal to (M + m,) , so that
'TTD I , a(T- t)(M + ml) -980 (f-y)
~p, = - Vi [1 + a (T - t) ] (19)
After selecting values for T and f , all terms on the right side of (19) are known ,3 and
R.I=P'+~P' (20)
where RI is the liquid density which wi ll Ro at the hydrometer at its Nth cardinal point when the liquid temperature is T and its surface tension is f .
If geometric measurements associated with this test are made in cen timeters, air and sinker densities in grams per cubic cen ti meter , surface tensions in dynes per centimeter and weighings in grams, then all terms eq (20) will be in grams per cubic centimeter. If S.I' is the numerical value engraved alongside the N th cardinal point on the stem scale of the hydrometer, then
(21)
3The procedure fu r ob tai ning a va lue of Min eq (19) from the balan ce observa tion is ex plaine<i in sec tion 4.
where C\' is the correction whi ch will co nvert th e N th cardinal point into gram s pe r c ubi c ce ntim e te r, provided that (a) the Auid in whi ch th e hydrom e te r Aoats is a t te mperature T and (b) has a s urface te ns ion of t. Violati on of e ith e r co nditi on will res ult in fal se values in eq (2 1).
Inas mu c h as the ADP equipme nt is easily in s tru c te d to calc ul a te tab les of valu es of D.p.\, eq (19), [or a wide se lec tion of T 's and f 's , a correc tion table whic h is appropriate to any foreseeabl e se t o[ co nditions is conve nie ntl y available .
4. Use of The Balance
Observation of the hydromete r Aoatation leve l to 0.1 mm requires an ex perie nced observer working under near-ideal circ ums tan ce. Such an observation re presents a precision of only 5 in 10 4 of a typical 20-cm ste m scale. In order to reduce calibration effort without d egrading quality , we have eliminate d from the calibration procedure mos t of th ese diffi c ult a nd rela tive ly low-prec is ion meas ure me nts, and s ub stitut ed in th eir place meas ure me nts of oth e r hydromete r prope rties whic h can be made to a muc h hi ghe r order of prec is ion with on ly a frac tion of the e ffort.
Th e new calibration procedure relies s trongly upon weight c alc ul a t ions based on balan ce observations. On modern s ingle-pan direc t-reading balan ces s uch de termination s are easily made to parts pe r million . Durin g the calibra tion it is necessary to de t~rmin e the appare nt weight in air of the hydrometer , W" , for use in eq (9), a nd it is al so necessary to de te rmine the apparent wei ght of th e solid-object de nsity s tandard while im mersed in the tes t ba th fo r calculation of P as explained below.
Th ere are two other tasks whi ch are eas ily pe rformed on s uc h balan ces which , although Importa nt to the hydrom ete r calibration , are not a part of the calibra ti on procedure. The firs t task is the de te rmination of the mass of th e hats used in the calibratio n, a nd the seco nd is the de termin ati on of the mass and vo lum e of th e solid-object de nsity s ta nd ard .
Bowman and Schoo nove r [2] have s tudi ed the pe rformance of s in gle·pan direc t-reading balan ces in the above m e ntion ed applications. The brief comments to follow are justified in their pape r.
The appa re nt weight of an object in a medium is a force whi ch is defined as the differe nce betwee n the downward mass force exerted by the object and the upward buoyant force exerted on the obj ect by the medium. Thus , in ~q (9) , the apparent weight in air of the hydromete r , W H , is given by
W,, = M - PIV
where M a nd V are th e mass and volume respec tive ly of the hydrom ete r , a nd P.I th e air de ns ity a t th e in s tant of obse rvation. S in ce a ir de ns it y is a param ete r whi ch is cons tantl y c hangin g with vari a tion s in ba rome tri c press ure, the te mper a ture of th e ai r , a nd its relative humidity (in th a t o rde r of significance), it
61
is necessary to measure these quantities and calculate pA from
.464554B.1 - H.'I (.00252T~ - .020582) PI = TI + 273.16 (22)
where B.I , TI , a nd H.I are the meas ured valu es of barom etri c press ure (in mm of me rc ury), te mperature of the a ir (in ee), a nd re la tive humidity (in pe rce nt ).
W" is th e force exe rted o n th e ba la nce pan by the hydrome te r: howeve r, for reason s ex plain ed in the Bowman-Schoonove r pape r, the .balance obse rva tion , 0" , must be co rrected to ob ta in W"
W H = (OH+C I ) 1--- ( P"I) Ps
(23)
where C I is the true mass correction to the balan ce reading and p s is the density of the built-in balan ce weights . C and p s may be obtained from th e manufacture r , o r th e experime nte r may obtain himself by techniques desc ribed by Mrs. Mildred Jon es in the allpe ndix to th e above pape r. Th e num e ri cal value of W" obtain ed fro m eq (23) is the valu e used in eq (9) in th e bas ic da ta redu ction .
Th e num e ri ca l value of M reguired in eq (19) ma y be obtained from thi s value of W" and an es tim a te of V, and s in ce M = WH + P .. I V. V is ade quately approxima ted by ass uming that the tip volum e of the hydrome ter s te m (fi g. 2) is equal to the sum of a ri ght circula r cylind e r a nd a he misphere; thus
[ ( D.\) (7TD1) 1 ] V= L1'- L'\ -2 4 + 127TD~ +Vo+Vv
wh ere th e brac ke ted term is the tip volume . For minimum error in thi s approximation , D.\, L.I , a nd VI s hould be take n to refer to the top ca rdin al point on th e s te m scale.
If we know th e mass and volum e of a n objec t by virtue of a n inde pe nde nt ex pe rim e nt , we can co mbin e thi s know ledge with a balance-de termination of the obj ec t's appare nt weight in a medium to obtain the de nsity of th e medium itself. This is th e technique used to determin e the density of the tes t bath, p , in e q (1). By a previous hydrostatic and air weighing we determine the mass, M s , and volume , V" of the solid-object density standard. We now s us pe nd the de nsity standard in the test bath by a fin e wire from the balance pan. From th e foregoing argum e nts we know that the apparent weight of the de nsity standard in its me dium (that is, the tes t bath) is
where p is th e bath de ns it y. Also, from (23), we know
where C2 IS th e true mass correction to the balan ce
reading, Os. Equating the above two exp ressions for tv, and solvin g for p , we get
corrections. It should s tate as precisely as possible the conditions under which th e calibration is valid and also the degree of validity. In addition to density, hydrom eters are sensitive to the temperature and surface tension of the liquid in which they fl oat , so all three parameters must be examin ed. Ignoring these two second-order variables results in a calibration of very limited applicability. Under suc h circ umstances the hydrome ter can be used only in liquids whose temperatures and surface te nsions are equal to those of the test bath. Eq (17) introdu ce our best es timates of these extraneo us effect s into the calibration.
(24)
Eq uation (24) provides a numerical value of p for use in the basic data reduction format described in the previous section.
5. The Calibration Report
Except in very unusual cases, a modern instrument calibration must contain more than a table of scale
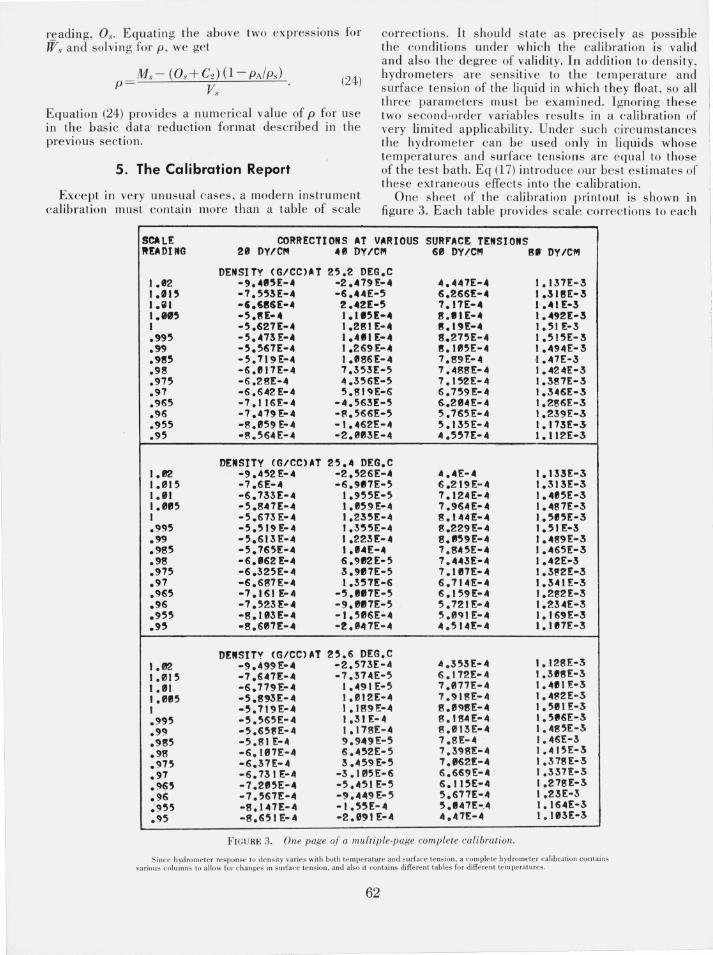
One sheet of the calibration printout is show n in figure 3. Each table provides scale corrections to each
SCALE CORRECTIONS AT VARIOUS SURF'ACE TENSIONS READING 2f1l DY/CI'! U DY/CI'! 6f1l DY"CI'! 8. DY/CI'!
DENSITy (G/CC)AT 25.2 DEG.C 1.02 -9.""5£-" -2 ... "E- .. 4 ... 47E- .. 1.I37E-3 1.11115 -7.553E-" -6 ... 4E-5 6.266E- .. 1.318E-3 I .r. I -'.686E-" 2."2E-5 7 .17E-" I ... 1 E-3 1.1'5 -5.8E- .. 1.1.5E-.. 8.IIE- .. 1 ... 92[-3 I -5.627[-" 1.28IE-" 8. "E-" 1.51E-3 • 995 -5 ... 73E- .. I • .."IE- .. 8.275E-4 1.515E-3 • 99 -5.567E-.. 1.269E-.. !'!. 1 05E-" 1 .494E- 3 .9!'!5 -5.719£-" 1."8H-4 7 .89E-4 1.47E-3 .98 -6.1117[-4 7.353E-5 7.488E-4 1.424E-3 .975 -6.28E-4 4.356E-5 7.152E-4 1.387E-3 .97 -6.642E-4 5.819E-6 6.759E-4 1.3 .. 6E-3 .965 -7.11H-4 -4.563E-5 6..284E";4 1.286E-.3-.96 -7.479£-4 -~.566E-5 5.765E-4 1.239E-.3-.955 -8.059 £-4 -1."62E-4 5.135E-4 1.173£-.3-.95 -8.564£-4 -2.f1l03E-4 4.557E-4 1.112E-.3-
DENSITY (G/CC)AT 25.4 DEG.C 1 • fJ2 -9.452E-4 -2.526E-.. 4."E-4 1.I33E-3 1.015 -7.6E- .. -6.9117E-5 6.219E-4 1.313E-3 1.11 -6.733[-4 1.955E-5 7.124E-4 1.""5E-3 I .0115 -5.847E-4 I.II59E-4 7.964E-4 1.487E-3 I -5.673 E-" 1.235E-4 8.144E- .. 1.5115E-3 .995 -5.519E-4 1.355E-4 8.229E-4 1.51 E-3 .99 -5.613E-4 1.223E-4 8.1159E-4 1."89E-3 .985 -5.765E-4 I.UE-.. 7.8"5E-4 I .465E-3 .98 -6.162 E-4 6.9112E-5 7.4"3E-4 1.42E-3 .975 -6.325E-4 3.9117E-5 7.II17E- .. 1.382E-3 .97 -6.687[-" 1.357E-6 6.7I4E-4 1.3"1 E-3 .965 -7.161 E-4 -5.1117E-5 6.159E-4 1.282E-3 .96 -7.523E- .. -9.11117E-5 5.721 E-4 1.234E-3 .955 -8.113E-" -1.5116E';'4 5.III9IE- .. 1.169E-3 .95 -8.6I17E-" -2.847E-4 ".5I4E-4 1.III7E-3
DENSITY (G/CC)AT 25.6 DEG.C 1.128E-3 1.02 -9.499E-" -2.573E-4 4.35H-4
1.015 -7.647£- .. -7.374E-5 6 •. 172£-4 1.3118E-3 1.11 -6.779£-" 1.491E-5 7.1l77E-4 1.""1 E-3 1.""5 -5.893£-4 1.012E-4 7.918E-4 I. 4~2£-3 I -5.7I9E-4 1.189E-4 8.1198E-" 1.511 1£-3 .995 -5.565£-4 1.31 E-4 8.184E-4 1.5116E-3 .99 -5.658E-4 1.178E-4 8.81:sE-4 1.485E-3 .985 -5.81 [-4 9.949E-5 7.8E-" 1.46E-3 .98 -6.187£-4 6 ... 52E-5 7.398E-4 1.415E-3 .975 -6.37E-" 3.459E-5 7.1162E-4 1.378E-3 .97 -6.731 E-4 -3.105E-6 6.669E-4 . 1.337E-3 • 965 -7.205E-.. -5 ... 5IE-5 6.1 "E-4 1.278E-3 .96 -7.567E-4 -9.449 E-5 5.677E-.4 1.23E-3 ~955 -8.1 .. 7E- .. -1.55£-4 5.1147£-.4 1. 16"E-3 .95 -8.651£-4 -2.891 E-4 4.47E-" 1.183E-3
F IGURE 3 . One page of a multiple·page complete calibration.
S ince hydrome ter res ponse to den sit y va ri es with bot h te mpera tu re and s urface te ns iu lI , a com ple te hyd rometer ca libration conta ins variuus columns l u a llow fur changes in surface tension , and a lso it cont ains different tables for differe nt te mperatures.
62
I I L,
r
cardinal point of the ste m scale, redu cin g the observation to den sity in grams per c ubi c ce ntim ete r. The table is multi-columned in surface te ns ion from 20 to 80 dynes per ce ntime ter. To accou nt for diffe re nces in hydro me te r pe rformance as a fun ction of te mpe rature, a se parate table is give n for each 0,2 °C over th e tem pera ture ra nge for wh ic h calibra tion is requ ired, Thi s type of c alibration re port has the wides t poss ible utilit y ,
in s urface tension inasmuch as the hydrometer user can rarely predict the surface tension of the liquid in whic h the hyd rometer is to be used. As will be pointed out in the ap pe ndix , thi s may be a very unstable factor.
There are two classes of e rrors in the hydrome ter calibrat ion. T he syste matic e rrors associa ted with the tes t apparat us a re ass umed to be a bout equal in all NBS cali brat ions of thi s type. W e can ob ta in a n estimate of th ese errors by notin g the c ha nge in the co mputed correction s whe n th e vario us input data ite ms are varied at th e co mpute r in put by th e es tim ated un certainty in each. Table 1 shows th at t he effect of these errors is about 0.00005 S.G.
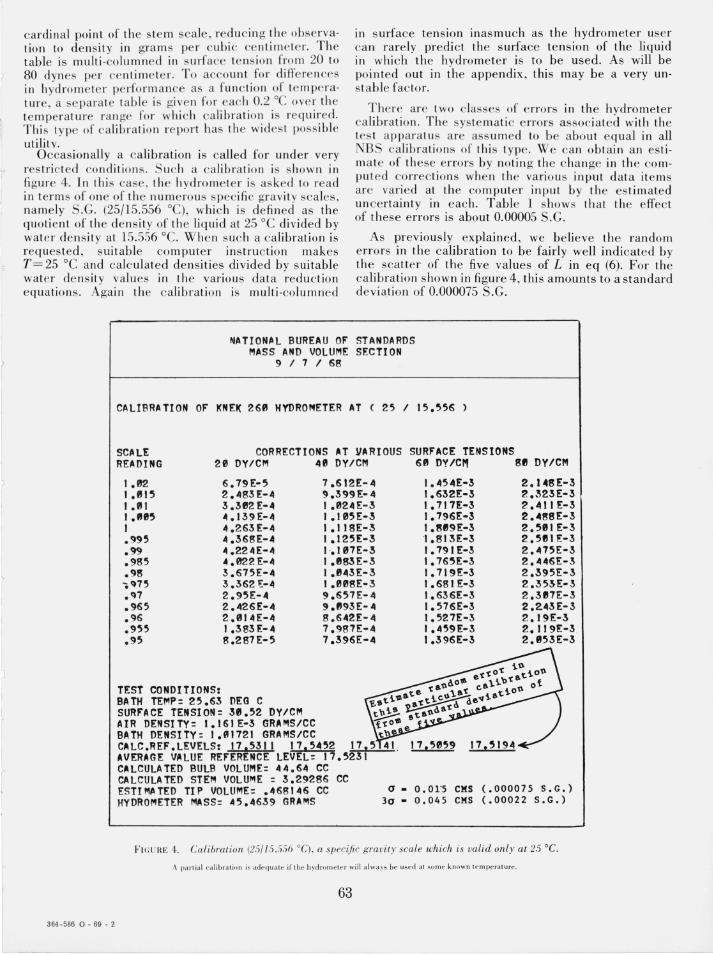
Occasionally a calibration is called for und er very restri cted co ndition s , Such a ca li bration is shown in fi gu re 4_ In thi s case, th e hydrom e te r is as ked to read in terms of one of th e num erou s s pecifi c gravity scales, namely S .G. (25/15.556 0q, which is de fin ed as the quoti ent of the density of the liquid a t 25°C divided by water den sity at 15.556 0c. W he n suc h a calibration is reques ted, suitable compute r instruction makes T = 25°C and calc ulated densities divided by s uitable water de nsity values in the various data reduction equation s. Again the calibration is multi-columned
As previously explained, we believe the random errors in the calibration to be fairly well indicated by the scatter of the five values of L in eq (6). F or the calibration show n in fi gure 4, thi s amounts to a standard deviation of 0.000075 S.G.
364-586 0 - 69 - 2
NATIONAL BUREAU OF STANDARDS MASS AND VOLUME SECTION
9 I 7 I 68
CALIBRATION OF KNEK 260 HYDRO~ETER AT ( 25 I 15.556 )
SCALE CORRECTIONS AT VARIOUS READING 2fil DY/CM
l.fil2 6.79E-5 1.1115 2.483E-4 I .111 3.3112 £-4 l.flfil5 4.139E-4 I 4.263E-4 .995 4.368E-4 .99 4.224E-4 .985 4.022 £-4 .98 3.675E-4 .~75 3.362 £-4 .~7 2.95£-4 .965 2.426£-4 .96 2.014E-4 .955 1.383 E-4 .95 8.287E-5
TEST CONDITIONS: BATH TEI"P= 25.63 DEG C SURFACE T£NSION= 30.52 DY/CI'! AIR DENSITY= 1.161£-3 GRAMS/CC
411 DY/CM
7.612£~4 9.399£-4 l.fil24E-3 1.105£-3 1.118E-3 1.125£-3 h11HE-3 l.tl83E-3 1.843E-3 1.008E-3 9.657£-4 9."93E-4 8.642£-4 7.987£-4 7.396E-4
CC
SURFACE TENSIONS 60 DY/CI'!
1.454E-3 1.632E-3 1.717E-3 1.796E-3 1.8fJ9E-3 '1.813E-3 1.791 £-3 1.765E-3 1.719£-3 1.681 £-3 1.636E-3 1.576£-3 1.521£-3 1.459£-3 1.396E-3
8tl DY/CI'!
2.U8E-3 2.323E-3 ?411£-3 2.488£-3 2.5fJI £-3 2.5fJIE-3 2.475E-3 2.446£-3 2.395£-3 2.35H-3 2.3fJ7£-3 2.2.43E-3 2.19£-3 2.119£-3 2.1Il53E-3
o - 0.01~ CMS (.000075 S.G.) 30 - 0.045 CMS (.00022 s.G.)
FIG U RE 4. Ca libration (25/ 15.556 °C), a spec(fic gravity scale which is valid only at 25°C.
t\ part ial t'u libra li llil is a de<llIate if the h ydrom eter wil l a lwa ys be used a t some known te mpera ture.
63
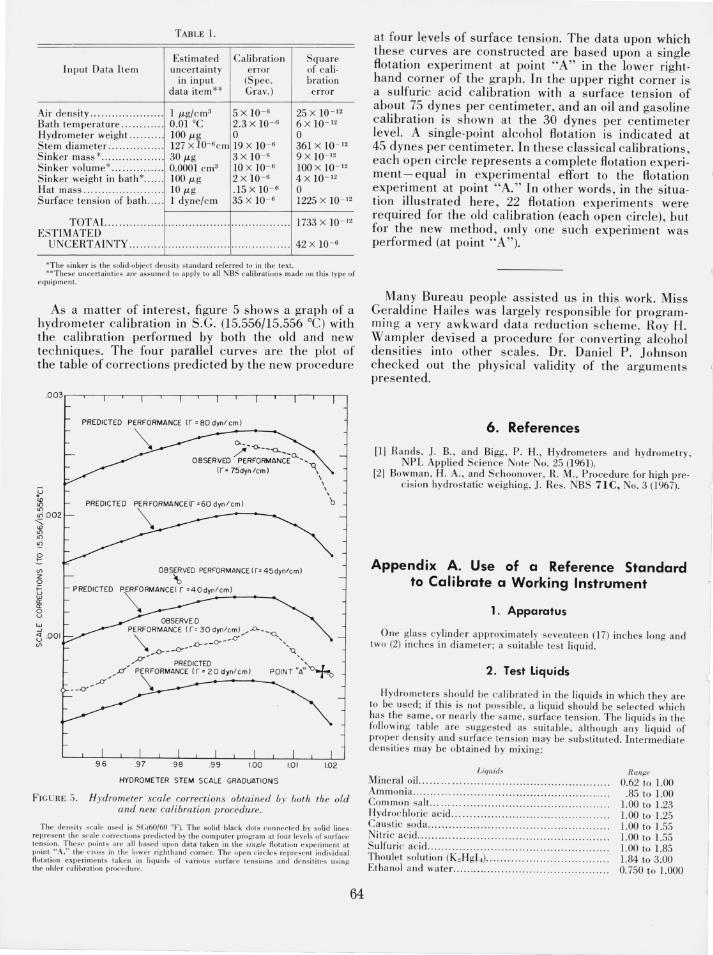
TABLE 1.
Estim ated Cali bration Square In pu t Data Ite m uncertainty error of cali-
in input (Spec. bra tion data item** Grav.) error
Air densi ty .. . . .. . ...... .... .... 1 /-tg/cm3 5 X 10- 6 25 X 10 - 12
Bath te mpe rature ...... ... .. . 0.01 °C 2.3 X 10 - 6 6 X 10- 12
Hydrometer weight. ......... 100 W' 0 0 Stem diam ete r ............... . 127 X lO- 6CIll 19 X 10- 6 361 X 10- 12
Sinker mass *. ....... ........ . 30/-tg 3 X 10- 6 9 X 10- 12
Sinker vo lume* .. .. ..... . ... . 0.0001 cm3 10 X 10- 6 100 X 10- 12
S inker weight in bath * . ..... 100/-tg 2 X 10- 6 4 x lO - 12
Hat mass ... .... ..... .. ......... 10/-tg .15 x I0 - 6 0 Surface te nsion of bath . ... . 1 dyne/em 35 X 10- 6 1225 X 10- 12
TOTAL . .. .. .......... . ................... ....... ... .... ... 1733 X 10 - 12
ESTIMATED UNCERTAINTY .. .. . .. .. .. . ... ... . . .. . . ... . . ............. ... 42 X 10- 6
*Thc sinker is the solid-object dens ity sta nda rd referred to in the text. ** These unce rt a inties are ass umed to apply 10 a ll NBS calibrations made on thi s type of
equ ipmen l.
As a matter of interest, figure 5 shows a graph of a hydrometer calibration in S.C. (15.556/15.556 °C) with the calibration performed by both the old and new techniques. The four parallel curves are the plot of the table of corrections predicted by the new procedure
u
1ll "' .oOOZ
~ "' "' ~ r:e (/l Z o i= irl a:: a:: o u <oJ .-J
3.001 (/l
PREDICTED PERFORMANCE tr = BO dynl eml
~ ~~~-----~~~ /' ---0.. __ 0.
OBSERVED PERFORMANCE -'"Q (r = 75dyn lem I \
PREDICTED P\ORMANCE(r=60_d_Y_n/_e_m_I __ __
OBS\:VED PERFORMANCE (r= 4 5dyn/cml
PREDICTED P~RMANCE( r =40_dy_n_/c_m_I ___ ...
OBSERVED PERFORMANCE (r o 30 dyn/eml /.0-_-"0-
" _.0- __ 0- -_.0' ", \0 <:r--O-- "Q.
\ \ \
\
b
,/p... ... PREDICTED ",
__ <r_p/..cf P\ORMANCE(r=ZOdyn/eml POINT·'A"'O+o
HYDROMETER STEM SCALE GRADUATION S
FtG U RE 5. Hydrometer scale corrections obtained by both the old and new calibration procedure.
T he de nsit y sca le used is 5(;(60/60 OF). The so lid black dots con nec ted by so lid lines represent the sca le correc tions predic ted by the computer pro~rarn at four levels of su rface ten sion. These puint s are all based upon data ta ke n in the .~iflgle flotatio n experi me nt a t point " A," the c ross in the lowe r righllwnd corne r. The open c ircles represe nt individual flotat ion experiment s taken in liquid s of various s urface te ns ions and den silites us in g: the o lder ca li bratioll prucedure.
64
at four levels of surface tension. The data upon which these curves are constructed are based upon a single flotation experiment at point "A" in the lower righthand corner of the graph. In the upper right corner is a sulfuric acid calibra tion with a surface tension of about 75 dynes per centimete r , and an oil and gasoline calibra tion is shown at the 30 dynes per centimeter level. A single-point alcohol flotation is indicat ed at 45 dynes per centimeter. In these classical calibrations, each open circle represents a comple te flotation e xperi· ment - equal in experimental effort to the flotation experiment at point "A." In other words, in the situa· tion illustrated here, 22 flotation experiments were required for the old calibration (each open circle), but for the new m ethod, only one such experiment was performed (at point "A").
Many Bureau people assisted us in this work. Miss Geraldine Hailes was largely res ponsible for programmin g a very awkward data redu ction sche me. Roy H. Wampler de vised a procedure for converting alcohol de nsities into other scales . Dr. Daniel P. Johnson checked out the physical validity of the arguments presented.
6. References
[1] Rands, J. B. , and Bigg, P. H. , Hydrometers and hydrometry , NPL Ap plied Scie nce Note No. 25 (1961).
[21 Bowman , H. A., and Schoonover, R. M., Procedure for hi gh prec ision hydros tatic weighing, J. Res. NBS 71C, No.3 (1967).
Appendix A. Use of a Reference Standard to Calibrate a Working Instrument
1. Apparatus
One glass cylinder approximately seventeen (17) inches long and two (2) inches in diameter; a suitable test liquid.
2. Test Liquids
Hyd rometers shou ld be cali brated in the liqu ids in which they are to be used; if this is not possible, a liquid should be se lected which has the sa me, or nearly the sa me, surface tension. The liquid s in the following tab le are suggested as suitable, alth ough any liquid of proper densit y and surface te nsion ma'Y be substitut ed. Intermediate dens ities may be obtained by mixing:
Liquids
Mineral oil.. ...... .. ........... ... ....... ...... . . . ... .. ... . . .. . Ammonia ........ .. ........ . .. . . .. . . ...... ............ .. . . ... .. . . Com mon saIL .. ........... .. .. ... ..... . . ... . ... . .... .. . . ...... . Hydrochloric acid .... .. . .. .... . . .. . .. .... .. . .. ..... ... . .. . .. . . Caus ti c soda ... .. .......... . ... ... ..... . . . .. ... . .. . . ... . ... . ... . Nitric acid ... .... .... ........ .... ................. .. ..... . .. . . . . . Su lfuri c acid .... ... .... .. .. ...... . . ... ... ............. .. ....... . Thou let solution (K2 HgI.) ... .. ............. .. .. . ... . Ethanol and water . ....... ... ... ... .. . .......... . .......... . . .
Range
0.62 to 1.00 .85 to 1.00
1.00 to 1.23 1.00 to 1.25 1.00 to 1.55 1.00 to 1.55 1.00 to 1.85 1.84 to 3.00 0.750 to 1.000
\
I I'
I
3 . Preparation
(a) Clean! iness. The accuracy of hydro meter obse rva ti o ns de pend s upon th e
c leanliness of the ins trum e nt s a nd o f th e liquid s in wh ich the observations are made. Ex tra care s hould be tak en to kee p the liquid surface free of co nt am ination.
In ordeJ' tha t readin gs s hall be uniform a nd re produ c ible, th e surface of th e h yd ro me te rs , a nd es pecia lly of th e s tem, mu s t be clea n, so tha t the liquid will ri se uniforml y a nd merge int o a n impe rce ptible film on the ste m.
The readiness with whi c h thi s co ndition is fulfill ed depends somewha t upon the charac te r of the liquid. Cert a in liquid s, s uc h as mine ra l oil s and s trong a lcoho li c mi xtures, a dh ere to the s te m very readil y. On the othe r hand , with weak aqu eous so lution s of sugar, sa lt s, ac ids, and a lcohol, sc rupulous cleani ng of the s te m is required in order to secure the normal condition.
Before being tested , hydrome ter s may be thoroughl y c leane d by dipping in a mixture of one part concentrated s ulfuri c acid and two part s fumin g sulfuric acid , rinsed with wate r, and dried by wiping with a c lea n, lint·free cloth ; or they may be washe d with soap and wa ter, dried , and wiped with a c loth mois te ned with alcohol to re move a ny res idual soap film. The stem s ca n usually be kept clean during testing by wiping with a lcoho l (preferably absolute) a nd dryin g be fore each readin g.
[n man y liquid s spontaneo us chan ges in s urface ten s ion occur du e to the formation of surface film s of impurities, whi ch may come from the apparatus, th e liquid , or the a ir. In orde r to avo id the e rro rs due to these c hanges, the liquid s urface could be cleane d with a vacuum hose o r the liqu id in the cyl inde r cou ld be ca used to ove rflow ju st prior to reading the hydrome ter.
The necess ity for s uc h specia l manipula tion is confin ed to th e read· ing of hydwmete rs in liquids tha t are s ubjec t to s urface co ntam ina· ti on. S uc h , in ge ne ral , a re a queous so lutio ns or mixtures of acids, alka li es, sa lt s, sugars, and weak alco hol mixtures. Oil s, alcoholi c mi xtu res of strength above 40 pe rce nt by volum e, and oth e r liquids of re la tive ly low s urface te ns ion a re not , in ge ne ra l, li a ble to s urface contami na tion sufficient to cause apprecia ble cha nges in h yd romete r read ings.
(b) Temperature.
In o rde r that a hydro mete r may indi ca te correc t Iy the d ensit y o r stre ngth of a s pecified liquid , it is esse nti a l th at the liquid be uniform thro ug hout and at the temperature s pecified o n the ins trume nt. If a n obse rv a tion i s made at some other tempe rature than tha t for which the h ydro me te r is des igned , the reading will be in erro r. The magni tud e of the e rror will depe nd upon the th e rmal expan sio n of the hyd rometer and , in some cases, of th e liquid used.
If the la tt e r prope rti es are known , tables of correc tions fo r tem· pe ra tu re may be pre pa red for use with hydromete rs at various tempe ra tu res . S uch ta bles should be used wi th cautio n, and onl y for approximate result s when the temperature differs much from the sta nd ard te mperature or from the te mperature of the s urro undin g a ir. (See ta ble 28, NBS Circula r C l9.)
Pub lica ti ons in which te mpe rature correc tion tables may be fOllnd are li s ted below.
65
- - .-- -----
Liquid
Et hyl alcohol. ............. ... . .
Pe trol e um oil s ........ .... . .. . .... .
Sulfur ic ac id so luti ons . .. . S u ~a r olutions .. Vegeta ble ta nnin g e xt rac ts .... . . Turpe ntine ...
Publica.lion
NBS Circular 19; Gauging Manual, 1938, U.S. Treasury Depart menl , Bureau of In· te rn al Reve nue.
NBS C irc ular 19; ASTM-IP Petrol e um Meas ure me nt Tabl es.
NBS C irc ular 19. NBS C irc ul a rs 19 ann 440. NB S C irc ular 449. NBS T echnica l Pape r 9.
In co mparing two hydrometers havin g the sa me sta ndard te mpe ra· ture and made of the sa me type of glass, the te mpera ture of th e liquid need not be conside red , since the correc tion req uire d due to variation from standard tem pe rature is the sa me for both ins tru , me nts. But the temperatures of the liquid , the hydromete rs, and th e surrounding atmosphere should be nearly equal during the obse rva · tion; othe rwise , th e temperature of the liquid will be c hanging, ca using differences in dens ity. To insure uniformity in the liquid , thorough mixing is required shortly before making the observation. This ma y be accomplished with a perforat ed disk or spiral at the end of a rod long enough to reach the bottom of the cylinder. Motion of thi s s tirrer from top to bottom se rves to di s perse layers of the liquid of diffe re nt dens ity.
4. Test Procedure
(a) POllr int o the cy lind e r a suffi c ie nt amount of the a ppropriat.e tes t liquid to floa t the hydromete r. P our the liqui d s lowl y down th e s id e of the cylin de r to avo id the forma tion of a ir bubbles.
(b) S tir the liquid, avo iding the formation of a ir bubbles. Mak e sure th e liquid is approxima te ly at room te mperature.
(c) imme rse the standard hydrometer in the liquid slightl y beyond the point whe re it Aoats naturally, the n allow it to float free ly.
(d) Observe a po int slightly below the plane of the liquid surface and the n raise the line of vision until thi s surface, seen as an ellipse, becomes a s traight line. The point where this very fine line c uts th e hydrom e te r scale is the reading of the instrument. Holding a white card be hind th e cylinder just be low the liquid le vel will improve the vi s ibility of the surface.
(e) Imm erse the hydrom ete r to be tes ted as out.lined in item (c), read the hydrometer as outlined in ite m (d).
(I) Again , read the s tandard hydromete r as out lined in ite ms (c) and (d).
(g) Average the s tandard readings and a ppl y sca le co rrec tions, supplied by NBS, to the average s ta nda rd reading.
(h) The difference be twee n the ave rage correc ted s ta nda rd readin g and the reading of the hydro me te r be ing tes ted will be its correc tion at tha t point on the scal e.
(Paper 73C3&4- 289)