Embed Size (px)
Citation preview
An Improved Global Snow Classification
Dataset for Hydrologic
Applications
(Photo by Kenneth G. Libbrecht and Patricia Rasmussen)
Glen E. Liston, CSU
Matthew Sturm, CRREL
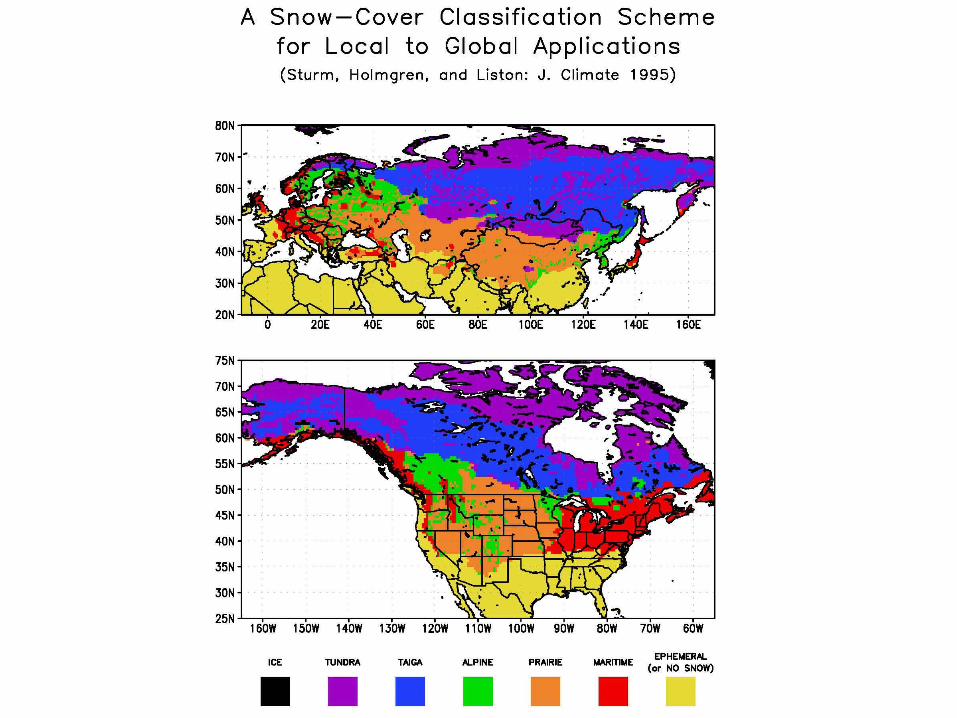
Sturm, Holmgren, and Liston (1995)
(0.5 degree lat-lon grid, ~50 km grid)
Liston and Sturm (2011, in preparation)
(30 arc-second [0.00833 degree] lat-lon grid, ~1
km grid)
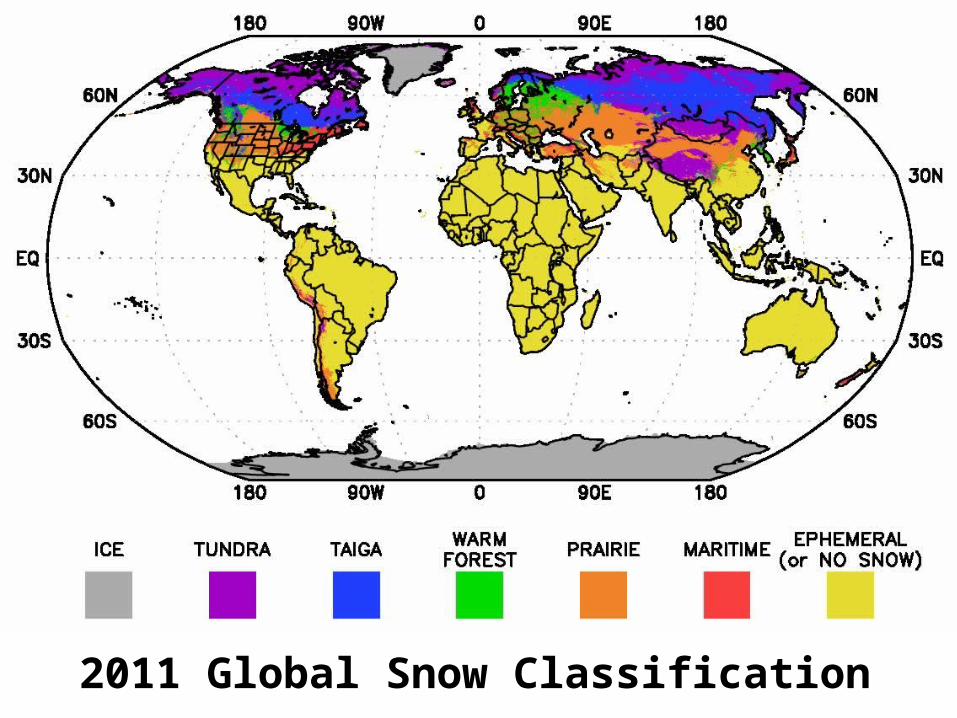
2011 Global Snow Classification
Air Temperature
Precipitation
Wind Speed
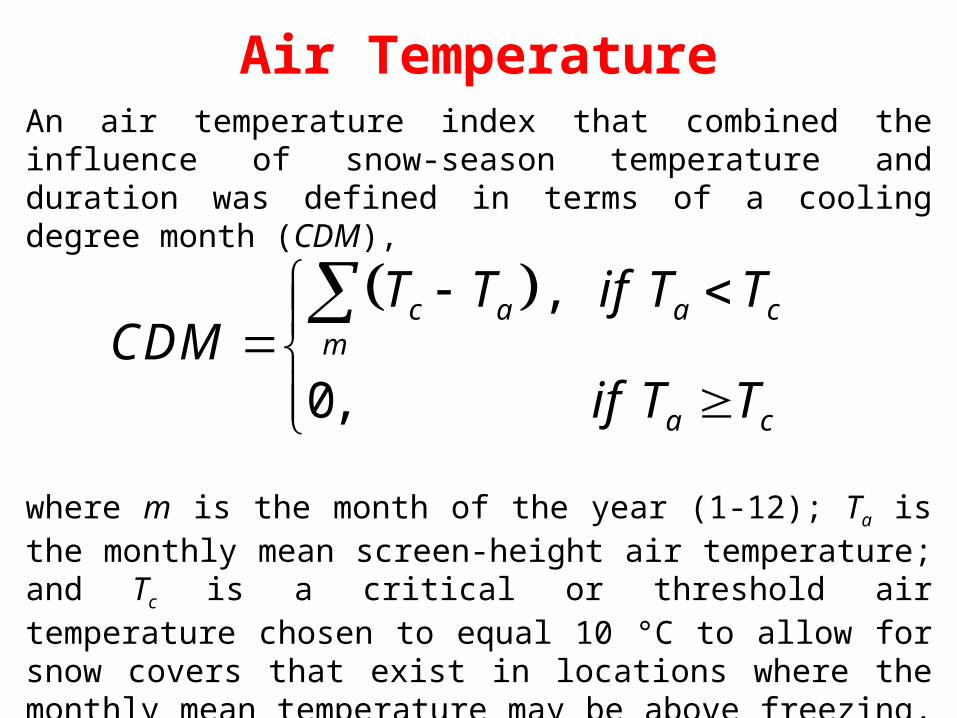
Air TemperatureAn air temperature index that combined the influence of snow-season temperature and duration was defined in terms of a cooling degree month (CDM),
where m is the month of the year (1-12); Ta is the monthly mean screen-height air temperature; and Tc is a critical or threshold air temperature chosen to equal 10 °C to allow for snow covers that exist in locations where the monthly mean temperature may be above freezing, a condition typically found where there are wet, warm snow covers.
,
0,
c a a cm
a c
T T if T TCDM
if T T
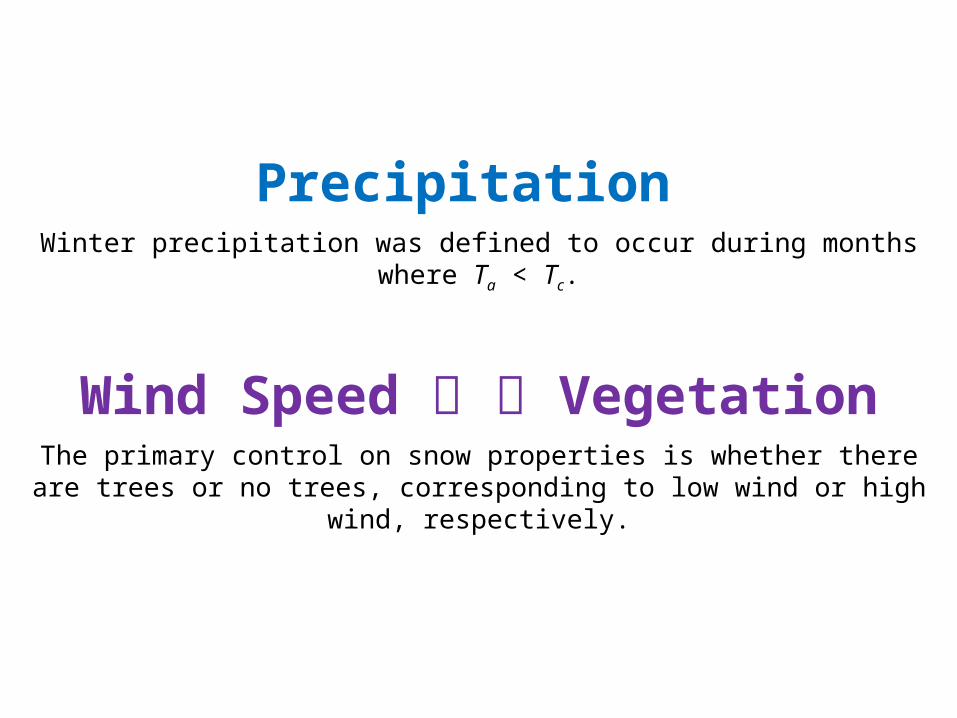
Precipitation Winter precipitation was defined to occur during months where Ta < Tc.
Wind Speed VegetationThe primary control on snow properties is whether there are trees or no
trees, corresponding to low wind or high wind, respectively.
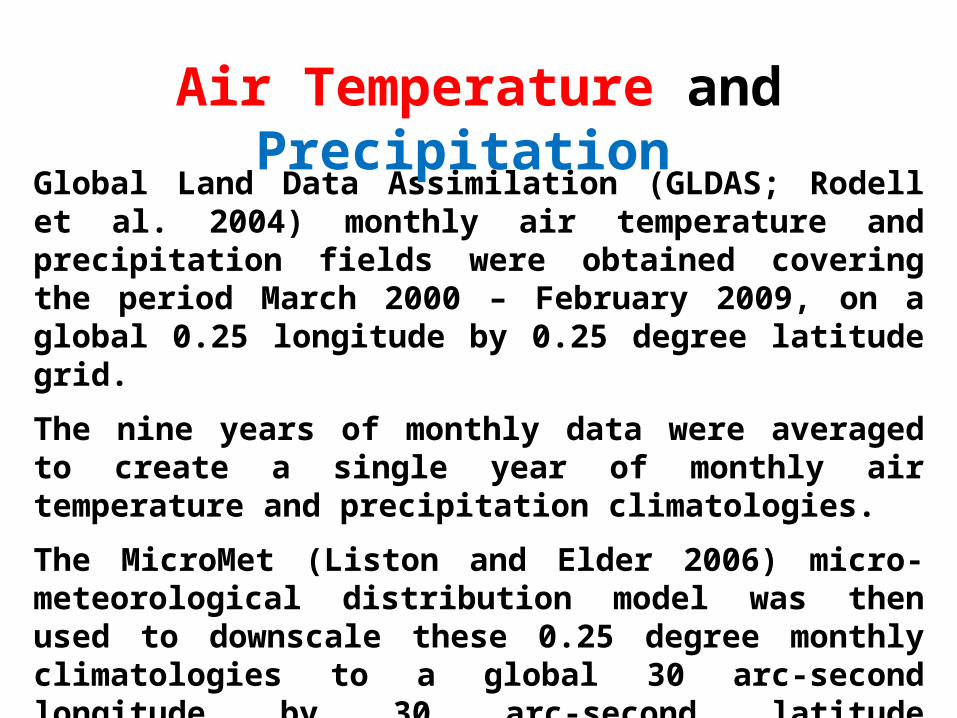
Global Land Data Assimilation (GLDAS; Rodell et al. 2004) monthly air temperature and precipitation fields were obtained covering the period March 2000 – February 2009, on a global 0.25 longitude by 0.25 degree latitude grid.
The nine years of monthly data were averaged to create a single year of monthly air temperature and precipitation climatologies.
The MicroMet (Liston and Elder 2006) micro-meteorological distribution model was then used to downscale these 0.25 degree monthly climatologies to a global 30 arc-second longitude by 30 arc-second latitude (approximately 1-km by 1-km) grid.
Air Temperature and Precipitation
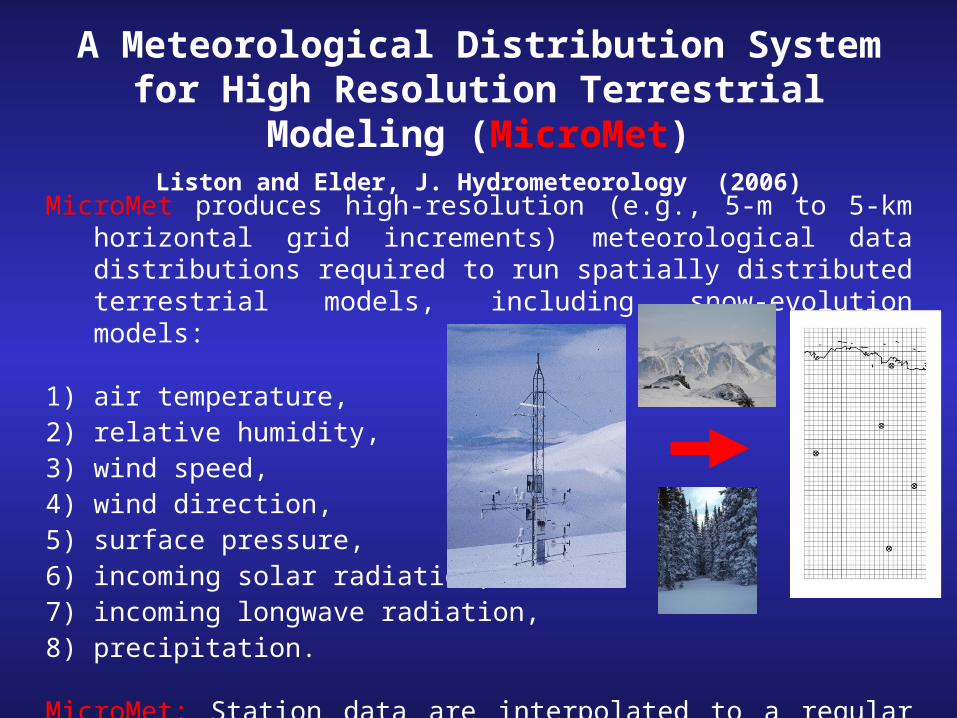
A Meteorological Distribution System for High Resolution Terrestrial Modeling (MicroMet)
Liston and Elder, J. Hydrometeorology (2006)
MicroMet produces high-resolution (e.g., 5-m to 5-km horizontal grid increments) meteorological data distributions required to run spatially distributed terrestrial models, including snow-evolution models:
1) air temperature, 2) relative humidity, 3) wind speed, 4) wind direction, 5) surface pressure,6) incoming solar radiation, 7) incoming longwave radiation,8) precipitation.
MicroMet: Station data are interpolated to a regular grid and physically-based adjustments are made to the interpolated fields.
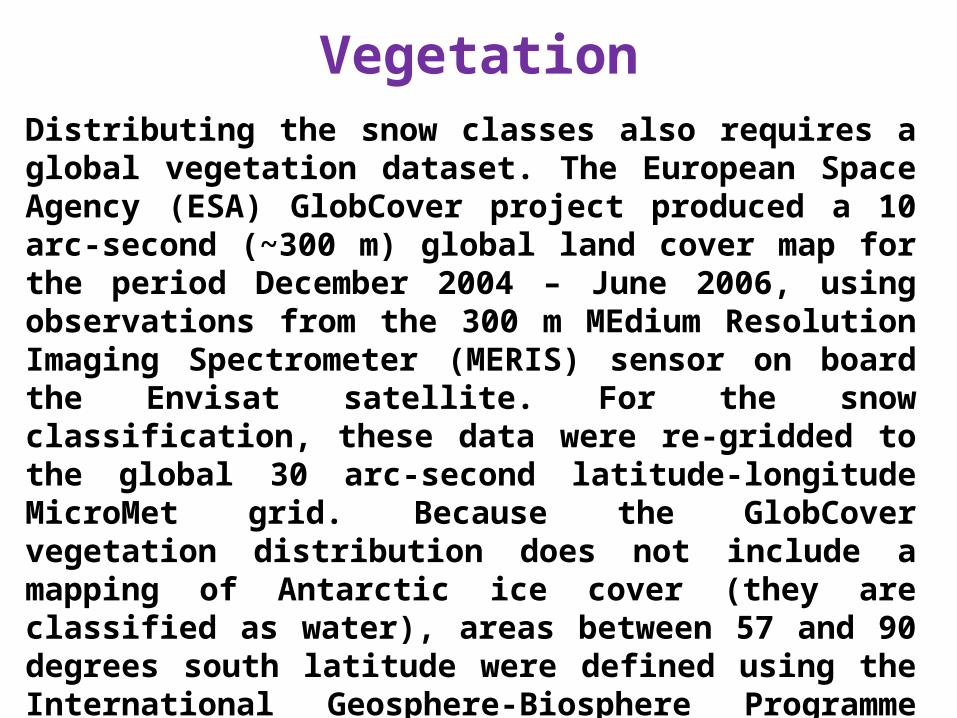
VegetationDistributing the snow classes also requires a global vegetation dataset. The European Space Agency (ESA) GlobCover project produced a 10 arc-second (~300 m) global land cover map for the period December 2004 – June 2006, using observations from the 300 m MEdium Resolution Imaging Spectrometer (MERIS) sensor on board the Envisat satellite. For the snow classification, these data were re-gridded to the global 30 arc-second latitude-longitude MicroMet grid. Because the GlobCover vegetation distribution does not include a mapping of Antarctic ice cover (they are classified as water), areas between 57 and 90 degrees south latitude were defined using the International Geosphere-Biosphere Programme (IGBP) land-cover classification, available through the USGS EROS Data Center.
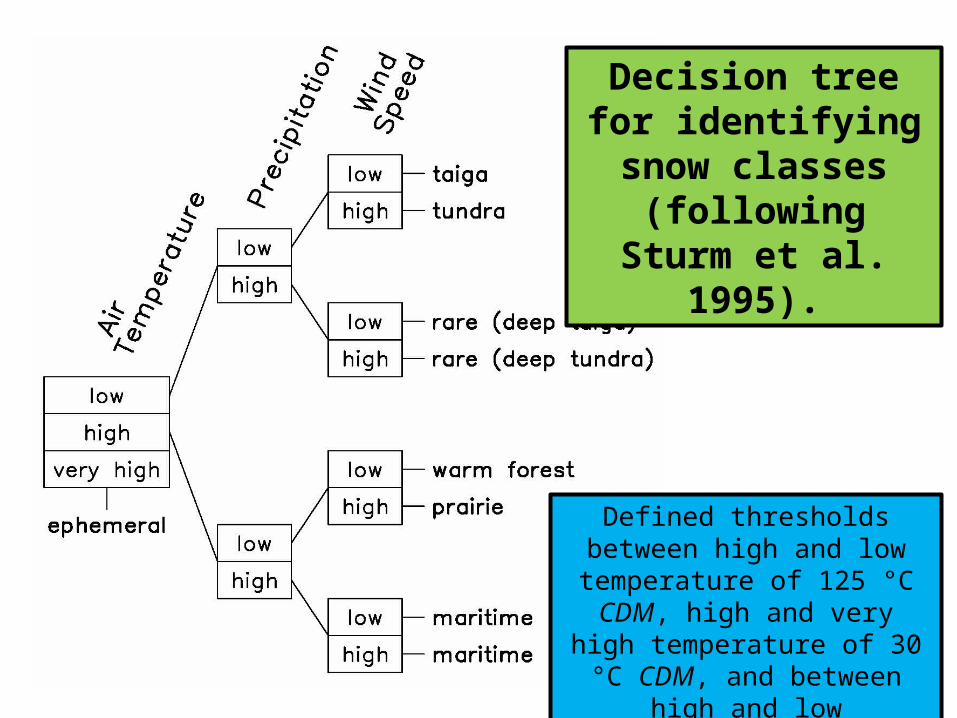
Decision tree for identifying snow
classes (following Sturm et al. 1995).
Defined thresholds between high and low temperature of 125 °C CDM, high and very high temperature of 30 °C CDM, and between high and
low precipitation of 2 mm day-1.
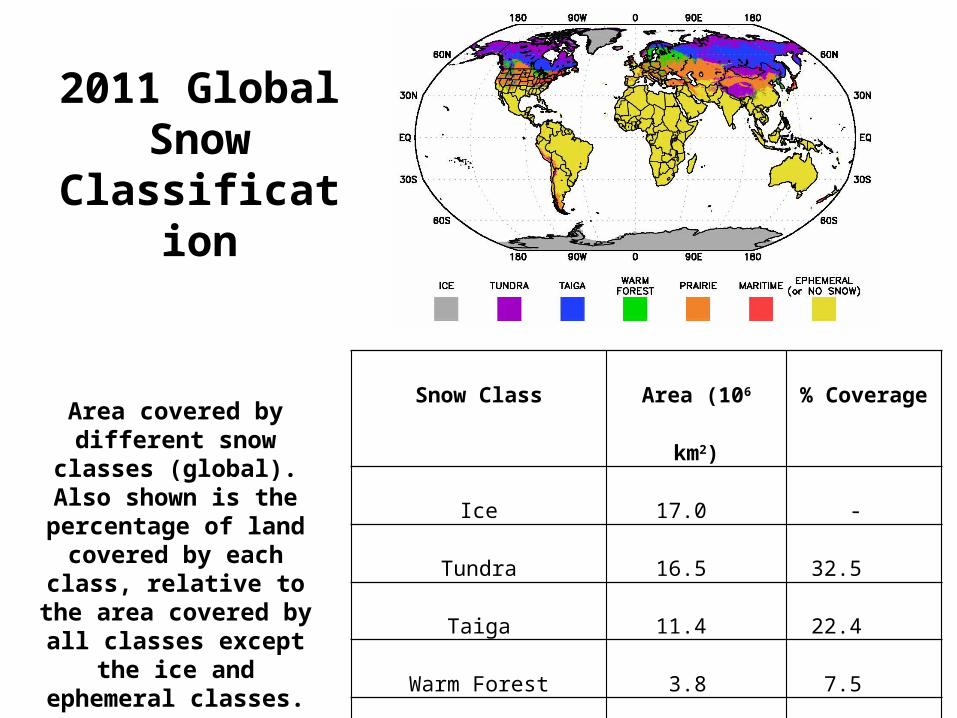
Snow Class Area (106 km2) % Coverage
Ice 17.0 -
Tundra 16.5 32.5
Taiga 11.4 22.4
Warm Forest 3.8 7.5
Prairie 15.5 30.5
Maritime 3.6 7.1
Ephemeral (or No Snow) 78.2 -
Area covered by different snow classes (global). Also shown is the percentage of land covered by each class,
relative to the area covered by all classes
except the ice and ephemeral classes.
2011 Global Snow
Classification
Defining snow parameter values for regional and global snow-process and climate modeling at fine spatial scales.
Defining parameter values to enhance snow remote-sensing algorithms.
Categorizing and/or stratifying field measurements and/or model outputs.
Defining parameter values for snow-property models such as depth-density relationships.
Example Applications
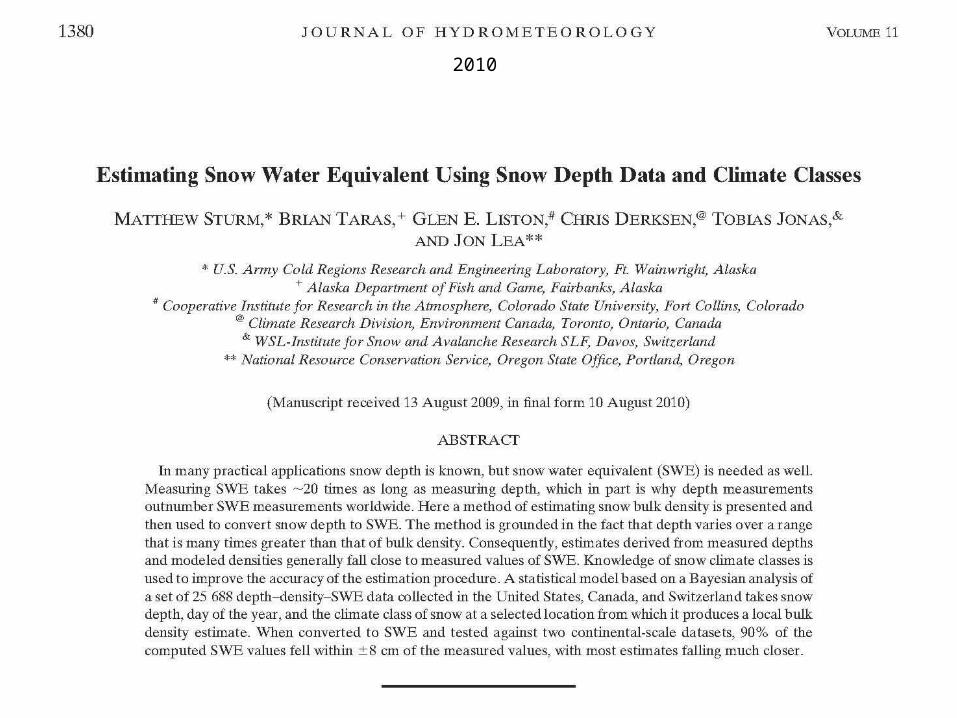
2010
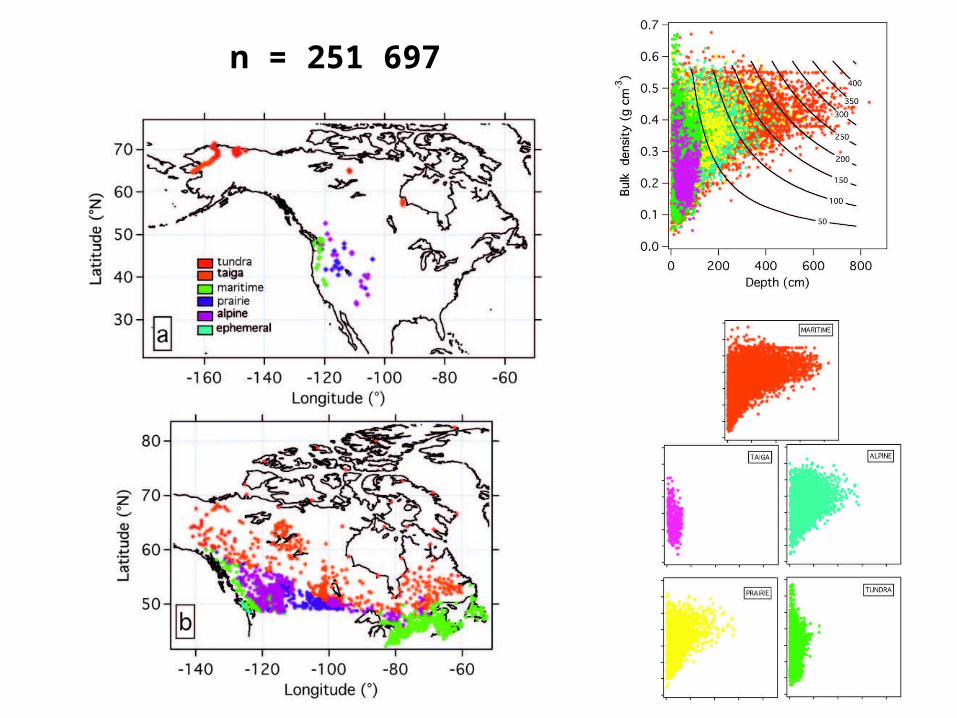
n = 251 697

His final equation includes the effect of snow depth [h], the effect of snow age (older snow is generally deeper and denser than younger snow) through the use of DOY, and indirectly includes the effects of climate (temperature, precipitation, and wind) through the use of snow classes:
where k1 and k2 are densification parameters for depth and DOY, respectively; ρmax, ρ0, k1, and k2 vary with snow class (Table 4); and i indicates the i-th observation.
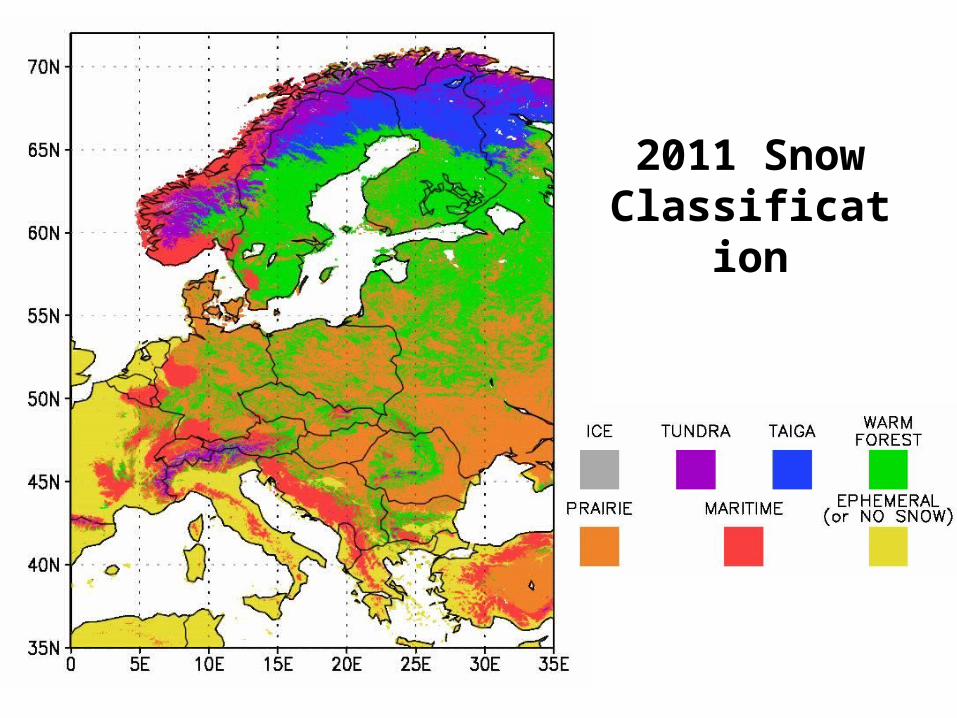
2011 Snow Classification

The End