Embed Size (px)
Citation preview

An Improved Fuzzy C-means Method for Brain MR
Images Segmentation
Shunfeng Wang, Zhiyuan Geng, Jianwei Zhang, Yunjie Chen, Jin Wang
School of Mathematics and Statistics, Nanjing University of Information Science and
Technology, Nanjing 210044, P.R.China
Abstract Due to the effect of noise in brain MR images, it is difficult for the
traditional fuzzy c-means (FCM) clustering algorithm to obtain desirable
segmentation results. Combining the information of patch to reduce the effect
of noise has been a focus of current research. However, the traditional patch
method is isotropic, so that it would lose the structure information easily. In this
paper, a novel fuzzy C-means method based on the spatial similarity
information is proposed. To be anisotropy and preserve more structure
information, this method takes both the non-local information and spatial
structural similarity (SSIM) between the image patches into consideration, and
then a new distance function is established between every pixels and category
centers for image segmentation. The efficiency of the proposed algorithm is
demonstrated by experiments of synthetic brain MR images.
Keywords Brain MRI; Fuzzy c-means clustering; Image segmentation;
Structural similarity measurement
1 Introduction
Brain disease is one of the principal diseases menacing human health nowadays.
Utilizing the brain imaging techniques to analyze its function quantitatively is an
important help for the diagnosis of brain disease. Magnetic resonance (MR) image
acquisition is a medical imaging technique used in radiology to display internal
structures of the body in detail. Reliable quantitative analysis of MR images can be
performed by using image segmentation.
Image segmentation is defined as the partitioning of an image into non-overlapped,
consistent regions, each with distinct characteristics, such as intensity, texture or color.
Fuzzy segmentation methods are of considerable benefits, owing to the uncertainty of
MR image. In particular, the transitional regions between tissues are unclear and their
memberships are intrinsically vague [1]. Fuzzy c-means (FCM) clustering algorithm
[2] is the best known and powerful method in fuzzy segmentations methods and its
success chiefly attributes to the introduction of fuzziness for the belongingness of
each image pixels. Unfortunately, MR images always contain uncertainly and
unknown noise evoked by imaging mechanism. There is no consideration of spatial
Advanced Science and Technology Letters Vol.31 (MulGraB 2013), pp.216-221
http://dx.doi.org/10.14257/astl.2013.31.48
ISSN: 2287-1233 ASTL Copyright © 2013 SERSC

information in standard FCM clustering algorithm, so it is very sensitive to noise.
In this paper, we propose a novel fuzzy c-means method for brain MRI
segmentation. This method incorporates two influential factors. One is the non-local
information determined by pixels whose neighborhood configurations look like the
neighborhood of the pixel of interest; the other is the spatial structural similarity
(SSIM) [3, 4] to extract structure information from image patches sufficiently.
Consideration of the two constraints can effectively restrain the noise in the image
and preserve more structure information as shown in our experiments.
2 Proposed method
In this section, a novel fuzzy C-means method based on the spatial similarity
information is proposed to overcome the drawback of the standard FCM. We
replace each pixel used in constructing the objective function of FCM with the
corresponding image patch. Our proposed method views each image patch,
instead of each pixel, so that spatial information is incorporated intrinsically into
the segmentation process. It incorporates the non-local information and SSIM to
be anisotropy and preserve more structure information.
It is common knowledge that the FCM-based image segmentation result is
decided by the membership value. The membership value is decided by the
distance measurement. So we can infer that the distance measurement is the key
to segmentation success. In our method, a new distance function is established
by non-local information and SSIM.
2.1 Structural similarity (SSIM) measurement
The structural similarity (SSIM) index [3] is proposed by Zhou Wang et. al. to
measure image similarity. It has shown superior performance over signal to
noise ratio (SNR) and peak signal to noise ratio (PSNR). In SSIM theory, natural
image are of highly structured, adjacent pixels have strong inter-dependencies,
and these dependencies carry important information about the structure of the
image.
The SSIM metric is calculated between two patches x and y of common size
N×N is
1 2
2 2 2 2
1 2
( 2 )( 2 )( , )
( )( )
x y x y
x y x y
c cS S IM x y
c c
(1)
where μ is the average, σ2 is the variance, and σxy is the covariance of x and
y. c1 and c2 are two variables to stabilize the division with weak
denominator, which are defined as
2
1 1( )c k L ,
2
2 2( )c k L (2)
Advanced Science and Technology Letters Vol.31 (MulGraB 2013)
Copyright © 2013 SERSC 217

where L is the dynamic range of the pixel-values. k1=0.01 and k2=0.03 are
selected in our study.
The larger the value of SSIM is, the higher the similarity of two patches.
2.2 Algorithm
The proposed method takes the SSIM into the weight measurement between
the adjacent patches to establish a new distance function. The new distance
function between xk and vi is given as follows
2 2( , ) ( , ) ( , )
j k
k i j k j i
x N
D x v w x x d x v
(3)
where Nk denote a search window of fixed size with respect to a center pixel xk .
The weight function is defined as
( , ) (1 ) ( , ) ( , )j k k s s im j k k n l j k
w x x w x x w x x (4)
Here we set Pk denote a patch of fixed size with respect to a center pixel xk, as
same for Pj to xj. Then the weight influenced by SSIM is presented as
( , )( , )
( )
s s im j k
s s im j k
k
w x xw x x
R x (5)
where ( , )s s im j k
w x x represents the SSIM-weight between Pk and Pj. R(xk) is
sum of SSIM-weight in Nk. In fact, the resultant SSIM value is a decimal value
between -1 and 1, so we set the SSIM-weight as
1 2
2 2 2 2
1 2
( 2 )( 2 )
( )( )
( , )
P P P Pj k j k
P P P Pj k j k
C C
C C
ss im j kw x x e
(6)
and ( ) ( , )
j k
k s s im j k
x N
R x w x x
(7)
In addition, the weight function influenced by non-local information is given
as follows
1( , ) ( , )
( )n l j k j k
k
w x x U x xZ x
(8)
Advanced Science and Technology Letters Vol.31 (MulGraB 2013)
218 Copyright © 2013 SERSC

where ( , )j k
U x x is the exponential form of the similarity, and ( )k
Z x is the
normalizing constant 2
2 ,
2
|| ( ) ( ) ||
( , )
j k av P v P
h
j kU x x e
(9)
2
2 ,
2
| | ( ) ( ) ||
( )
j k a
j k
v P v P
h
k
x N
Z x e
(10)
The similarity between two pixels xk and xj depends on the similarity of the
intensity gray level vector v(Nk) and v(Nj). The similarity is measured as a
decreasing function of the weighted Euclidean distance 2
2 ,| | ( ) ( ) ||
j k av P v P ,
where α is the standard deviation of the Gaussian kernel. The parameter h is a
degree of filtering to control the decay of the exponential function.
Finally, the tradeoff parameter of two weights is defined as
m ax ( ( , ))k
k n l j kj N
w x x
(11)
Then new distance function has been defined, the update equations of the
membership function and the cluster center are given as follows
2 / ( 1 ) 1
1
( , )( ( ) )
( , )
c
mk i
ik
j k j
D x
D x
(12)
1
1
n
m
ik k
k
i n
m
ik
k
x
(13)
We can describe our proposed method as below
Step 1: Set the number of clusters c. Initialize the fuzzy cluster centroid vector
V= [v1, v2… vc] by k-means clustering algorithm and set ε>0 to a very small
value.
Step 2: Set the patch size and search window size.
Step 3: Calculate w(xj,xk) using Eq. (4).
Step 4: Update D2(xj,xk)
(t+1) using Eq. (3).
Step 5: Update ( 1 )t
ik
using Eq. (12).
Step 6: Update ( 1 )t
i
using Eq. (13).
Advanced Science and Technology Letters Vol.31 (MulGraB 2013)
Copyright © 2013 SERSC 219

Step 7: Repeat Steps 4-6 until satisfy the termination criterion ||V(t+1)-V(t)||<ε.
3 Experimental results and analysis
In order to test the reliability and validity of the algorithm, we execute the
segmentation on synthetic brain MR images from the McConnell Brain Imaging
Center at the Montreal Neurological Institute, McGill University. We set c=4,
h=16, ε=10-5
, the radius of search window is 5, and the radius of patch is 3.
Fig.1. (a) and (d) shows original images with noise level 5% and 7%,
respectively. Fig.1. (b) and (e) shows segmentation result by FCM, we can find
that due to the effect of the noise, many wrong results appear especially on white
matter. Fig.1. (c) and (f) shows result by our proposed method, this method can
not only be robust to noise, but also preserve the slender structure effectively.
(a) (b) (c) (d)
(e) (f)
Fig.1. Segmentation of the synthetic brain MR images. (a) Original image with noise level
5%; (b) Result of FCM; (c) Result of our method; (d) Original image with noise level 7%;
(e) Result of FCM; (f) Result of our method
In order to quantitatively evaluate the benefits, we segmentation 20 sets of
synthetic brain MR images with different levels of noise. We use the Jaccard
similarity (JS) index to estimate the accuracy of segmentation.
1 2
1 2
1 2
| |( , )
| |
S SJ S S
S S
(14)
where S1 is the ground truth, and S2 is the segmentation result. A good algorithm
would give high JS values. The average quantitative results of white matter
(WM) and gray matter (GM) are listed in Table.1. It can be seen that our
Advanced Science and Technology Letters Vol.31 (MulGraB 2013)
220 Copyright © 2013 SERSC
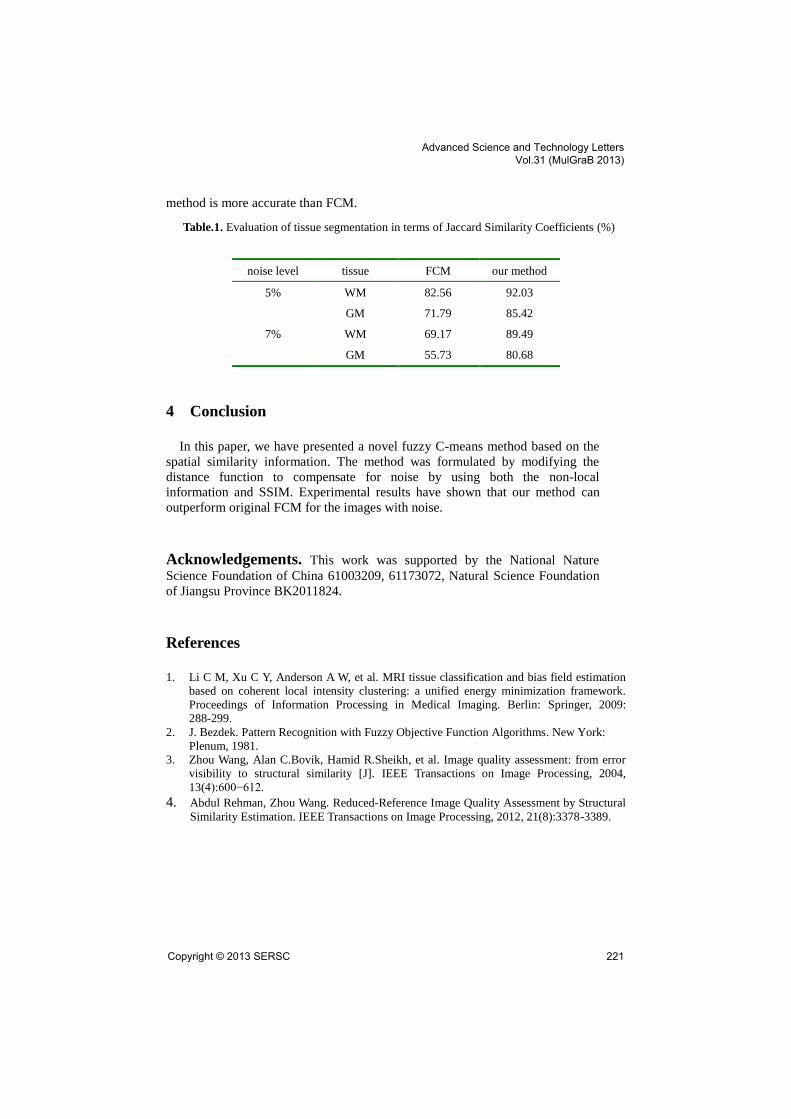
method is more accurate than FCM.
Table.1. Evaluation of tissue segmentation in terms of Jaccard Similarity Coefficients (%)
noise level tissue FCM our method
5% WM 82.56 92.03
GM 71.79 85.42
7% WM 69.17 89.49
GM 55.73 80.68
4 Conclusion
In this paper, we have presented a novel fuzzy C-means method based on the
spatial similarity information. The method was formulated by modifying the
distance function to compensate for noise by using both the non-local
information and SSIM. Experimental results have shown that our method can
outperform original FCM for the images with noise.
Acknowledgements. This work was supported by the National Nature
Science Foundation of China 61003209, 61173072, Natural Science Foundation
of Jiangsu Province BK2011824.
References
1. Li C M, Xu C Y, Anderson A W, et al. MRI tissue classification and bias field estimation
based on coherent local intensity clustering: a unified energy minimization framework.
Proceedings of Information Processing in Medical Imaging. Berlin: Springer, 2009:
288-299.
2. J. Bezdek. Pattern Recognition with Fuzzy Objective Function Algorithms. New York:
Plenum, 1981.
3. Zhou Wang, Alan C.Bovik, Hamid R.Sheikh, et al. Image quality assessment: from error
visibility to structural similarity [J]. IEEE Transactions on Image Processing, 2004,
13(4):600−612.
4. Abdul Rehman, Zhou Wang. Reduced-Reference Image Quality Assessment by Structural
Similarity Estimation. IEEE Transactions on Image Processing, 2012, 21(8):3378-3389.
Advanced Science and Technology Letters Vol.31 (MulGraB 2013)
Copyright © 2013 SERSC 221