Embed Size (px)
Citation preview
AN IMPLEMENTATION OF AN ULTRASONIC
DEVICE FOR THE VISUALLY
IMPAIRED
By
JULIUS J. MARPAUNG
Bachelor of Science
Oklahoma State University
Stillwater, OK
USA
2003
Submitted to the Faculty of the Graduate College of the Oklahoma State University in partial
fulfillment of the requirement for the degree of
MASTER OF SCIENCE May, 2006
ii
AN IMPLEMENTATION OF AN ULTRASONIC
DEVICE FOR THE VISUALLY
IMPAIRED
Thesis approved:
________________________________Dr. Yumin Zhang
Thesis Advisor
_______________________________Dr. Louis Johnson
Committee Member
______________________________Dr. George Scheets
Committee Member
_______________________________Dr. Gordon Emslie
Dean of the Graduate College
iii
ACKNOWLEDGEMENTS
It was indeed a great privilege to be a part of the Electrical and Computer
engineering department of the Oklahoma State University. Four semesters spent towards
working for a master’s degree were filled with numerous opportunities and great
experiences of both of the subject and the people involved with it. This thesis completes
all the formal requirements for my graduation at Oklahoma State University, and I wish
to thank everyone who has walked with me towards this goal.
To start off, I would like to thank my parents, Mr. and Mrs. Marpaung, my uncle
and aunty, Mr. Tampubolon and Mrs. Tampubolon who took their time driving me from
Houston to Stillwater, my brother, Jonathan Marpaung, my sister, Dora Marpaung, my
cousins, Phillip Tampubolon, Anthony Tampubolon and Sammy Tampubolon for driving
me crazy most of the time, Tonggo Marpaung, Koko Marpaung, Ian Marpaung, Deddy
Marpaung, Tigor Marpaung, and Pesta Marpaung, for teaching me how to be cool when I
was young, Uncle Ucok who always gives me a headache, all the uncles I have who
showed up and gave me biscuits and cool stuffs when I was a kid, Pendeta B.M. Siagian
and all of my relatives and friends for extending warm supports and giving me this
opportunity to come here to the United States and be able to prove myself as a capable
engineer. Their love and affection always remains in my thoughts and this education
would be incomplete without s incerely expressing my thanks to them.
iv
I would like to thank Dr. Yumin Zhang, Dr. Louis Johnson, and Dr. George
Scheets for providing all the facilities, supports and many countless advices for the
completion of this project and my classes. I would like to thank Leigh and Janice, my
bosses back when I used to work at a coffee shop down at Edmon Low library, for their
kindness to treat me as a part of their own families. I would like to thank Kristi Ehrlich,
Reagan Thomas, Cliff Blackstock, Tracy Corbett, and George Douglas for supporting me
financially as one of the lab assistants for CEATLABS. I would like to thank Dr. John
Nazemetz and Dr. James Stine for supporting me financially as their graduate teaching
assistants. It has been an honor working with you all.
My sincere thanks to my friends Hendrijanto Nurtjahjo , Zachary Vincent, Aswin
Ramachandran, Rajpamal Pethuraj, Chad Whisman, Josh Wheeler, Jonathan Reed, Troy
Nugroho, Sutan Pakpahan, Budiman Siahaan, Gohan H., Toga, Aya Ohtomi, Maya Joray,
Linda Fleming, and Saranya Ruamsook for their interactive support ranging from class
discussion and having fun on my spare time. Thank you very much.
And last but not least, many thanks to my special girlfriend Ayaka Sato, for being
there when I need help the most. Thank you very much for all the supports you gave me.
v
TABLE OF CONTENTS
Chapter Page
1. Introduction..................................................................................................................... 1
1.1 Thesis Problem.......................................................................................................... 2 1.2 Thesis Outline ........................................................................................................... 2
2. Background..................................................................................................................... 3
2.1 Brief History of Ultrasonic ....................................................................................... 3 2.2 Theory of Ultrasonic ................................................................................................. 3
2.2.1 Review of basic sound waves ............................................................................ 4 2.2.2 Propagation of ultrasound in various mediums ................................................. 4 2.2.3 Ultrasonic Reflection and Transmission............................................................ 8 2.2.4 Ultrasonic Refraction ......................................................................................... 9
2.3 Ultrasonic Applications .......................................................................................... 12 2.3.1 Social................................................................................................................ 12
2.3.2 Medical ................................................................................................................ 14 2.3.3 Military ................................................................................................................ 15 2.3.4 Oceanography ...................................................................................................... 15
3. Device Design............................................................................................................... 16
3.1 Hardware................................................................................................................. 16 3.1.1 Transmitter....................................................................................................... 16 3.1.2 Receiver ........................................................................................................... 18
3.2 Software .................................................................................................................. 25 3.2.1 Master PIC ....................................................................................................... 25 3.2.2 Slave PIC ......................................................................................................... 29
3.3 Result ...................................................................................................................... 33
4. Conclusion .................................................................................................................... 45
References......................................................................................................................... 46
vi
APPENDIX A................................................................................................................... 50
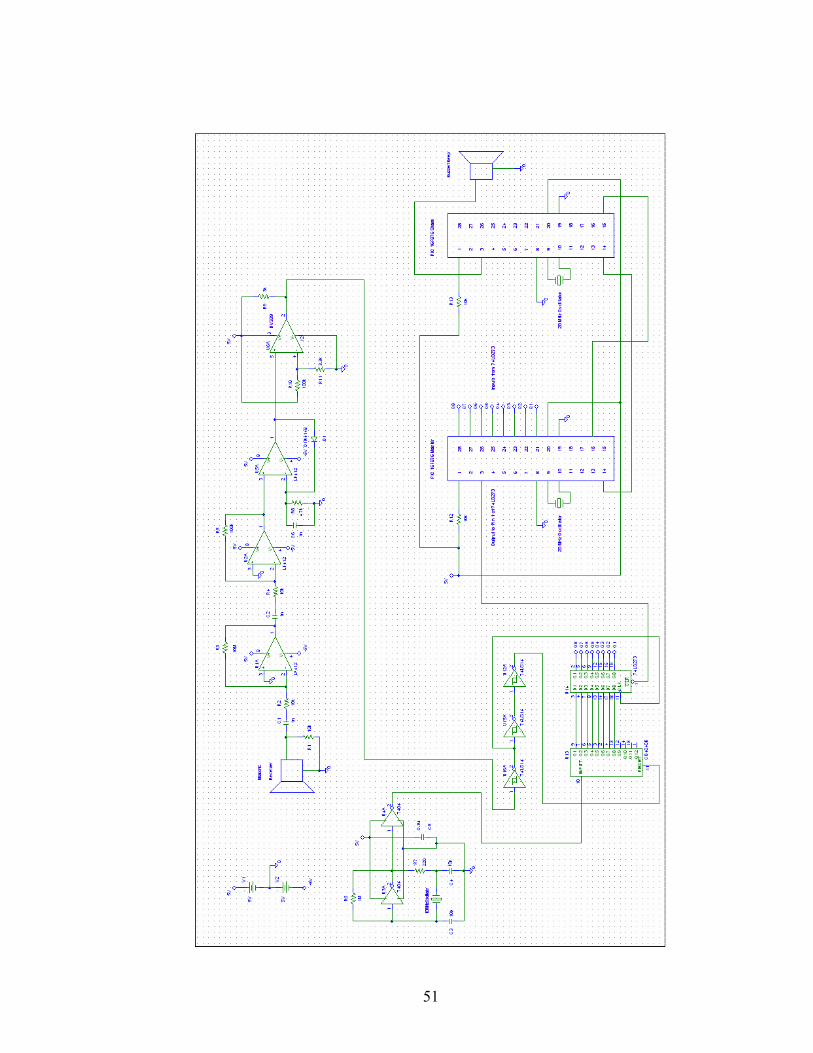
Ultrasonic Receiver full circuit ..................................................................................... 50
APPENDIX B ................................................................................................................... 52
Ultrasonic Transmitter Printed Circuit Board Traces ................................................... 52 Ultrasonic Receiver Printed Circuit Board Traces........................................................ 53
APPENDIX C ................................................................................................................... 54
Breadboard photo.......................................................................................................... 54
vii
List of Figures
Figure 2.1 Ultrasonic wave incidence to 2 different mediums ........................................... 8
Figure 2.2 Ultrasonic waves transmission and refraction in 2 different mediums with
longitudinal velocities....................................................................................................... 10
Figure 2.3 Ultrasonic waves reflection and refraction in 2 different mediums with
longitudinal and shear velocities....................................................................................... 11
Figure 2.4 Transmitted ultrasonic waves and echo location............................................. 13
Figure 3.1 The schematic for ultrasonic transmitter ......................................................... 17
Figure 3.2 LM 555 output using an oscilloscope.............................................................. 18
Figure 3.3 Two-Stage Amplifier....................................................................................... 19
Figure 3.4 Rectifier circuit................................................................................................ 20
Figure 3.5 Digital Circuit.................................................................................................. 21
Figure 3.6 Oscillator ......................................................................................................... 22
Figure 3.7 Oscillator’s output ........................................................................................... 23
Figure 3.8 Counter and D Flip Flop.................................................................................. 24
Figure 3.9 Master and slave PIC....................................................................................... 24
Figure 3.10 Master PIC flow diagram .............................................................................. 25
Figure 3.11 Slave PIC flow diagram................................................................................. 29
Figure 3.12 Ultrasonic transmitter and receiver facing each other ................................... 34
Figure 3.13 Ultrasonic receiver output when it was 5 cm in front of transmitter............. 35
viii
Figure 3.14 Ultrasonic receiver output when it was 5 m in front of transmitter............... 35
Figure 3.15 Ultrasonic transmitter and receiver are in parallel ........................................ 36
Figure 3.16 Ultrasonic device attached to human arms.................................................... 37
Figure 3.17 The Output of the slave PIC when the distance between the ultrasonic
transmitter and receiver, and a wall were about 15 cm..................................................... 38
Figure 3.18 The Output of the slave PIC when the distance between the ultrasonic
transmitter and receiver, and a wall were about 30 cm..................................................... 38
Figure 3.19 The Output of the slave PIC when the distance between the ultrasonic
transmitter and receiver, and a wall were about 45 cm..................................................... 39
Figure 3.20 The Output of the slave PIC when the distance between the ultrasonic
transmitter and receiver, and a wall were about 60 cm..................................................... 39
Figure 3.21 The Output of the slave PIC when the distance between the ultrasonic
transmitter and receiver, and a wall were about 75 cm..................................................... 40
Figure 3.22 The Output of the slave PIC when the distance between the ultrasonic
transmitter and receiver, and a wall were about 90 cm..................................................... 40
Figure 3.23 The Output of the slave PIC when the distance between the ultrasonic
transmitter and receiver, and a wall were about 120 cm................................................... 41
Figure 3.24 The Output of the slave PIC when the distance between the ultrasonic
transmitter and receiver, and a wall were about 150 cm................................................... 41
Figure 3.25 The Output of the slave PIC when the distance between the ultrasonic
transmitter and receiver, and a wall were about 180 cm................................................... 42
Figure 3.26 The Output of the slave PIC when the distance between the ultrasonic
transmitter and receiver, and a wall were about 210 cm................................................... 42
ix
Figure 3.27 A graphical representative of the ultrasonic readings taken from a lab ........ 43
1
Chapter 1
Introduction
Ultrasonic is defined as any bands above audible band (20 kHz) and up to MHz
range. One unique characteristic about the ultrasonic waves is that its speed is
approximately about 105 to 106 slower than the speed of electromagnetic waves in air,
depending on the temperature and the medium density it is traveling and because of this,
it is widely used in many fields, such as medical, engineering, and military. Another
unique characteristic of ultrasonic waves is that it can penetrate opaque materials that
other waves cannot. This makes it a very valuable asset to measure distance and thickness
of an object in an inexpensive and a reliable way. Ultrasonic waves can be generated
naturally and electronically. Some animals like bats emit ultrasonic waves to pinpoint
their current position relative to an object in front of them, this phenomenon has been
studied for many years by scientists. Humans can generate and transmit ultrasonic waves
by using transducers. By having a better concept of ultrasonic waves, we are one step
closer in understanding the mystery of nature and maybe improving our quality of life.
2
1.1 Thesis Problem
The purpose of this thesis is to design an ultrasonic device that will allow a blind
person to detect an object far out from his/her reach. The device should be made as
reliable, small, light, and cheap as possible. The final design of the device should also be
easy to use and convenient for the blind person to wear.
1.2 Thesis Outline
This thesis is divided into 4 chapters. The second chapter will cover the background
of ultrasonic. The third chapter will describe the research in this thesis in hardware and
software, along with the experimental result. The last chapter will conclude everything
discussed on this thesis.
3
Chapter 2
Background
2.1 Brief History of Ultrasonic
The history of ultrasonic can be traced back before the nineteenth century. The
Savant wheel (1830), and Galton whistle (1876) were two of the oldest high frequency
ultrasonic sources. The Savant wheel could generate up to 24 kHz of ultrasonic wave,
while the Galton whistle basic frequency range was from 3 to 30 kHz. In World War II,
ultrasonic was being used as sonar through water to detect enemies’ ships and submarines.
After World War II, ultrasonic was became a popular topic in research. Some researches
employed using ultrasonic wave in detecting metal objects and flaws in solid material, as
well as medical diagnostics.
2.2 Theory of Ultrasonic
At first we need to review some basic equations for sound waves. Ultrasonic
wave’s velocity differs at different mediums and temperatures therefore, a more detailed
4
discussion is needed on each mediums, so as to have a better understanding of ultrasonic
waves.
2.2.1 Review of basic sound waves
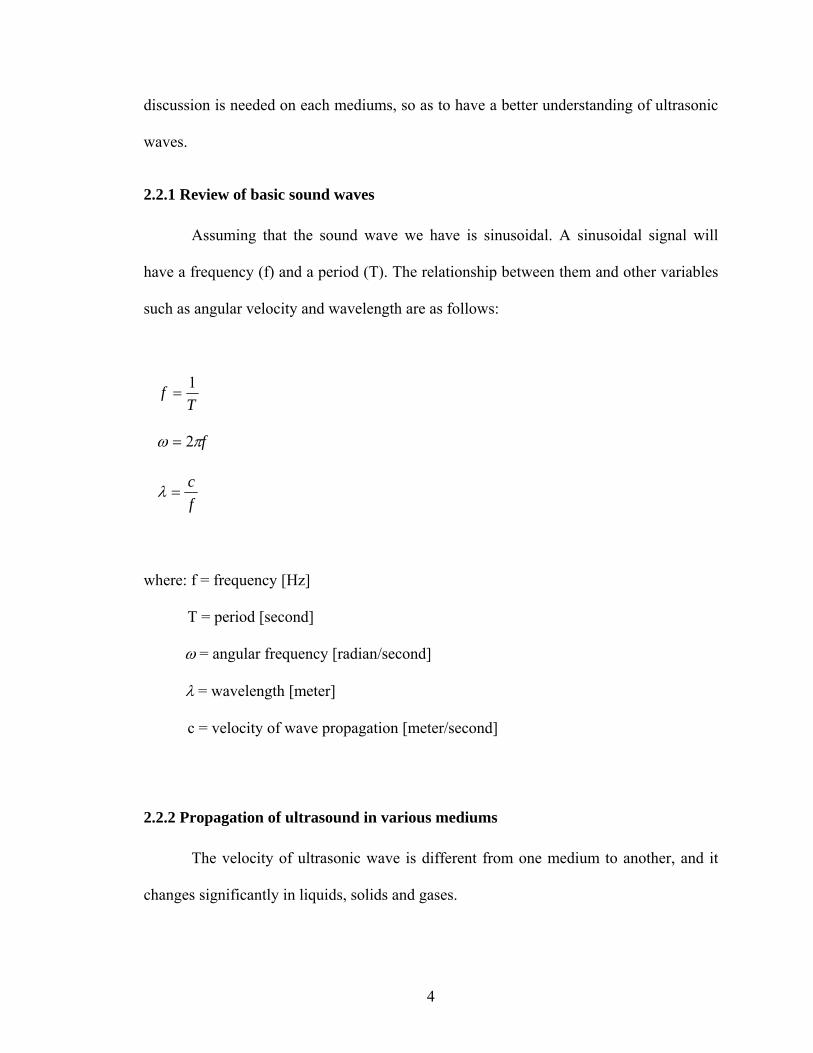
Assuming that the sound wave we have is sinusoidal. A sinusoidal signal will
have a frequency (f) and a period (T). The relationship between them and other variables
such as angular velocity and wavelength are as follows:
T
f 1=
fπω 2=
fc
=λ
where: f = frequency [Hz]
T = period [second]
ω = angular frequency [radian/second]
λ = wavelength [meter]
c = velocity of wave propagation [meter/second]
2.2.2 Propagation of ultrasound in various mediums
The velocity of ultrasonic wave is different from one medium to another, and it
changes significantly in liquids, solids and gases.
5
2.2.2.1 Liquids
The velocity of ultrasonic waves in liquids depends on the temperature of the liquids.
Here is an equation that relates ultrasonic wave velocity with liquids temperature:
γθ+= initialcc
And it can also be calculated from the following equation:
ρβ ad
c 1=
Where adβ is:
χβ
β isad =
where: c = ultrasonic waves velocity at final temperature [meter/second]
initialc = ultrasonic waves velocity at initial temperature [meter/second]
θ = temperature difference of the liquids between the final and initial temperature
[ Celcius° ]
γ = absolute temperature coefficient [meter / (second * Kelvin° )]
χ = Poisson’s constant
ρ = liquid density [kg/ 3m ]
6
adβ = adiabatic coefficients of compressibility
isβ = isothermal coefficients of compressibility
For liquids other than water, the velocity of ultrasonic waves decreases with increasing
temperature. For water, however, the velocity increases with temperature up to 74 C°
and then decreases.
2.2.2.2 Solids
The velocity of ultrasonic waves in solids depends on the density of the solids. Here is an
equation that relates ultrasonic wave’s velocity with solids density:
ρ
sT
Gc =
)1(2 μ+
= ps
EG
where: Tc = ultrasonic waves velocity [meter/second]
sG = modulus of transverse elasticity [Pa]
ρ = solid density [kg/ 3m ]
pE = Young’s modulus [Pa]
μ = Poisson’s ratio
7
2.2.2.3 Gasses
The velocity of ultrasonic waves in gasses depends on the gas density and temperatures
(for small variations). Here is an equation that relates ultrasonic wave’s velocity with
gasses density and temperatures:
ρ
χ aPc =
).( 00 θθγ −+= cc
where: c = ultrasonic waves velocity [meter/second]
0c = ultrasonic waves velocity in gas at 0 C° [meter/second]
aP = atmospheric pressure [Pa]
χ = Poisson’s constant
ρ = gas density [kg/ 3m ]
γ = Absolute temperature coefficient [m s-1 K-1]
θ = absolute temperature [K]
0θ = Temperature at 00 C
A special case for gasses is air. Air has a propagation velocity of 331m/s and the
temperature coefficient of 0.61 [m s-1 K-1].
8
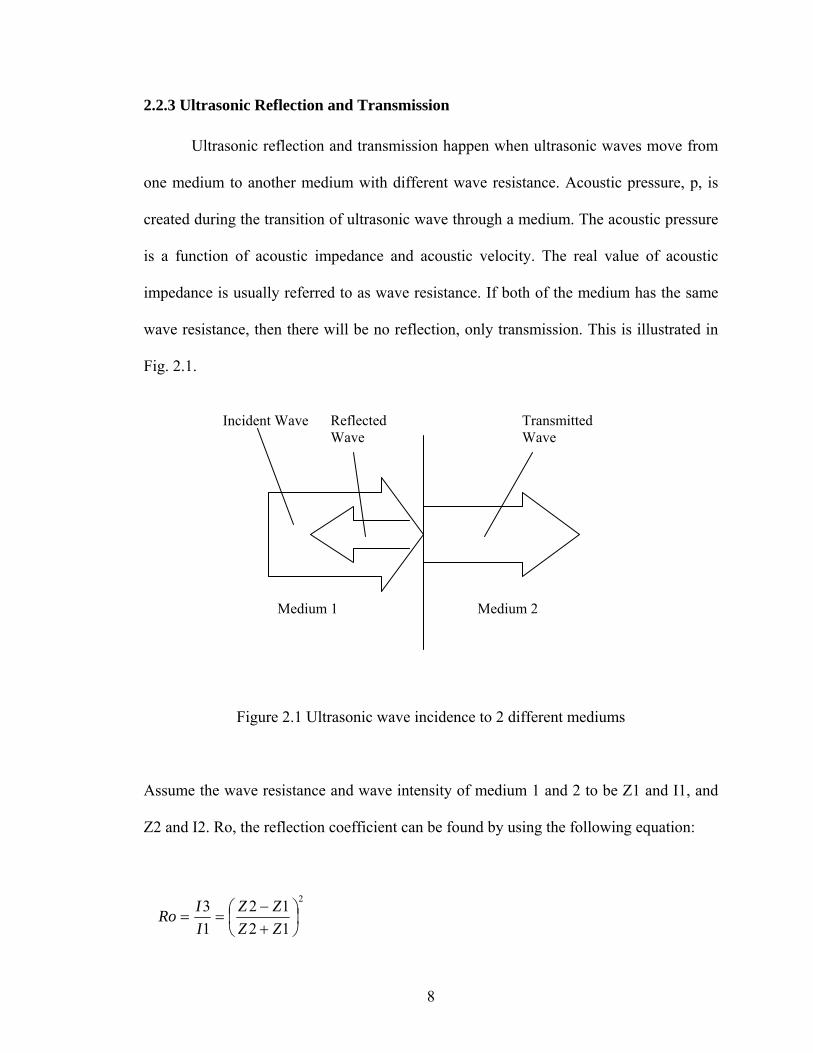
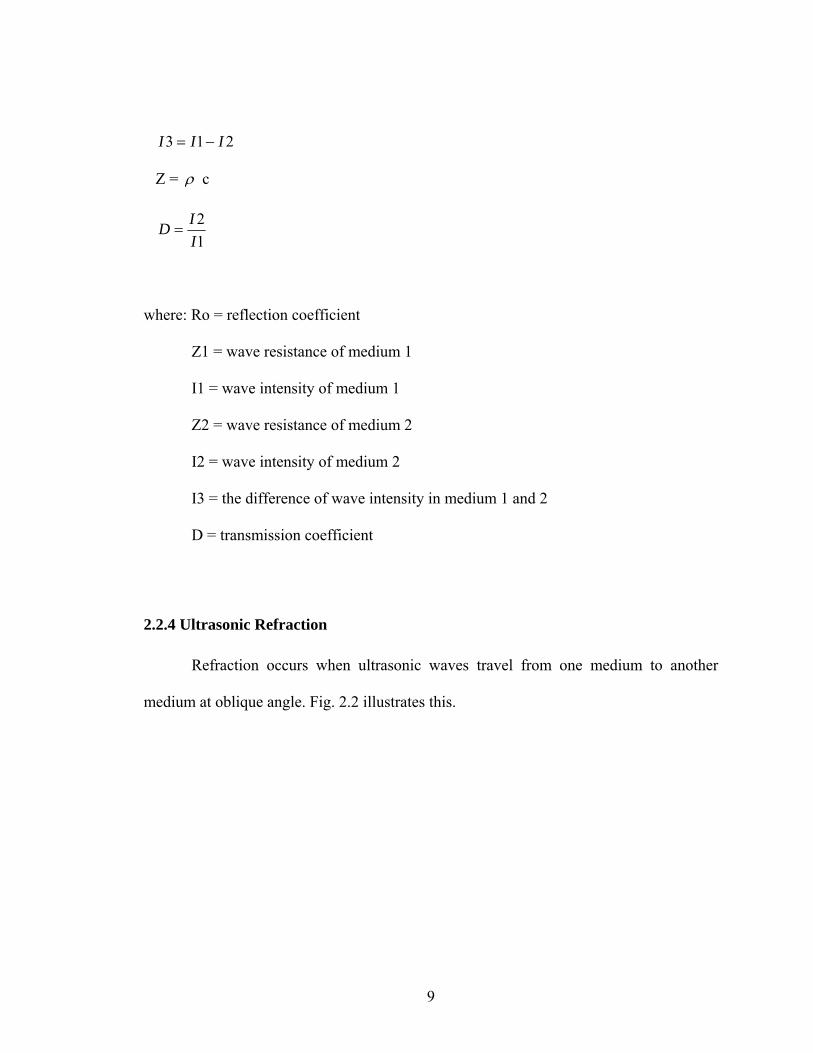
2.2.3 Ultrasonic Reflection and Transmission
Ultrasonic reflection and transmission happen when ultrasonic waves move from
one medium to another medium with different wave resistance. Acoustic pressure, p, is
created during the transition of ultrasonic wave through a medium. The acoustic pressure
is a function of acoustic impedance and acoustic velocity. The real value of acoustic
impedance is usually referred to as wave resistance. If both of the medium has the same
wave resistance, then there will be no reflection, only transmission. This is illustrated in
Fig. 2.1.
Figure 2.1 Ultrasonic wave incidence to 2 different mediums
Assume the wave resistance and wave intensity of medium 1 and 2 to be Z1 and I1, and
Z2 and I2. Ro, the reflection coefficient can be found by using the following equation:
2
1212
13
⎟⎠⎞
⎜⎝⎛
+−
==ZZZZ
IIRo
Medium 1 Medium 2
Incident Wave Reflected Wave
Transmitted Wave
9
213 III −=
Z = ρ c
12
IID =
where: Ro = reflection coefficient
Z1 = wave resistance of medium 1
I1 = wave intensity of medium 1
Z2 = wave resistance of medium 2
I2 = wave intensity of medium 2
I3 = the difference of wave intensity in medium 1 and 2
D = transmission coefficient
2.2.4 Ultrasonic Refraction
Refraction occurs when ultrasonic waves travel from one medium to another
medium at oblique angle. Fig. 2.2 illustrates this.
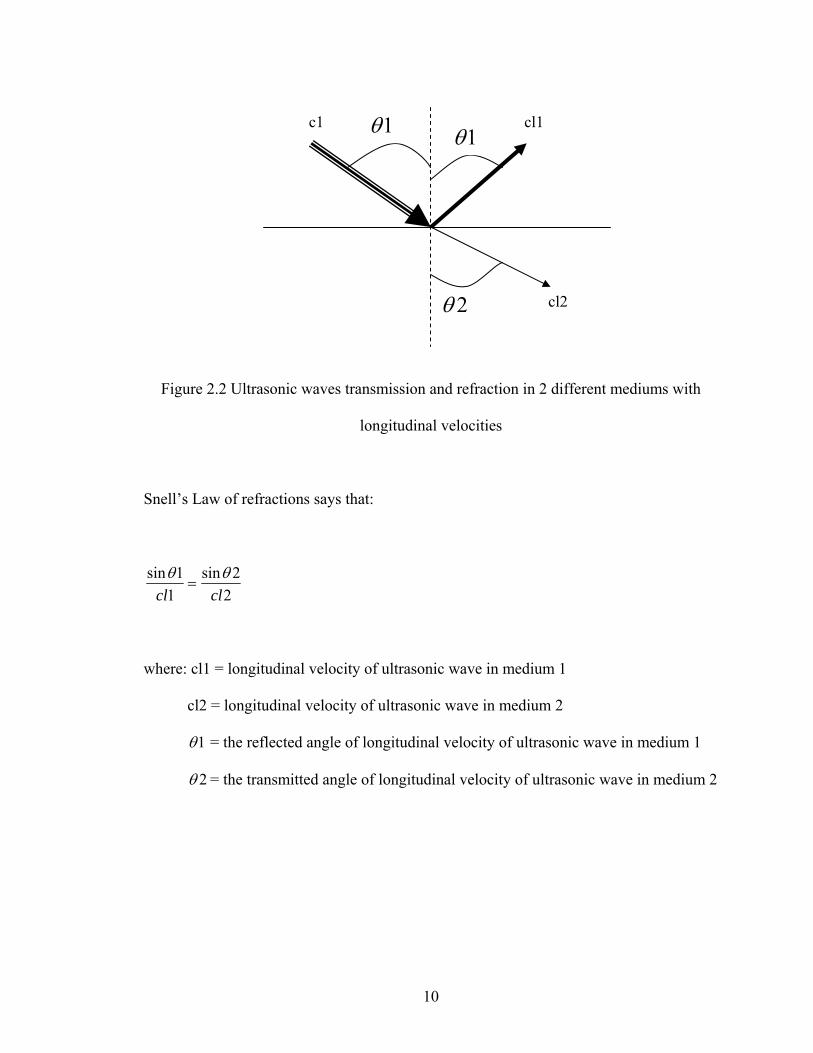
10
Figure 2.2 Ultrasonic waves transmission and refraction in 2 different mediums with
longitudinal velocities
Snell’s Law of refractions says that:
22sin
11sin
clclθθ
=
where: cl1 = longitudinal velocity of ultrasonic wave in medium 1
cl2 = longitudinal velocity of ultrasonic wave in medium 2
1θ = the reflected angle of longitudinal velocity of ultrasonic wave in medium 1
2θ = the transmitted angle of longitudinal velocity of ultrasonic wave in medium 2
1θ 1θ
2θ
c1 cl1
cl2
11
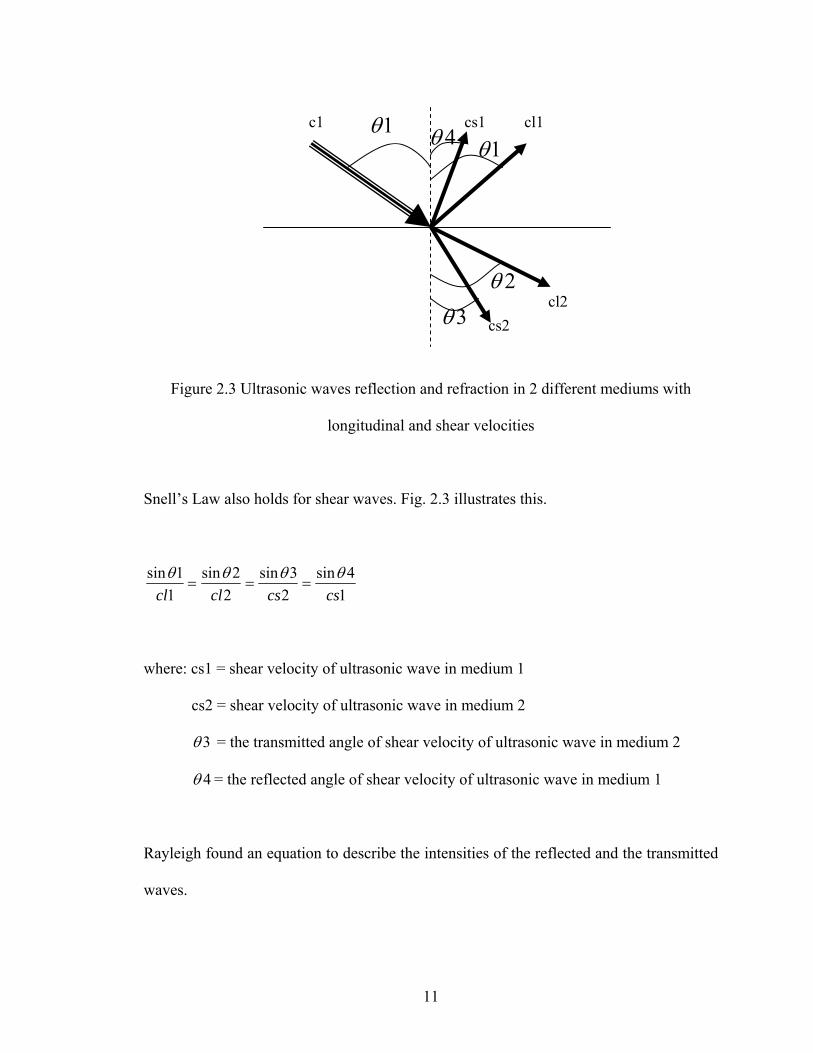
Figure 2.3 Ultrasonic waves reflection and refraction in 2 different mediums with
longitudinal and shear velocities
Snell’s Law also holds for shear waves. Fig. 2.3 illustrates this.
14sin
23sin
22sin
11sin
cscsclclθθθθ
===
where: cs1 = shear velocity of ultrasonic wave in medium 1
cs2 = shear velocity of ultrasonic wave in medium 2
3θ = the transmitted angle of shear velocity of ultrasonic wave in medium 2
4θ = the reflected angle of shear velocity of ultrasonic wave in medium 1
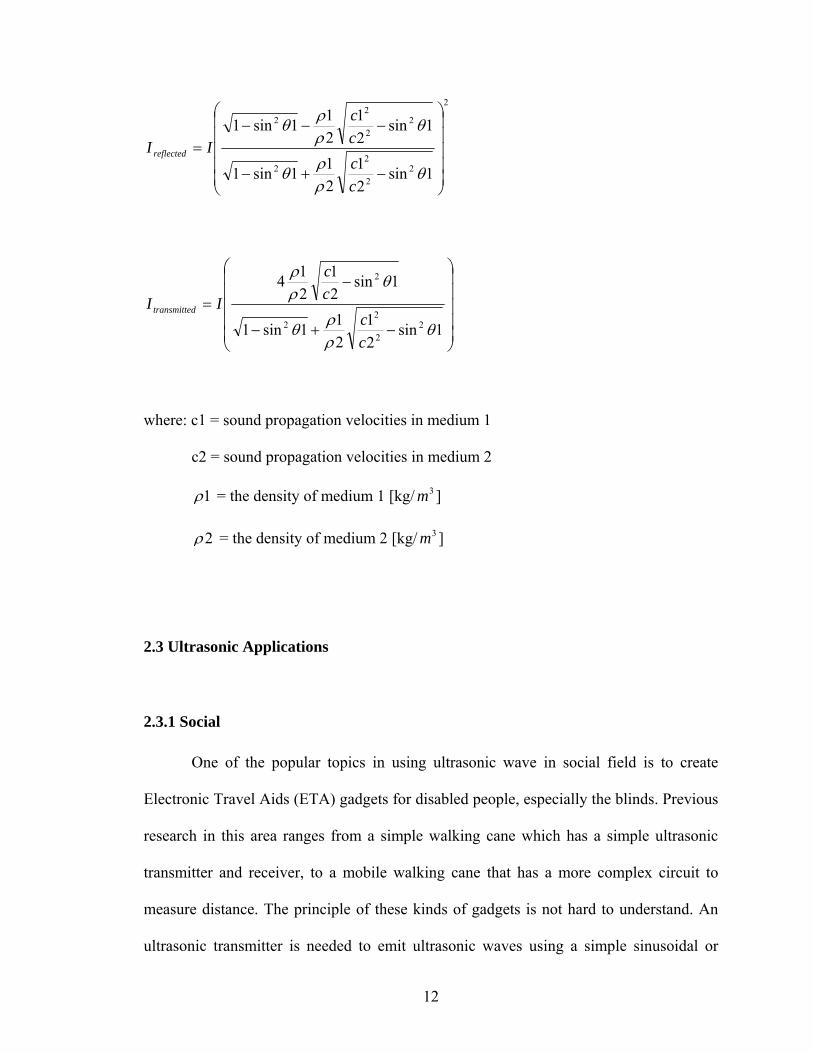
Rayleigh found an equation to describe the intensities of the reflected and the transmitted
waves.
1θ 1θ
2θ
c1 cl1
cl2 3θ
4θ cs1
cs2
12
2
22
22
22
22
1sin21
211sin1
1sin21
211sin1
⎟⎟⎟⎟⎟
⎠
⎞
⎜⎜⎜⎜⎜
⎝
⎛
−+−
−−−=
θρρθ
θρρθ
cccc
II reflected
⎟⎟⎟⎟⎟
⎠
⎞
⎜⎜⎜⎜⎜
⎝
⎛
−+−
−=
1sin21
211sin1
1sin21
214
22
22
2
θρρθ
θρρ
cc
cc
II dtransmitte
where: c1 = sound propagation velocities in medium 1
c2 = sound propagation velocities in medium 2
1ρ = the density of medium 1 [kg/ 3m ]
2ρ = the density of medium 2 [kg/ 3m ]
2.3 Ultrasonic Applications
2.3.1 Social
One of the popular topics in using ultrasonic wave in social field is to create
Electronic Travel Aids (ETA) gadgets for disabled people, especially the blinds. Previous
research in this area ranges from a simple walking cane which has a simple ultrasonic
transmitter and receiver, to a mobile walking cane that has a more complex circuit to
measure distance. The principle of these kinds of gadgets is not hard to understand. An
ultrasonic transmitter is needed to emit ultrasonic waves using a simple sinusoidal or
13
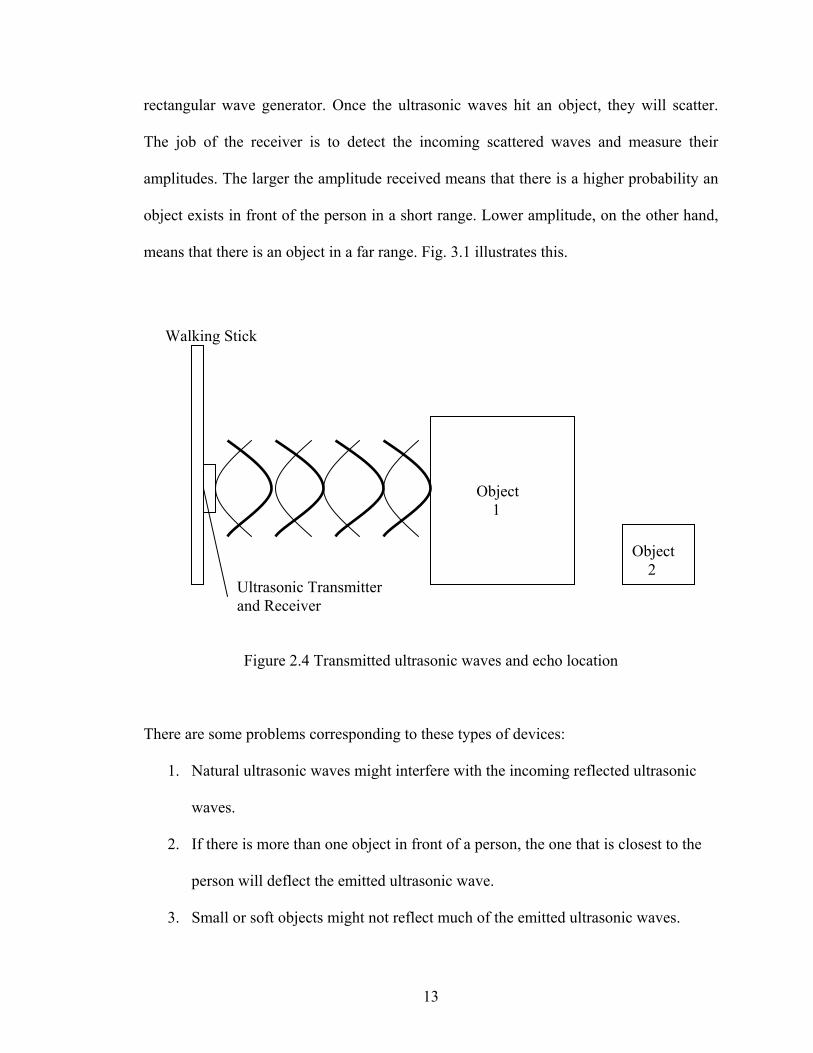
rectangular wave generator. Once the ultrasonic waves hit an object, they will scatter.
The job of the receiver is to detect the incoming scattered waves and measure their
amplitudes. The larger the amplitude received means that there is a higher probability an
object exists in front of the person in a short range. Lower amplitude, on the other hand,
means that there is an object in a far range. Fig. 3.1 illustrates this.
Figure 2.4 Transmitted ultrasonic waves and echo location
There are some problems corresponding to these types of devices:
1. Natural ultrasonic waves might interfere with the incoming reflected ultrasonic
waves.
2. If there is more than one object in front of a person, the one that is closest to the
person will deflect the emitted ultrasonic wave.
3. Small or soft objects might not reflect much of the emitted ultrasonic waves.
Object 1
Object 2
Walking Stick
Ultrasonic Transmitter and Receiver
14
4. The emitted ultrasonic waves might interfere with animals near us like dogs.
5. Mobile walking cane as discussed in [21] and [22] has one important flaw, it only
works on a flat terrain. That device cannot be used in real life situation, and it is
expensive and requires some maintenance.
2.3.2 Medical
Since World War II, ultrasonic waves have been widely used in therapy, such as
inspection of vivo samples, and cavitation damage, monitoring blood flow, vitro studies
and most importantly, fetal imaging. The main idea of using ultrasonic waves in medical
applications is to transmit ultrasonic waves to any part of human body that wished to be
checked and receive the reflected ultrasonic wave. The energy in ultrasonic waves is
attenuated during its transit thorough tissues, and the energy is lost by either absorption
or scatter. Some of the energy that got absorbed locally might lead to heating and cause
injure to patients. Another biological effect of ultrasonic is cavitation, which is the
formation of gas or bubbles in a liquid by ultrasonic waves. There are two types of
cavitation, stable and transient cavitation [27]. Both of them have the ability to injure
patients. High intensity of ultrasonic may cause cell lysis, which is a disintegration or
disruption of a cell. High intensity of ultrasonic wave may also change cellular
ultrastructure, and might even affect DNA. The research to see how much ultrasonic
might affect DNA, is still undergoing.
15
2.3.3 Military
Back in World War II, ultrasonic was used underwater to check the position of
enemies’ ships and submarines. On the other hand, it is also used for navigation. The idea
behind this is similar to the one we use for the blinds. A submarine can generate high
intensity ultrasonic waves, with longer length scale, to a specific place and then check the
incoming scattered ultrasonic waves signal. There are some problems in using ultrasonic
underwater. Temperature gradient, bubbles phenomena, and natural ultrasonic waves
might affect the ultrasonic signals that are supposed to go back to the submarine. The
smaller the bubbles size, the higher resonance frequency they can cause. Dolphin and
whales communicate using ultrasound underwater. Their communication frequency can
easily go from 7 kHz up to 150 kHz.
2.3.4 Oceanography
The use of ultrasonic in this area is similar to the one the military uses.
Oceanography uses ultrasonic to check a steady target instead of using ultrasonic to
check a moving target. Ultrasonic in this area is primarily used to check the depth of an
ocean and maybe even try to find out what is at the bottom of the ocean. The use of the
ultrasonic doesn’t end there. It can also be used in finding sunken ships, lost treasures,
oils and minerals.
16
Chapter 3
Device Design
The purpose of the design is to create an inexpensive and reliable device for a
blind person as a guiding system. One way to accomplish this is to measure the duty
cycle on an ultrasonic receiver. Low duty cycle means that an object is far away from the
blind person, high duty cycle means that an object is near. The final device has two parts,
ultrasonic transmitter and receiver. The transmitter will always send 40 KHz pulses back
to back and the receiver will decode the incoming signal and warn the user whether an
object is near or not by using a beeper or a buzzer.
3.1 Hardware
3.1.1 Transmitter
The hardware design started with selecting parts for the ultrasonic transmitter part.
In this case an ultrasonic transmitter from Panasonic – ECG, Ultrasonic Type Q, was
chosen due to its wide availability at www.digikey.com. The second part that needed to
consider was the square wave generator to generate 40 kHz square waves. In this case
timer LM 555 was also chosen due to its wide availability and use. From LM 555
17
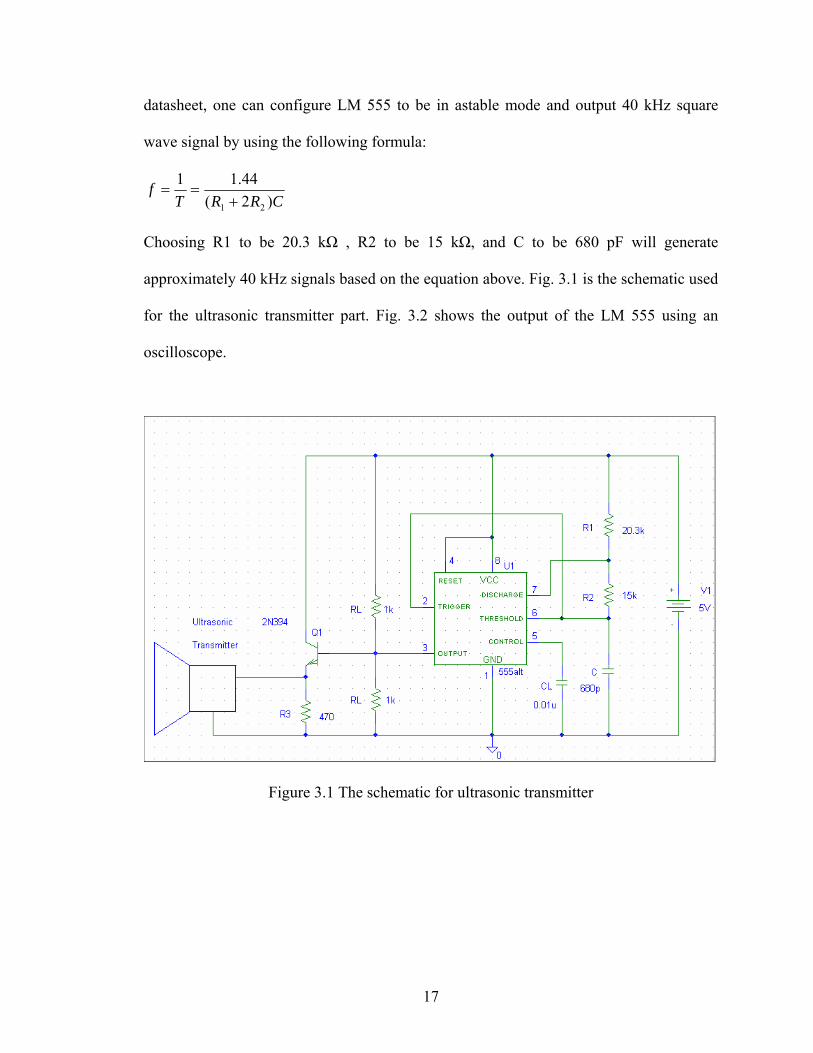
datasheet, one can configure LM 555 to be in astable mode and output 40 kHz square
wave signal by using the following formula:
CRRTf
)2(44.11
21 +==
Choosing R1 to be 20.3 kΩ , R2 to be 15 kΩ, and C to be 680 pF will generate
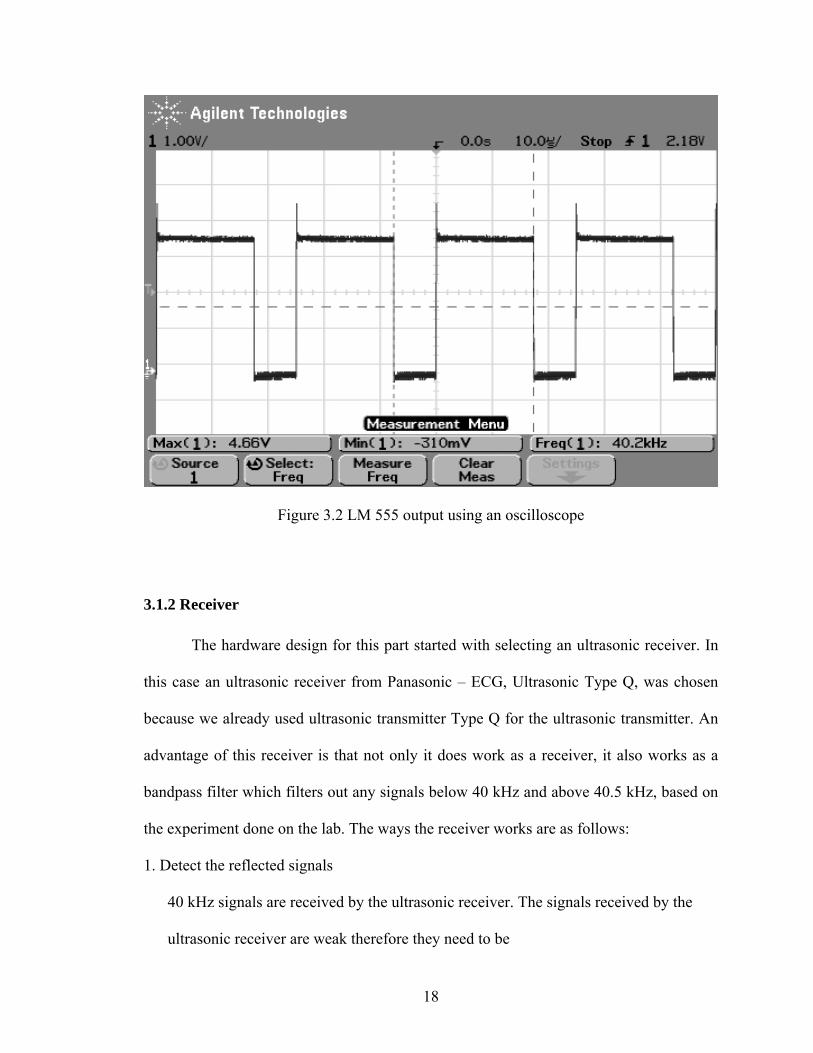
approximately 40 kHz signals based on the equation above. Fig. 3.1 is the schematic used
for the ultrasonic transmitter part. Fig. 3.2 shows the output of the LM 555 using an
oscilloscope.
Figure 3.1 The schematic for ultrasonic transmitter
18
Figure 3.2 LM 555 output using an oscilloscope
3.1.2 Receiver
The hardware design for this part started with selecting an ultrasonic receiver. In
this case an ultrasonic receiver from Panasonic – ECG, Ultrasonic Type Q, was chosen
because we already used ultrasonic transmitter Type Q for the ultrasonic transmitter. An
advantage of this receiver is that not only it does work as a receiver, it also works as a
bandpass filter which filters out any signals below 40 kHz and above 40.5 kHz, based on
the experiment done on the lab. The ways the receiver works are as follows:
1. Detect the reflected signals
40 kHz signals are received by the ultrasonic receiver. The signals received by the
ultrasonic receiver are weak therefore they need to be
19
amplified by the next stage.
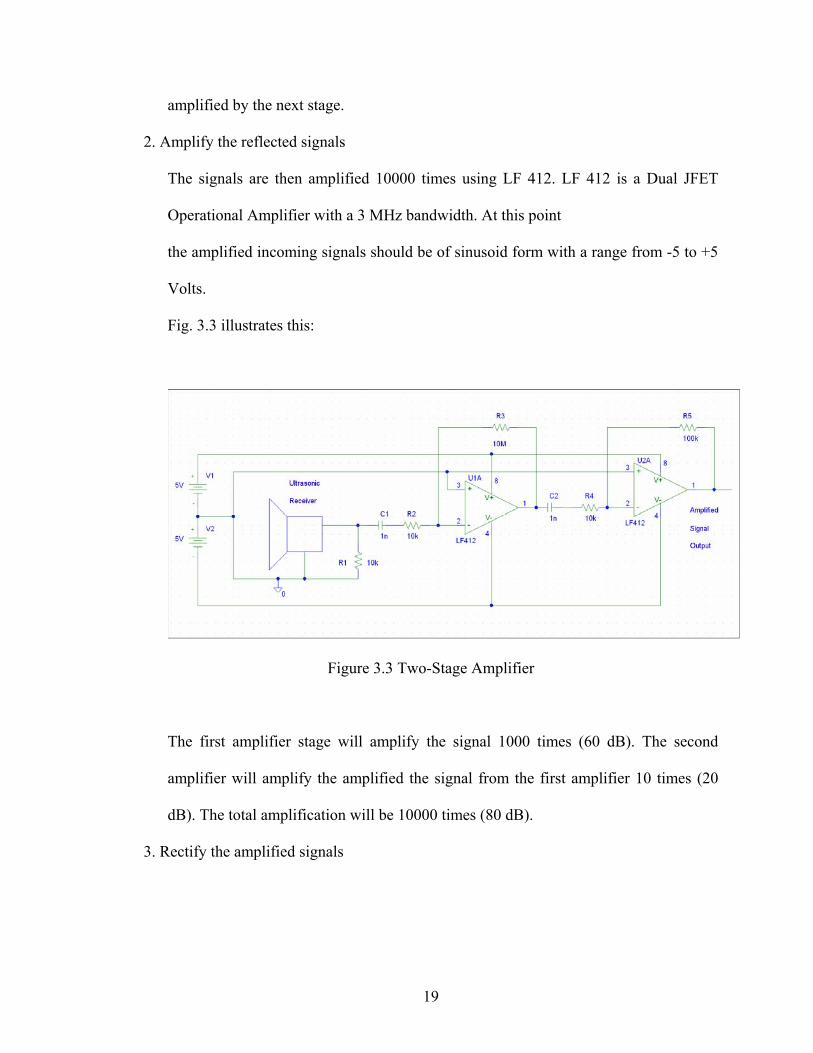
2. Amplify the reflected signals
The signals are then amplified 10000 times using LF 412. LF 412 is a Dual JFET
Operational Amplifier with a 3 MHz bandwidth. At this point
the amplified incoming signals should be of sinusoid form with a range from -5 to +5
Volts.
Fig. 3.3 illustrates this:
Figure 3.3 Two-Stage Amplifier
The first amplifier stage will amplify the signal 1000 times (60 dB). The second
amplifier will amplify the amplified the signal from the first amplifier 10 times (20
dB). The total amplification will be 10000 times (80 dB).
3. Rectify the amplified signals
20
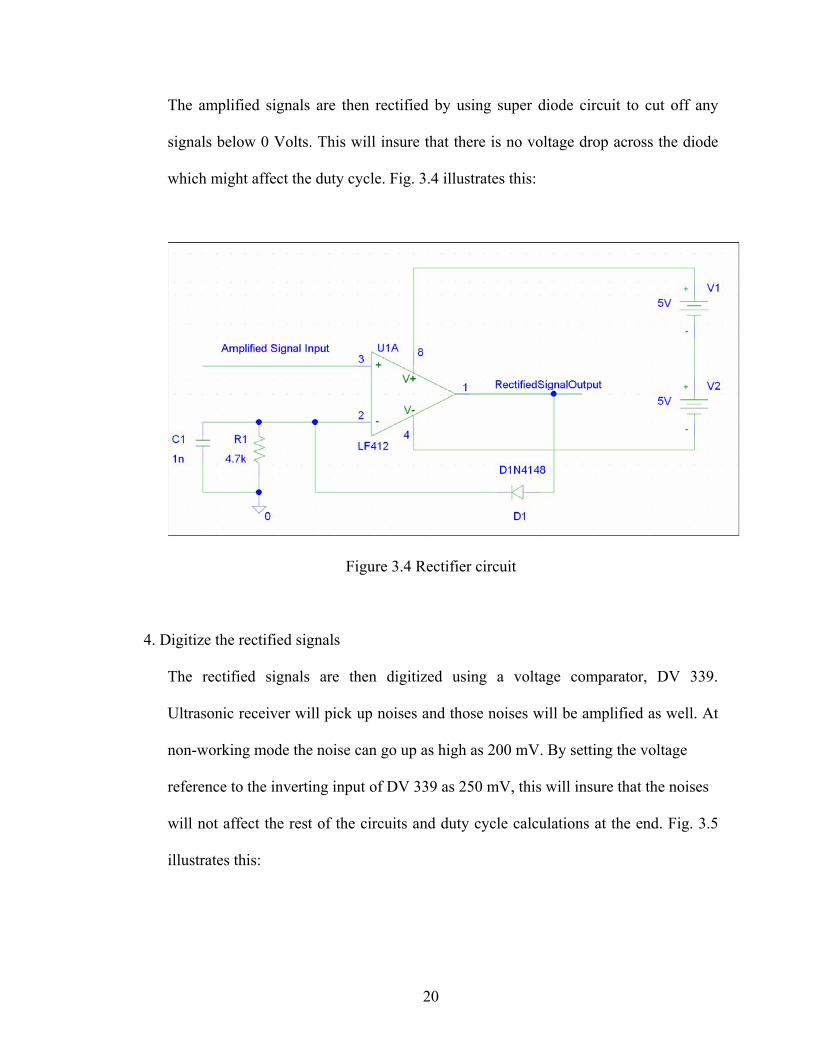
The amplified signals are then rectified by using super diode circuit to cut off any
signals below 0 Volts. This will insure that there is no voltage drop across the diode
which might affect the duty cycle. Fig. 3.4 illustrates this:
Figure 3.4 Rectifier circuit
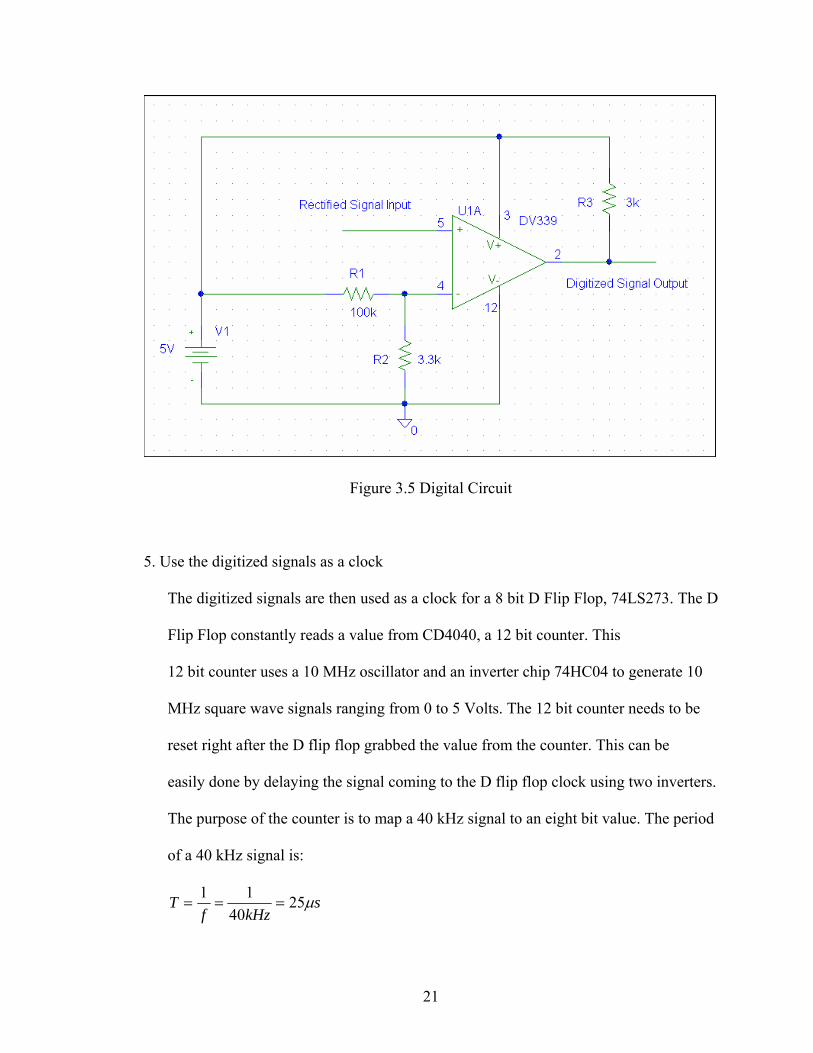
4. Digitize the rectified signals
The rectified signals are then digitized using a voltage comparator, DV 339.
Ultrasonic receiver will pick up noises and those noises will be amplified as well. At
non-working mode the noise can go up as high as 200 mV. By setting the voltage
reference to the inverting input of DV 339 as 250 mV, this will insure that the noises
will not affect the rest of the circuits and duty cycle calculations at the end. Fig. 3.5
illustrates this:
21
Figure 3.5 Digital Circuit
5. Use the digitized signals as a clock
The digitized signals are then used as a clock for a 8 bit D Flip Flop, 74LS273. The D
Flip Flop constantly reads a value from CD4040, a 12 bit counter. This
12 bit counter uses a 10 MHz oscillator and an inverter chip 74HC04 to generate 10
MHz square wave signals ranging from 0 to 5 Volts. The 12 bit counter needs to be
reset right after the D flip flop grabbed the value from the counter. This can be
easily done by delaying the signal coming to the D flip flop clock using two inverters.
The purpose of the counter is to map a 40 kHz signal to an eight bit value. The period
of a 40 kHz signal is:
skHzf
T μ2540
11===
22
To map a 25 μs signal to an 8 bit value, each bit will have a period of:
ssT bit μμ 0977.025625
1 ==
The frequency needed to map a 25 μs signal to an 8 bit value:
MHzsT
fbit
bit 235.100977.0
11
11 ===
μ
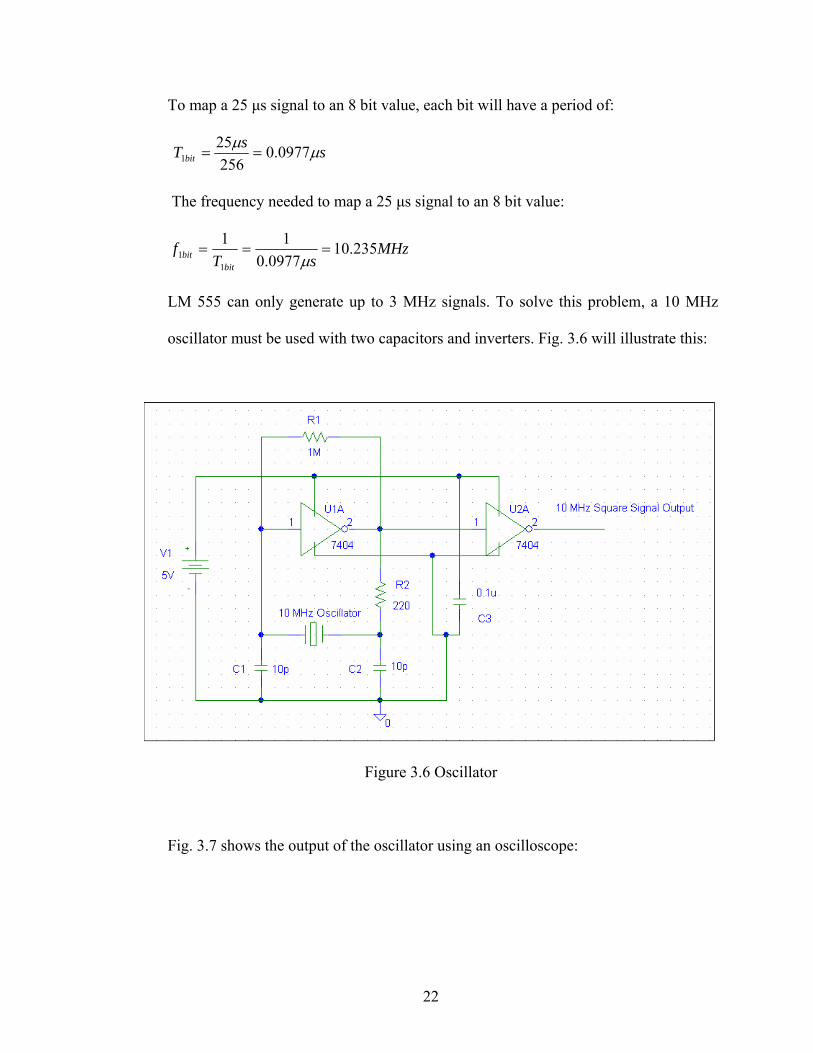
LM 555 can only generate up to 3 MHz signals. To solve this problem, a 10 MHz
oscillator must be used with two capacitors and inverters. Fig. 3.6 will illustrate this:
Figure 3.6 Oscillator
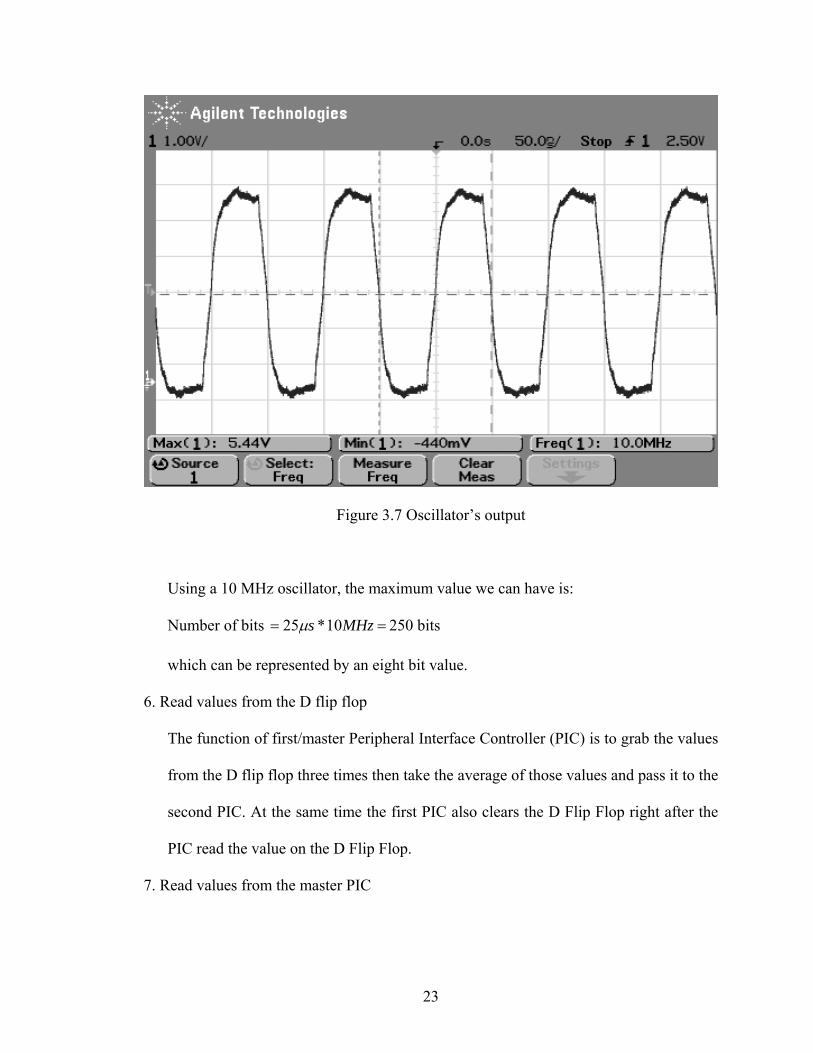
Fig. 3.7 shows the output of the oscillator using an oscilloscope:
23
Figure 3.7 Oscillator’s output
Using a 10 MHz oscillator, the maximum value we can have is:
Number of bits == MHzs 10*25μ 250 bits
which can be represented by an eight bit value.
6. Read values from the D flip flop
The function of first/master Peripheral Interface Controller (PIC) is to grab the values
from the D flip flop three times then take the average of those values and pass it to the
second PIC. At the same time the first PIC also clears the D Flip Flop right after the
PIC read the value on the D Flip Flop.
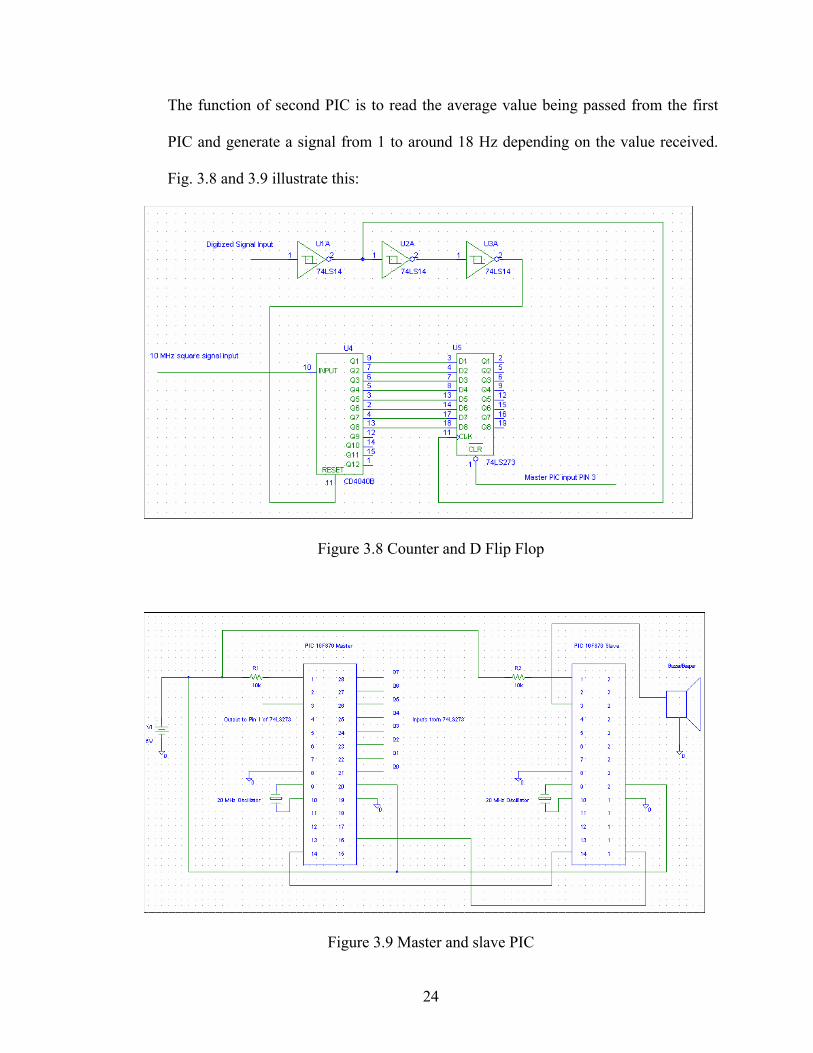
7. Read values from the master PIC
24
The function of second PIC is to read the average value being passed from the first
PIC and generate a signal from 1 to around 18 Hz depending on the value received.
Fig. 3.8 and 3.9 illustrate this:
Figure 3.8 Counter and D Flip Flop
Figure 3.9 Master and slave PIC
25
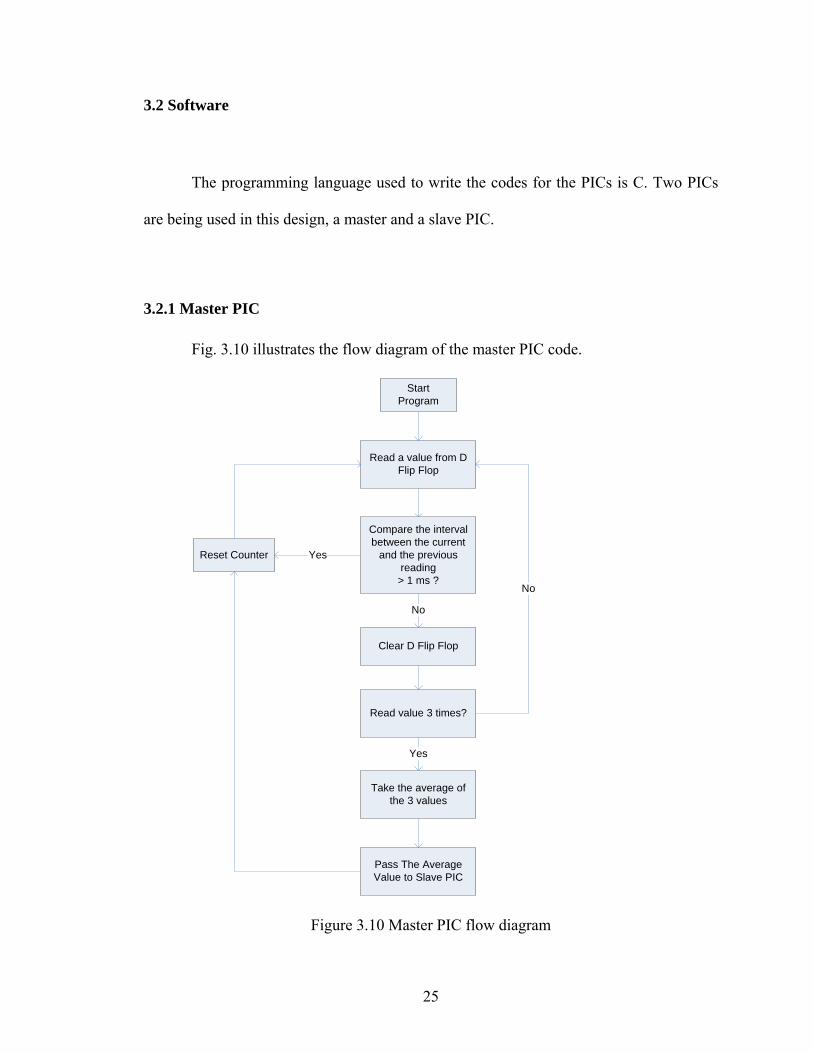
3.2 Software
The programming language used to write the codes for the PICs is C. Two PICs
are being used in this design, a master and a slave PIC.
3.2.1 Master PIC
Fig. 3.10 illustrates the flow diagram of the master PIC code.
Start Program
Compare the interval between the current
and the previous reading> 1 ms ?
Reset Counter
Clear D Flip Flop
Read value 3 times?
Pass The Average Value to Slave PIC
No
Read a value from D Flip Flop
Yes
Take the average of the 3 values
No
Yes
Figure 3.10 Master PIC flow diagram
26
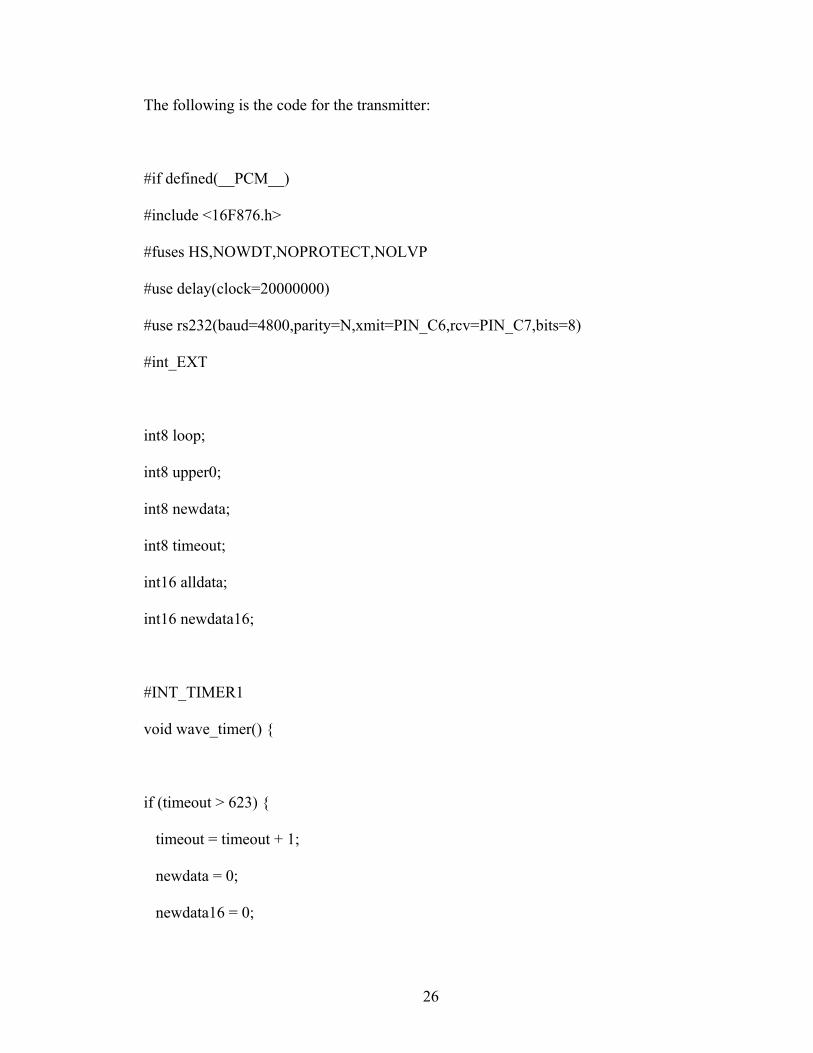
The following is the code for the transmitter:
#if defined(__PCM__)
#include <16F876.h>
#fuses HS,NOWDT,NOPROTECT,NOLVP
#use delay(clock=20000000)
#use rs232(baud=4800,parity=N,xmit=PIN_C6,rcv=PIN_C7,bits=8)
#int_EXT
int8 loop;
int8 upper0;
int8 newdata;
int8 timeout;
int16 alldata;
int16 newdata16;
#INT_TIMER1
void wave_timer()
if (timeout > 623)
timeout = timeout + 1;
newdata = 0;
newdata16 = 0;
27
alldata = 0;
timeout = 0;
loop = 1;
spi_write(newdata);
SPI_READ();
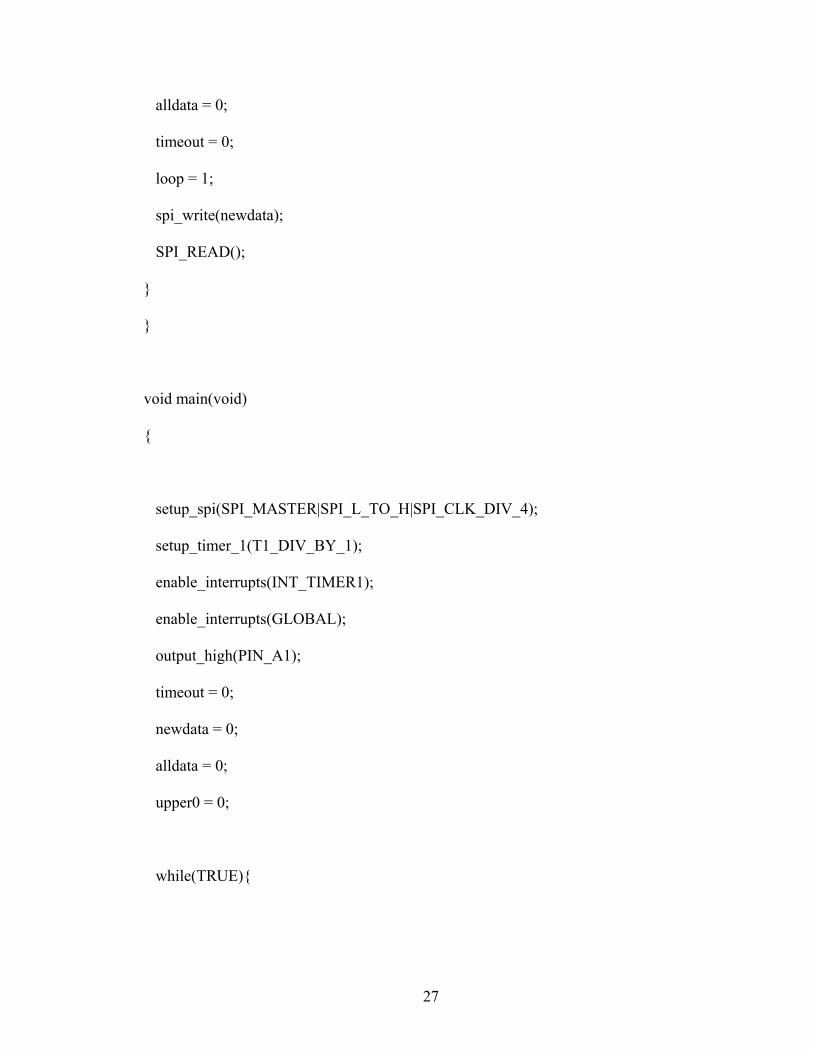
void main(void)
setup_spi(SPI_MASTER|SPI_L_TO_H|SPI_CLK_DIV_4);
setup_timer_1(T1_DIV_BY_1);
enable_interrupts(INT_TIMER1);
enable_interrupts(GLOBAL);
output_high(PIN_A1);
timeout = 0;
newdata = 0;
alldata = 0;
upper0 = 0;
while(TRUE)
28
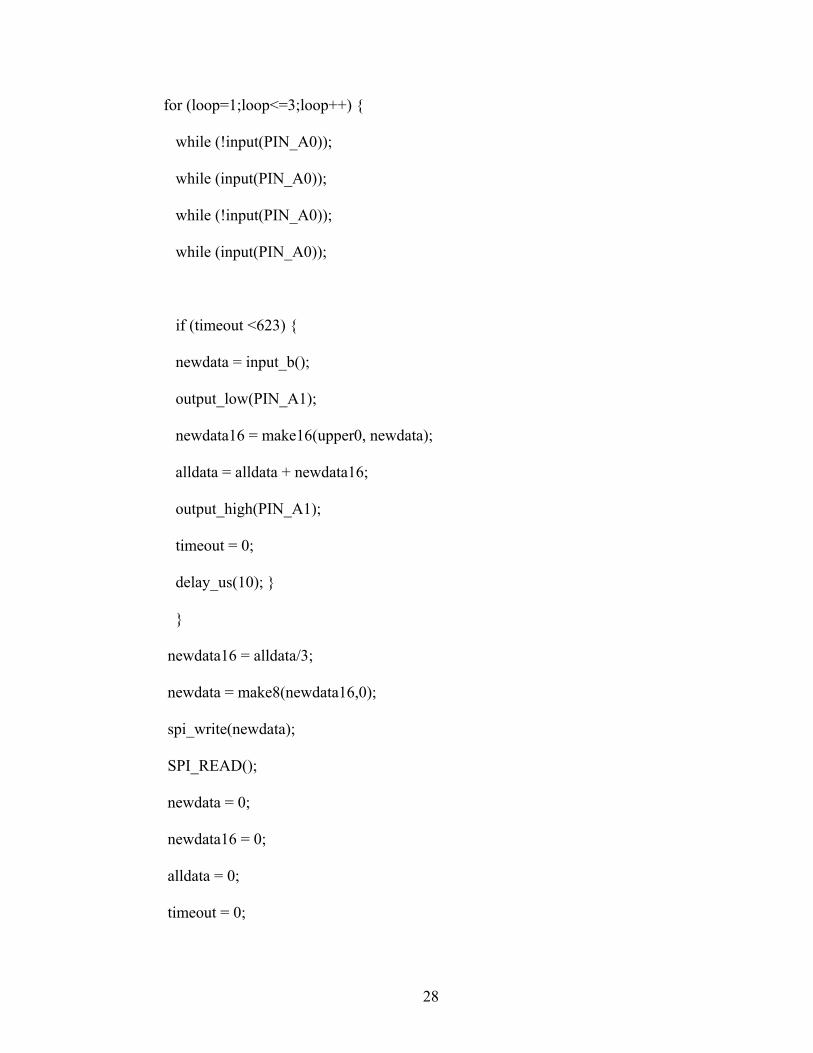
for (loop=1;loop<=3;loop++)
while (!input(PIN_A0));
while (input(PIN_A0));
while (!input(PIN_A0));
while (input(PIN_A0));
if (timeout <623)
newdata = input_b();
output_low(PIN_A1);
newdata16 = make16(upper0, newdata);
alldata = alldata + newdata16;
output_high(PIN_A1);
timeout = 0;
delay_us(10);
newdata16 = alldata/3;
newdata = make8(newdata16,0);
spi_write(newdata);
SPI_READ();
newdata = 0;
newdata16 = 0;
alldata = 0;
timeout = 0;
29
Timer 1 is used for Master PIC. This 16 bit timer will increment every 1.6 μs by using a
20 MHz oscillator. An interrupt is needed to clear all values if there is a 1 ms gap
between each signal. To do this we need to calculate how many times the timer needs to
interrupt by using the following equation:
Number of interrupts 6256.1
1==
smsμ
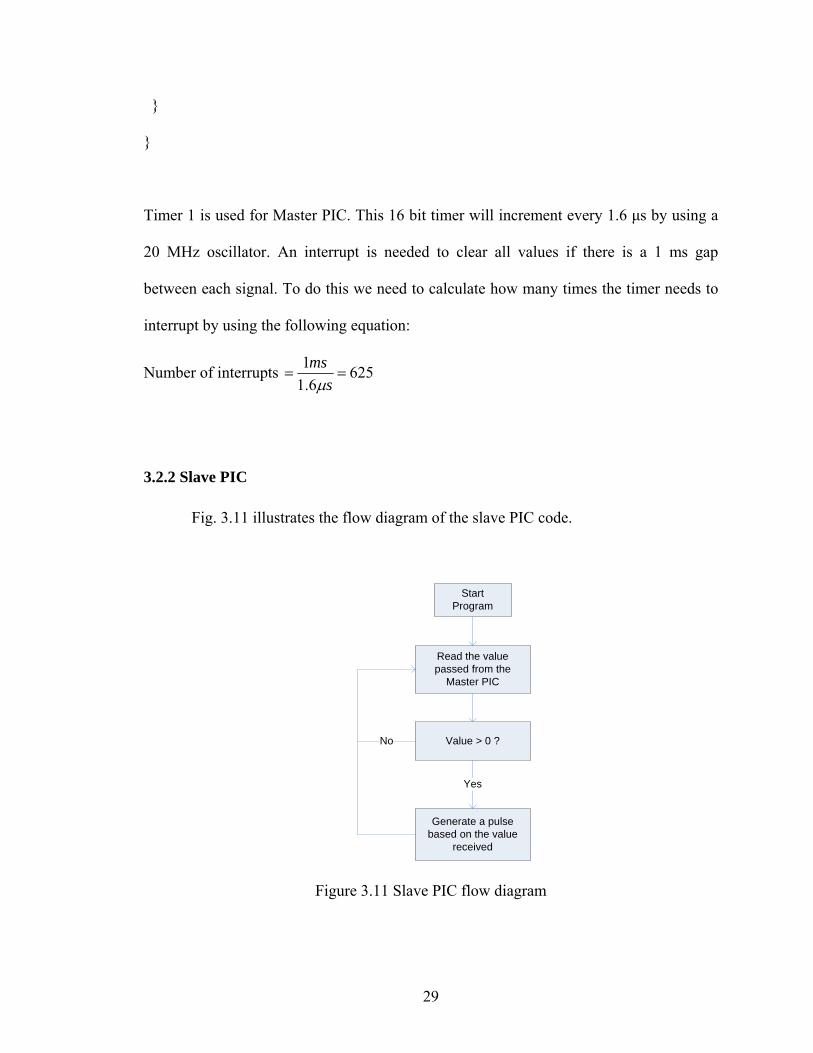
3.2.2 Slave PIC
Fig. 3.11 illustrates the flow diagram of the slave PIC code.
Start Program
Value > 0 ?
Generate a pulse based on the value
received
Yes
Read the value passed from the
Master PIC
No
Figure 3.11 Slave PIC flow diagram
30
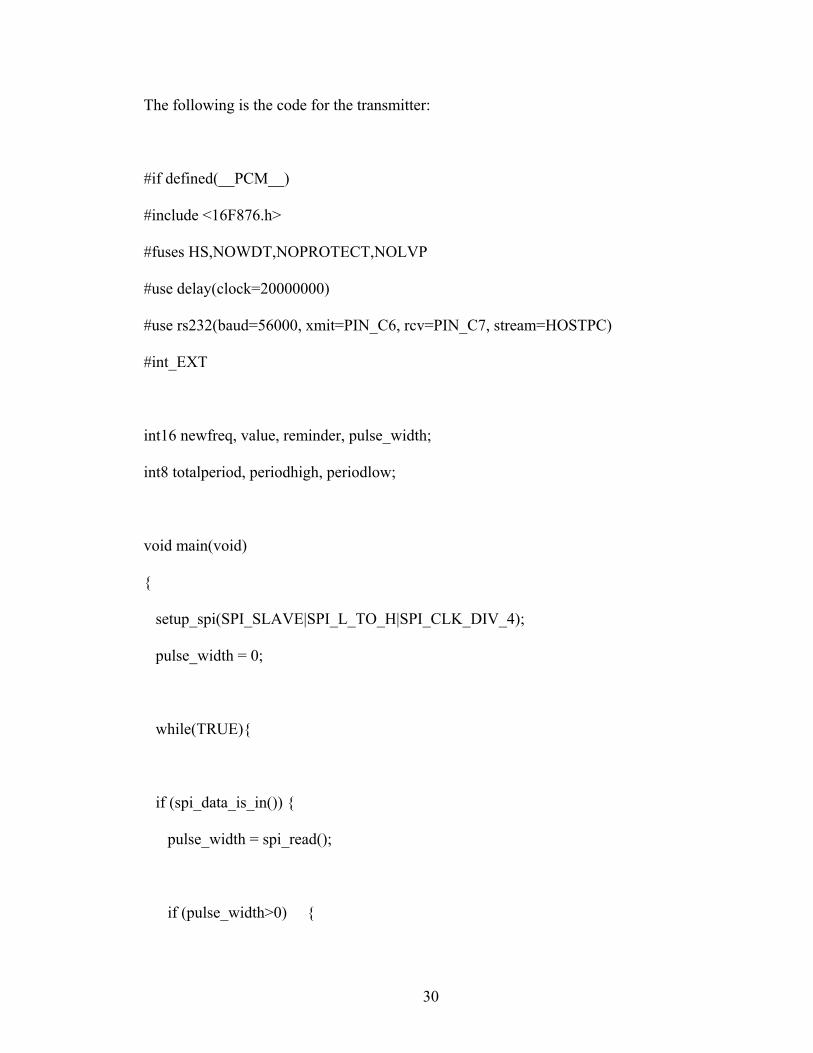
The following is the code for the transmitter:
#if defined(__PCM__)
#include <16F876.h>
#fuses HS,NOWDT,NOPROTECT,NOLVP
#use delay(clock=20000000)
#use rs232(baud=56000, xmit=PIN_C6, rcv=PIN_C7, stream=HOSTPC)
#int_EXT
int16 newfreq, value, reminder, pulse_width;
int8 totalperiod, periodhigh, periodlow;
void main(void)
setup_spi(SPI_SLAVE|SPI_L_TO_H|SPI_CLK_DIV_4);
pulse_width = 0;
while(TRUE)
if (spi_data_is_in())
pulse_width = spi_read();
if (pulse_width>0)
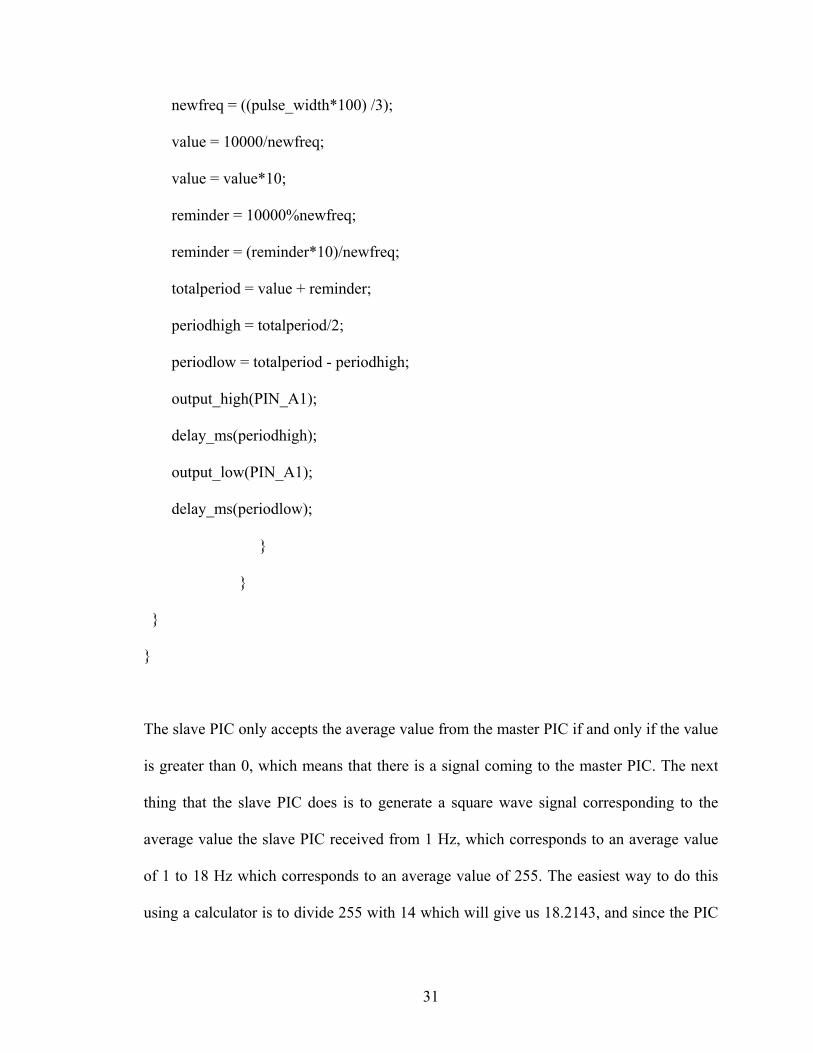
31
newfreq = ((pulse_width*100) /3);
value = 10000/newfreq;
value = value*10;
reminder = 10000%newfreq;
reminder = (reminder*10)/newfreq;
totalperiod = value + reminder;
periodhigh = totalperiod/2;
periodlow = totalperiod - periodhigh;
output_high(PIN_A1);
delay_ms(periodhigh);
output_low(PIN_A1);
delay_ms(periodlow);
The slave PIC only accepts the average value from the master PIC if and only if the value
is greater than 0, which means that there is a signal coming to the master PIC. The next
thing that the slave PIC does is to generate a square wave signal corresponding to the
average value the slave PIC received from 1 Hz, which corresponds to an average value
of 1 to 18 Hz which corresponds to an average value of 255. The easiest way to do this
using a calculator is to divide 255 with 14 which will give us 18.2143, and since the PIC
32
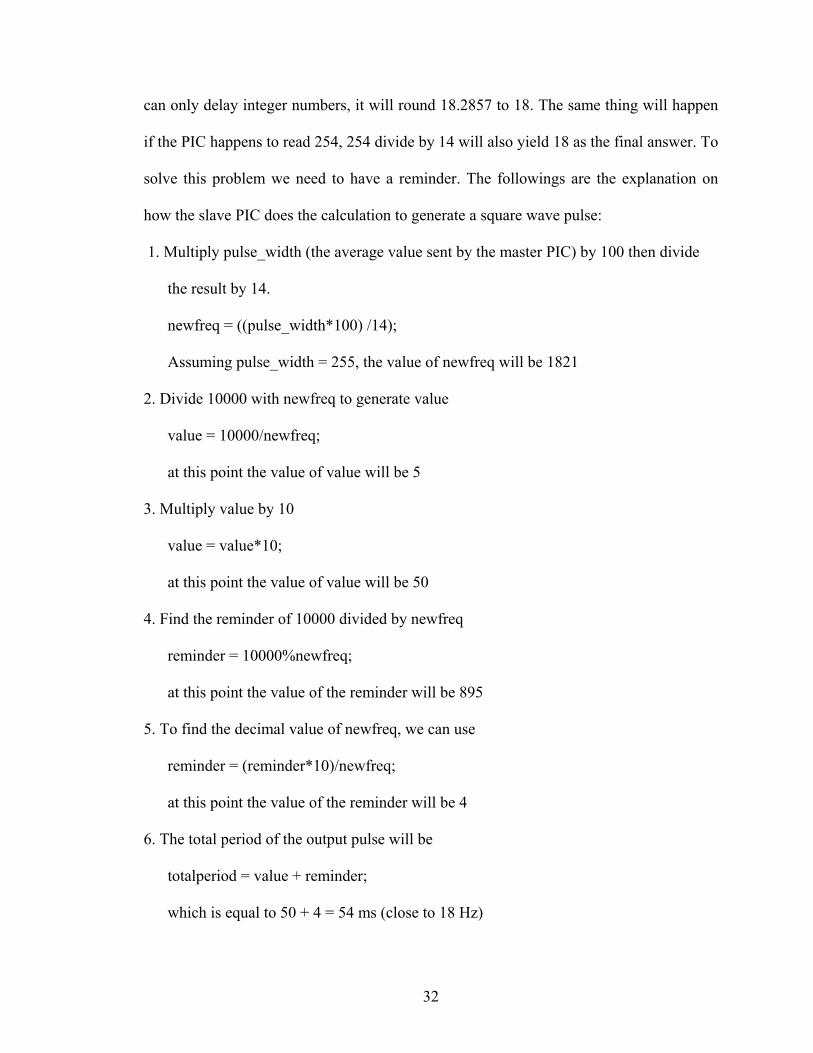
can only delay integer numbers, it will round 18.2857 to 18. The same thing will happen
if the PIC happens to read 254, 254 divide by 14 will also yield 18 as the final answer. To
solve this problem we need to have a reminder. The followings are the explanation on
how the slave PIC does the calculation to generate a square wave pulse:
1. Multiply pulse_width (the average value sent by the master PIC) by 100 then divide
the result by 14.
newfreq = ((pulse_width*100) /14);
Assuming pulse_width = 255, the value of newfreq will be 1821
2. Divide 10000 with newfreq to generate value
value = 10000/newfreq;
at this point the value of value will be 5
3. Multiply value by 10
value = value*10;
at this point the value of value will be 50
4. Find the reminder of 10000 divided by newfreq
reminder = 10000%newfreq;
at this point the value of the reminder will be 895
5. To find the decimal value of newfreq, we can use
reminder = (reminder*10)/newfreq;
at this point the value of the reminder will be 4
6. The total period of the output pulse will be
totalperiod = value + reminder;
which is equal to 50 + 4 = 54 ms (close to 18 Hz)
33
7. To generate the square wave pulse and make the duty cycle to be 50% or close to 50%
we need to make sure that the period when the signal stays high and low are
approximately equal. A simple solution to do this is by using the following equations:
periodhigh = totalperiod/2;
periodlow = totalperiod - periodhigh;
at this point the value of periodhigh will be 27 ms and periodlow will be 27 ms. This
is to prevent two values on pulse_width having the same periodhigh if we are to say
that periodhigh = periodlow = totalperiod/2. For example: having totalperiod to be 52
and 53 will yield 26 for periodhigh, but they yield different values for period low.
Unfortunately the above calculations only work in theory. In real life the master PIC will
take some time to execute each line. This will result in lower output frequency than we
expected. One way to solve this is to change the divisor on step 1 from 14 to 3.
3.3 Result
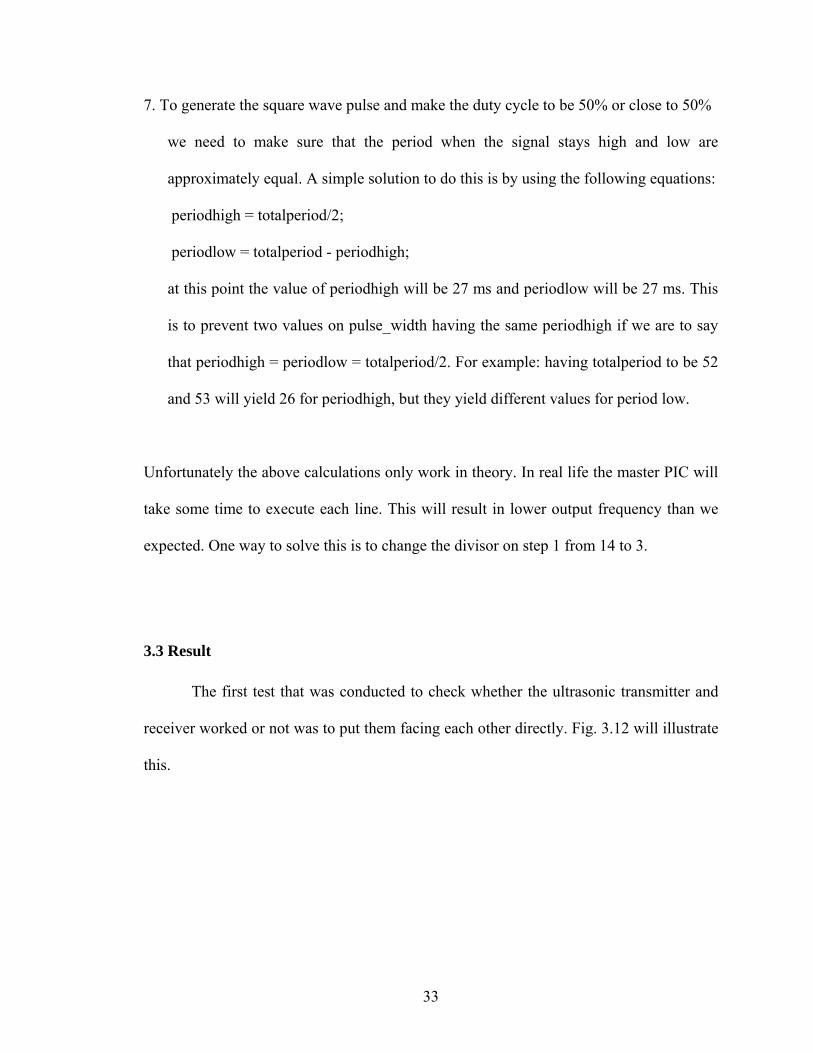
The first test that was conducted to check whether the ultrasonic transmitter and
receiver worked or not was to put them facing each other directly. Fig. 3.12 will illustrate
this.
34
Figure 3.12 Ultrasonic transmitter and receiver facing each other
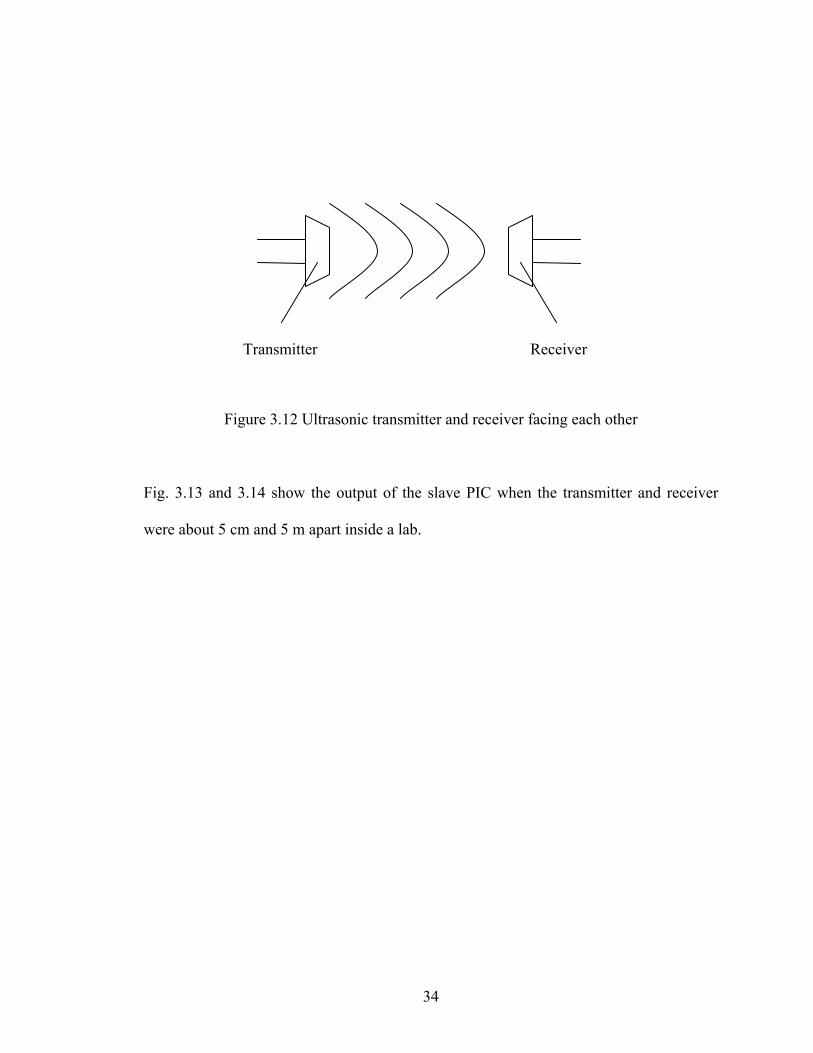
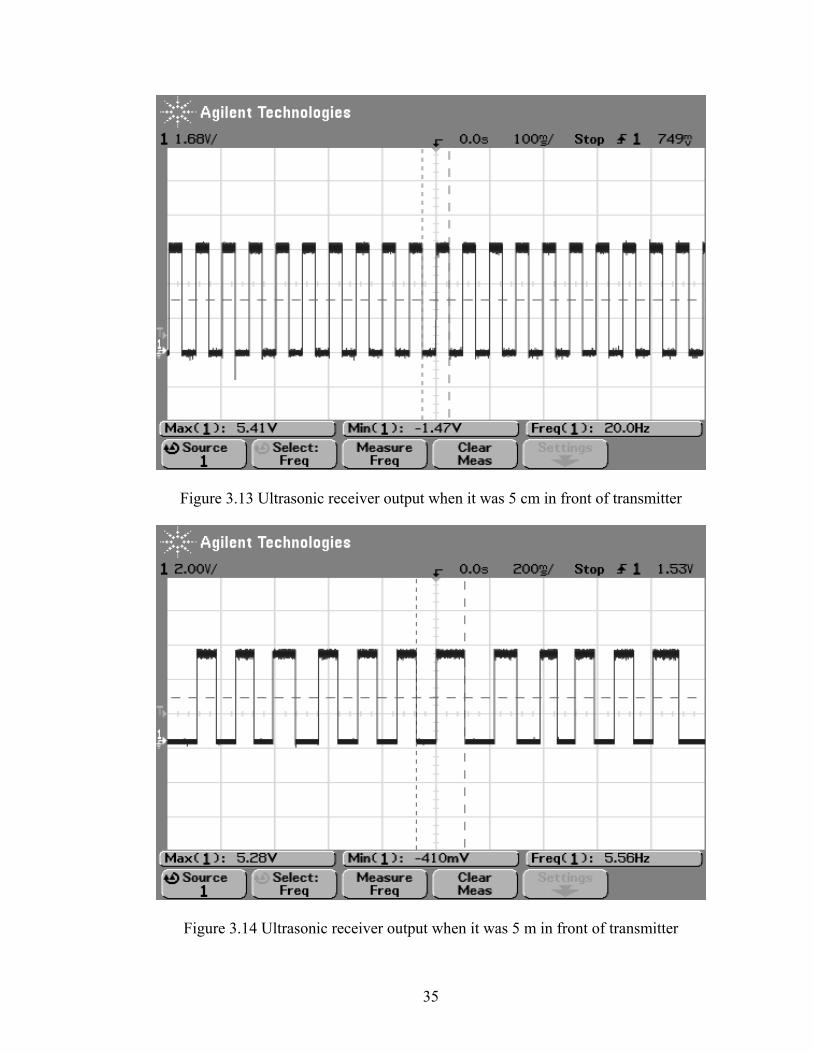
Fig. 3.13 and 3.14 show the output of the slave PIC when the transmitter and receiver
were about 5 cm and 5 m apart inside a lab.
Transmitter Receiver
35
Figure 3.13 Ultrasonic receiver output when it was 5 cm in front of transmitter
Figure 3.14 Ultrasonic receiver output when it was 5 m in front of transmitter
36
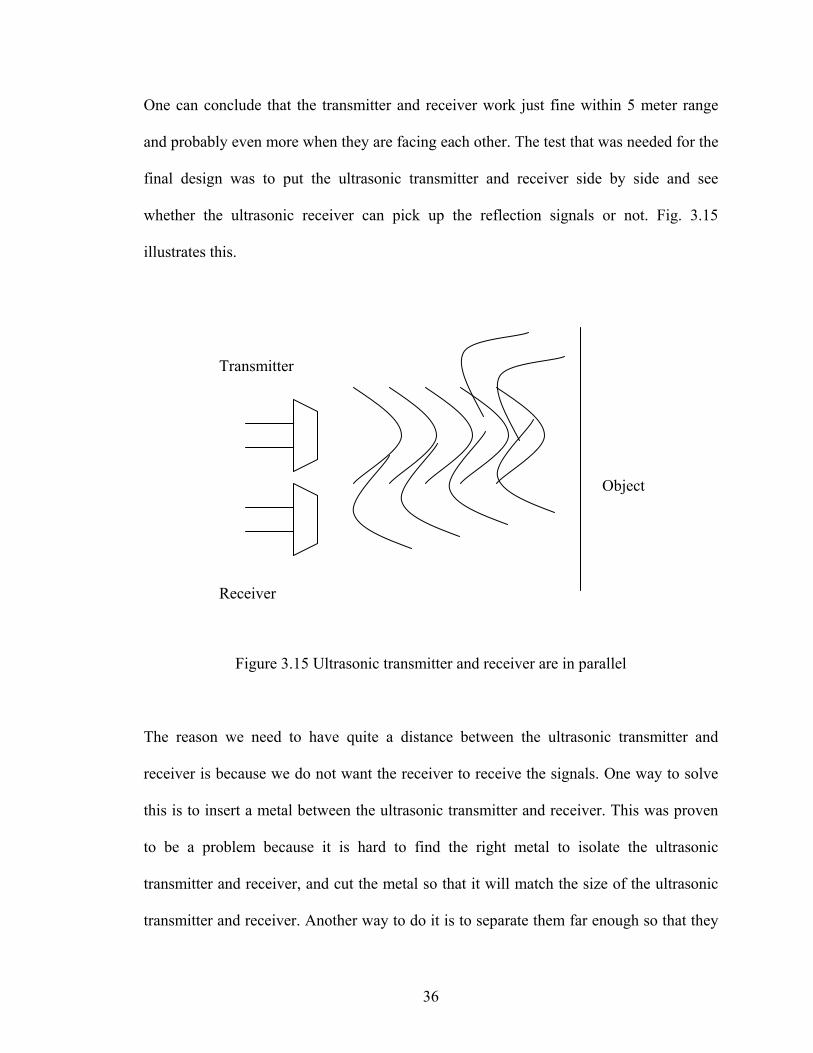
One can conclude that the transmitter and receiver work just fine within 5 meter range
and probably even more when they are facing each other. The test that was needed for the
final design was to put the ultrasonic transmitter and receiver side by side and see
whether the ultrasonic receiver can pick up the reflection signals or not. Fig. 3.15
illustrates this.
Figure 3.15 Ultrasonic transmitter and receiver are in parallel
The reason we need to have quite a distance between the ultrasonic transmitter and
receiver is because we do not want the receiver to receive the signals. One way to solve
this is to insert a metal between the ultrasonic transmitter and receiver. This was proven
to be a problem because it is hard to find the right metal to isolate the ultrasonic
transmitter and receiver, and cut the metal so that it will match the size of the ultrasonic
transmitter and receiver. Another way to do it is to separate them far enough so that they
Transmitter
Receiver
Object
37
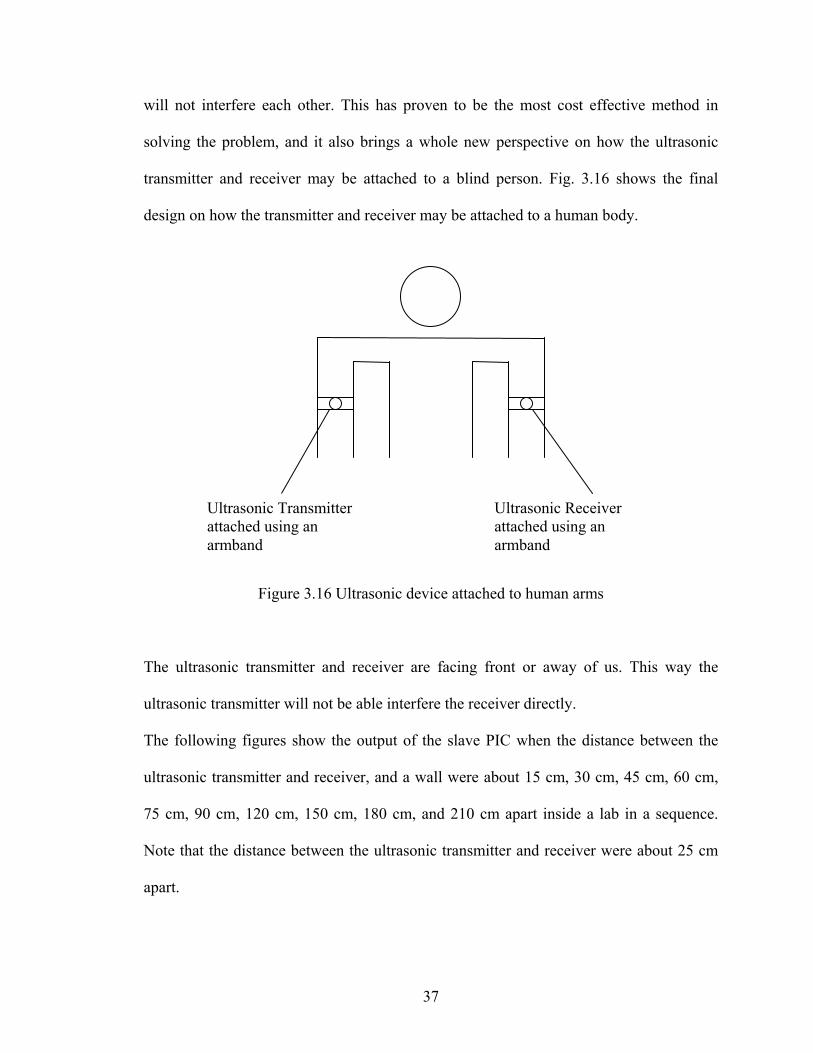
will not interfere each other. This has proven to be the most cost effective method in
solving the problem, and it also brings a whole new perspective on how the ultrasonic
transmitter and receiver may be attached to a blind person. Fig. 3.16 shows the final
design on how the transmitter and receiver may be attached to a human body.
Figure 3.16 Ultrasonic device attached to human arms
The ultrasonic transmitter and receiver are facing front or away of us. This way the
ultrasonic transmitter will not be able interfere the receiver directly.
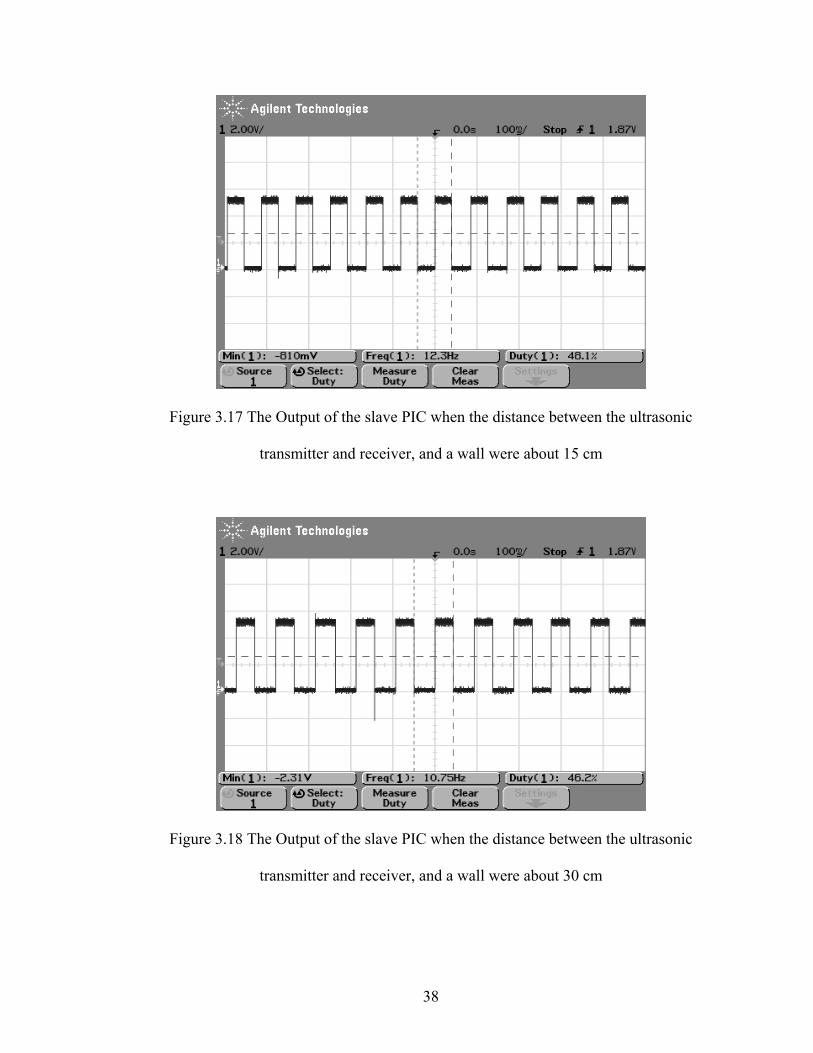
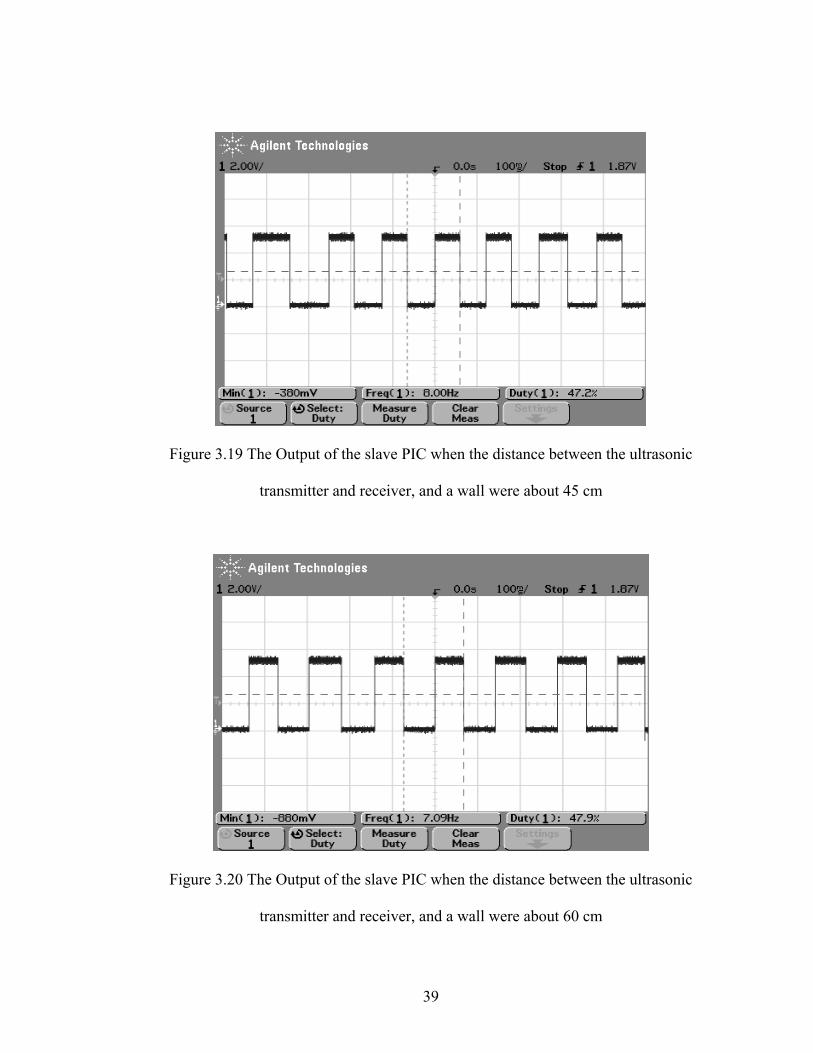
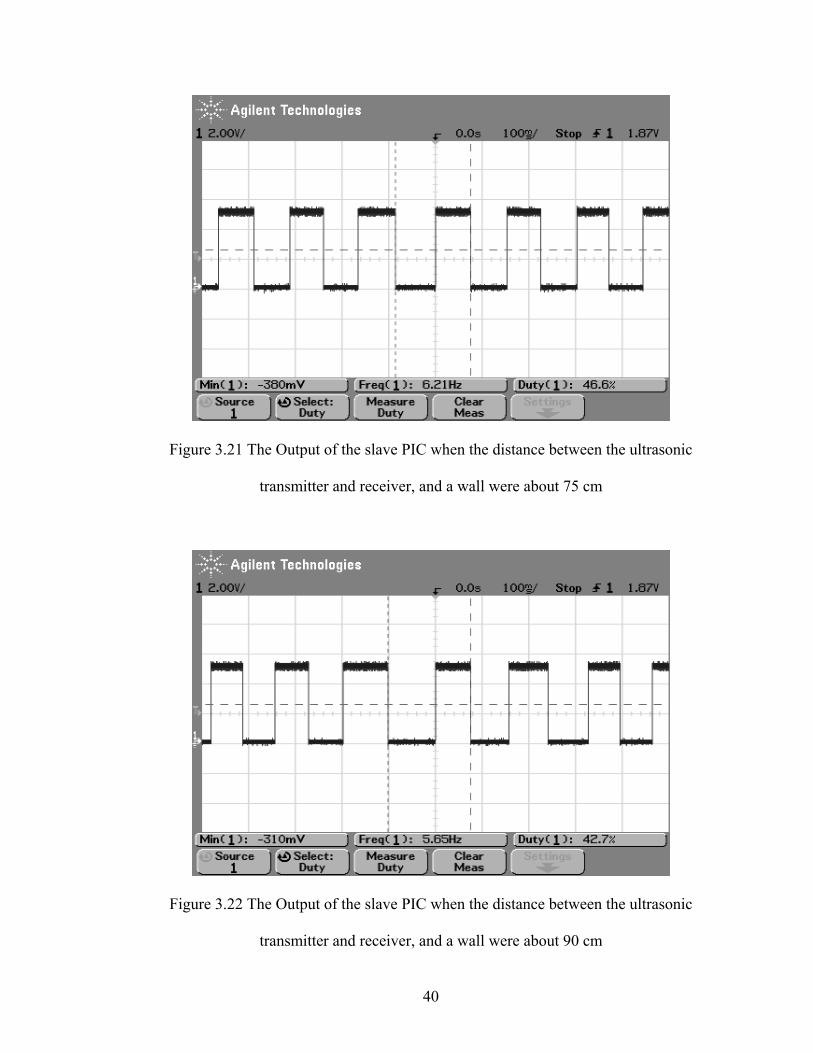
The following figures show the output of the slave PIC when the distance between the
ultrasonic transmitter and receiver, and a wall were about 15 cm, 30 cm, 45 cm, 60 cm,
75 cm, 90 cm, 120 cm, 150 cm, 180 cm, and 210 cm apart inside a lab in a sequence.
Note that the distance between the ultrasonic transmitter and receiver were about 25 cm
apart.
Ultrasonic Transmitter attached using an armband
Ultrasonic Receiver attached using an armband
38
Figure 3.17 The Output of the slave PIC when the distance between the ultrasonic
transmitter and receiver, and a wall were about 15 cm
Figure 3.18 The Output of the slave PIC when the distance between the ultrasonic
transmitter and receiver, and a wall were about 30 cm
39
Figure 3.19 The Output of the slave PIC when the distance between the ultrasonic
transmitter and receiver, and a wall were about 45 cm
Figure 3.20 The Output of the slave PIC when the distance between the ultrasonic
transmitter and receiver, and a wall were about 60 cm
40
Figure 3.21 The Output of the slave PIC when the distance between the ultrasonic
transmitter and receiver, and a wall were about 75 cm
Figure 3.22 The Output of the slave PIC when the distance between the ultrasonic
transmitter and receiver, and a wall were about 90 cm
41
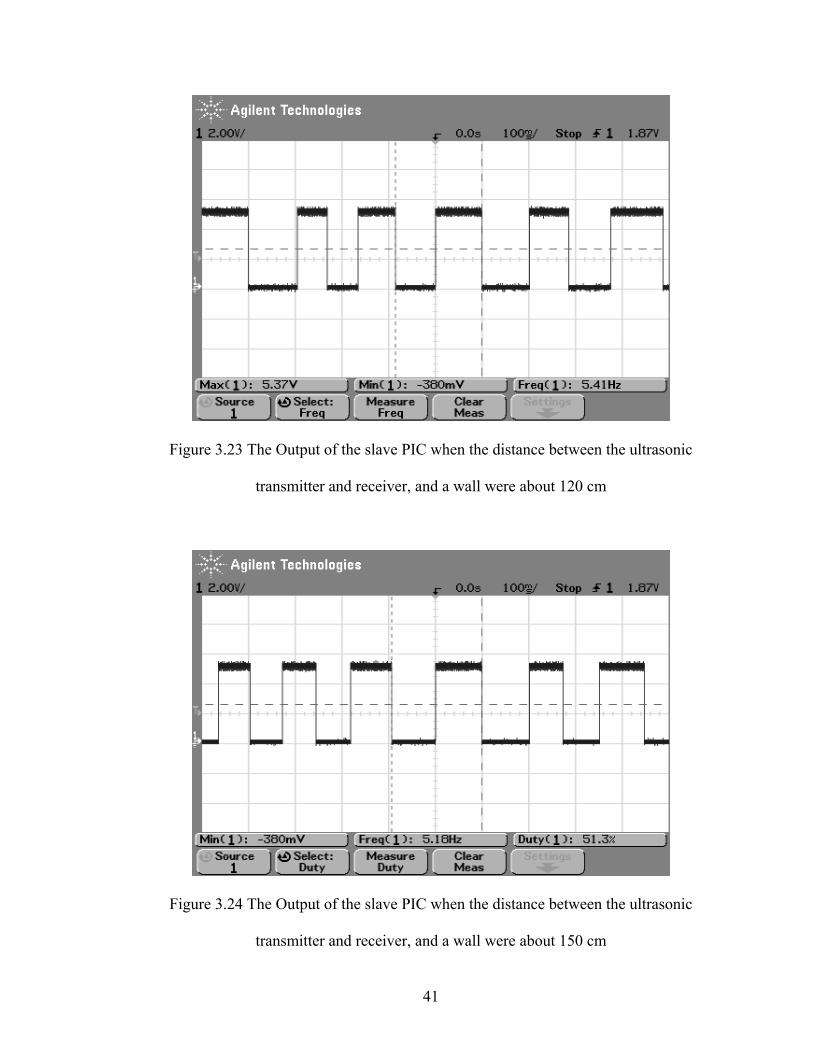
Figure 3.23 The Output of the slave PIC when the distance between the ultrasonic
transmitter and receiver, and a wall were about 120 cm
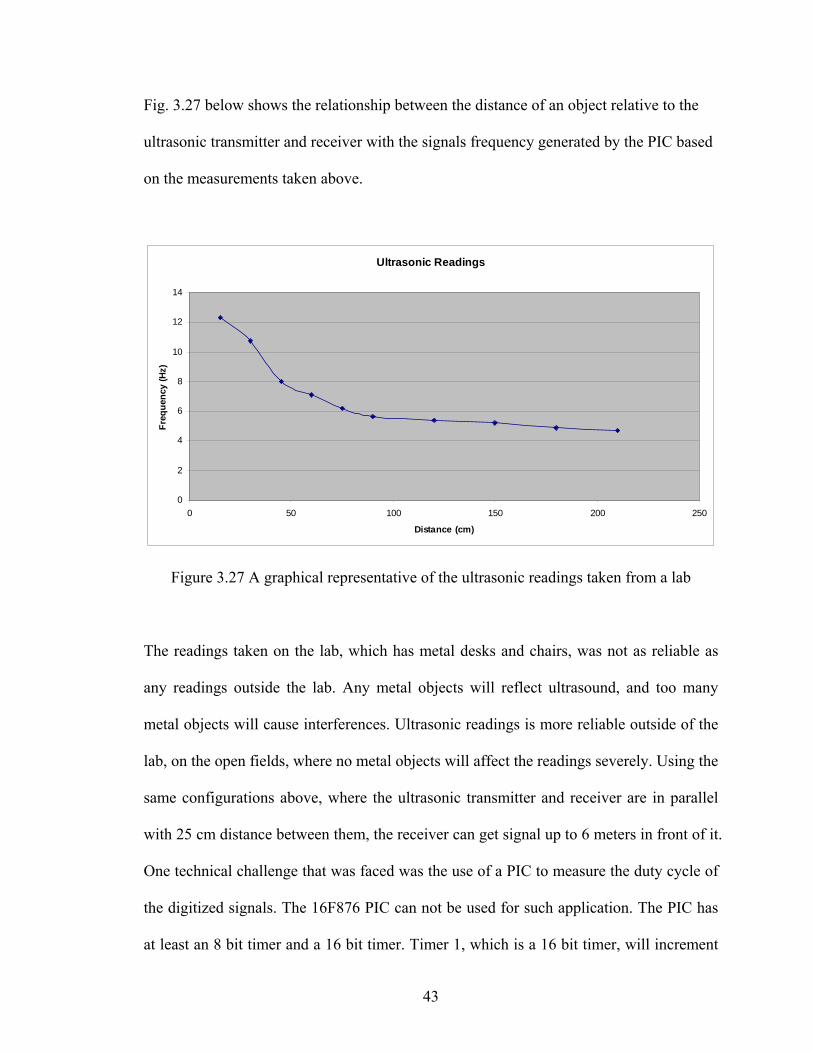
Figure 3.24 The Output of the slave PIC when the distance between the ultrasonic
transmitter and receiver, and a wall were about 150 cm

42
Figure 3.25 The Output of the slave PIC when the distance between the ultrasonic
transmitter and receiver, and a wall were about 180 cm
Figure 3.26 The Output of the slave PIC when the distance between the ultrasonic
transmitter and receiver, and a wall were about 210 cm
43
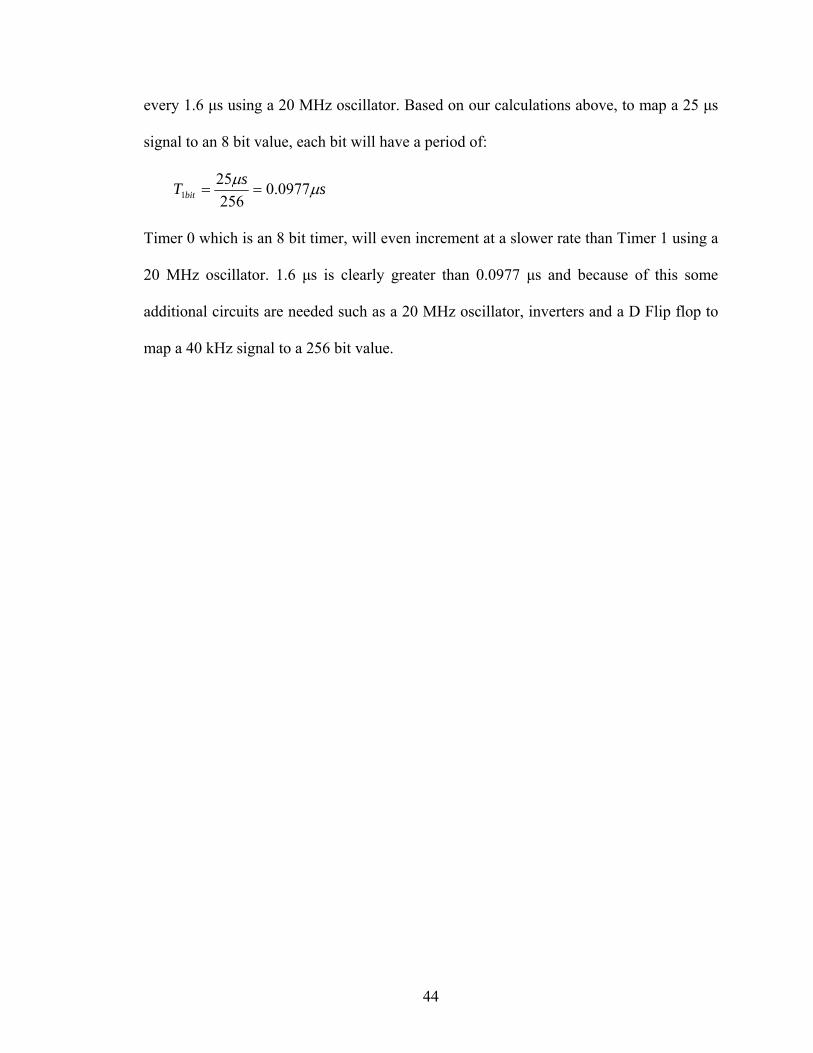
Fig. 3.27 below shows the relationship between the distance of an object relative to the
ultrasonic transmitter and receiver with the signals frequency generated by the PIC based
on the measurements taken above.
Ultrasonic Readings
0
2
4
6
8
10
12
14
0 50 100 150 200 250
Distance (cm)
Freq
uenc
y (H
z)
Figure 3.27 A graphical representative of the ultrasonic readings taken from a lab
The readings taken on the lab, which has metal desks and chairs, was not as reliable as
any readings outside the lab. Any metal objects will reflect ultrasound, and too many
metal objects will cause interferences. Ultrasonic readings is more reliable outside of the
lab, on the open fields, where no metal objects will affect the readings severely. Using the
same configurations above, where the ultrasonic transmitter and receiver are in parallel
with 25 cm distance between them, the receiver can get signal up to 6 meters in front of it.
One technical challenge that was faced was the use of a PIC to measure the duty cycle of
the digitized signals. The 16F876 PIC can not be used for such application. The PIC has
at least an 8 bit timer and a 16 bit timer. Timer 1, which is a 16 bit timer, will increment
44
every 1.6 μs using a 20 MHz oscillator. Based on our calculations above, to map a 25 μs
signal to an 8 bit value, each bit will have a period of:
ssT bit μμ 0977.025625
1 ==
Timer 0 which is an 8 bit timer, will even increment at a slower rate than Timer 1 using a
20 MHz oscillator. 1.6 μs is clearly greater than 0.0977 μs and because of this some
additional circuits are needed such as a 20 MHz oscillator, inverters and a D Flip flop to
map a 40 kHz signal to a 256 bit value.
45
Chapter 4
Conclusion
This thesis has discussed some fundamental ideas of ultrasonic, how ultrasonic waves
propagate, measure their velocities in three different mediums, what causes ultrasonic
waves to reflect and refract, and some real life examples where they can be used to help
increasing our quality of life. The advantages of using this design are portable, relatively
light, relatively easy to build and reliable in open field. This device can detect any objects
up to 6 meters in range. This device always updates its readings in miliseconds, which is
good in detecting fast motion objects such as cars and motorcycles. Most of the
components used here are low power chips, hence increasing the life of the batteries used.
The idea of putting the ultrasonic transmitter and receiver on someone’s arms will allow
that person to detect any objects directly in front of him and on the ground as well. This
design is reliable in an open field area such as on a park or on a sidewalk. There are still a
lot of applications out there that might find ultrasonic to be useful, it is up to engineers to
design and improve those applications using their creativity.
46
References
[1] E. Papadakis, Ultrasonic Instruments and Devices: Reference for Modern
Instrumentation, Techniques, and Technology. Academic Press, 1999.
[2] Š. Kočiš, and Z. Figura, Ultrasonic Measurements and Technologies. Chapman &
Hall, 1996
[3] J. David, and N. Cheeke, Fundamentals and Applications of Ultrasonic Waves. CRC
Press, 2002
[4] R. Wood, Supersonics: The Science of Inaudible Sounds. Brown University, 1939.
[5] D. Webster, “A Pulsed Ultrasonic Distance Measurement System Based Upon Phase
Digitizing,” IEEE Trans. Inst. and Meas., vol. 43, issue 4, pp. 578-582, Aug. 1994.
[6] H. Elmer, and H. Schweinzer, “High Resolution Ultrasonic Distance Measurement in
Air Using Coded Signals,” Proc. 19th of IEEE Trans. Inst. and Meas. Conference,
vol. 2, pp. 1565-1570, May 2002.
[7] G. Hueber, T. Ostermann, T. Bauernfeind, R. Raschhofer, and R. Hagelauer, “New
Approach of Ultrasonic Distance Measurement Technique in Robot Applications,”
Proc. 5th of International Signal Processing, vol. 3, pp. 2066-2069, Aug. 2000.
[8] W.T. Kuang, and A.S. Morris, “Ultrasonic Doppler Distance Measurement
Technique for Robot Tracking System,” IEEE letter, vol. 35, issue 11, pp. 942-943,
May 1999.
47
[9] X. Zhang, “Fuzzy Control System for a Mobile Robot Collision Avoidance,” Proc. of
IEEE International Conference on Industrial Technology,” pp. 125-128, Dec 1994.
[10] G. Mauris, E. Benoit, and L. Foulloy, “Local Measurement Validation for an
Intelligent Chirped-FM Ultrasonic Range Sensor,” IEEE Trans. Inst. and Meas.
Conference, vol. 49, issue 4, pp. 835-839, Aug. 2000.
[11] C. Ganesh, G. Dietz, and J. Jambor, “Ultrasonic Sensor-Based Motion Control for
Robotic Manipulators,” Proc. of IEEE International Conference on Systems, Man,
and Cybernetics,” vol. 2, pp. 796-797, Nov. 1989.
[12] J. L. Crowley, “World Modeling and Position Estimation for a Mobile Robot Using
Ultrasonic Ranging,” Proc. of IEEE International Conference on Robotics and
Automation,” vol. 2, pp. 674-680, May 1989.
[13] Robert X. Gao, and Chuan Li, “A Dynamic Ultrasonic Ranging System As A
Mobility Aid for the Blind,” Proc. 17th Annual Conference of the IEEE Engineering
in Medicine and Biology Society, vol. 2, pp. 1631 – 1632, September 1995.
[14] Robert Gao, and Xiaofeng Cai, “A Wireless Ranging System As An Embedded
Sensor Module for The Long Cane,” IEEE Trans. Inst. and Meas., vol. 1, pp. 547-
552, May 1998.
[15] T. O. Hoydal and J. A.Zelano, “An Alternative Mobility Aid for The Blind The
Ultrasonic Cane,” Proc. 17th Annual Northeast Conference of the IEEE Engineering
in Bioengineering, pp. 158-159, April 1991.
[16] David T. Batarseh, Dr. Timothy N. Burcham, and Dr. Gary M. McFadyen, “An
Ultrasonic Ranging System for The Blind,” Proc. 16th Annual Southeast Conference
of the IEEE Engineering in Biomedical Engineering, pp. 411-413, April 1997.
48
[17] K. Koshi, H. Kani, and Y. Tadakoro, “Orientation Aids for the Blind Using
Ultrasonic Signpost System,” Proc. 21st Annual Conference in Medicine and
Biology Biomedical Engineering, vol. 1, pp. 587, October 1999.
[18] Sung-Jae Kang, Young Ho, and In Hyuk Moon, “Development of An Intelligent
Guide-Stick for The Blind,” Proc. 2001 International Conference of the IEEE
Engineering in Robotics and Automation, vol. 4, pp. 3208 – 3213, May 2001.
[19] P. Mihajlik, M. Guttermuth, K. Seres, and P. Tatai, “DSP-based Ultrasonic
Navigation Aid for The Blind,” IEEE Trans. Inst. and Meas., vol. 3, pp. 1535-1540,
May 2001.
[20] A. Lazaro, I. Serrano, F.J. Guardado, and R. Herrero, “Smart Ultrasonic Device for
Vitro-Ceramic Cooker Safety Control,” Proc. 7th of Emerging Technologies and
Factory Automation, vol. 1, pp. 565-570, October 1999.
[21] J. Borenstein, and I. Ulrich, “The Guide Cane-A Computerized Travel Aid for The
Active Guidance of Blind Pedestrians,” Proc. 1997 International Conference of the
IEEE Engineering in Robotics and Automation, vol. 2, pp. 1283-1288, April 1997.
[22] K J. Borenstein, and I. Ulrich, “The Guide Cane-Applying Mobile Robot
Technologies to Assist The Visually Impaired,” Systems, Man and Cybernetics, Part
A, IEEE Transactions on, vol. 31, pp. 131-136, March 2001.
[23] C. Wong, D. Wee, I. Murray, and T. Dias, “A Novel Design of Integrated Proximity
Sensors for The White Cane,” The Seventh Australian and New Zealand Intelligent
Information Systems Conference, pp. 197 – 201, November 2001.
[24] I. Shim, and J. Yoon, “A Robotic Cane Based On Interactive Technology,” Proc.
28th Annual Conference of the Industrial Electronics Society, vol. 3, pp. 2249-2254,
49
November 2002.
[25] T.E. Gomez, F. Montero de Espinosa, and A.P. Pozas, “Air-Coupled Ultrasonic
Scanner for Braille,” IEEE Ultrasonic Symposium, vol. 1, pp. 591-594, October
2001.
[26] X. Cai, and R.X. Gao, “Data Fusion For Obstacle Identification Using Ultrasonic
Sensing,” Proc. 17th of IEEE Trans. Inst. and Meas. Conference, vol. 2, pp. 834-838,
May 2000.
[27] K. S. Suslick, Ultrasound: Its Chemical, Physical, and Biological Effects, VCH
Publishers, 1988.

50
APPENDIX A
Ultrasonic Receiver full circuit
51
52
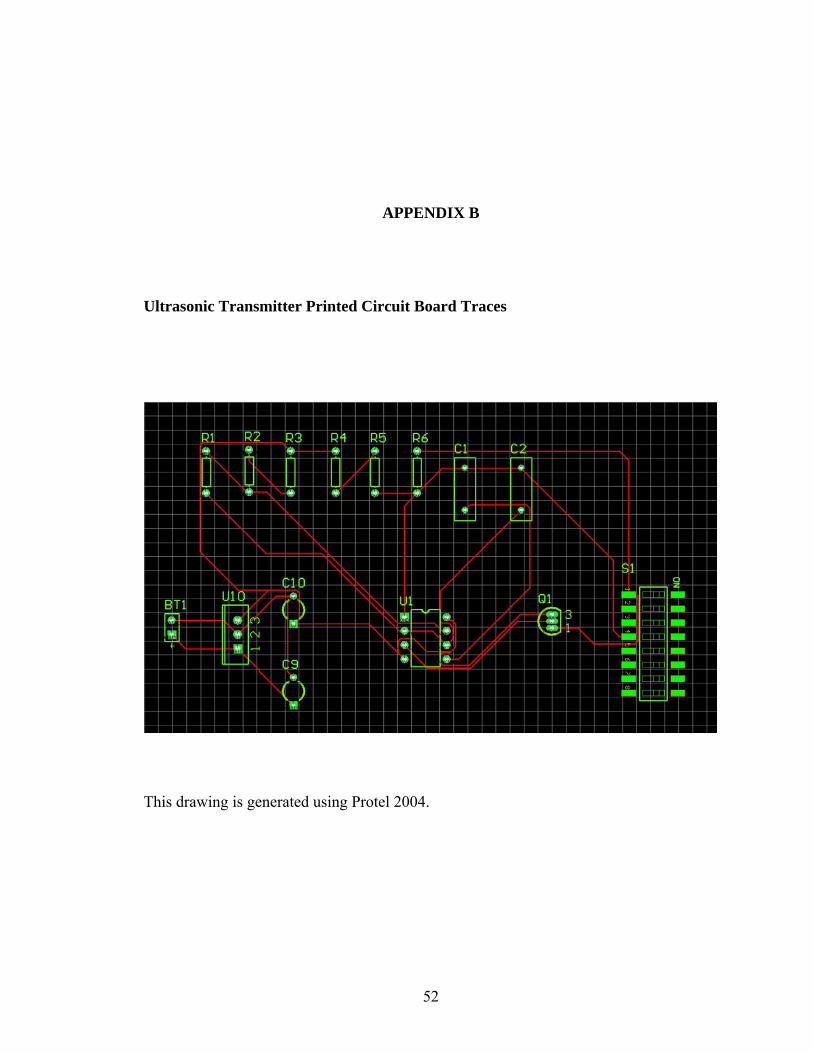
APPENDIX B
Ultrasonic Transmitter Printed Circuit Board Traces
This drawing is generated using Protel 2004.
53
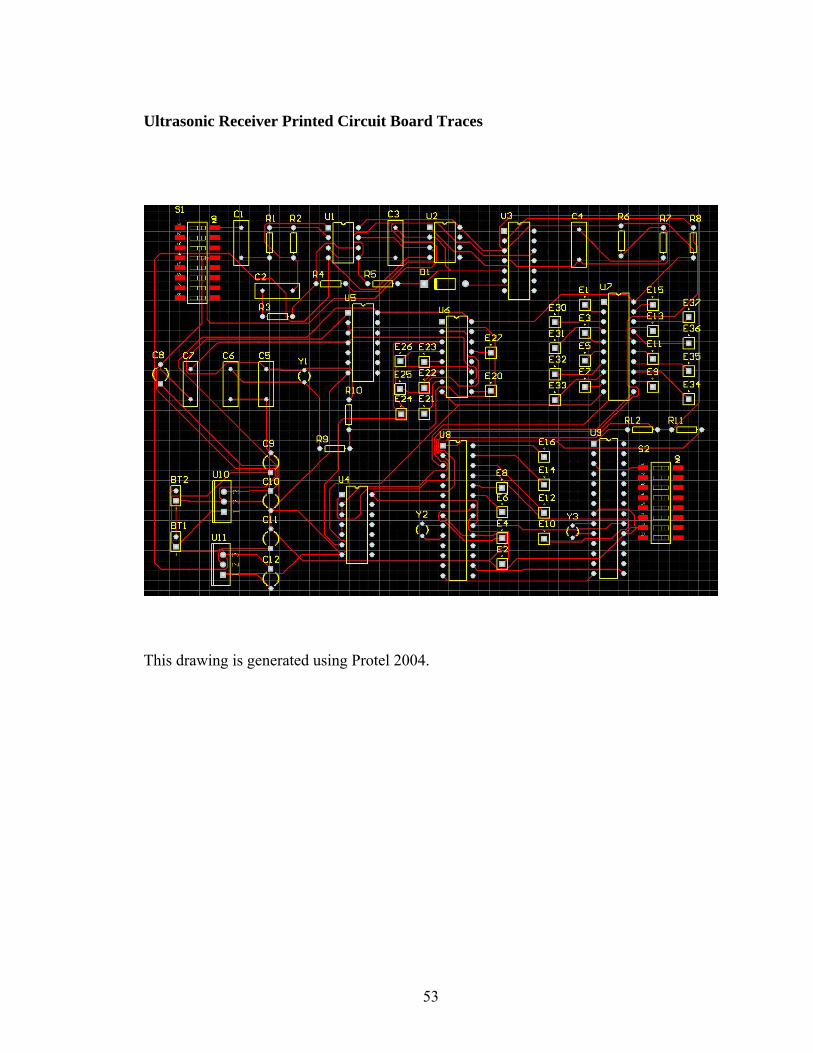
Ultrasonic Receiver Printed Circuit Board Traces
This drawing is generated using Protel 2004.
54
APPENDIX C
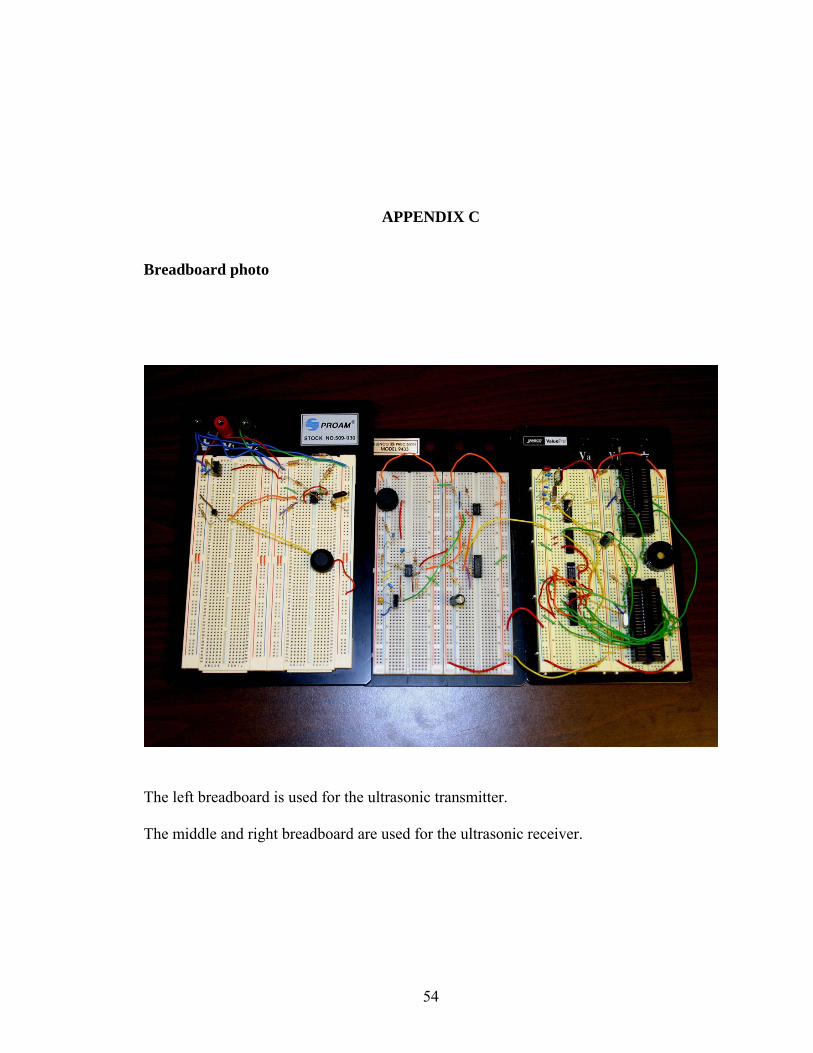
Breadboard photo
The left breadboard is used for the ultrasonic transmitter.
The middle and right breadboard are used for the ultrasonic receiver.
VITA
Julius J. Marpaung
Candidate for the Degree of
Master of Science
Thesis: AN IMPLEMENTATION OF AN ULTRASONIC DEVICE FOR THE
VISUALLY IMPAIRED
Major Field: Electrical and Computer Engineering
Biographical Information:
Personal Data: Born in Jakarta, Indonesia
Education: Graduated from SMUN Public High School #36, Rawamangun, Jakarta, Indonesia. Received Bachelor of Science in Electrical and Computer Engineering from Oklahoma State University, USA in December 2003. Completed the requirement for Master of Science in Electrical and Computer Engineering from Oklahoma State University in May 2006.
Experience: Employed by Oklahoma State University, Department of Electrical And Computer Engineering as a Graduate Teaching Assistant in Fall 2005. Employed by CEATLABS in Spring 2005 and Spring 2006.
Name: Julius Marpaung Date of Degree: May, 2006 Institution: Oklahoma State University Location: Stillwater, Oklahoma Title of Study: AN IMPLEMENTATION OF AN ULTRASONIC DEVICE FOR THE VISUALLY IMPAIRED Pages in Study: 54 Candidate for the Degree of Master of Science Major field: Electrical and Computer Engineering Scope and Method of Study: Ultrasonic is defined as any bands above audible band (20
kHz) and up to MHz range, and it is widely used in many fields, such as medical, engineering, and military. Another unique characteristic of ultrasonic waves is that it can penetrate opaque materials that other waves cannot. This makes it a very valuable asset to measure distance and thickness of an object in an inexpensive and reliable way. This paper describes a simple and inexpensive but yet reliable ultrasonic device to help the visually impaired people to detect objects several meters away. There are a number of ways to design a device engaging ultrasonic principle. In our approach the detection is initially reflected as a change of duty cycle, and then it is converted into the variation of the frequency, and eventually the user is alerted by the sound from a buzzer. The transmitter sends a continuous 40 kHz signal without modulation. The reflected ultrasonic signal collected by the receiver is very weak, and thus it needs to be amplified and rectified. Two Peripheral Interface Controllers (PICs) are employed in this design.
Findings and Conclusions: A good feature about this device is that it can updates its readings very quickly, which is required in detecting fast moving objects, such as cars and motorcycles. Most of the components used here are low power chips, hence battery lifetime can be prolonged. The small volume and light weight make it possible to put the ultrasonic transmitter and receiver on someone’s arms, which is a convenient way to detect objects on the way ahead.
Advisor’s Approval: Dr. Yumin Zhang