Embed Size (px)
DESCRIPTION
An Implantable Subcutaneous Glucose Sensor Array in Ketosis Prone Rats Closed Loop Glycemic Control
Citation preview
Artificial Organs
29(2):131–143, Blackwell Publishing, Inc.© 2005 International Center for Artificial Organs and Transplantation
131
Blackwell Science, LtdOxford, UKAORArtificial Organs0160-564X2004 International Society for Artificial Organs292131143Original Article
CLOSED LOOP DIABETES CONTROL IN RATSW.K. WARD ET AL.
Received March 2004; revised May 2004.Address correspondence and reprint requests to Dr. W. Ken-
neth Ward, Legacy Clinical Research and Technology Center, 1225NE 2nd Avenue, Portland, OR 97232, U.S.A. E-mail: [email protected]
An Implantable Subcutaneous Glucose Sensor Array in Ketosis-prone Rats: Closed Loop Glycemic Control
W. Kenneth Ward, Michael D. Wood, Heather M. Casey, Matthew J. Quinn, and Isaac F. Federiuk
Legacy Clinical Research and Technology Center, Portland, OR, U.S.A.
Abstract:
A closed loop system of diabetes control wouldminimize hyperglycemia and hypoglycemia. We thereforeimplanted and tested a subcutaneous amperometric glu-cose sensor array in alloxan-diabetic rats. Each arrayemployed four sensing units, the outputs of which wereprocessed in real time to yield a unified signal. We utilizeda gain-scheduled insulin control algorithm which rapidlyreduced insulin delivery as glucose concentration declined.Such a system was generally effective in controlling glyce-mia and the degree of lag between blood glucose and thesensor signal was usually 3–8 min. After prolonged implan-
tation, this lag was sometimes longer, which led to impair-ment of sensor accuracy. Using a prospective two-pointcalibration method, sensor accuracy and closed loop con-trol were good. A revised algorithm yielded better glyce-mic control than the initial algorithm did. Future researchneeds to further improve calibration methods and reduceforeign body fibrosis in order to avoid a time-relatedincrease in lag duration.
Key Words:
Glucose sensor—Artificial pancreas—Automated pancreas—Type 1 diabe-tes—Gain-scheduled control.
Using currently available technology, it is difficultto safely achieve tight glycemic control in type 1 dia-betes. In the Diabetes Control and ComplicationsTrial, the intensive-control group experienced areduction in complications because of reducedhyperglycemia, but this benefit was counterbalancedby a threefold increase in serious hypoglycemic reac-tions (1). For most patients with Type 1 diabetes,glucose monitoring is performed intermittently andrarely exceeds four tests per day (2). Reduction oftime spent in the hyperglycemic and hypoglycemicranges might well be achieved with continuouslyfunctioning device that integrated a glucose sensorwith an insulin delivery device.
In recent years, many approaches to continuousmeasurement of glucose have been developed.Briefly, approaches includes the peroxide-oxidationamperometric technique (3–8), the oxygen-reductionamperometric technique (9,10), amperometric oxida-
tion of an immobilized mediator (11,12), microdialy-sis approaches (13,14), noninvasive impedancespectroscopy (15), and noninvasive infrared spec-troscopy (16). In addition, several groups have suc-ceeded in extracting small volumes of interstitial fluid(ISF) from the skin either by microporation (17) ornoninvasively by reverse iontophoresis (18,19) withsubsequent amperometric measurement of glucose.
We have developed a fully implantable peroxide-sensing amperometric glucose monitor that haspreviously been studied in rats (20), dogs (21), andrabbits (22). We recently reported that during glu-cose clamp experiments in nondiabetic rats, the useof an array with four independent indicating elec-trodes led to increased accuracy of the continuousglucose assay. In particular, when real time, median-based data processing was applied to the four signals,the accuracy was superior to that of signal averaging.
In the current study, we addressed whether the useof sensor arrays, with the same median-based pro-cessing, would allow control of glycemia in diabeticrats during closed loop insulin administration. Weelected to study the rats over many weeks in orderto better understand the effects on glycemic controlof time-related effects such as increasing lag because
132 W.K. WARD ET AL.
Artif Organs, Vol. 29, No. 2, 2005
of progression of foreign body fibrosis. Finally, thesestudies presented an opportunity to compare pro-spective calibration with retrospective calibration.
METHODS
Rats were chosen for study for several reasons.First, rats can be sacrificed after sensor explant, andtheir tissues can be examined to correlate anatomicfindings (such as a foreign body capsule) with sensorfunction (although such data are not part of this arti-cle). In addition, in anesthetized rats, during closedloop control, glucose can safely be followed to ratherlow levels (40–50 mg/dL) before one must interveneby administering glucose. In humans, becauseuncomfortable symptoms appear above this level,earlier intervention is necessary and this precludesmeasuring the ability of the system to correct forfalling glycemia.
Diabetes was successfully induced in seven adultSprague-Dawley rats (body weight 350–600 g) by theadministration of alloxan (Sigma, St. Louis, MO,U.S.A.), 120–200 mg/kg, given intraperitoneally (IP).One of the goals of the study was to create a modelof Type 1 diabetes with little or no residual insulin,given the fact that endogenous insulin enhances gly-cemic control and would thus diminish the rigor ofclosed loop experiments. For this reason, all ratsunderwent blood glucose testing (tested by saphen-ous vein nick using a portable glucose meter [Life-scan Sure Step, Milipitas, CA, U.S.A.]) 24–72 h afteralloxan administration. All animals with a blood glu-cose level of 250 mg/dL or greater were checked forelevated ketone levels (Precision Xtra, Abbott Lab-oratories, Bedford, MA, U.S.A.). To be selected forthe closed loop studies, animals were required tohave blood ketone values of 1.5 mM or above.Animals were given subcutaneous maintenanceinjections of insulin glargine (Aventis Pharmaceuti-cals Inc., Bridgewater, NJ, U.S.A.), once per day.Doses were adjusted according to blood glucoselevels measured 1–2 times per day by a saphenousvein nick.
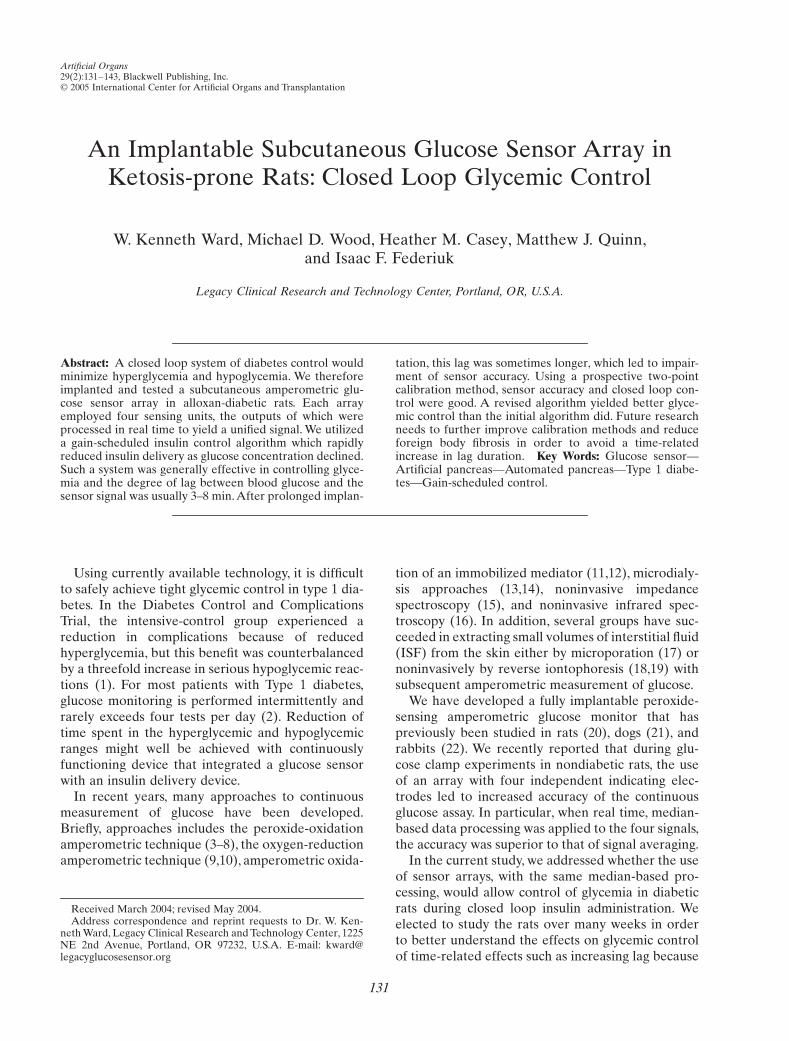
Each sensor array disk contained four separateperipheral sensing (indicating) electrodes with acommon Ag/AgCl central reference electrode. A dia-gram of a sensor array disk (with dimensions andbattery information) is shown in Fig. 1. Indicatingelectrodes were made of platinum and were coatedwith glucose oxidase and bovine serum albumin,both of which were immobilized with glutaraldehyde.After the enzyme coat was applied, an external coat-ing of a silicone-polyurethane copolymer (PolymerTechnology Group, Inc., Berkeley, CA, U.S.A.) was
placed over the electrodes in order to enhance theentry of the oxygen, which is needed to drive theglucose oxidase reaction.
Each sensing electrode had its own telemetrychannel to allow data transmission to an exter-nal custom-developed electronic monitoring unit(EMU). The EMU allowed data display, data stor-age, and calibration. The EMU would not receive asignal from an array until a unique array identifica-tion code was first received.
Animal studies were performed after approval wasobtained from the Legacy Health System Institu-tional Animal Care and Use Committee. All animalstudies were performed in an AAALAC-accreditedfacility under the supervision of a full-time veterinar-ian certified in laboratory animal care. Principles oflaboratory animal care (NIH publication no. 85-23,revised 1985) were followed. A total of 11 sensorarrays were surgically implanted (some animals hadtwo sensor arrays, in preparation for a program thatattempts to reduce the number of animals). Beforeimplantation, animals were given general anesthesiawith 2% isoflurane. After creation of a dorsal subcu-taneous pocket using blunt dissection, the sensorarray disk was implanted into the pocket, and thentwo sutures were used to anchor the disk to theunderlying fascia. All animals tolerated the proce-dure well.
Closed loop studies were performed 1 week afterimplant and every 2 weeks thereafter, under isoflu-rane anesthesia. A provisional one-point calibration
FIG. 1.
A diagram of the sensor array. Each of the four peripheralplatinum electrodes has a length of 10 mm and exposed widthof 0.25 mm. The central Ag/AgCl reference electrode is 13 mmin diameter. The array case has a diameter of 32 mm and aheight (thickness) of 11 mm. An internal coin cell battery is ratedat 180 mA and its estimated lifetime is 3–5 months. The batteryhas a diameter of 23.2 mm and a thickness of 3.3 mm.

CLOSED LOOP DIABETES CONTROL IN RATS 133
Artif Organs, Vol. 29, No. 2, 2005
was performed during the baseline period (beforeinsulin administration) by obtaining a sensor signaland the corresponding blood glucose value from atail nick. This data pair was also used as the firstpoint for the two-point calibration. The provisionalone-point calibration allowed a translation of thesensor signal into estimated glucose values in orderto calculate the subsequent rate of change forglucose.
In order to select the second point, it was necessaryto satisfy several criteria. These criteria included (i):a rate of change of estimated sensor glucose of lessthan 0.6 (mg/dL)/min, (ii) a difference between thefirst and second sensor blood glucose values ofgreater than 50 mg/dL, and (iii) a remaining studyduration of more than 20% in order to allow ade-quate time to assess sensor function. For example, ifa sensor signal did not respond to rising or fallingglucose, then it would not change by the needed50 mg/dL and thus would not be able to becalibrated.
In terms of algorithm development, we found thatin early unpublished pilot studies, some algorithmsled to unstable glucose values and frequent hypogly-cemia, resulting in part from failure to reduce theinsulin infusion rate (IIR) rapidly during glucosedecline. For this reason, we wanted a control systemthat rapidly reduced IIR when glucose leveled offand started to decline. In addition, we wanted tomimic the natural islet beta cell function in terms ofa first phase (rapid onset and short-lived) and a sec-ond phase (slower onset and long-lived) responses toelevated glucose. For these reasons, we chose a non-linear system that uses multiplication of proportionaland derivative factors (not addition, as in a typicalPID system). We added a variable exponent to thederivative term to enhance of the velocity of the “off”effect.
During closed loop studies, Regular insulin(Novo-Nordisk Pharmaceuticals, Inc., Princeton, NJ,U.S.A.) diluted in saline was delivered by a screwpump (PhD 2000, Harvard Apparatus, Holliston,MA, U.S.A.) intravenously (IV) into the saphenousvein. The IIR was calculated every minute using again-scheduled, exponentially modified propor-tional-derivative system, as follows, where “G”refers to glucose and “IIR” refers to insulin infusionrate:
IIR
=
prior IIR
¥
Proportionalparameter
¥
Derivative parameter
Proportional parameter
=
1
+
[(Current calibratedsensor G-value
-
G Goal)
¥
Proportional factor]
If the slope (i.e., sensor glucose vs. time over 5 min)is positive:
Derivative parameter
=
1
+
(dG/dt)
P
If the slope is negative,
Derivative parameter
=
1
+
(dG/dt)
Q
Restated, if the glucose is falling (negative), thederivative is raised to the Q exponent in order torespond rapidly to falling glucose, that is, to allow arapid reduction of the IIR in order to avoid subse-quent large swings in glucose. This gain schedulingwas necessary because of the fact that in initial pilotstudies, it was sometimes observed that there werelarge glucose swings because of overshoot hypogly-cemia followed by rebound hyperglycemia.
In the original algorithm the proportional param-eter was set at 0.012, the P exponent 0.70, and the Qexponent 0.91. The G Goal was set at 110–120 mg/dL. In both algorithms, there was a maximal IIR of1–2 units per hour.
For the revised algorithm, the proportional param-eter and Q exponent were unchanged. The P expo-nent was reduced to 0.60 in order to minimizeovercorrection and subsequent glycemic swings andthe G Goal was reduced slightly to 100 mg/dL.
Figures 2 and 3 provide graphical informationabout the algorithm. Figure 2 shows a simulation ofIIR using this algorithm in response to a square waveincrease in glucose. There is an initial rise in calcu-lated insulin output that occurs over 5–7 min that iscomparable to the pancreatic islet’s first phase insulinsecretory response. Following this, there is a slow risein calculated insulin output that persists for as long
FIG. 2.
Simulated insulin infusion rate in response to a squarewave increase in glucose, using the modified proportional-derivative algorithm employed for this study. Note that theincrease in calculated insulin delivery is in two phases, much likethat of the endogenous pancreatic islet. The first phase is rapidand takes place over 5–7 min and the second phase is slowerand continues to rise as long as glucose remains elevated.
Closed loop simulation
100
110
120
130
140
150
0 5 10 15 20 25 30 35 40
Time (arbitrary units)
0
1
2
3
4
5In
sulin
infu
sio
n r
ate
(IIR
, arb
itra
ry u
nit
s)
Glu
cose
(m
g/d
L)
glucoseglucose
IIR

134 W.K. WARD ET AL.
Artif Organs, Vol. 29, No. 2, 2005
as glucose is elevated, corresponding to the islet’ssecond phase insulin response.
Figure 3 demonstrates the gain schedule. Simu-lated insulin administration rates in response to asteady increase and decrease in glucose level areshown. One can see that if the P and Q exponentsare different (and Q is larger), calculated insulindelivery rate falls off more rapidly (as glucose beginsto decline) than when the exponents are the same.
Sensor glucose values were calculated in real timeby taking all glucose values from the sensor array andcalculating a unified glucose value using a median-based
Z
-statistic (23). Specifically, this algorithm uti-lized a modified
Z
-score calculated for the array’sglucose data set (obtained once per minute) fromeach of the four sensing anode units. For a givensensing unit (unit X), at a given time point, a
Z
-scorewas calculated based on calibrated sensor glucosevalues (SG):
In order to define the numerator more specifically,the formula can be restated as:
The constant 1.483 is a correction factor designed tomake the estimator scale factor consistent with theusual scale parameter of a normal distribution (24).
Z scoreMedian of all deviations
=¥
deviation.
unit X
1 483
Z scoreMedian SG SG
Median of all deviationsall units=
-¥unit X
.1 483
Z
-score values of greater than 1 were excluded asoutliers. The final glucose value for an array at agiven time was computed as the mean of the remain-ing electrode signals. A study from our laboratoryhas demonstrated that data analyzed in this fashionis more accurate that individual unprocessed dataand more accurate of the mean of all sensing elec-trodes (23).
Treatment of hypoglycemia was occasionally nec-essary in some cases because of the known effect ofsevere hypoglycemia to cause coma, seizures, or per-manent brain damage. Hypoglycemic interventionduring these studies consisted of (i) in mild cases,turning off the insulin infusion pump or (ii) in severecases, administering 0.5–1 mL 10% dextrose IV.
Sensor lag duration was calculated in order tomeasure the delay of sensor (subcutaneous intersti-tial) glucose values behind the corresponding bloodglucose values. Lag was calculated as follows: Ineach closed loop study, all occurrences where bloodglucose changed by at least 75 mg/dL over
£
2 h wereevaluated for lag. For such changes of blood glucoseversus time, a first order regression line was calcu-lated and compared to the regression line for thecorresponding sensor glucose values versus time. Ata point midway between the peak and the nadir ofthe values, the time difference was measured. A 1.5-min delay is imparted by the 4-min median softwarefilter that was utilized to filter out sharp transientartifacts. To correct for this delay, all capillary bloodglucose values were compared to sensor values 1 minafter the blood glucose measurement was per-formed. For studies with more than one 75 mg/dLexcursion, the lag values were averaged in order tocalculate a single lag duration for each closed loopstudy.
Mean absolute relative difference (MARD), ageneral index of sensor error, was expressed as apercentage and calculated as: (|sensor glucose
-
blood glucose|)/blood glucose.In addition to the real-time prospective calibration
method, we also used a retrospective calibration tomeasure sensor accuracy and closed loop glycemiccontrol. This calibration was performed by obtainingthe least squares best fit correlation between all mea-sured capillary blood glucose values and all of thecorresponding filtered sensor signals and calculatingthe corresponding slope and y-intercept. All assess-ments of sensor accuracy (using retrospective or pro-spective calibrations) began with data obtained afterthe second calibration point.
Sensors were explanted when (i) no sensing unitor only one sensing unit was able to track bloodglucose, (ii) there was electrical failure such as
FIG. 3.
Simulated insulin delivery in response to a steady rise inglucose, followed by a steady fall. Note that during the linearglucose rise, the rise in calculated insulin infusion rate is nonlin-ear. Also note that during glucose decline, the insulin infusionrate (IIR) declines more rapidly during gain scheduling when thederivative factor’s exponents are different (as shown in thedashed curve and as explained in the text). The purpose of gainscheduling is to reduce the IIR rapidly when glucose begins tofall, in order to avoid overcorrection which typically leads to glu-cose instability.
Closed loop simulation
100
105
110
115
120
125
130
135
0 2 4 6 8 10 12Time (arbitrary units)
0.0
1.0
2.0
3.0
4.0
5.0
6.0
7.0
Insu
lin in
fusi
on
rat
e(I
IR, a
rbit
rary
un
its)
Glu
cose
(m
g/d
L)
IIR without gain schedule
IIR with gain schedule (dashed)
glucose
CLOSED LOOP DIABETES CONTROL IN RATS 135
Artif Organs, Vol. 29, No. 2, 2005
telemetry or battery failure, or (iii) the study animaldied.
In two closed loop studies, after stabilization of theblood glucose, a dose of concentrated carbohydrate(0.5 mL NutriCal, IGI, Inc., Buena, NJ, U.S.A.) wasgiven via gastric gavage in order to study the effectof oral feeding upon closed loop control. Neither ofthese studies was used when comparing the perfor-mance of the algorithm, but they were used for mea-surements of sensor accuracy such as error gridanalysis or error metrics. The gavage results are partof a larger separate study and will be reportedelsewhere.
Data are expressed as mean and SEM. Exceptwhere otherwise noted, Student’s
t
-test was used fordata set comparisons with a significance level of 0.05.
RESULTS
Closed loop glucose control
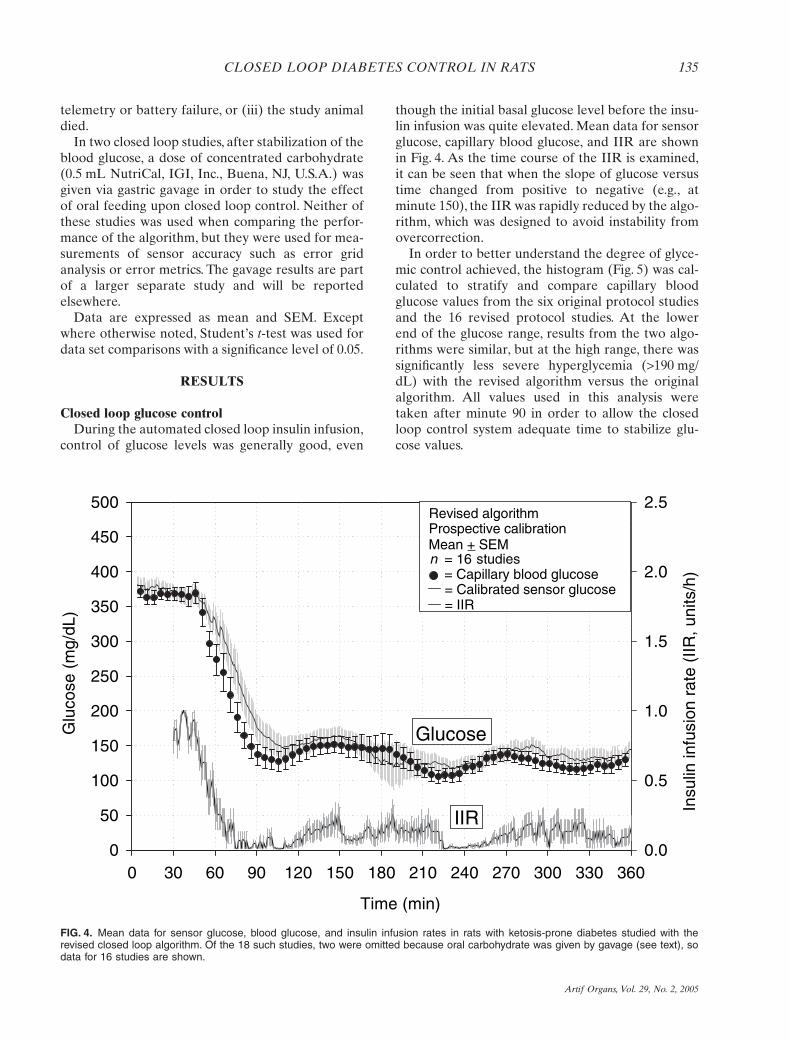
During the automated closed loop insulin infusion,control of glucose levels was generally good, even
though the initial basal glucose level before the insu-lin infusion was quite elevated. Mean data for sensorglucose, capillary blood glucose, and IIR are shownin Fig. 4. As the time course of the IIR is examined,it can be seen that when the slope of glucose versustime changed from positive to negative (e.g., atminute 150), the IIR was rapidly reduced by the algo-rithm, which was designed to avoid instability fromovercorrection.
In order to better understand the degree of glyce-mic control achieved, the histogram (Fig. 5) was cal-culated to stratify and compare capillary bloodglucose values from the six original protocol studiesand the 16 revised protocol studies. At the lowerend of the glucose range, results from the two algo-rithms were similar, but at the high range, there wassignificantly less severe hyperglycemia (
>
190 mg/dL) with the revised algorithm versus the originalalgorithm. All values used in this analysis weretaken after minute 90 in order to allow the closedloop control system adequate time to stabilize glu-cose values.
FIG. 4.
Mean data for sensor glucose, blood glucose, and insulin infusion rates in rats with ketosis-prone diabetes studied with therevised closed loop algorithm. Of the 18 such studies, two were omitted because oral carbohydrate was given by gavage (see text), sodata for 16 studies are shown.
Time (min)
0 30 60 90 120 150 180 210 240 270 300 330 360
Glu
cose
(m
g/dL
)
0
50
100
150
200
250
300
350
400
450
500
Insu
lin in
fusi
on r
ate
(IIR
, uni
ts/h
)
0.0
0.5
1.0
1.5
2.0
2.5Revised algorithmProspective calibration
= 16 n studies = Capillary blood glucose
= Calibrated sensor glucose = IIR
Mean + SEM
IIR
Glucose

136 W.K. WARD ET AL.
Artif Organs, Vol. 29, No. 2, 2005
Sensor accuracy
Of the 11 sensor arrays, one sensor experienced anearly electronic failure and no usable data could becollected. Other sensors ranged 1–11 weeks in termsof implant duration. Of the 29 closed loop studies intotal, 24 could be calibrated and of these, the averageimplant duration was 25
±
4 days. For these 24 stud-ies, there were 96 sensing unit data sets (four sensingunits per array). Of these 96 data sets, nine wereexcluded from further analysis for electronic reasons(telemetry problems, highly unstable signal, or elec-tronic failure of unknown cause). In the remaining87 sensing unit data sets the
Z
-score algorithm wasapplied (see above). Using this system, which tempo-rarily excludes signals in an array that do not agreewith the others, 32.45% of the data were excludedbecause of an elevated
Z
-score.Of the 29 total closed loop studies, open loop inter-
vention with glucose to avoid severe hypoglycemiawas given in seven. Of these seven, five were studiesthat could not be calibrated, that is, in arrays thatwere functioning suboptimally. Of the 24 studies inwhich calibration was successful, only two requiredhypoglycemic intervention. Thus, in sensors that per-formed well, severe hypoglycemia (below 50) wasvery unusual.
The data demonstrate that as the lag durationincreased, MARD also increased, and two examplesof this relationship are illustrated in Fig. 6. The upperpanel shows a closed loop study performed 7 daysafter implantation in which there was a short averagelag duration of 4 min. MARD was correspondinglylow, averaging 6%. The lower panel shows a study
performed in the same animal 49 days after implan-tation in which the lag was 11 min and the MARDwas higher at 17%. It is clear in the second examplethat although the sensor signal continued to track thechanges in capillary blood glucose, the prolonged lagled to increased error. Figure 7 shows the relation-ship between lag duration and MARD, using pro-spective calibration. A prolonged lag is stronglyassociated with an elevated MARD and the correla-tion between the two was highly significant (
r
=
0.72,Pearson Correlation significant,
P
£
0.0001,
n
=
24studies). The coefficient of determination (
r
2
) for thisrelationship was 0.52, suggesting that about half ofthe error as estimated by MARD can be attributedto the duration of the lag. As can be seen from thefigure, the typical lag duration was 3–8 min. Therewas a tendency for lag to be more prolonged in
FIG. 5.
Histogram comparing the original versus the revisedalgorithm in terms of ability to control capillary blood glucose.The revised algorithm was better at avoiding marked hypergly-cemia (over 190 mg/dL). There was also a suggestion of a trendtoward a greater percentage of glucose values in the tightlycontrolled range (71–130), with the revised algorithm.
0
20
40
60
80
< 71 71–130 131–190 >190
Original algorithm n = 6 studiesRevised algorithm n = 16 studies
%
Capillary blood glucose (m g/dL)
Mean + SEM
ns
ns
P = 0.042
ns
FIG. 6.
Using two examples, this figure illustrates the effect of aprolonged lag duration between blood glucose and sensor glu-cose. In the upper panel, the short lag is associated with excel-lent glycemic control and minimal sensor error (low MARD andhigh Clarke Error Grid Analysis (EGA) percentage Region A). Inthe lower panel, although the sensor continues to track bloodglucose, the longer lag accounts for greater sensor error.
Time (min)
0 30 60 90 120 150 180 210 240 270 300 330 360
Glu
cose
(m
g/dL
)
50
100
150
200
250
300
350
400
450G14s6Implant duration = 49 daysLag = 11 minMARD = 17%EGA, Region A = 61% = Capillary blood glucose = Calculated sensor glucose
Time (min)
0 30 60 90 120 150 180 210 240 270 300 330 360
Glu
cose
(m
g/dL
)
50
100
150
200
250
300
350
400
450G14s6Implant duration = 7 daysLag = 4 minMARD = 6%EGA, Region A = 96% = Capillary blood glucose = Calculated sensor glucose
CLOSED LOOP DIABETES CONTROL IN RATS 137
Artif Organs, Vol. 29, No. 2, 2005
sensors that had been implanted for a long duration(not shown).
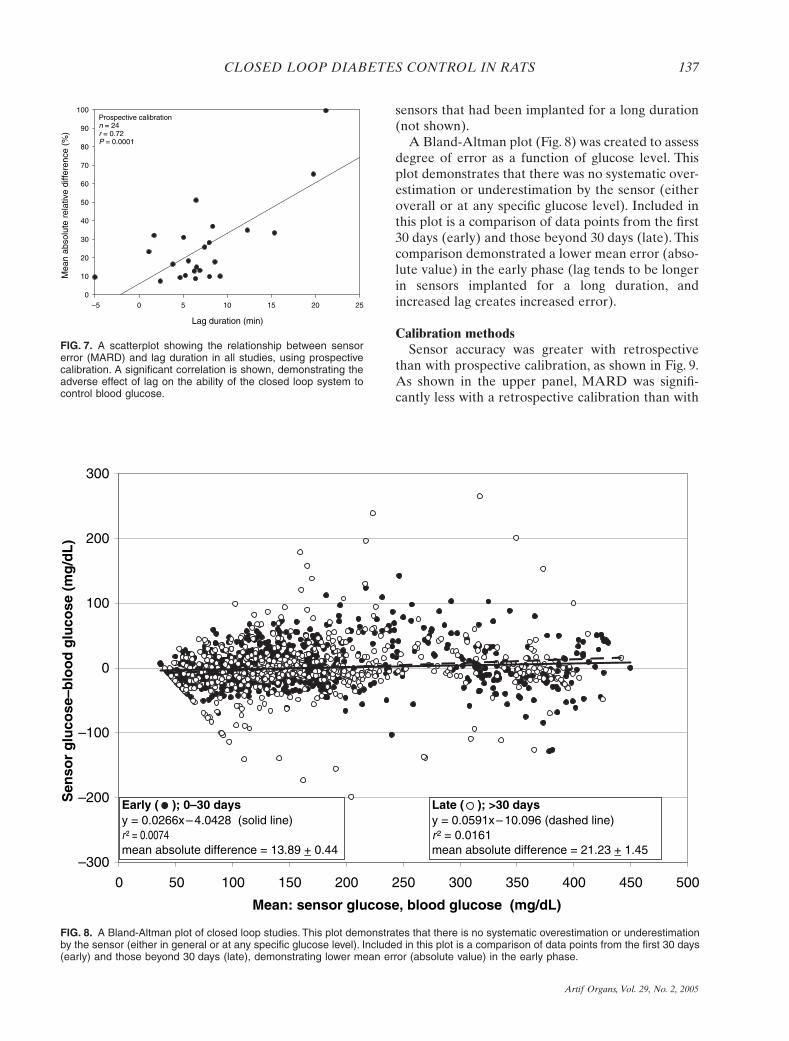
A Bland-Altman plot (Fig. 8) was created to assessdegree of error as a function of glucose level. Thisplot demonstrates that there was no systematic over-estimation or underestimation by the sensor (eitheroverall or at any specific glucose level). Included inthis plot is a comparison of data points from the first30 days (early) and those beyond 30 days (late). Thiscomparison demonstrated a lower mean error (abso-lute value) in the early phase (lag tends to be longerin sensors implanted for a long duration, andincreased lag creates increased error).
Calibration methods
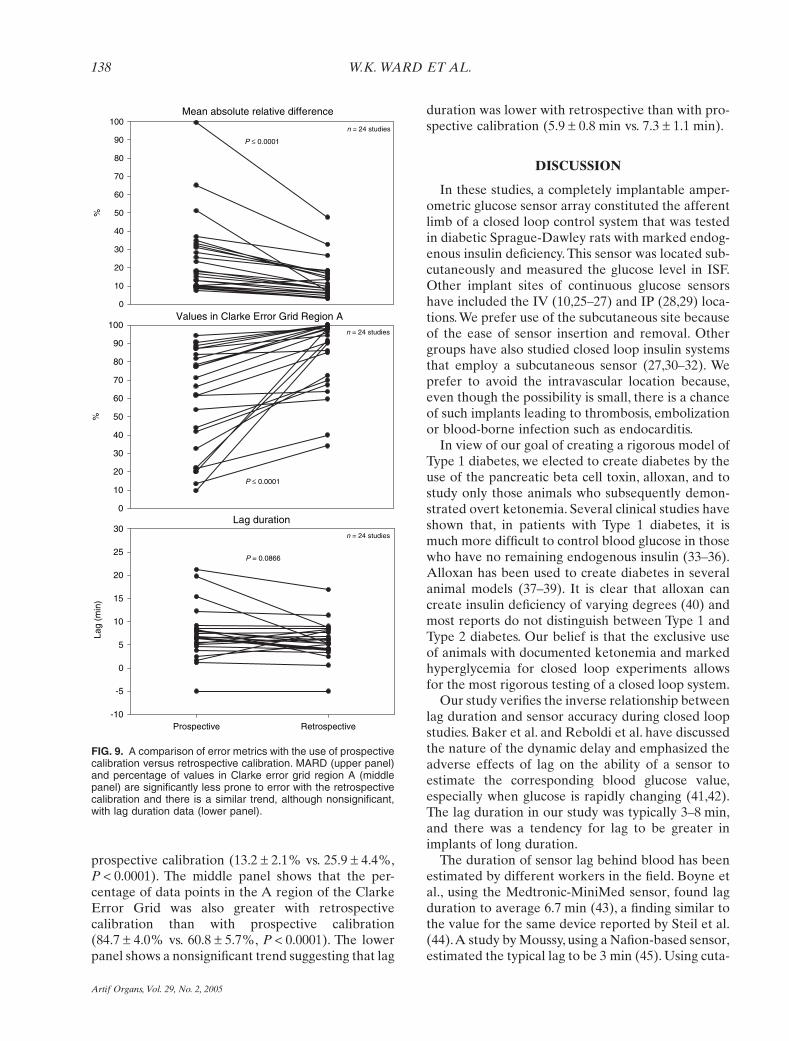
Sensor accuracy was greater with retrospectivethan with prospective calibration, as shown in Fig. 9.As shown in the upper panel, MARD was signifi-cantly less with a retrospective calibration than with
FIG. 7.
A scatterplot showing the relationship between sensorerror (MARD) and lag duration in all studies, using prospectivecalibration. A significant correlation is shown, demonstrating theadverse effect of lag on the ability of the closed loop system tocontrol blood glucose.
Lag duration (min)
–5 0 5 10 15 20 25
Mea
n ab
solu
te r
elat
ive
diffe
renc
e (%
)
0
10
20
30
40
50
60
70
80
90
100Prospective calibrationn = 24r = 0.72P = 0.0001
FIG. 8.
A Bland-Altman plot of closed loop studies. This plot demonstrates that there is no systematic overestimation or underestimationby the sensor (either in general or at any specific glucose level). Included in this plot is a comparison of data points from the first 30 days(early) and those beyond 30 days (late), demonstrating lower mean error (absolute value) in the early phase.
–300
–200
–100
0
100
200
300
0 50 100 150 200 250 300 350 400 450 500
Mean: sensor glucose, blood glucose (mg/dL)
Sen
sor
glu
cose
–blo
od
glu
cose
(m
g/d
L)
Early ( ); 0–30 daysy = 0.0266x – 4.0428 (solid line)r ² = 0.0074 mean absolute difference = 13.89 + 0.44
Late ( ); >30 daysy = 0.0591x – 10.096 (dashed line)r ² = 0.0161 mean absolute difference = 21.23 + 1.45
138 W.K. WARD ET AL.
Artif Organs, Vol. 29, No. 2, 2005
prospective calibration (13.2
±
2.1% vs. 25.9
±
4.4%,
P
<
0.0001). The middle panel shows that the per-centage of data points in the A region of the ClarkeError Grid was also greater with retrospectivecalibration than with prospective calibration(84.7
±
4.0% vs. 60.8
±
5.7%,
P
<
0.0001). The lowerpanel shows a nonsignificant trend suggesting that lag
duration was lower with retrospective than with pro-spective calibration (5.9
±
0.8 min vs. 7.3
±
1.1 min).
DISCUSSION
In these studies, a completely implantable amper-ometric glucose sensor array constituted the afferentlimb of a closed loop control system that was testedin diabetic Sprague-Dawley rats with marked endog-enous insulin deficiency. This sensor was located sub-cutaneously and measured the glucose level in ISF.Other implant sites of continuous glucose sensorshave included the IV (10,25–27) and IP (28,29) loca-tions. We prefer use of the subcutaneous site becauseof the ease of sensor insertion and removal. Othergroups have also studied closed loop insulin systemsthat employ a subcutaneous sensor (27,30–32). Weprefer to avoid the intravascular location because,even though the possibility is small, there is a chanceof such implants leading to thrombosis, embolizationor blood-borne infection such as endocarditis.
In view of our goal of creating a rigorous model ofType 1 diabetes, we elected to create diabetes by theuse of the pancreatic beta cell toxin, alloxan, and tostudy only those animals who subsequently demon-strated overt ketonemia. Several clinical studies haveshown that, in patients with Type 1 diabetes, it ismuch more difficult to control blood glucose in thosewho have no remaining endogenous insulin (33–36).Alloxan has been used to create diabetes in severalanimal models (37–39). It is clear that alloxan cancreate insulin deficiency of varying degrees (40) andmost reports do not distinguish between Type 1 andType 2 diabetes. Our belief is that the exclusive useof animals with documented ketonemia and markedhyperglycemia for closed loop experiments allowsfor the most rigorous testing of a closed loop system.
Our study verifies the inverse relationship betweenlag duration and sensor accuracy during closed loopstudies. Baker et al. and Reboldi et al. have discussedthe nature of the dynamic delay and emphasized theadverse effects of lag on the ability of a sensor toestimate the corresponding blood glucose value,especially when glucose is rapidly changing (41,42).The lag duration in our study was typically 3–8 min,and there was a tendency for lag to be greater inimplants of long duration.
The duration of sensor lag behind blood has beenestimated by different workers in the field. Boyne etal., using the Medtronic-MiniMed sensor, found lagduration to average 6.7 min (43), a finding similar tothe value for the same device reported by Steil et al.(44). A study by Moussy, using a Nafion-based sensor,estimated the typical lag to be 3 min (45). Using cuta-
FIG. 9.
A comparison of error metrics with the use of prospectivecalibration versus retrospective calibration. MARD (upper panel)and percentage of values in Clarke error grid region A (middlepanel) are significantly less prone to error with the retrospectivecalibration and there is a similar trend, although nonsignificant,with lag duration data (lower panel).
Mean absolute relative difference
%
0
10
20
30
40
50
60
70
80
90
100
P £ 0.0001
Values in Clarke Error Grid Region A
%
0
10
20
30
40
50
60
70
80
90
100
Lag duration
Prospective Retrospective
Lag
(min
)
-10
-5
0
5
10
15
20
25
30
P = 0.0866
P £ 0.0001
n = 24 studies
n = 24 studies
n = 24 studies
CLOSED LOOP DIABETES CONTROL IN RATS 139
Artif Organs, Vol. 29, No. 2, 2005
neous reverse iontophoresis, Kulcu et al. found a totallag of 17.2 min, but calculated that 13.5 min of thislag could be accounted for by instrumental lag, leav-ing a 4-min physiological lag (46). Wientjes et al.addressed this issue by experiments using a subcuta-neous microdialysis system. After correction for themicrodialysis system time lag, they found essentiallyno time lag between the tissue (dialysate) glucoseconcentration and capillary blood glucose concentra-tion, suggesting that the physiological lag is essentiallynil (47). This concept is supported by the findings ofThome-Duret and colleagues who found that duringstates of high insulin effect (e.g., declining glucoseinduced by insulin) the change in interstitial glucosecan actually
precede
changes in blood glucose (48).Taking our findings together with those of others,
it is likely that the delay between tissue and blood isvery short, not more than a few minutes. The lag inour chronic implants is almost certainly because oftwo factors: (i) the time that it takes for the analytes(glucose and hydrogen peroxide) to move throughthe sensor membranes to the platinum electrode, and(ii) biological fouling by proteinaceous and fibroticmaterial on the sensor surface, as studied bySharkawy et al. (49–51), our group (52), and others.Fibrous encapsulation would account for the ten-dency for lag to be more prolonged during long-duration implants. Consistent with concepts fromthese studies, we found that there was a tendency forlag duration to increase as time advanced (Fig. 6).Given the finding that prolonged lag has a majordetrimental effect on sensor accuracy and closedloop control, more studies are needed to exploremethods of avoiding the deposition of biologicalmaterial, or its effects, on the sensor surface.
The issue of efferent lag (i.e., delay between insulinadministration and its effect) is also important. In thesituation of intravenously administered insulin, thereis a minimal efferent lag, even if it is administeredsystemically (as in our study) rather than portally.LeBlanc et al. compared the effect of IV insulin toIP insulin in a closed loop system. They found thatthe prolonged efferent lag with IP insulin led tohigher postprandial glucose levels as compared to IVinsulin. Thus, they found that the benefit of IV insu-lin’s rapid action outweighed the potential liability ofits systemic route of delivery (26).
For these experiments, we utilized a nonlinear,multiplicative, proportional-derivative algorithmmodified by an exponential gain scheduling factor.In studies performed with the initial protocol, ani-mals experienced frequent hyperglycemia. Animalswere then studied using a revised protocol in whichthe gain schedule was changed to respond more
slowly to changes during ascending glucose (in orderto avoid subsequent glycemic swings) and in whichthe glucose goal was slightly decreased. In theserevised protocol studies, hyperglycemia was signifi-cantly minimized and there was a tendency for theanimals to be more often in the tight glycemic range(71–130 mg/dL).
Gain scheduling is a control method designed fornonlinear systems wherein controller parameters area function of an auxiliary variable other than theerror (53). In our case, the auxiliary variable was thederivative of the glucose versus time relationship. Weused an algorithm in which a gain schedule for thederivative exponents was created in order to respondquickly to changes in glucose. Specifically, the expo-nent during a negative glucose versus time slope waslarger than that used during a positive slope. Theconcept of gain scheduling has been successfully usedin industrial processes such as in water level control(54). In our study, glycemic control was good duringuse of the revised gain-scheduled algorithm. How-ever, because more than one change was made dur-ing revision of the algorithm, it is likely that the otherchange (reduction of the glucose set point) also con-tributed to the improvement in glycemic control.
A major problem in closed loop control is the fail-ure to respond quickly to changes in glucose, whichcontributes to large glycemic swings. In order to reactquickly to rising glucose we used a nonlinear algo-rithm in which the derivative of the glucose–timerelationship was raised to an exponent. In order toquickly reduce the IIR during declining glucose, weused a larger exponential factor for periods of timewhen the first derivative of the glucose–time curvewas negative. For the revised protocol, we changedthe derivative exponents to respond less markedly torising glycemia and lowered the glucose set point.There was clearly less hyperglycemia with the revisedalgorithm, suggesting that the changes improved gly-cemic control.
In this study, some of the animals required treat-ment with glucose to avoid serious hypoglycemia(below 50 mg/dL). However, the data revealed thatsuch open loop intervention was seen almost exclu-sively in sensor arrays whose accuracy was subopti-mal. In the 24 studies in which calibration wassuccessful (relatively drift-free studies, from a totalof 29 overall studies), only two required hypoglyce-mic intervention. This finding suggests that whenhypoglycemia was observed, it was a result of sensordrift rather than inappropriate function of the insulininfusion algorithm.
A number of methods have been proposed for arti-ficial closed loop control of glycemia, and have been
140 W.K. WARD ET AL.
Artif Organs, Vol. 29, No. 2, 2005
summarized by Parker et al. (55). Albisser and col-leagues developed and implemented a PID closedloop system (56–58) in which glucose was measuredin blood and insulin delivered into blood. Othershave also employed PID control systems (30,59–61),most recently the Medtronic-MiniMed group, whohas used PID control in animals and humans bothwith subcutaneous sensing and IV sensing systems(27). The Shichiri group in Japan has also used PIDcontrol successfully (29,60). Other investigators havesuggested the use of model predictive control systems(55,62,63), and neural net approaches (25,64,65).
Regular insulin was administered intravenously inthe present study. It is known that IV insulin has avery rapid onset and offset with a half life of approx-imately 5 min (66). IV insulin is widely used in thehospital setting during the treatment of markedhyperglycemia, ketoacidosis, and for peri-operativeglycemic control. In such settings, a closed loop sys-tem of glucose control might well be a feasiblemethod of tight control as shown in the recent clinicalstudy by Chee et al. (67). Recent studies have dem-onstrated that tight glycemic control in hospitalizedintensive care patients leads to a reduction in mor-tality (68) and that the degree of hyperglycemia andoutcome of stroke were correlated (69,70). Withregard to potential closed loop control in outpatients,we acknowledge that it would be inconvenient tochronically infuse insulin by the IV route. Moreresearch is needed on the use of the more convenientsubcutaneous route of insulin administration forclosed loop control. One simulation study suggestedthat good control will be more difficult to achievewith subcutaneous insulin (64).
Another issue with regard to insulin delivery is thequestion of whether portal insulin is superior to sys-temic insulin. Although the portal route is clearlymore physiologic, Steil and colleagues found thatportal insulin provided no added benefit over sys-temic insulin in controlling glucose during acuteglucose challenges (71). In contrast, Matsuo and col-leagues found that IP insulin as part of a closed loopsystem in dogs was superior to subcutaneous insulin,both in terms of reduced hyperglycemia and reducedhypoglycemia (29).
In our study, we used a two-point prospectivemethod of calibration. The method was designed tobe prospective because a continuous system used inreal time cannot use a calibration system that isexclusively retrospective. Nonetheless, in order tocalculate sensor accuracy, we also tested a retrospec-tive system wherein all blood glucose-sensor datapairs were used as calibration points and fit by linearleast-squares regression. The MARD data and error
grid analysis revealed that the retrospective systemwas superior to the prospective method. With regardto methods of calibration, Lodwig et al. have pointedout that any calibration method, when blood glucoseis used as the standard, depends on the relationshipbetween ISF and blood, and furthermore, this rela-tionship is incompletely understood (72). The cali-bration issue is complicated by the likelihood that acalibration performed during a state of high insulinmay perform differently than one performed duringa low insulin state. The study of Aussedat et al. (73)found that the ratio of interstitial glucose to bloodglucose is lower during high insulin states (when glu-cose is being rapidly “pulled” out of tissue into cells)than during low insulin states (when glucose is being“pushed” into tissue from blood). Taking our datatogether with prior studies, it is apparent that thereis still a great deal of work needed on the issue ofcalibration. The advantage of using retrospectivemethods to average a large number of data pairsover many hours is that transient interstitial-blooddisparities are minimized. It is clear that bettermethods of prospective calibration that minimizeinterstitial-blood differences are needed. Irrespec-tive of the specific method of calibration, it is best toavoid calibration when glucose is changing rapidly.We used such a restriction in this study because themore rapidly that glucose changes, the greater theerror induced by lag of sensor glucose behind bloodglucose.
We acknowledge that there are a number of com-peting technologies that also might be used toachieve closed loop control of diabetes. For example,the Pendra company has developed a small noninva-sive wrist-worn device (Pendragon, Pendragon Med-ical AG, Zurich, Switzerland) that uses the techniqueof impedance spectroscopy. In human subjects, thesignal correlated with the systemic glucose levelsalthough it has not yet been determined the identityof analyte(s) that the device actually measures (15).Another recent approach is extraction and measure-ment of glucose from small volumes of dermal ISFby the team at Spectrx (Norcross, GA, U.S.A.). Thisteam has shown that, in terms of glucose, there is avery short time delay between blood and ISF (17)and that glucose measured in the ISF correlatesclosely with glucose measured in blood. Finally, theresearch group at Cygnus (Redwood City, CA,U.S.A.) has shown that glucose can be extracted byapplication of a small current to the skin in a wrist-worn device, and that such glucose concentrations,measured extracorporeally, are indicative of bloodglucose concentrations (18,19,74). Any of the threepreceding approaches might be adaptable for closed
CLOSED LOOP DIABETES CONTROL IN RATS 141
Artif Organs, Vol. 29, No. 2, 2005
loop glycemic control to the extent that sensing accu-racy proves to be adequate.
In summary, we studied a chronic subcutaneousglucose sensor array as the afferent limb of a closedloop control system. We found that such a system,when used with a gain-scheduled control algorithm,was effective in controlling glycemia in rats withketosis-prone diabetes. The degree of lag betweenblood glucose and the sensor signal was generally 3–8 min but was sometimes longer after prolongedimplantation, which led to impairment of accuracy. Atwo-point prospective calibration method led to sat-isfactory sensor accuracy and closed loop control, buta retrospective method that used all data points wassuperior. Research efforts in the future shouldinclude: (i) better calibration methods, (ii) methodsof reducing chronic biological fouling and fibrosis ofthe implanted sensor (to minimize lag), and (iii) theuse of more convenient routes of insulin administra-tion (such as the subcutaneous route).
Acknowledgments:
We gratefully thank theAmerican Diabetes Association and the NIH(NIBIB, RO1-EB000743) for their financial support.We also thank the Legacy Research and Technologyand Center’s Comparative Medicine staff for theirassistance and Dr. Wayne Bequette for his helpfulreview of the data and algorithm. We thank Alex-ander Holland and David Johnson, PhD for theirengineering assistance.
REFERENCES
1. Diabetes Control and Complications Trial Research Group.The effect of intensive treatment of diabetes on the develop-ment and progression of long-term complications in insulin-dependent diabetes mellitus.
N Engl J Med
1993;329:977–86.2. Karter AJ, Ackerson LM, Darbinian JA, et al. Self-monitoring
of blood glucose levels and glycemic control: The NorthernCalifornia Kaiser Permanente Diabetes registry.
Am J Med
2001;111:1–9.3. Clark LC Jr, Duggan CA. Implanted electroenzymatic glucose
sensors.
Diabetes Care
1982;5:174–80.4. Shichiri M, Kawamori R, Yamasaki Y. Needle-type glucose
sensor.
Meth Enzymol
1988;137:326–34.5. Updike SJ, Shults MC, Gilligan BJ, Rhodes RK. A subcuta-
neous glucose sensor with improved longevity, dynamic range,and stability of calibration.
Diabetes Care
2000;23:208–14.6. Moussy F, Jakeway S, Harrison DJ, Rajotte RV. In vitro and
in vivo performance and lifetime of perfluorinated ionomer-coated glucose sensors after high-temperature curing.
AnalChem
1994;66:3882–8.7. Mastrototaro J. The MiniMed continuous glucose monitoring
system.
Diabetes Tech Ther
2000;2(Suppl 1):13–18.8. Bode B. Clinical utility of the continuous glucose monitoring
system.
Diabetes Tech Ther
2000;2(Suppl 1):35–42.9. Gough DA, Armour JC, Baker DA. Advances and prospects
in glucose assay technology.
Diabetologia
1997;40(Suppl2):S102–7.
10. Armour JC, Lucisano JY, McKean BD, Gough DA. Applica-tion of chronic intravascular blood glucose sensor in dogs.
Diabetes
1990;39:1519–26.11. Schmidtke DW, Heller A. Accuracy of the one-point in vivo
calibration of “wired” glucose oxidase electrodes implanted injugular veins of rats in periods of rapid rise and decline of theglucose concentration.
Anal Chem
1998;70:2149–55.12. Feldman B, Brazg R, Schwartz S, Weinstein R. A continuous
glucose sensor based on wired enzyme technology—Resultsfrom a 3-day trial in patients with type 1 diabetes.
DiabetesTechnol Ther
2003;5:769–79.13. Kapitza C, Lodwig V, Obermaier K, et al. Continuous glucose
monitoring: Reliable measurements for up to 4 days with theSCGM1 system.
Diabetes Technol Ther
2003;5:609–14.14. Maran A, Crepaldi C, Tiengo A, et al. Continuous subcutane-
ous glucose monitoring in diabetic patients: a multicenteranalysis.
Diabetes Care
2002;25:347–52.15. Caduff A, Hirt E, Feldman Y, Ali Z, Heinemann L. First
human experiments with a novel non-invasive, non-opticalcontinuous glucose monitoring system.
Biosens Bioelectron
2003;19:209–17.16. Arnold MA, Burmeister JJ, Small GW. Phantom glucose cal-
ibration models from simulated noninvasive human near-infrared spectra.
Anal Chem
1998;70:1773–81.17. Smith A, Yang D, Delcher H, Eppstein J, Williams D, Wilkes
S. Fluorescein kinetics in interstitial fluid harvested from dia-betic skin during fluorescein angiography: implications for glu-cose monitoring.
Diabetes Technol Ther
1999;1:21–7.18. Gandrud LM, Paguntalan HU, Van Wyhe MM, et al. Use of
the Cygnus GlucoWatch biographer at a diabetes camp.
Pedi-atrics
2004;113:108–11.19. Tamada JA, Garg S, Jovanovic L, Pitzer KR, Fermi S, Potts
RO. Noninvasive glucose monitoring: comprehensive clinicalresults.
Cygnus Res Team Jama
1999;282:1839–44.20. Ward WK, Wilgus ES, Troupe JE. Rapid detection of hyper-
glycaemia by a subcutaneously-implanted glucose sensor inthe rat.
Biosens Bioelectron
1994;9:423–8.21. Ward WK, Troupe JE. Assessment of a chronically-implanted
subcutaneous glucose sensor in the dog.
ASAIO J
1999;45:555–61.
22. Ward WK, Wood MD, Troupe JE. Rise in background currentover time in a subcutaneous glucose sensor in the rabbit:Relevance to calibration and accuracy.
Biosens Bioelectron
2000;15:53–61.23. Ward WK, Casey HM, Quinn MJ, Federiuk IF, Wood MD.
A fully-implantable subcutaneous glucose sensor array:enhanced accuracy from multiple sensing units and a median-based algorithm.
Diabetes Technol Ther
2003;5:943–52.24. Rousseeuw P. Robust estimation and identifying outliers. In:
Wadsworth HM, ed.
Statistical Methods for Engineers and Sci-entists.
New York, NY: McGraw-Hill, Inc., 1990.25. Dazzi D, Taddei F, Gavarini A, Uggeri E, Negro R, Pez-
zarossa a. The control of blood glucose in the critical diabeticpatient: a neuro-fuzzy method.
J Diabetes Complications
2001;15:80–7.26. LeBlanc H, Chauvet D, Lombrail P, Robert JJ. Glycemic
control with closed-loop intraperitoneal insulin in type I dia-betes.
Diabetes Care
1986;9:124–8.27. Steil G, Panteleon A, Rebrin K. Closed loop insulin deliv-
ery—The path to physiological insulin delivery.
AdvancedDrug Delivery Rev
2004;56:125–44.28. Clark LC Jr, Noyes LK, Spokane RB, Sudan R, Miller ML.
Long-term implantation of voltammetric oxidase/peroxideglucose sensors in the rat peritoneum.
Meth Enzymol
1988;137:68–89.
29. Matsuo Y, Shimoda S, Sakakida M, et al. Strict glycemic con-trol in diabetic dogs with closed-loop intraperitoneal insulininfusion algorithm designed for an artificial endocrine pan-creas.
J Artif Organs
2003;6:55–63.30. Rebrin K, Fischer U, von Woedtke T, Abel P, Brunstein E.
Automated feedback control of subcutaneous glucose concen-tration in diabetic dogs.
Diabetologia
1989;32:573–6.
142 W.K. WARD ET AL.
Artif Organs, Vol. 29, No. 2, 2005
31. Shichiri M, Kawamori R, Hakui N, Yamasaki Y, Abe H.Closed-loop glycemic control with a wearable artificial endo-crine pancreas. Variations in daily insulin requirements to gly-cemic response.
Diabetes
1984;33:1200–2.32. Shichiri M, Sakakida M, Nishida K, Shimoda S. Enhanced,
simplified glucose sensors: long-term clinical application ofwearable artificial endocrine pancreas.
Artif Organs
1998;22:32–42.
33. Fukuda M, Tanaka A, Tahara Y, et al. Correlation betweenminimal secretory capacity of pancreatic beta-cells and stabil-ity of diabetic control.
Diabetes
1988;37:81–8.34. Nakanishi K, Kobayashi T, Inoko H, Tsuji K, Murase T,
Kosaka K. Residual beta-cell function and HLA-A24 inIDDM. Markers of glycemic control and subsequent develop-ment of diabetic retinopathy.
Diabetes
1995;44:1334–9.35. Sjoberg S, Gjotterberg M, Berglund L, Moller E, Ostman J.
Residual C-peptide excretion is associated with a better long-term glycemic control and slower progress of retinopathy intype I (insulin-dependent) diabetes mellitus.
J Diabet Compli-cations
1991;5:18–22.36. Zanone MM, Catalfamo E, Pietropaolo SL, et al. Glutamic
acid decarboxylase and ICA512/IA-2 autoantibodies as dis-ease markers and relationship to residual beta-cell functionand glycemic control in young type 1 diabetic patients.
Metab-olism
2003;52:25–9.37. Gorray KC, Fujimoto WY. In vitro toxicity of alloxan for
guinea pig B cells: comparison with rat B cells.
Proc Soc ExpBiol Med
1983;173:606–12.38. Wigness BD, Mauer SM, Rupp WM, et al. A double balloon
catheter technique for alloxan diabetogenesis in the dog.
SurgGynecol Obstet
1982;155:860–4.39. Wilson GL, Patton NJ, McCord JM, Mullins DW, Mossman
BT. Mechanisms of streptozotocin- and alloxan-induced dam-age in rat B cells.
Diabetologia
1984;27:587–91.40. Reaven GM, Sageman WS, Swenson RS. Development of
insulin resistance in normal dogs following alloxan-inducedinsulin deficiency.
Diabetologia
1977;13:459–62.41. Baker DA, Gough DA. Dynamic delay and maximal dynamic
error in continuous biosensors.
Anal Chem
1996;68:1292–7.42. Reboldi GP, Home PD, Calabrese G, Fabietti PG, Brunetti P,
Massi Benedetti M. Time delay compensation for closed-loopinsulin delivery systems: a simulation study.
Int J Artif Organs
1991;14:350–8.43. Boyne MS, Silver DM, Kaplan J, Saudek CD. Timing of
changes in interstitial and venous blood glucose measuredwith a continuous subcutaneous glucose sensor.
Diabetes
2003;52:2790–4.44. Steil GM, Rebrin K, Mastrototaro J, Bernaba B, Saad MF.
Determination of plasma glucose during rapid glucose excur-sions with a subcutaneous glucose sensor.
Diabetes TechnolTher
2003;5:27–31.45. Moussy F, Harrison DJ, O’Brien DW, Rajotte RV. Perfor-
mance of subcutaneously implanted needle-type glucosesensors employing a novel trilayer coating.
Anal Chem
1993;65:2072–7.46. Kulcu E, Tamada JA, Reach G, Potts RO, Lesho MJ. Physio-
logical differences between interstitial glucose and bloodglucose measured in human subjects.
Diabetes Care
2003;26:2405–9.
47. Wientjes KJ, Schoonen AJ. Determination of time delaybetween blood and interstitial adipose tissue glucose concen-tration change by microdialysis in healthy volunteers.
Int JArtif Organs
2001;24:884–9.48. Thome-Duret V, Reach G, Gangnerau MN, et al. Use of a
subcutaneous glucose sensor to detect decreases in glucoseconcentration prior to observation in blood.
Anal Chem
1996;68:3822–6.49. Sharkawy AA, Klitzman B, Truskey GA, Reichert WM.
Engineering the tissue which encapsulates subcutaneousimplants. I. Diffusion properties. J Biomed Mater Res1997;37:401–12.
50. Sharkawy AA, Klitzman B, Truskey GA, Reichert WM. Engi-neering the tissue which encapsulates subcutaneous implants.II. Plasma-tissue exchange properties. J Biomed Mater Res1998;40:586–97.
51. Sharkawy AA, Klitzman B, Truskey GA, Reichert WM. Engi-neering the tissue which encapsulates subcutaneous implants.III. Effective tissue response times. J Biomed Mater Res1998;40:598–605.
52. Ward WK, Slobodzian EP, Tiekotter KL, MLW. The effect ofmicrogeometry, implant thickness and polyurethane chemistryon the foreign body response to subcutaneous implants. Bio-materials 2002;23:4185–92.
53. Bequette B. Practical approaches to nonlinear control: areview of process applications. In: Berber R, Kravaris C, ed.Nonlinear Model-Based Process Control, NATO ASI Series.Ser E 1998:353. Dordrecht: Kluwer, 1998;3–32.
54. Wang M, Crusca F. Design and implementation of a gainscheduling controller for a water level control system. ISATrans 2002;41:323–31.
55. Parker RS, Doyle FJ 3rd, Peppas NA. A model-based algo-rithm for blood glucose control in type I diabetic patients.IEEE Trans Biomed Eng 1999;46:148–57.
56. Botz CK, Marliss EB, Albisser AM. Blood glucose regulationusing closed- and open-loop insulin delivery systems. II.Peripheral primed square wave infusions. Diabetologia1979;17:45–9.
57. Marliss EB, Murray FT, Stokes EF, et al. Normalization ofglycemia in diabetics during meals with insulin and glucagondelivery by the artificial pancreas. Diabetes 1977;26:663–72.
58. Albisser AM. Intelligent instrumentation in diabetic manage-ment. Crit Rev Biomed Eng 1989;17:1–24.
59. Goriya Y, Kawamori R, Shichiri M, Abe H. The developmentof an artificial beta cell system and its validation in depancre-atized dogs: the physiological restoration of blood glucosehomeostasis. Med Prog Technol 1979;6:99–108.
60. Shimoda S, Nishida K, Sakakida M, et al. Closed-loop subcu-taneous insulin infusion algorithm with a short-acting insulinanalog for long-term clinical application of a wearable artifi-cial endocrine pancreas. Front Med Biol Eng 1997; 8:197–211.
61. Kerner W, Thum C, Tamas G, Beischer W, Clemens AH,Pfeiffer EF. Attempts at perfect normalization of glucose tol-erance test of severe diabetics by artificial beta cell. HormMetab Res 1976;8:256–61.
62. Pacini G, Bergman RN. PACBERG: An adaptive program forcontrolling the blood sugar. Comput Programs Biomed 1983;16:13–20.
63. Kan S, Onodera H, Furutani E, et al. Novel control system forblood glucose using a model predictive method. Asaio J2000;46:657–62.
64. Trajanoski Z, Wach P. Neural predictive controller for insulindelivery using the subcutaneous route. IEEE Trans BiomedEng 1998;45:1122–34.
65. Gogou G, Maglaveras N, Ambrosiadou BV, Goulis D, PappasC. A neural network approach in diabetes management byinsulin administration. J Med Syst 2001;25:119–31.
66. Meguid MM, Aun F, Soeldner JS. Albertson DA, Boyden CM.Insulin half-life in man after trauma. Surgery 1981; 89:650–3.
67. Chee F, Fernando T, van Heerden PV. Closed-loop glucosecontrol in critically ill patients using continuous glucose mon-itoring system (CGMS) in real time. IEEE Trans Inf TechnolBiomed 2003;7:43–53.
68. van den Berghe G, Wouters P, Weekers F, et al. Intensiveinsulin therapy in the critically ill patients. N Engl J Med2001;345:1359–67.
69. Capes SE, Hunt D, Malmberg K, Pathak P, Gerstein HC.Stress hyperglycemia and prognosis of stroke in nondiabeticand diabetic patients: a systematic overview. Stroke 2001;32:2426–32.
70. Williams LS, Rotich J, Qi R, et al. Effects of admission hyper-glycemia on mortality and costs in acute ischemic stroke. Neu-rology 2002;59:67–71.
CLOSED LOOP DIABETES CONTROL IN RATS 143
Artif Organs, Vol. 29, No. 2, 2005
71. Steil GM, Rebrin K, Mittelman SD, Bergman RN. Role ofportal insulin delivery in the disappearance of intravenousglucose and assessment of insulin sensitivity. Diabetes 1998;47:714–20.
72. Lodwig V, Heinemann L. Continuous glucose monitoringwith glucose sensors: calibration and assessment criteria. Dia-betes Technol Ther 2003;5:572–86.
73. Aussedat B, Dupire-Angel M, Gifford R, Klein JC, WilsonGS, Reach G. Interstitial glucose concentration and glycemia:
implications for continuous subcutaneous glucose monitoring.Am J Physiol Endocrinol Metab 2000;278:E716–28.
74. The DirectNet Study Group. The accuracy of the GlucoWatchG2 biographer in children with type 1 diabetes: results of thediabetes research in children network (DirecNet) accuracystudy. Diabetes Technol Ther 2003;5:791–800.

![Glycemic Control-Subcutaneous Regimen Adjustment [1758] · Page 3 of 18 GLYCEMIC CONTROL SUBCUTANEOUS REGIMEN ADJUSTMENT [1758] (11/23/15) PATIENT INFORMATION [ ] Insulin …](https://img.pdfslide.us/doc/110x75/5b5e10097f8b9a415d8bb3a2/glycemic-control-subcutaneous-regimen-adjustment-1758-page-3-of-18-glycemic.jpg)


![Nutritional Ketosis Condition and Specific Ketogenic Diet ... · Ketosis can be induced when a ketogenic diet is followed for more than 3 days. This induced nutritional ketosis [23]](https://img.pdfslide.us/doc/110x75/5fc6fb73d71b24630f77a027/nutritional-ketosis-condition-and-specific-ketogenic-diet-ketosis-can-be-induced.jpg)