Embed Size (px)
Citation preview

AN HISTORICAL OVERVIEW OF THE GEODUCK COMMERCIAL FISHERY
IN SOUTHEAST ALASKA, 1973 - 1997
by
Scott Walker
Regional Information Report No.1 1J00-35
Alaska Department of Fish and Game Division of Commercial Fisheries
Juneau, Alaska
November, 2000
1 The Regional Information Report Series was established in 1987 to provide an information access system for all
unpublished divisional reports. These reports frequently serve diverse ad hoc informational purposes or archive basic uninterpreted data. To accommodate timely reporting of recently collected information, reports in this series undergo only limited internal review and may contain preliminary data; this information may be subsequently finalized and published in the formal literature. Consequently, these reports should not be cited without prior approval of the author or the Division of Commercial Fisheries.
2
AUTHOR Scott Walker is an assistant area management biologist for the Alaska Department of Fish and Game, Division of Commercial Fisheries, 2030 Sea Level Drive #205, Ketchikan, Alaska, 99901.
ACKNOWLEDGMENTS Recognition must be given to Don House and Robert Larson for their assistance and help with data collection and analytical support. Special thanks goes to Cori Cashen for the fantastic maps. Thanks to Chris Allison for all her PSP data and Kim Vicchy, Leslie Wood, and Rose Walker for their help in editing. Thanks to Marc Pritchett and Doug Woodby for their great editing job and support.

3
TABLE OF CONTENTS Page
AUTHOR .................................................................................................................................................... 2 ACKNOWLEDGMENTS........................................................................................................................... 2 INTRODUCTION....................................................................................................................................... 5 LIFE HISTORY: A BRIEF SUMMARY ................................................................................................... 5 COMMERCIAL HARVEST IN SOUTHEAST ALASKA........................................................................ 6
1985-86 Season ....................................................................................................................................... 7 1986-87 Season ....................................................................................................................................... 8 1987-88 Season ....................................................................................................................................... 8 1988-89 Season ....................................................................................................................................... 8 1989-90 Season ....................................................................................................................................... 8 1990-91 Season ....................................................................................................................................... 9 1991-92 Season ....................................................................................................................................... 9 1992-93 Season ....................................................................................................................................... 9 1993-94 Season ..................................................................................................................................... 10 1994-95 Season ..................................................................................................................................... 10 1995-96 Season ..................................................................................................................................... 11 1996-97 Season ..................................................................................................................................... 11
METHOD OF COMMERCIAL HARVEST ............................................................................................ 12 METHOD OF PROCESSING .................................................................................................................. 13
Paralytic Shellfish Poisoning ................................................................................................................ 14 DEC Requirements................................................................................................................................ 14 Laboratory Procedure For PSP Testing ................................................................................................ 16 Amnesiac Shellfish Poisoning............................................................................................................... 16 Commercial Harvest Historical PSP Results ........................................................................................ 17 Geoduck Test Fisheries ......................................................................................................................... 17 DEC PSP Contamination Study ............................................................................................................ 18
GEODUCK AGE DATA .......................................................................................................................... 18 DIVE SURVEYS AND GEODUCK SAMPLING, 1977 - 1989 ............................................................. 19
1977................................................................................................................................................... 19 1978................................................................................................................................................... 19 1979................................................................................................................................................... 19 1980................................................................................................................................................... 20 1981................................................................................................................................................... 20 1982................................................................................................................................................... 21 1984................................................................................................................................................... 21 1989................................................................................................................................................... 21
WEIGHT AND LENGTHS ...................................................................................................................... 22 DISCUSSION ........................................................................................................................................... 22 CONCLUSION ......................................................................................................................................... 23 LITERATURE CITED.............................................................................................................................. 24
4
LIST OF TABLES Page
Table 1. Harvest by season for the Southeast Alaska commercial geoduck fishery, 1979-1997. .........25 Table 2. Number of divers in the Southeast Alaska commercial geoduck fishery by residents
vs. non-residents, 1983-1996...................................................................................................26 Table 3. Guideline harvest levels (GHLs) for the 1985-1997 Southeast Alaska commercial
geoduck fishery........................................................................................................................27 Table 4. Open and closing dates for the Southeast Alaska commercial geoduck fishery, 1985-
1997. ........................................................................................................................................28 Table 5. Number of divers by subdistrict in the Southeast Alaska commercial geoduck
fishery, 1979-1997...................................................................................................................29 Table 6. Average commercial geoduck fishery weights and lengths by area and historical
averages for the Southeast Alaska region as a whole, 1996....................................................30 Table 7. Southeast Alaska commercial geoduck fishery. Percent of PSP samples below 80
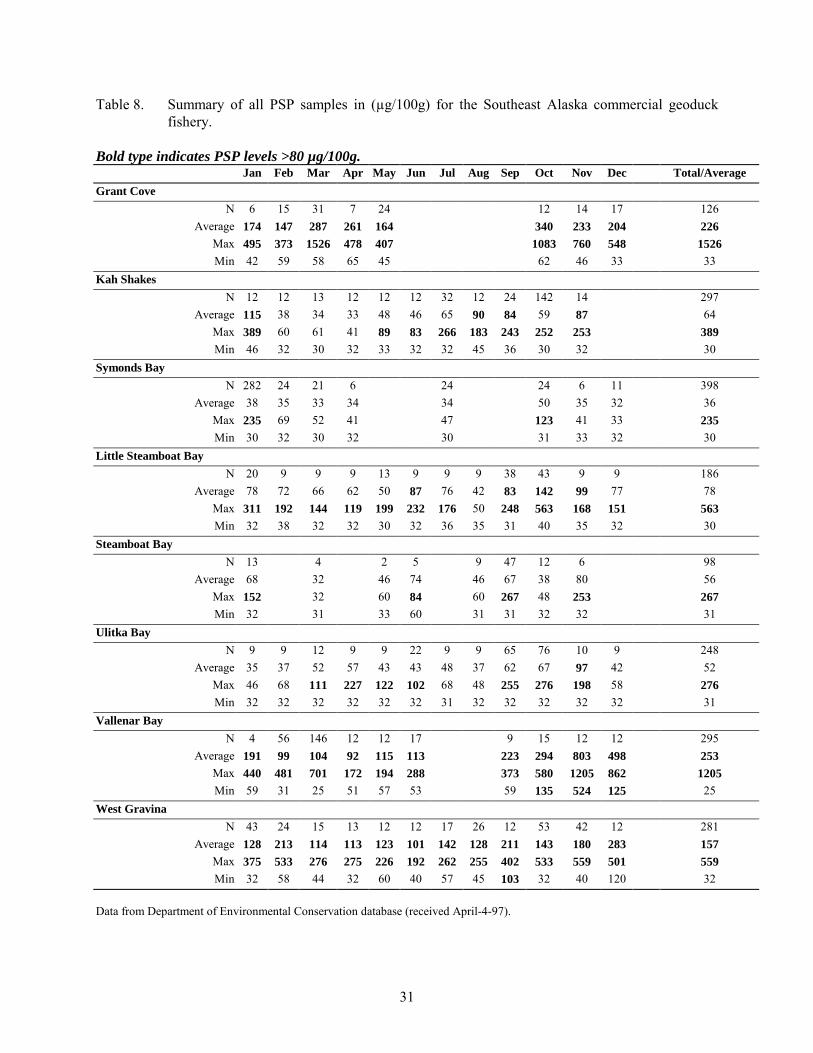
µg/100 g. 1982-1991................................................................................................................30 Table 8. Summary of all PSP samples in (µg/100g) for the Southeast Alaska commercial
geoduck fishery........................................................................................................................31 Table 9. PSP results for the 1996-1997 Southeast Alaska commercial geoduck fishery. .....................32 Table 10. PSP results for the 1995-1996 Southeast Alaska commercial geoduck fishery. .....................32 Table 11. Southeast Alaska geoduck test fishery 1995 PSP results. .......................................................33 Table 12. Southeast Alaska geoduck test fishery 1995-96 PSP survey results. ......................................33 Table 13. Southeast Alaska commercial geoduck fishery age data. ........................................................34 Table 14. Compilation of all geoduck weight and length information collected in Southeast
Alaska through December 1996. .............................................................................................35
LIST OF FIGURES Page
Figure 1. Southeast Alaska geoduck fishery harvest areas................................................................... 36 Figure 2. Southeast Alaska geoduck fishery at Symonds Bay. ............................................................ 37 Figure 3. Southeast Alaska geoduck fishery at Kah Shakes................................................................. 38 Figure 4. Southeast Alaska geoduck fishery at west Gravina Island.................................................... 39 Figure 5. Southeast Alaska geoduck fishery at Noyes Island............................................................... 40
5
INTRODUCTION This report summarizes the history of geoduck clam (Panopea abrupta) fishery management and research in Alaska from 1973 to 1997. One of the purposes in writing this report was to pull together facts and information from a variety of agency and unpublished reports into a single document for future reference. In addition, this report includes original analysis of data on paralytic shellfish poison (PSP).
LIFE HISTORY: A BRIEF SUMMARY The geoduck clam is the largest American bivalve, and one of the world’s largest burrowing clams, reaching a weight of more than 5.9 kg (13 pound) (Anderson, 1971). The name was derived from a Nisqually Indian phrase for dig deep as the clams can be more than 1.3 meters under the substrate (Ricketts et al. 1985). Geoduck clams range from Alaska to Baja California (Goodwin 1976). Life history information for geoducks is summarized here from research in Washington State and British Columbia. Geoducks spawn from March to July when both males and females synchronize gamete release. Most males first spawn at three years of age, and females first spawn at age four (Anderson 1971). Geoducks may reproduce annually for over 107 years (Sloan and Robinson 1984). The sex ratio of clams older than ten years has been shown to be 50:50 in some populations (Goodwin and Pease 1987). The larval clams drift in the water column until they settle to the bottom and begin burrowing into the substrate. The clams continue to burrow downwards as they grow, until reaching adult size (about 17 cm shell length) at about ten years of age (Anderson 1971; Harbo et al. 1983; Breen and Shields 1983). In fast growing areas, the clams average increase in shell length can be 30 mm per year during the first three to four years (Goodwin 1976). Geoducks attain sexual maturity in three or four years with a shell length of about 100 mm. Weights appear to increase over the first 50 years of life before leveling off (Breen and Sheilds, 1983). An average age of 40 with a top age of 140 was found at five British Columbia sites (Breen and Shield, 1983). In Puget Sound, average ages ranged from 28-57 years at several sites with a maximum age of 141 years (Shaul and Goodwin 1982). In British Columbia, a maximum age of 146 was found in a study of commercially harvested geoducks (Harbo and Adkins, 1983). Recent aging of Alaska clams showed a range of 11 to 89 years, with a median of 40 years (Hagen and Jaenicke 1997). Geoducks feed by filtering food particles from sea water with their gills. They have been found in waters as deep as 110 meters (Goodwin and Pease, 1989). The average freshly dug geoduck consists of 28.1% sand and water, 17.4% shell, 12.0% viscera, and 42.5% meat (Anderson, 1971) Mortality rates by predation are very high for geoduck eggs as they are released into the water column, settle out, and grow into juveniles that burrow into the sediment. Once the clam buries itself deeper than 60 cm (two years for fast growing clams) it is beyond the reach of virtually all predators except man (Goodwin and Pease, 1989).
6
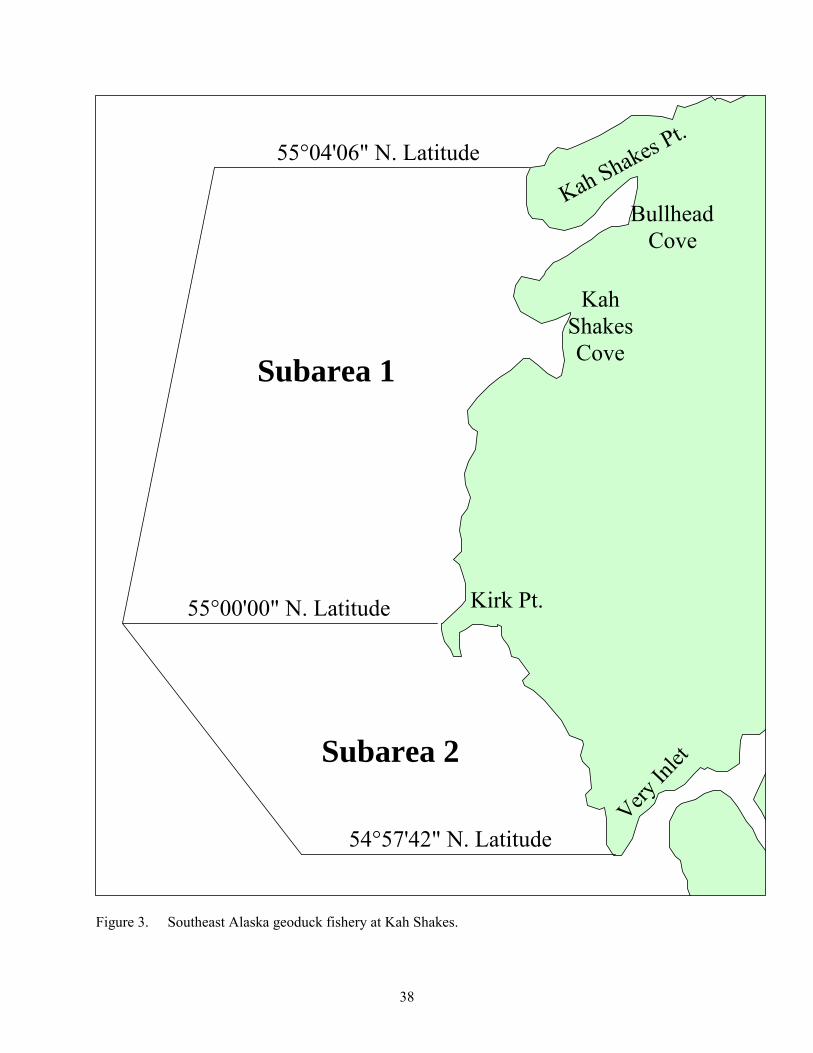
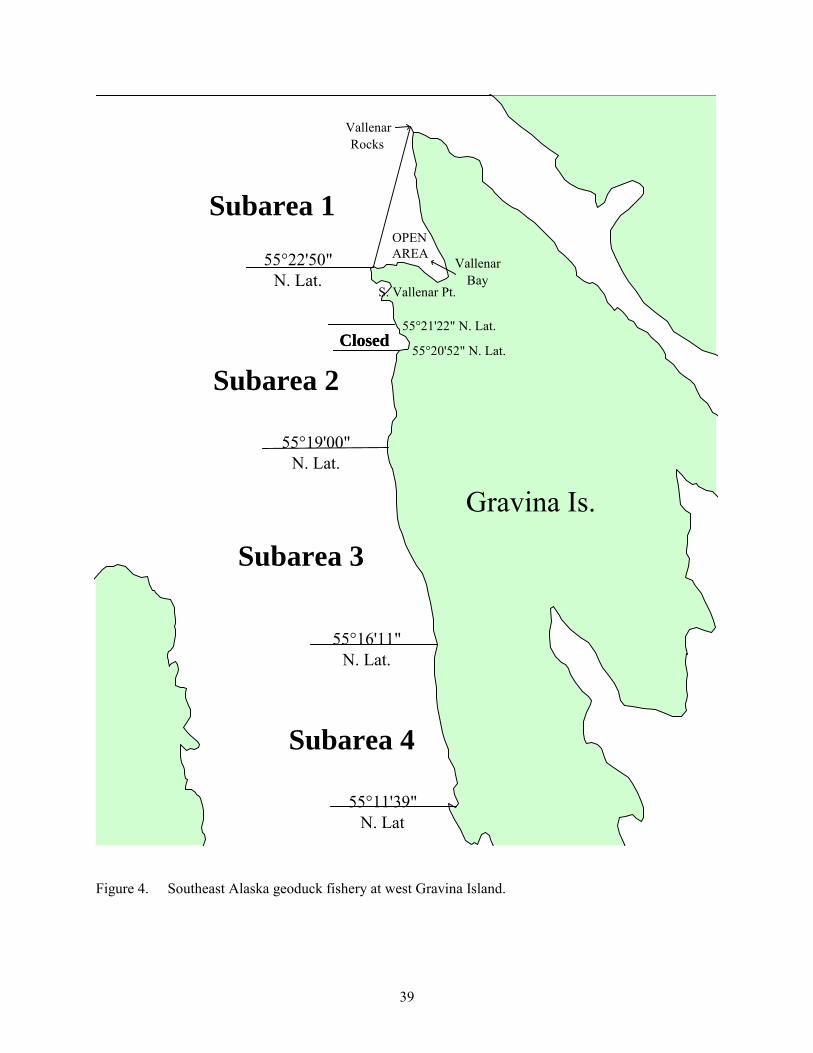
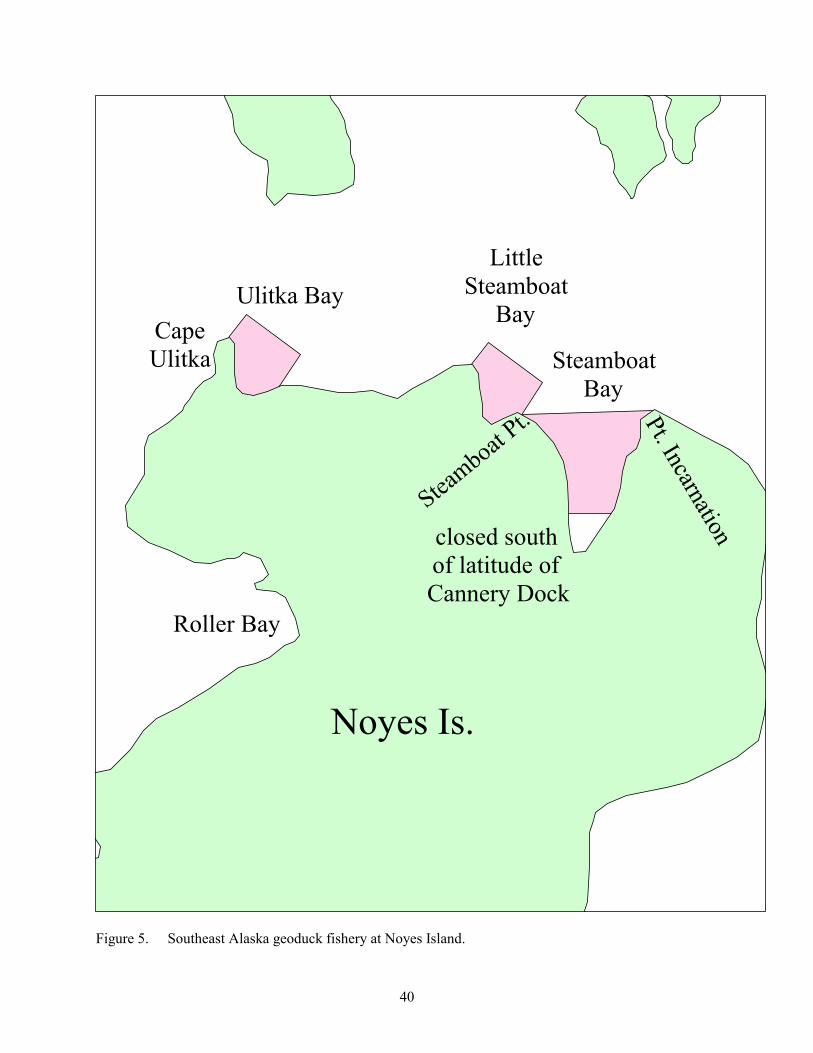
COMMERCIAL HARVEST IN SOUTHEAST ALASKA Commercial harvest of geoducks in Alaska began in 1973 when 1,200 pounds were harvested for bait. Interest resurfaced in 1977 when Washington State geoduck divers came to Alaska investigating the possibility for a new fishery. After extensive dive surveys the first commercial fishery opened in May 1983. The first large harvests occurred in the 1985-86 season when over 143,000 pounds were landed. From this point on, interest for a commercial harvest of geoducks broadened for both resident and non-resident divers (Tables 1 & 2). Since 1985, four major areas have been open to commercial geoduck harvest in Southeast Alaska (Figure 1). Symonds Bay on Biorka Island (Figure 2), Kah Shakes with two sub areas (Figure 3), the west coast of Gravina Island with four sub areas (Figure 4), and the northern shore of Noyes Island with three sub areas (Figure 5). Since the beginnings of the Southeast Alaska commercial harvest, product has been rated as a very high quality meat, based on its color. Alaska geoduck meat tends to be a creamy white color compared to areas in Washington State and British Columbia where the meat is darker or gray. Development of a management plan for the northern shores of Noyes Island began in May of 1983 and permits for commercial geoduck harvesting were first issued in 1985. The total Guideline Harvest Level (GHL) was 300,000 pounds. This GHL total is broken down as: Cape Ulitka Bay (75,000 pounds), Little Steamboat Bay (43,000 pounds), and Big Steamboat Bay (183,000 pounds) (Figure 5, Table 3). The department established a two percent exploitation rate for the commercial harvest on Noyes Island over a five-year period. After the five-year harvest period the department planned a five-year closure. The harvest occurred under a management plan based on population estimates and was designed to control the development of the fishery as well as prevent the depletion of the resource. The large quota was established to encourage processor involvement. Harvest was slow during the first few years due to poor market conditions and the high cost of operation so far from local processors in Ketchikan. During the first years of the fishery, harvest began on October 1, continued daily, and often lasted until late spring. The department opened all three areas at Noyes Island each year from 1985 until October 1, 1989 when a two-year rotation was established. The first-year rotation had a GHL of 64,000 pounds at Steamboat Bay (Table 3). The second-year rotation had a combined GHL of 41,000 pounds, with 26,000 at Ulitka Bay and 15,000 pounds at Little Steamboat Bay (Table 3). Gravina Island (Figure 4) opened in 1988 with a GHL of 100,000 to 125,000 pounds (Table 3). This new area is only a few miles from Ketchikan, hence, product was made available to local fishers without the transportation problem encountered on Noyes Island. PSP testing in the area revealed that it had some of the highest levels of PSP in Southeast Alaska. Symonds Bay (Figure 2) opened in 1989 with a GHL of 10,000 pounds (Table 3), making product for the first time available to the Sitka Divers. This area was found to have low PSP levels, allowing the product to be shipped out live. During the 1991 season, Kah Shakes (Figure 3) opened with a GHL of 20,000 pounds (Table 3).

7
From 1990 on, effort levels increased, due to increased demand, which in turn quickened the pace of the fishery. Due to increasing effort levels of the early 1990s, major changes in geoduck management were adopted by the Alaska Board of Fish and Game and were instituted during the 1995-96 season. During the 1995-96 season, Gravina Island closed after three days of derby style fishing and the entire season closed after 106 divers fished ten days (Table 2). Participants during the first years of the geoduck fishery were primarily residents of Alaska (Table 2). Beginning in 1991, non-resident participants began to outnumber residents. One reason for this was that the Washington State geoduck fishery was a tract-leasing program which was difficult and expensive for the average diver to participate in. Washington State divers came to Alaska to continue open access fishing for geoducks. During the early 1990s non-residents had an "edge” over the residents because of their greater experience. Resident interest and skill has risen, with a corresponding increase of resident participation starting in 1996 (Table 2). As world markets and value have increased, divers and processors have focused on shipping live geoducks out of Alaska. Symonds Bay near Sitka has been the only area where PSP levels have been consistently low enough for live shipment. Kah Shakes has had a small amount shipped live, but not on a consistent basis. Geoduck prices rose from $0.10/pound in the early years of the fishery, to $0.50/pound in 1990. Average price for product harvested in Symonds Bay in January of 1996 was $4.00/pound for live clams. Prices in British Columbia and Washington State have increased dramatically in the last few years, with prices for live geoducks ranging upwards to $20.00/pound as compared with $2.00 to $3.00/pound in the past. Alaska fishers will most likely not receive “down south” prices due to high shipping costs, including the cost of sending samples from remote locations to the PSP testing lab in Palmer, but there is a tremendous financial incentive to promote live shipping of Alaska geoducks. Several companies have been active in the Southeast Alaska geoduck fishery throughout the history of the fishery. During the 1996-97 fishery, the following six processors purchased product in Southeast Alaska:
● Norquest Seafoods - Ketchikan and Craig (Previously Silver Lining Seafoods). ● E. C. Phillips and Sons - Ketchikan, Craig Fisheries in Craig. ● Evergreen Seafoods - Ketchikan. ● Seafood Producers Co-op (SPC) - Sitka. ● T and L Specialty Meats for United Seafoods - Sitka.
Several other Ketchikan area processors have played a part in past fisheries: Fisherman’s Quay, Pac Alaska, Big Harbor Seafoods, United Seafoods and Sea World.
1985-86 Season The 1985-86 season began on October 1, 1985 with 129,700 pounds harvested in Steamboat Bay, Little Steamboat Bay, and Cape Ulitka Bay (Figure 5). Harvest was small due to poor marketing conditions and the high cost of operating in the remote area (Table 1). The season closed by regulation (Table 4).
8
1986-87 Season Harvest dropped drastically during the 1986-87 season due to poor market conditions and to logistical and weather constraints (Table 1). The only harvest occurred in Steamboat Bay primarily because the other two areas on Noyes Island were more exposed to ocean swell in rough weather. This drop in harvest was again due to poor market conditions and the high cost of getting the geoducks to Ketchikan. Noyes Island is 110 miles from Ketchikan by sea and 20 miles from Craig. In Craig the product was trucked overland to Hollis and then ferried to Ketchikan. The season closed by regulation (Table 4).
1987-88 Season The 1987-88 season had a limited harvest. All three subareas of Noyes Island and Gravina Island opened together for the first time. Following a department population assessment of Gravina Island, the northwest shore opened on January 15, 1988. Subarea 1 of Gravina Island, (Figure 4) which included all of Vallenar Bay, was opened for harvest (Table 4). Each subarea on Gravina Island was managed using a 2% harvest rate. The Grant Cove area was closed indefinitely due to historic subsistence use. The Gravina Island GHL was taken in four months. Although the GHL was never taken at Noyes Island, it was extended another month to allow fishers to harvest the remaining GHL (Table 4). The majority of the harvest was taken from Steamboat Bay.
1988-89 Season The 1988-89 season opened on October 1 with a limited harvest occurring in subarea 2 on Gravina Island and in all of the three Noyes Island subareas. Only 28,600 pounds of the 64,000 pound GHL was harvested from Noyes Island when the fishery closed in June, 1989. The majority of the harvest occurred in Steamboat Bay (Table 4). Subarea 2 on Gravina Island reached its GHL in June (Table 4).
1989-90 Season The season began on October 1, 1989. Three areas were opened: subarea 3 on Gravina Island, Steamboat Bay on Noyes Island, and Symonds Bay.
9
Beginning October 1, Noyes Island was placed on a two-year rotation. Steamboat Bay had its own GHL and Cape Ulitka and Little Steamboat Bay combined had a separate GHL (Table 3). The department had planned to open the northern area at Kah Shakes, but had to cancel the fishery upon finding that it could not be opened for the harvest of clams until the Department of Environmental Conservation (DEC) certified the water quality as acceptable. Symonds Bay closed in April and Gravina Island and Steamboat Bay closed in May (Table 4).
1990-91 Season The season began October 1, with subarea 4 open on Gravina Island, Little Steamboat Bay, Cape Ulitka Bay, and Symonds Bay. Effort concentrated on Gravina Island due to its proximity to the Ketchikan processors. Gravina Island closed after a month and a half of fishing (Table 4). Harvest at Kah Shakes opened on January 21, 1991 for the first time and closed in March (Table 4). During this first fishery, the southern subarea was open (Figure 3). Symonds Bay was the last to close on April 12 (Table 4).
1991-92 Season The 1991-92 commercial geoduck season began on October 1, 1991. Open areas were subarea 1 on Gravina Island, Steamboat Bay, the northern subarea at Kah Shakes, and Symonds Bay. Gravina Island closed in October with Noyes Island and Kah Shakes closing soon after (Table 4). Symonds Bay closed in April, 1992. Effort levels of non-residents increased, apparently due to increased demand for Southeast Alaska geoducks (Table 2).
1992-93 Season The 1992-93 commercial geoduck season began on October 1, 1992 and all areas closed by the end of October (Table 4). Open areas were subarea 2 on Gravina Island, Little Steamboat Bay and Cape Ulitka Bay, the southern subarea at Kah Shakes, and Symonds Bay. This was the first year all commercial harvest areas closed during the first month of the fishery. This was due to the increased effort, apparently a result of increased price for the landed product.
10
1993-94 Season The pace of the geoduck fisheries increased markedly this season with the fishery closing after 11 days of fishing (Table 4). The 1993-94 geoduck season began on October 1. Open areas were subarea 3 on Gravina Island, Steamboat Bay, the northern area at Kah Shakes, and Symonds Bay. Effort on Gravina Island doubled from the previous year and closed after three days (Table 4). The number of non-residents doubled from the 1992-93 season (Table 2) which increased the efficiency and experience of the dive fleet. The increased pace of the fisheries made clear that new management methods were needed to provide for orderly fisheries and to stay within harvest limits.
1994-95 Season The 1994-95 geoduck season was split into a fall season and a mid-winter season to monitor PSP levels during January and to evaluate the feasibility of marketing live clams. This was the first major management change since the inception of the fishery. The majority of the product, 140,000 pounds, was available during the fall season with 50,000 pounds left for the mid-winter season (Table 1). The opening date was moved to Monday, October 3, 1994 to ensure management occurred during the state workweek. Areas that were open were subarea 4 on Gravina Island (100,000 pounds), Cape Ulitka Bay (26,000 pounds), and the southern area of Kah Shakes (20,000 pounds). Gravina Island, Kah Shakes, and Cape Ulitka Bay all closed within three days (Table 4). In January of 1994, the Alaska Board of Fisheries (BOF) adopted new fishing regulations that prohibited the operation of dive fishing gear 14 days prior to and after a commercial opening for miscellaneous shellfish. Keeping the divers out of the water except for fishing times was instituted to stop poaching. Regulations were also instituted which prohibited more than one species of miscellaneous shellfish to be onboard a vessel registered to fish miscellaneous shellfish. Another new regulation allowed divers to register for only one miscellaneous shellfish fishery at a time. Prior to this regulation, divers could register for all the miscellaneous shellfish fisheries at once, making it unclear what fishery they would be participating in. The fishery re-opened on January 9, 1995 and was open from 9:00 a.m. until 3:00 p.m. daily. This was the first time daily fishing periods were used as a management tool for the geoduck fishery. Previously, harvest areas were open 24 hours each day. Open area included Gravina Island (24,000 pounds), Little Steamboat Bay (15,000 pounds), and Symonds Bay (10,000 pounds). All of the areas closed within ten days (Table 4).
11
1995-96 Season The new Board of Fisheries regulations, along with fishing daylight hours only, were the first major management changes since the inception of the fishery. The increased effort levels and decreased fishing hours were beginning to change the geoduck fishery into a derby-style fishery. Open areas were subarea 1 on Gravina Island, Steamboat Bay, and the northern area at Kah Shakes. Symonds Bay was left for a mid-winter fishery to encourage live sales of geoducks. The department felt that during the winter, PSP levels were much lower in the Sitka area. After the initial news release on September 1, 1995, opening the fishery on October 1, the department realized that with the increase in registrations, the fishery was going to be unmanageable. In response to the increased registrations, the department issued a second news release reducing fishing time. The fishing periods were changed to 7:00 a.m. until 1:00 p.m. daily starting on October 1, 1995. All tenders and processors were required to check in with the department each evening and report their landings. Daily catches could be tabulated to determine if closures were needed. All the areas closed by October 10, with Gravina Island closing after four days (Table 4). Symonds Bay opened on January 8, 1996. The fishery was opened on Monday and Tuesday of each week from 9:00 a.m. until 3:00 p.m. Divers were required to pre-register by 12:00 noon on Friday, January 5, 1996, so the department could determine effort levels. Symonds Bay closed after four days of fishing (Table 4).
1996-97 Season Due to the increased effort in the previous season, fishing time was decreased to just one day a week. The season began on October 7, 1996 and was open from 7:00 a.m. until 1:00 p.m. each Monday. Open areas were subarea 2 on Gravina Island, Little Steamboat Bay and Cape Ulitka Bay, and the southern area at Kah Shakes. Symonds Bay was left for a mid-winter fishery. After one week of fishing, the hours were changed to 9:00 a.m. to 3:00 p.m. to ensure the harvesting of geoducks was taking place only during daylight hours. Little Steamboat Bay closed after three days of fishing (Table 4). Kah Shakes and Gravina Island were closed after five days of fishing (Table 4). After three days of fishing, the open period in Ulitka Bay was expanded to Monday and Tuesday of each week. On November 4 Ulitka Bay was opened continuously, but increased effort led to a closure of the area on the following day (Table 4). The 96-97 season lasted eight days and 97 divers landed 203,017 pounds of geoducks. Symonds Bay was opened each Monday from 9:00 a.m. to 3:00 p.m. beginning January 13, and closed after four days of fishing (Table 4).
12
In July of 1996, Alaska House Bill 547 placed a four-year moratorium on all of Southeast Alaska’s dive fisheries. With this moratorium in place, 169 divers were eligible to participate in the Southeast Alaska dive geoduck fishery. The moratorium kept new entrants from participating in any of the Southeast Alaska dive fisheries. During the moratorium, the Commercial Fisheries Entry Commission (CFEC) was expected to determine the best method to promote an equitable fishery. After July 1, 1996, only divers that had qualified under the moratorium could apply and receive interim use permits to participate in the commercial geoduck fishery.
METHOD OF COMMERCIAL HARVEST As of this writing (January, 2000), prior to commercially harvesting geoducks, divers were required to complete the following requirements:
● Obtain a J11A CFEC interim use permit. The designation was changed in 1996 due to the dive fishery moratorium. Prior to this, interim use permits had the R23B designation.
● License their fishing vessel with CFEC. ● Acquire a processing permit from the Department of Environmental Conservation (DEC). ● Once all these permits are obtained, the harvester must register with the local Fish and Game
office, designating the area that they will fish in. Geoduck divers must register each year to fish in Southeast Alaska and can only register for one open harvest area. To change registration areas, a diver must turn in their registration form to the department before another one is issued. This regulation was established for precise management of the small GHLs. Geoduck divers can presently register for any of the dive fisheries at time of registration. Prior to the 1996-97 season, divers could register for one miscellaneous shellfish fishery at a time. This change was introduced to decrease the burden of registration. Prior to the 1996 season, the fishery was open seven days a week, and fishers were required to check in with the department each evening if they did not unload their catch onto a tender or processor. Check-in requirements were abandoned prior to the 1996-97 season when the fishery went to a one day a week fishery. Prior to the 1994 Board of Fisheries Meeting, divers had no limitations on pre-fishery prospecting in Southeast Alaska waters. After repeated violations of harvesting during closed periods, several restrictions were proposed to the Board of Fisheries. Regulations were imposed in 1994 that prohibited a registered and licensed fisher from diving 14 days prior to or after a commercial opening. The regulation was modified in 1996 by the Board of Fisheries and the following changes were made:
● No diving 14 days prior to your first commercial landing. ● No diving in closed periods in between openings. ● No diving 14 days after your last commercial landing.
Geoducks are harvested by divers using a hand held water jet to blast away the substrate around the clam. The water jet is attached to a water pump aboard the support vessel. Most divers use hookah gear where air is supplied through air compressors on the support vessel. The water jet on a common vessel is a short

13
2-4 foot pipe with a 5/8 inch diameter tip at the digging end, and a shut off valve at the other. Water pressure around 40 to 60 pounds per square inch is pumped to the nozzles. Geoducks are harvested individually. The clam is located by its neck extending out of the substrate, or by a dimple in the sand called a show. The nozzle of the jet is forced into the substrate, liquefying and removing substrate. The divers hand follows the nozzle into the substrate, grasping the clams neck or upper shell when it is free from the substrate. The rockier the area, the lower the harvest level. A sand and cobble bottom is preferred by divers. Once the clam is free from the substrate, it is placed into a divers collection bag. When a bag is full, it is lifted onto the dive vessel and placed into a tote. This is where the clam rests until being unloaded onto a tender of a processing plant or landed directly to a land-based processor. The visibility of geoduck siphons is quantified by the “show” factor, expressed as a percentage. Experienced divers say that there are five stages of show. These stages range from a tiny dimple in the sand to an extended siphon that is completely covered with algae and may be several inches above the ocean floor. Show detection can be one of the most important factors in commercial geoduck harvest. In the state of Washington, research has indicated that show detection can vary considerably. Research done in 1974 suggested that the detection of shows went from 5% in January to 59.8% in May (Goodwin, 1974). This suggests that geoducks were easier to observe in the spring and summer months.
METHOD OF PROCESSING All clams harvested or processed in Alaska must be landed and processed through a land-based processor. After the product is landed by fishers, three samples of each lot are sent to the DEC testing facility in Palmer, Alaska. Up to eight samples had been sampled per lot in the past. The definition of a lot has changed over the years. Originally, a lot was defined as one diver’s geoducks, harvested from one area, and landed at a processor or tender. In October of 1996, it was defined as one boat’s geoducks, harvested from one area. Clams that are used for bait for other commercial fisheries must be dyed yellow with FD&C type yellow #5 dye. The whole clam must be distinctively yellow in color and must be dyed at the harvest site. To process for human consumption, the clams are first dipped in hot water for three to five minutes to ease removal of the siphon skin. The clams are then removed from the shell, and the necks separated from the body meat and viscera. The clam necks and body meats are then frozen separately on freezer trays. Once frozen, the meats are dipped in a sugar and brine solution and packaged for re-sale. Product from Southeast Alaska is destined for Asian markets around the world.
14
Paralytic Shellfish Poisoning Paralytic Shellfish Poisoning (PSP) occurs when toxins from specific plankton accumulate in filter feeders. One of the common dinoflagellates in Southeast Alaska is Alexondrium sp. (Horner, 1996). Clams or other filter feeders filter out specific dinoflagellates from the water column and concentrate the toxins in the siphon and digestive system. The poisons that accumulate are highly toxic saxitoxins. Consuming clams with high PSP concentrations can cause injury or lead to death. Symptoms include tingling or burning sensation of the lips, gums, and tongue from which paralysis in the upper and lower limbs can follow. No known antidote is available, but artificial respiration has been used successfully in some cases (Gressner, 1996). All commercially harvested species that may contain high PSP levels cannot be shipped out of the state unless sampled by the DEC. Each individual diver’s harvest must be sold by lot, and three samples (each sample consisting of one geoduck) must be taken from each diver lot to be sampled. Each processor lot must also have one sample taken from it. The sample must be sent to the DEC testing laboratory in Palmer, Alaska. To send live product out of the state, both meat and viscera must test under the established level of 80 ug of toxin per 100 g of tissue. As of this writing no geoducks tested in Southeast Alaska have had meat tissue above accepted levels.
DEC Requirements Prior to 1978, there was no commercial harvest allowed for human consumption due to lack of certification. The Food and Drug Administration (FDA) required that an entire beach be certified prior to allowing commercial sales. Because of the variance in PSP levels, a certified beach would have to be constantly monitored. In 1978, a new plan was created for Southeast Alaska to do “lot sampling.” If the sample was not contaminated the entire lot was certified for human consumption. The department sanctioned studies in 1981 in an area that had a history of highly toxic clams. The study showed that the toxins concentrated mainly in the viscera with low levels in the edible portions (Robert Larson, ADF&G, Petersburg, personal communication). The DEC used the results of the PSP monitoring study to develop a processing procedure and sampling scheme that satisfied the federal government that a safe product could be produced (Robert Larson, ADF&G, Petersburg, personal communication). Presently, the DEC has regulatory authority to monitor all shellfish for interstate commerce through Alaska State Statute 17 and 44 and Alaska Administrative Code 18, Chapter 34. The DEC also regulates all shellfish growing areas. The DEC testing facility in Palmer, Alaska is certified by the FDA and has the authority to certify other testing facilities in Alaska. As of this writing the Palmer lab is the only facility in Alaska able to certify shellfish for interstate commerce.
15
Prior to any commercial harvest, the DEC must certify the water quality of beaches where commercial harvest will occur. First a beach sanitary survey is completed. For this survey, DEC looks for human habitation and for any streams that may be anadromous. Water samples are taken each day during 15 to 30 days of sampling. In remote areas, where no human habitation exists, sampling can occur in a much shorter time. Once taken, samples must arrive in Palmer, Alaska within 30 hours. Kah Shakes, which was certified in 1990, was done with five days of water sampling. Noyes Island was certified in 1982, Gravina Island in 1988, and Symonds Bay in 1989. Once a beach has been certified, sites must be resampled. Remote sites must be visited at least twice yearly to take 2-5 water samples. The second visit is made just prior to the commercial fishery. For non-remote areas, samples must be taken five times a year. Big Steamboat Bay is our only non-remote area. A 100 ml sample is taken from surface waters and is tested at the Palmer facility. Samplers look for fecal coliform bacteria where no more than 10% of the samples may be greater than 43 count per 100 ml (Mike Ostasz, Department of Environmental Conservation, Anchorage, Personal communication). Problems with water quality in commercially harvested beds are very minimal, although there was some concern with the cannery at Steamboat Bay. Water quality was initially a concern at Kah Shakes because of the spring sac roe herring fishery in this area. The Kah Shakes herring fishery occurs during the month of April. These concerns were alleviated once the short duration of the geoduck season became apparent. Before any kind of harvesting or processing can occur, permits must be obtained from DEC. Divers have the following requirements.
● Sample Tags - Tags must be tearproof and waterproof. Tags must be labeled and can be difficult to reproduced. At one time, the only printing facility was in New York state, although now they are available locally. These tags must accompany each lot from the time of harvest until shipped to its final destination.
● Logbooks - Each diver must have a hard bound production log. It must have date of harvest, date of sale, name, address, species, pounds, and any other useful information.
Each vessel involved in harvesting must be inspected by DEC. The vessel must have a sewage holding tank, clean and covered storage space, and have no animals onboard. All processors must get a processing permit from DEC. To obtain a permit there must be a plant inspection and detailed processing plans. Processing of animals must be kept separate from all other processing. All processing must take place at a land-based facility, and extreme care must be taken so that any tissue or viscera that could be contaminated are disposed of immediately. Once the product is landed, samples are sent to the DEC testing facility. A sample is defined as an entire geoduck. When the samples arrive in Palmer, they are put into a sampling schedule. Product that will be processed in a land-based processor in Alaska is put on a lower priority and only the meat (siphon and breast) are tested. If the product is anticipated to go live, it is put on top priority and only the visceral ball is tested. If the viscera are under the allotted PSP levels (80 µg/100 g), the product can be shipped and sold live, otherwise it must be processed in state. No product can leave the state live until written approval is given to the processor. Paperwork approving live shipment is faxed to the processor and is kept with the product throughout shipment. Live shipments are sometimes delayed due to the great distance that samples must travel from Southeast to Palmer.

16
If the viscera is above accepted levels, which is common in most areas, then the product is approved for processed shipping only. If the plant has planned to process all their product, they can begin processing immediately upon landing of product. They will hold the processed product until approval to ship out of Alaska (Mike Ostasz, Department of Environmental Conservation, Anchorage, Personal communication).
Laboratory Procedure For PSP Testing The sample method to determine PSP is called the mouse bioassay method. Once samples are in the laboratory, shellfish are shucked, and the meat (or viscera) is homogenized in a blender, acidified with HCL, and boiled for five minutes. The mixture is then established at a ph of 2 to 4. A portion of the liquid is taken from the mixture and injected into a live mouse. Up to six mice are used for each sample. Levels of toxin are calculated based on time until death. This standard was taken from the National Shellfish Sanitation Program (Mike Ostasz, Department of Environmental Conservation, Anchorage, Personal communication). Prior notice of sampling needs must be given to the testing facility to ensure that enough mice are available for testing. Currently, the Palmer Lab tests shellfish for State of Alaska authorized projects only.
Amnesiac Shellfish Poisoning Another concern with shellfish is Amnesiac Shellfish Poisoning (ASP). This is caused by a known neurotoxin called demoic acid. Although not common in geoducks, the potential risk is present. During the early years of the commercial geoduck fishery, geoducks were sampled for demoic acid but were found to have no traces of the toxin. The DEC has tested bivalves with trace amounts of demoic acid in the Sitka area, but has never tested any bivalves over 11 ppm throughout the state. The Alaska acceptable level is 20 ppm (Ron Grimm, Department of Environmental Conservation, Anchorage, personal communication). The acceptable level used in Canada is 200 ppm. Symptoms of ASP are usually intestinal distress, leading to breathing difficulties, memory loss, and ultimately death (FDA, 1996).
17
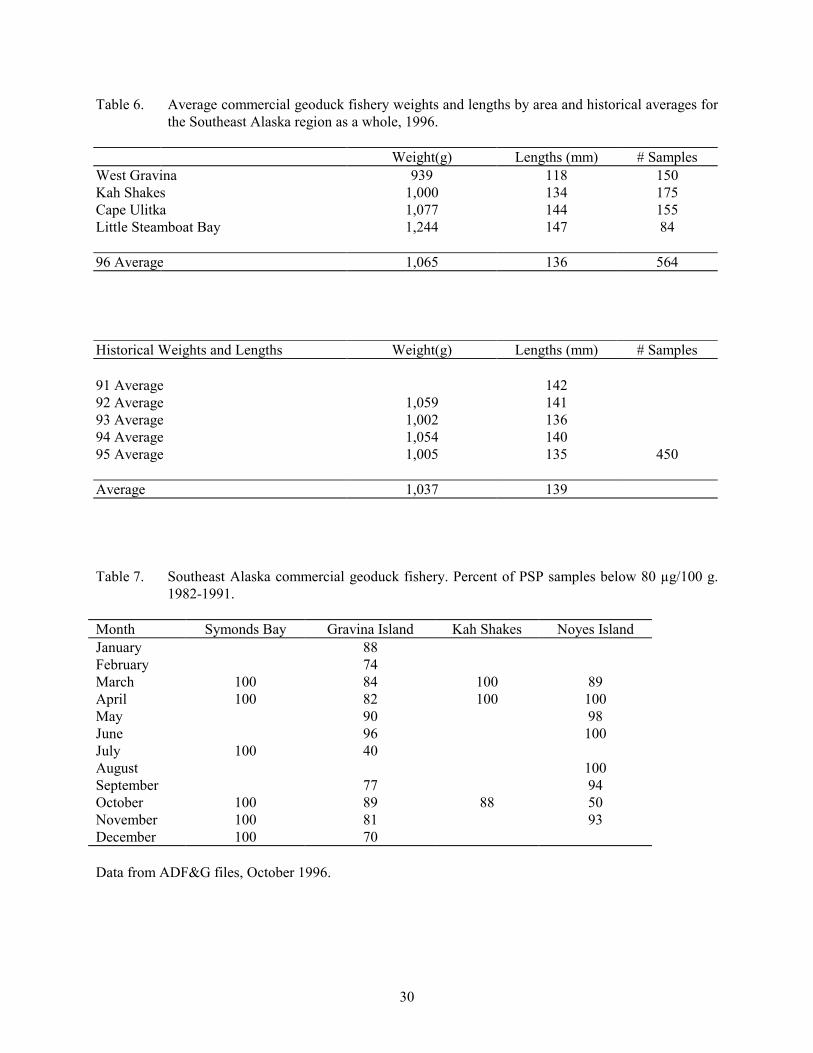
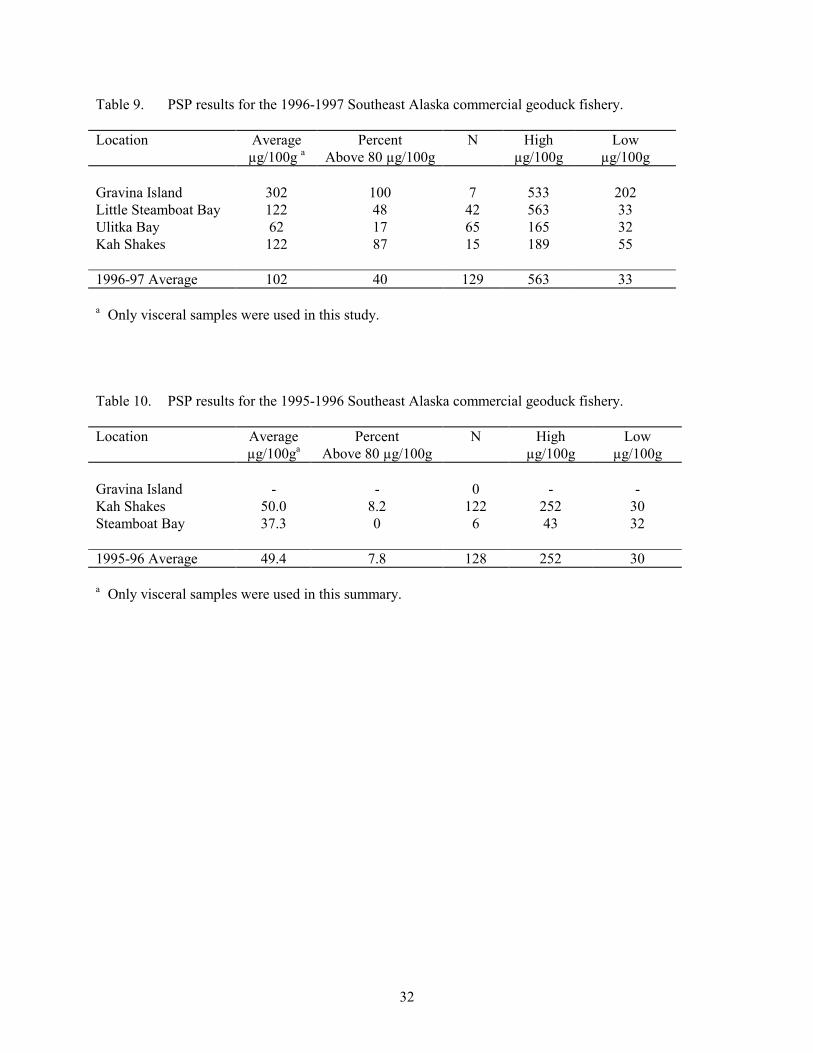
Commercial Harvest Historical PSP Results Historical PSP data were collected during 1992 by ADF&G biologist Robert Larson from the database of the DEC laboratory in Palmer Alaska (1982-1991). Table 7 shows the percentage of PSP samples less than 80 µg/100 g. These data were compiled from both viscera and meat samples. Results showed Symonds Bay without incidence of PSP toxins greater than 80 µg/100 g. Gravina Island showed low PSP levels in the fall and spring. The author conducted the same type of analysis, but for viscera data only, for all available PSP results from the DEC lab in Palmer prior to 1997. An average level of all areas of 99 µg/100 g. was determined. The maximum sample was 1526 µg/100 g and the minimum was 25 µg/100 g with a total of 1214 samples (Table 8). The data suggest that early spring months have the lowest PSP levels in all the areas sampled. Records for some samples sent by ADF&G to the Palmer lab were not present in the database, indicating that samples were apparently mislabeled or lost. During the 1996-97 commercial season the overall average was 102 µg/100 g for 129 samples taken. The high was 563 µg/100 g taken in Little Steamboat Bay and the lowest was 33 µg/100 g taken in Ulitka Bay (Table 9). During the 1995-96 commercial season, 216 tissue (siphon and breast) and 128 viscera samples were tested at the DEC laboratory in Palmer. Only tissue samples were tested from Gravina and Noyes Island as processors planned to process all product from those areas. All samples were within acceptable limits. Gravina Island and Steamboat Bay both averaged 32 µg/100 g. At Kah Shakes, 122 viscera samples were tested. Eight percent of those were above accepted levels and the highest sample registered 252 µg/100 g. The average Kah Shakes sample was 50 µg/100 g (Table 10). For Symonds Bay the DEC was sent 125 samples for testing during the 1995-96 fishery. Eight samples were insufficient in size (< 25 g). Of those tested:
● 82% were less than 40 µg/100 g ● 94% were less than 50 µg/100 g ● 97% were less than 60 µg/100 g ● 99% were less than 80 µg/100 g
The mean PSP level was 37 µg/100 g (n = 117). The minimum was 30 µg/100 g, and the maximum was 235 µg/100 g. (Dave Gordon, ADF&G, Sitka, personal communication)
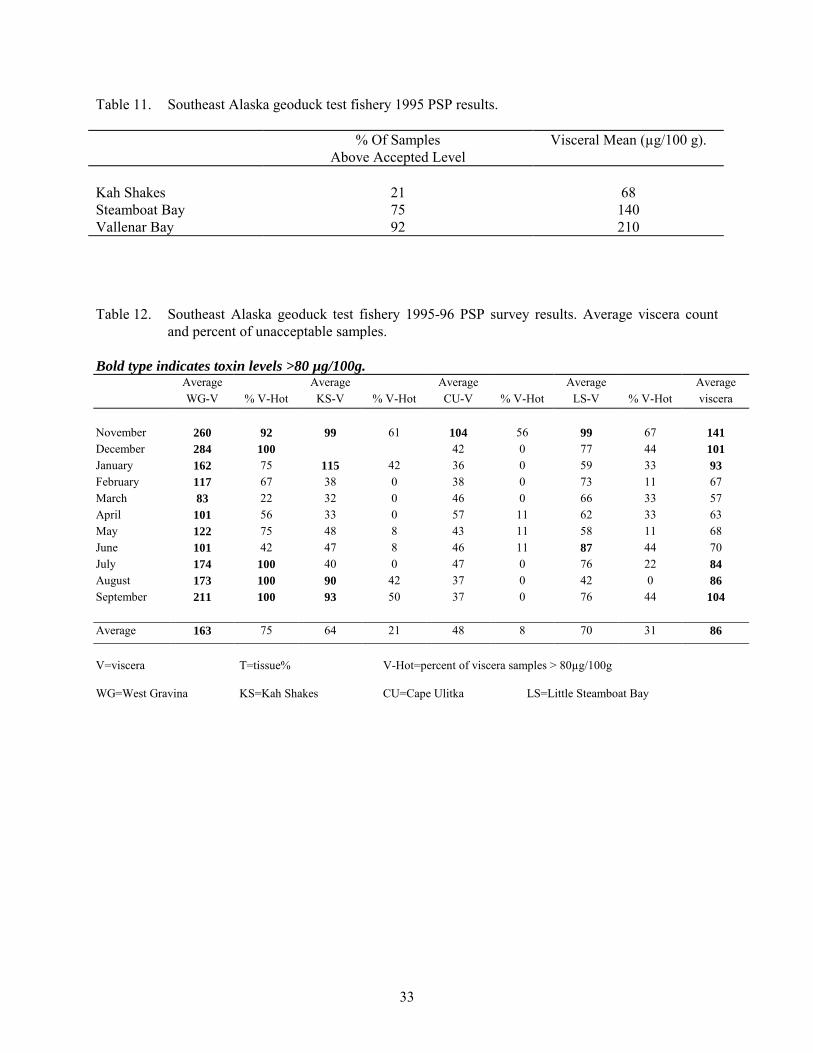
Geoduck Test Fisheries A test fishery was conducted at three areas in the Ketchikan Management Area prior to the 1995 commercial geoduck fishery. From September 16, 1995, through September 20, 1995, samples were collected at Kah Shakes, Vallenar Bay (Gravina Island), and Steamboat Bay. Results showed that Kah Shakes was the only area that had potential for live harvest (Table 11). Vallenar Bay had the highest toxin levels with 95% of samples above accepted levels.
18
An eleven-month test fishery was conducted on all areas open for commercial harvest during the 1996-97 season in the Ketchikan Management Area. Results suggested some areas had periods at which live sales were feasible. Except for Gravina Island, all areas that were tested suggested a March and April fishery. West Gravina showed high PSP levels during all times of the year (Table 12).
DEC PSP Contamination Study A study was conducted in 1981 to determine if contaminated viscera could transfer PSP to uncontaminated tissue. Samples were taken from six geoducks collected at Grant Cove on the west cost of Gravina Island. Results showed that high PSP levels in the viscera could transfer to the tissue in some circumstances of extended contact (Memo from Ray Carlson, Alaska Department of Health, December 10, 1981).
GEODUCK AGE DATA In 1981 the department sent 20 geoduck clams to be aged by the Washington Department of Fisheries Laboratory in Brinnon, Washington (Table 13). The twenty clams were selected at random, ten from Grant Creek and ten from Vallenar Bay. Both areas are located on the west shore of Gravina Island. The ages were determined by counting internal growth lines in the shell. One growth line or band is deposited annually on the geoduck shell (Shaul and Goodwin 1982). Results showed geoduck ages ranging from 30 to 40 years of age (Dennis Blankenbeckler, ADF&G, Ketchikan, personal communication). Hagen and Jaenicke, (1996) aged 145 Southeast Alaska geoduck shells collected from previous years and determined that ages ranged from 11 to 89 years with a median age of 40 years (Table 13). Ages were studied using cross-sections of geoduck hinges. Little Steamboat Bay samples were the largest clams and had the highest mean age.
19
DIVE SURVEYS AND GEODUCK SAMPLING, 1977 - 1989 1977 Because of the renewed increase in Southeast Alaska geoducks, an exploratory cruise was conducted from September 8 -11, 1977. Participants included Robert Earl, Del Hansen, Bill Baker, Dennis Thomason, and ADF&G biologist Dennis Blankenbeckler. The survey was funded by the Metlakatla Indian Reservation and E. C. Phillips Cold Storage. The purpose of this cruise was to determine if geoducks were available in commercial concentrations in the Ketchikan area and if these were clear of PSP. Data collected from the survey showed potential for a commercial geoduck harvest in Southeast Alaska. The main concern with commercial harvest was the high incidence of PSP found in the clams (Tim Koeneman, ADF&G, Petersburg, personal communication). 1978 ADF&G biologists Dennis Blankenbeckler and Tim Koeneman surveyed Nehenta Bay, located on the southwest side of Gravina Island, on June 20, 1978. Eighteen samples indicated a mean length of 132 mm and mean weight of 1,083 gm (Tim Koeneman, ADF&G, Ketchikan, personal communication). 1979 Divers observed large concentrations of geoducks while doing herring spawn assessment research in the Kah Shakes area during the spring of 1976. Based on these observations, ADF&G biologists Dennis Blankenbeckler and Robert Larson explored the Kah Shakes area on April 26, 1979. Preliminary sampling showed an extensive area with geoducks present (Dennis Blankenbeckler, ADF&G, Ketchikan, personal communication). A survey was conducted in Deanna Bay (located between Nehenta Bay and Nelson Cove on the west coast of Gravina Island) on June 28, 1979. The southern portion of the bay was sampled as it had good concentrations of geoducks. This study was used to develop survey and transect methods. Of the 43 samples taken, the mean length was 144.3 mm for the left shell, and 143.8 mm for the right shell, showing very little variation. In September of 1979, Robert Earl was awarded a contract for $30,000 to conduct a study using his boat, the F/V Northern Diver. Monies were obtained from the Alaska State Legislature, National Marine Fisheries Service (NMFS), and the Bureau of Indian Affairs (BIA). The purpose of the study was to determine if commercial quantities of geoducks existed and to develop techniques to harvest them. Bob Earl, William Baker, and John Spencer explored a large part of Districts 1 through 3 in Southeast Alaska from September 22, to December 22, 1979. Areas explored included: Kasaan Bay, North Behm Canal, Clarence Strait, Revillagigedo Channel, Annette Island, Felice Strait, Nichols Passage, Cordova Bay, Tlevak Strait, Suemez Island, Sea Otter Sound, and El Capitan Passage. Average geoduck weight was 998 grams (2.2 pounds), and many small beds of geoducks were discovered. The geoducks were test marketed in the spring of 1980 and the product was acceptable for all markets. Market samples brought from $0.70/pound to $3.00/pound. (Blankenbeckler, 1982).
20
1980 Scott Fitch on the F/V Caldo conducted independent geoduck research under the guidance of the Petersburg ADF&G staff in July of 1980. Samples were taken at Hecata Island (west coast of Prince of Wales Island) and the geoduck viscera were found to be within acceptable PSP levels. On April 8-11, 1980, Robert Larson and Dennis Blankenbeckler conducted dive surveys on fourteen transects in the Kah Shakes area and found good densities of geoducks. Robert Larson conducted a geoduck survey on June 4, 1980 in Foggy Bay, the Delong Islands, and Lincoln Channel. These areas are located approximately 40 miles south of Ketchikan and showed some concentrations of geoducks with the sites around the Delong Islands showing the greatest promise. Dive surveys were conducted at Grant Creek, located on the northwest side of Gravina Island, on June 14, 1980. Fair concentrations of geoducks were found but PSP levels were high. Geoducks were sampled at Deanna Bay on the west side of Gravina Island on June 24, 1980. Average shell length was 143 mm taken from eight geoducks. Geoducks were collected from Vallenar Bay and Grant Cove on October 10, 1980. Sixteen samples were sent to the Palmer lab for PSP analysis. Visceral samples showed high PSP levels with an average of 125.5 µg (Robert Larson, ADF&G, Ketchikan, personal communication). Geoducks were sampled at Deanna Bay on the west side of Gravina Island on October 30, 1980. Bob Larson and John Westlund took samples and sent them to DEC. Average shell length of 6 geoducks was 143 mm (John Westlund, ADF&G, Ketchikan, personal communication). Deanna Cove data were summarized at the end of 1980 and out of 21 samples the average PSP level was 313 µg/100 g. The range went from 33µg to 2,534µg with all samples above the acceptable level except for one (Dennis Blankenbeckler, ADF&G, Ketchikan, personal communication). 1981 Based on results from the 1980 research, the department initiated two new studies to further investigate the potential for a commercial geoduck fishery. The first was a study of geoduck distribution in Southeast Alaska and the second was a PSP study in two areas. The survey was conducted by Bob Earl and John Spencer, beginning on June 14, 1981. Survey areas were Etolin Island, Snow Pass, Onslow Island, Zarembo Island, Sumner Straits, Kuiu Island, Farragut Bay, Wrangle Narrows, Sea Otter Sound, Noyes Island, Bucarreli Bay, east and west Dall Island, Long Island, and Tlevak Narrows. This study indicated numerous commercial beds of geoducks (Yoder, 1982). Several commercially harvestable beds were found on the northern side of Noyes Island. Two PSP study areas were established on Gravina Island, one in Grant Cove and one in the northeast corner of Vallenar Bay. These areas were chosen because of their proximity to Ketchikan, and the fact that previous samples from these areas showed high PSP levels. Samples were taken throughout the summer of 1981. Every two weeks, three sites were sampled in Vallenar Bay and three sites at Grant Cove. At each site, seven clams were taken and shipped to the Palmer shellfish lab from May until
21
September. Biomass and density were determined by estimating the number of siphons in a square meter frame. In Vallenar Bay, the greatest density occurred with 21 shows per square meter. PSP results showed a large variation in viscera PSP levels and low levels in all meat samples (Blankenbecker and Koeneman, 1982). 1982 ADF&G biologist Robert Larson and diver Bob Earl sampled Noyes Island during a ten-day dive survey beginning August 21, 1982 (Robert Larson, ADF&G, Petersburg, personal communication). Areas surveyed included Cone Island, Port Real Marina, Steamboat Bay, Little Steamboat Bay, and Ulitka Bay. Populations that had greatest densities were located in Steamboat Bay. Geoduck densities were determined at 16 sites and geoducks were collected at 37 sites. The purpose of this trip was to satisfy federal requirements for interstate transportation of clams. If the clams could pass the DEC requirements a commercial fishery was expected to occur. Mean shell length was 148 mm with mean weight at 1,119 gm from 187 geoducks. Densities were determined as 1.85 /m² at Steamboat Bay, 0.70 /m² at Little Steamboat Bay, and 0.95 /m² at Cape Ulitka Bay. The population of the north shore of Noyes Island was estimated as 3,100 metric tons (corrected for seasonal visual efficiency and for whole wet weight) (Robert Larson, ADF&G, Petersburg, personal communication). One concern by DEC was that the inner portion of Steamboat Bay was subject to periodic point pollution due to human habitation (K. Ballentine, Department of Environmental Conservation, Anchorage, personal communication). Due to these concerns, the southern part of Steamboat Bay was closed to commercial harvest south of the vessel dock. 1984 Symonds Bay and Maid Island, areas near Sitka, were sampled in 1984. Admiralty, Baranof, and Chichagof Island sites were also surveyed but no commercial quantities were found. No PSP samples were over the accepted 80 µg/100g. At Maid Island the density was 1.73 /m² with 129,800 geoducks estimated for the Maid Island Passage area. For Symonds Bay the population was estimated as 585,228 geoducks with a density of 1.95 /m². Studies conducted on Gravina Island produced mean density estimates that ranged from 4.50 geoducks /m² for repetitive counts in one area to 4.81 geoducks /m² for all available data. The commercial biomass was estimated at 1,009,714 kg of geoducks (Tim Koeneman, ADF&G, Petersburg, personal communication). 1989 Samples were taken in Clover Pass in 1989 and were sent to the Palmer, Alaska lab. Several of the viscera samples were above 80 µg/100g.
22
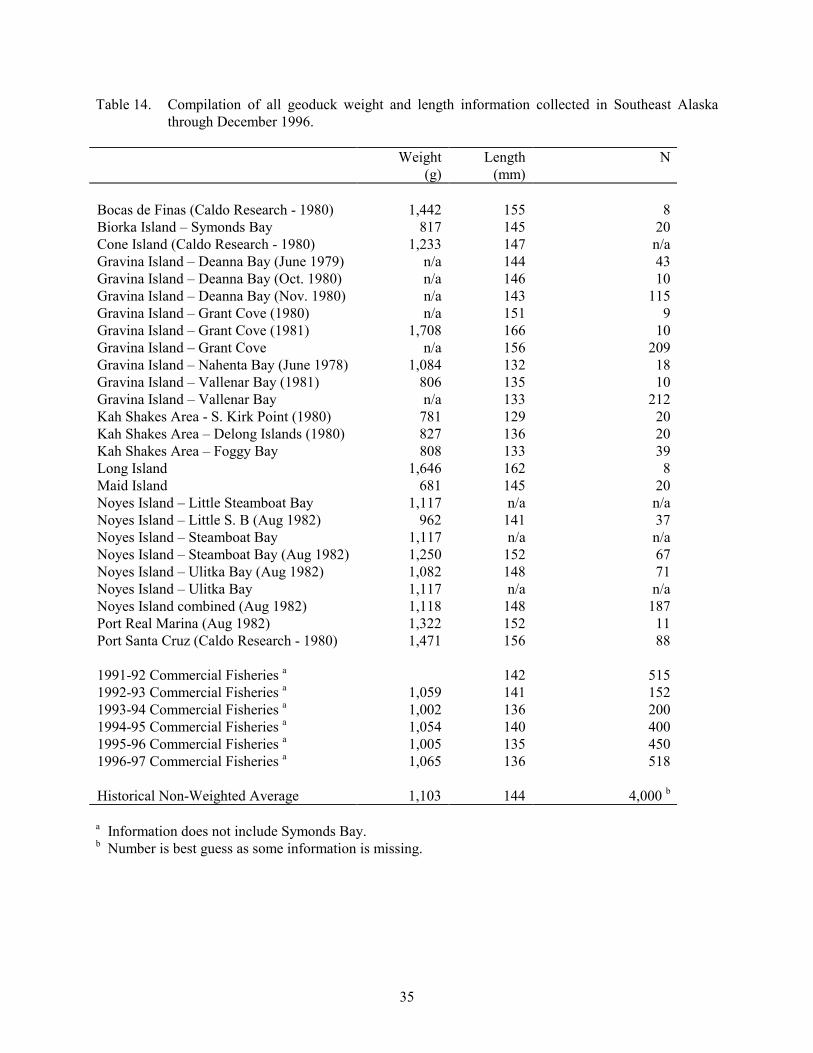
WEIGHT AND LENGTHS From the onset of the geoduck commercial fishery, weights and lengths of geoducks were taken both from the commercial fisheries and from research samples. Samples taken during the 1996-97 season averaged 1,065 g and 139 mm in length (Table 6). In September of 1987, all available samples showed an average weight of 1,049 grams (2.32 /pound). In 1997, the author compiled all available geoduck weights and found a Southeast Alaska average of 1,103 grams (2.43 pound) and 144 mm in length (Table 14). Goodwin and Pease (1987) found an average length of 135 mm and an average weight of 872 g out of 11,154 geoducks sampled in Puget Sound.
DISCUSSION The geoduck fishery had its beginnings with Bob Earl’s exploratory cruise in 1977. In the mid 1980s as research developed and the industry grew, the department began to realize the potential of geoduck harvesting in Southeast Alaska. During the 1990s the department found itself struggling to manage a constant GHL with ever increasing effort levels. Many of the new entrants into the fishery were experienced non-residents that outfished the local dive fleet. With increasing effort the department felt increasing pressure to further develop the geoduck commercial fishery. Due to decreasing budgets, with no new monies for dive fisheries, the industry soon realized that new assessments would only be conducted with industry funds. One of the hindrances to the development of the fishery has always been the persistently high PSP levels. Even in areas that have low average PSP levels, a “hot” sample can occasionally be found during testing, causing the whole lot to be rejected for live sales. Symonds Bay and Kah Shakes are the only areas in Southeast Alaska that have had historically low PSP levels. Another major concern is the long distance between the harvest areas and the PSP testing facility. In a live geoduck market, revenue is lost for each hour that clams are waiting to be shipped out. The testing facility is located in Palmer, 40 miles northeast of Anchorage, so a private courier is quite often needed to get the samples from the airport in Anchorage to the lab. With Southeast Alaska’s weather and limited airplane schedules, transportation can be extremely difficult and costly. Samples, which harvesters deliver to Ketchikan, must depart on the correct plane, arrive in Anchorage in a timely manner, and be picked up and delivered to the Palmer lab within working hours on a weekday. If any major delays occur, the product must be processed. Due to this uncertainty, many buyers have processed all their geoducks, resulting in a decrease in the value of the fishery. Industry members have repeatedly spoken of the need for a testing facility in Southern Southeast Alaska, which would benefit geoduck fishery development.
23
CONCLUSION Geoduck meats from Alaska have never been found with PSP concentrations above the accepted 80 µg/100g. However, DEC personnel and ADF&G divers found that there can be a significant difference of PSP levels in neighboring clams at various depths at the same location. High levels of PSP in viscera, and the large variations of PSP levels in localized stocks continue to create uncertainty for live sales of commercially harvested geoducks. The distance between the harvest sites and the Palmer lab is detrimental to live sales, diminishing the economic value of Southeast Alaska geoducks. Live sales will most likely not be feasible until a testing facility is established in Southeast Alaska. Dive surveys have been conducted throughout a large part of Southeast Alaska, providing the department a basic idea of bed locations. Surveys suggest that most geoduck beds in the region tend to be small and localized, not the large geoduck beds needed for a large scale commercial geoduck fishery such as occurs in British Columbia and in Washington State. As of this writing, a geoduck task force has been established to develop a geoduck management plan, recommend fishery dates, and to obtain secure financing for future assessments and management. The task force consisted of industry divers and processors. The Alaska State Legislature instituted a regional dive association, which was incorporated on February 5, 1998. The association was created to allow Southeast Alaska divers to tax themselves to pay for future assessments and management of Southeast Alaska dive fisheries. Beginning in 1999, the regional dive association voted to tax themselves at 5% of the value of landed geoducks, with the revenue to be used to expand fishing opportunities. From a humble bait harvest to the frenzied fishery it is today, the commercial harvest of Southeast Alaska geoducks has seen increasing potential. With industry funding available for development, it is likely that there will be increases in GHLs in the near future.
24
LITERATURE CITED Anderson, A. M. 1971. Spawning, growth, and spatial distribution of the geoduck clam, Panope generosa
Gould, in Hood Canal Washington. Thesis, University of Washington. Seattle. Blankenbeckler, D., T. Koeneman, and G. Gunstrom. 1982. A position paper on a research and
management approach to an exploratory fishery on geoducks in S.E. Alaska. Report to the Alaska Department of Fish and Game, Ketchikan.
Breen, P. A. and T. L. Sheilds. 1983. Age and structure of five populations of geoduc clams (Panope generosa) in British Columbia. Canadian Technical Report of Fish and Aquatic Sciences No. 1169.
CFEC (Commercial Fisheries Entry Commission). 1998. Southeast Alaska dive fisheries: abalone, geoduck, sea urchin, sea cucumber. Commercial Fisheries Entry Commission, Juneau.
Earl, B. 1994. Geoduck survey report. Report to the Alaska Department of Fish and Game, Ketchikan. FDA (Food and Drug Administration). 1996. Natural Toxins, fish and fishery products hazards and
controls guide. Department of Health and Human Services, Public Health Service, Food and Drug Administration, Center for Food Safety and Applied Nutrition, Office of Seafood, Washington, DC. 1st edition. Chap. 6: 59-68
Goodwin, L. 1974 .The effects of season on visual and photographic assessment on subtidal geoducks clam (Panope generosa Gould) populations. Veliger 20: 155-158.
Goodwin, L. 1976. Observation of spawning and growth of subtidal geoducks (Panope generosa, Gould). Proceedings of the National Shellfisheries Association. Vol. 65 :49-58.
Goodwin, C. L. and B. Pease. 1987. The distribution of geoduck (Panope abrupta) size, density and quality in relation to habitat characteristics, such as geographic area, water depth, sediment type and associated flora and fauna in Puget Sound Washington. Washington Dept. Fish. Tech. Rep. No. 102.
Goodwin, C. L. and B. Pease. 1989. Specific profiles: Life histories and environmental requirements for bassal fish and invertebrates (Pacific Northwest): Pacific Geoduck Clam. U.S. Fish and Wildlife Service Biological Report 82 (11.120). U.S. Army Corps of Engineers, TR EL-82-4.
Gressner, Brad. 1996. Epidemiology of paralytic shellfish poisoning outbreaks in Alaska. Alaska’s Marine Resources. Volume 8, Number 2. University of Alaska.
Hagen, P. and M. J. Jaenicke. 1996. Preliminary Assessments on the Ages of Geoducks, Panope abrupta, in Southeast Alaska using thin section of shell hinges. Regional Information Report No. 5J97-08.
Harbo, R. M., B. E. Adkins, P. A. Breen, K. L. Hobbs. 1983. Age and size in market samples of geoduck clams (Panope generosa). Canadian Manuscript Report of Fisheries and Aquatic Sciences No. 1714.
Horner, R. A. 1996. Alexandrium the dinoflagellate that produces shellfish poisoning toxins. Alaska Marine Resources, Vol 8, No. 2: 8-9.
Larson, R. 1983. Southeast Alaska Geoduck Fishery. Presented to the inshore fisheries conference, Fish Expo, Seattle. Alaska Department of Fish and Game, Ketchikan.
Ricketts, E. F., J. Calvin, and J. W. Hedgpeth. 1985. Between Pacific Tides. Stanford University Press. Stanford, California.
Shaul, W. and L. Goodwin. 1982. Geoduck (Panope generosa: Bivalvia) Age as determined by internal growth lines in the shell. Canadian Journal of Fisheries and Aquatic Sciences. Volume 39: 632-636.
Sloan, N. A. and S. M. C. Robinson. 1984. Age and gonad development in the geoduck clam Panope Aburpta (Conrad) from Southern British Columbia, Canada. Journal of Shellfish Research, Vol. 4, No. 2 : 131-137.
Yoder, M. L. 1982. Geoduck report. Alaska Department of Fish and Game, Ketchikan.

25
Table 1. Harvest by season for the Southeast Alaska commercial geoduck fishery, 1979-1997.
Seasons 101-29 101-23 103-70 113-31,41 Harvest in
Pounds Gravina
IslandKah Shakes Noyes
Island Symonds
BayMisc.a Total
1979-80 b b
1983-84 b b
1985-86 143,868 143,8681986-87 28,191 28,1911987-88 124,568 61,106 185,6741988-89 114,534 28,654 143,1881989-90 128,261 68,261 10,561 207,0831990-91 118,581 19,289 43,804 7,911 189,5851991-92 110,227 14,079 62,861 5,907 193,0741992-93 119,801 20,777 40,925 7,876 189,3791993-94 117,054 19,063 63,265 9,940 209,322
1994-95 Fall 101,178 19,695 26,138 9,990 157,0011994-95 Winter 25,536 12,308 37,844
1995-96 Fall 130,577 20,013 59,983 210,5731995-96 Winter 9,708 9,708
1996-97 Fall 130,385 20132 41,540 192,0571996-97 Winter 10,434 10,434 Data from ADF&G Integrated Fisheries Database (11-5-97).
a Harvest taken in subdistrict 104-30 and Nichols Pass. b Confidential, less than three divers.
26
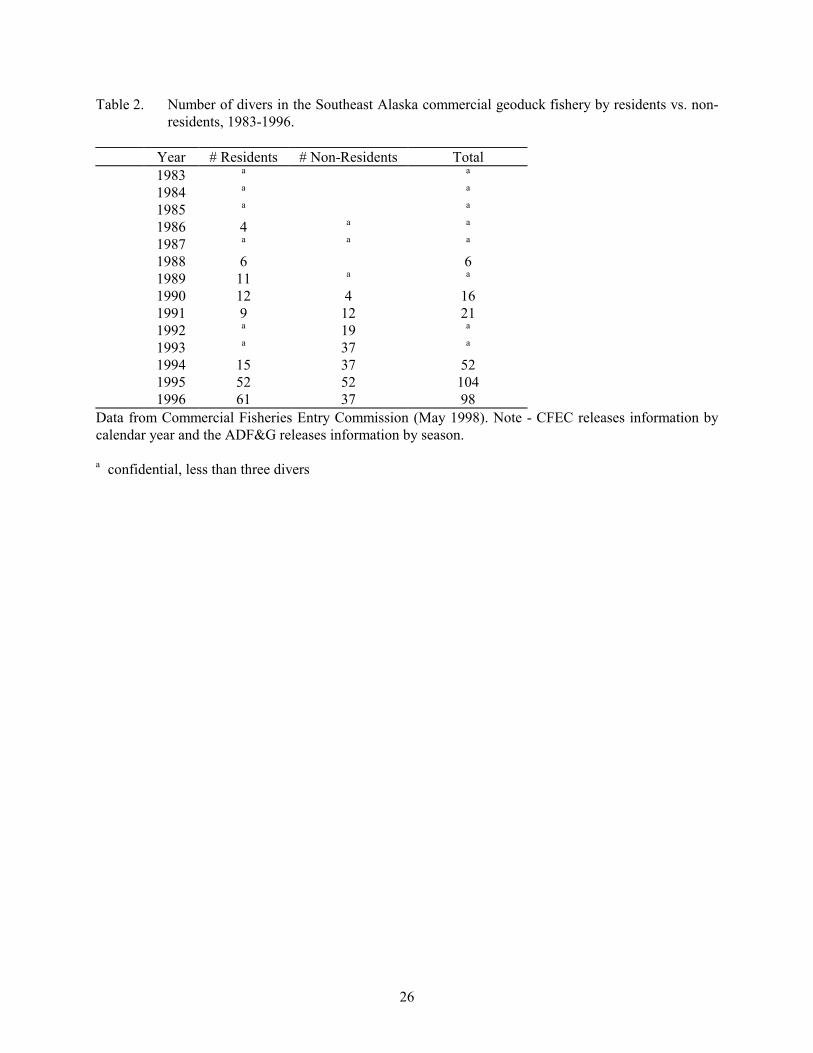
Table 2. Number of divers in the Southeast Alaska commercial geoduck fishery by residents vs. non-residents, 1983-1996.
Year # Residents # Non-Residents Total 1983 a a
1984 a a
1985 a a
1986 4 a a
1987 a a a
1988 6 6 1989 11 a a
1990 12 4 16 1991 9 12 21 1992 a 19 a
1993 a 37 a
1994 15 37 52 1995 52 52 104 1996 61 37 98
Data from Commercial Fisheries Entry Commission (May 1998). Note - CFEC releases information by calendar year and the ADF&G releases information by season. a confidential, less than three divers
27
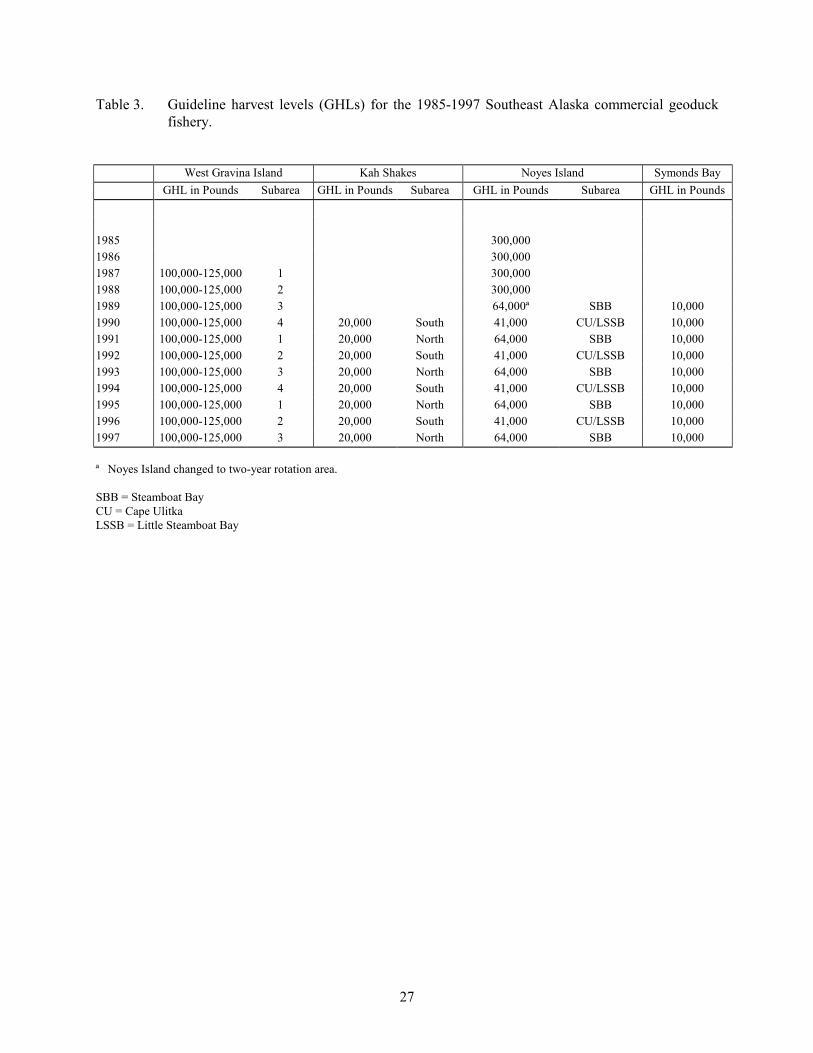
Table 3. Guideline harvest levels (GHLs) for the 1985-1997 Southeast Alaska commercial geoduck fishery.
West Gravina Island Kah Shakes Noyes Island Symonds Bay GHL in Pounds Subarea GHL in Pounds Subarea GHL in Pounds Subarea GHL in Pounds 1985 300,000 1986 300,000 1987 100,000-125,000 1 300,000 1988 100,000-125,000 2 300,000 1989 100,000-125,000 3 64,000ª SBB 10,000 1990 100,000-125,000 4 20,000 South 41,000 CU/LSSB 10,000 1991 100,000-125,000 1 20,000 North 64,000 SBB 10,000 1992 100,000-125,000 2 20,000 South 41,000 CU/LSSB 10,000 1993 100,000-125,000 3 20,000 North 64,000 SBB 10,000 1994 100,000-125,000 4 20,000 South 41,000 CU/LSSB 10,000 1995 100,000-125,000 1 20,000 North 64,000 SBB 10,000 1996 100,000-125,000 2 20,000 South 41,000 CU/LSSB 10,000 1997 100,000-125,000 3 20,000 North 64,000 SBB 10,000 ª Noyes Island changed to two-year rotation area. SBB = Steamboat Bay CU = Cape Ulitka LSSB = Little Steamboat Bay

28
Table 4. Open and closing dates for the Southeast Alaska commercial geoduck fishery, 1985-1997. Season Open Closed Open Closed Open Closed Open Closed Gravina Island Kah Shakes Noyes Island Symonds Bay
1983-84 - - 1985-86 Oct 1 May 31 1986-87 Oct 1 May 31 1987-88 Jan 15 May 16 Oct 1 Jun 30 1988-89 Oct 1 Jun 2 Oct 1 Jun 15 1989-90 Oct 1 May 15 Oct 1 May 30 Oct 1 Apr 11 1990-91 Oct 1 Nov 18 Jan 21 Mar 22 Oct 1 Feb 5 & Mar 26ª Oct 1 Apr 12 1991-92 Oct 1 Oct 17 Oct 1 Nov 2 Oct 1 Oct 31b Oct 1 Apr 25 1992-93 Oct 1 Oct 6 Oct 1 Oct 13 Oct 1 Oct 5 & Oct 14ª Oct 1 Oct 19 1993-94 Oct 1 Oct 3 Oct 1 Oct 4 Oct 1 Oct 6 Oct 1 Oct 11 1994-95 Fall Oct 3 Oct 5 Oct 3 Oct 5 Oct 3 Oct 6c 1994-95 Winter Jan 9 Jan 10 Jan 9 Jan 10d Jan 9 Jan 18 1995-96 Fall Oct 1 Oct 4 Oct 1 Oct 10 Oct 1 Oct 5a 1995-96 Winter Jan 8 Jan 18 1996-97 Fall Oct 7 Oct 31 Oct 7 Oct 31 Oct 7 Oct 21 & Nov 4ª
1996-97 Winter Jan 13 Feb 3
ª First date is Little Steamboat Bay and second is Cape Ulitka Bay. b Date is for Steamboat Bay only. c Cape Ulitka only. d Little Steamboat Bay only.
29
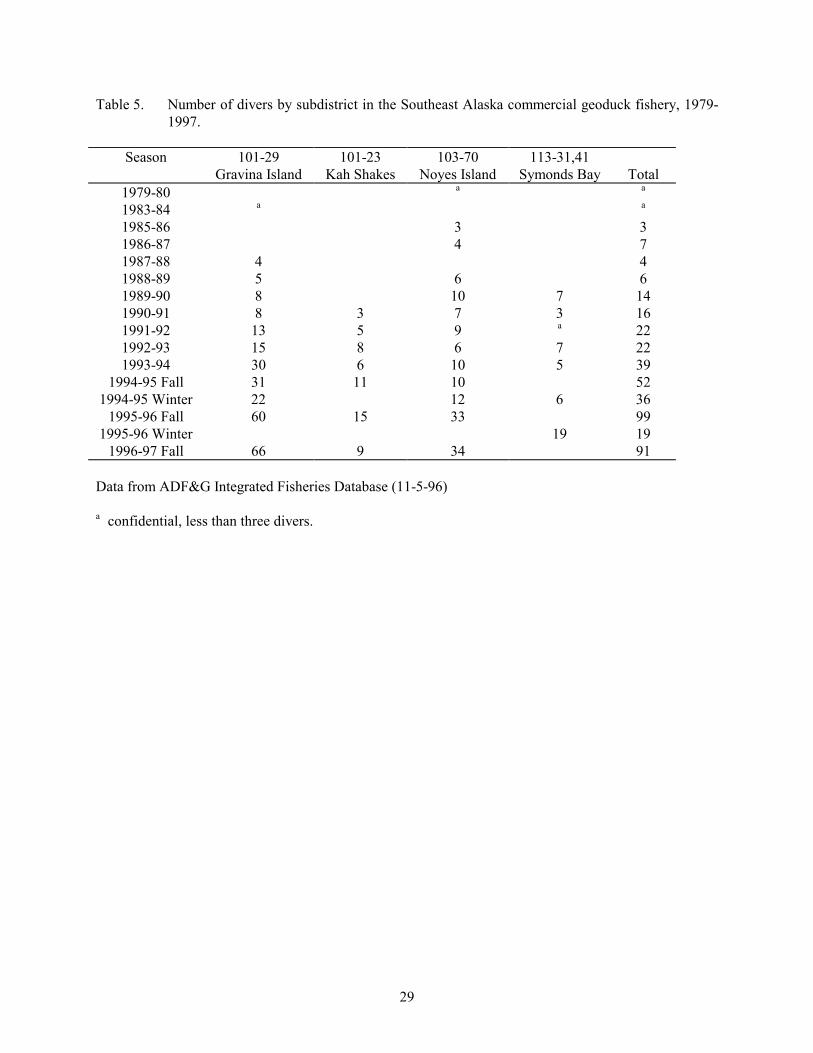
Table 5. Number of divers by subdistrict in the Southeast Alaska commercial geoduck fishery, 1979-1997.
Season 101-29 101-23 103-70 113-31,41
Gravina Island Kah Shakes Noyes Island Symonds Bay Total 1979-80 a a
1983-84 a a
1985-86 3 3 1986-87 4 7 1987-88 4 4 1988-89 5 6 6 1989-90 8 10 7 14 1990-91 8 3 7 3 16 1991-92 13 5 9 a 22 1992-93 15 8 6 7 22 1993-94 30 6 10 5 39
1994-95 Fall 31 11 10 52 1994-95 Winter 22 12 6 36
1995-96 Fall 60 15 33 99 1995-96 Winter 19 19
1996-97 Fall 66 9 34 91 Data from ADF&G Integrated Fisheries Database (11-5-96) a confidential, less than three divers.
30
Table 6. Average commercial geoduck fishery weights and lengths by area and historical averages for the Southeast Alaska region as a whole, 1996.
Weight(g) Lengths (mm) # Samples West Gravina 939 118 150 Kah Shakes 1,000 134 175 Cape Ulitka 1,077 144 155 Little Steamboat Bay 1,244 147 84 96 Average 1,065 136 564 Historical Weights and Lengths Weight(g) Lengths (mm) # Samples 91 Average 142 92 Average 1,059 141 93 Average 1,002 136 94 Average 1,054 140 95 Average 1,005 135 450 Average 1,037 139 Table 7. Southeast Alaska commercial geoduck fishery. Percent of PSP samples below 80 µg/100 g.
1982-1991. Month Symonds Bay Gravina Island Kah Shakes Noyes Island January 88 February 74 March 100 84 100 89 April 100 82 100 100 May 90 98 June 96 100 July 100 40 August 100 September 77 94 October 100 89 88 50 November 100 81 93 December 100 70 Data from ADF&G files, October 1996.
31
Table 8. Summary of all PSP samples in (µg/100g) for the Southeast Alaska commercial geoduck fishery.
Bold type indicates PSP levels >80 µg/100g. Jan Feb Mar Apr May Jun Jul Aug Sep Oct Nov Dec Total/Average Grant Cove
N 6 15 31 7 24 12 14 17 126 Average 174 147 287 261 164 340 233 204 226
Max 495 373 1526 478 407 1083 760 548 1526 Min 42 59 58 65 45 62 46 33 33
Kah Shakes N 12 12 13 12 12 12 32 12 24 142 14 297
Average 115 38 34 33 48 46 65 90 84 59 87 64 Max 389 60 61 41 89 83 266 183 243 252 253 389 Min 46 32 30 32 33 32 32 45 36 30 32 30
Symonds Bay N 282 24 21 6 24 24 6 11 398
Average 38 35 33 34 34 50 35 32 36 Max 235 69 52 41 47 123 41 33 235 Min 30 32 30 32 30 31 33 32 30
Little Steamboat Bay N 20 9 9 9 13 9 9 9 38 43 9 9 186
Average 78 72 66 62 50 87 76 42 83 142 99 77 78 Max 311 192 144 119 199 232 176 50 248 563 168 151 563 Min 32 38 32 32 30 32 36 35 31 40 35 32 30
Steamboat Bay N 13 4 2 5 9 47 12 6 98
Average 68 32 46 74 46 67 38 80 56 Max 152 32 60 84 60 267 48 253 267 Min 32 31 33 60 31 31 32 32 31
Ulitka Bay N 9 9 12 9 9 22 9 9 65 76 10 9 248
Average 35 37 52 57 43 43 48 37 62 67 97 42 52 Max 46 68 111 227 122 102 68 48 255 276 198 58 276 Min 32 32 32 32 32 32 31 32 32 32 32 32 31
Vallenar Bay N 4 56 146 12 12 17 9 15 12 12 295
Average 191 99 104 92 115 113 223 294 803 498 253 Max 440 481 701 172 194 288 373 580 1205 862 1205 Min 59 31 25 51 57 53 59 135 524 125 25
West Gravina N 43 24 15 13 12 12 17 26 12 53 42 12 281
Average 128 213 114 113 123 101 142 128 211 143 180 283 157 Max 375 533 276 275 226 192 262 255 402 533 559 501 559 Min 32 58 44 32 60 40 57 45 103 32 40 120 32
Data from Department of Environmental Conservation database (received April-4-97).
32
Table 9. PSP results for the 1996-1997 Southeast Alaska commercial geoduck fishery. Location Average Percent N High Low µg/100g a Above 80 µg/100g µg/100g µg/100g Gravina Island 302 100 7 533 202 Little Steamboat Bay 122 48 42 563 33 Ulitka Bay 62 17 65 165 32 Kah Shakes 122 87 15 189 55 1996-97 Average 102 40 129 563 33
a Only visceral samples were used in this study. Table 10. PSP results for the 1995-1996 Southeast Alaska commercial geoduck fishery. Location Average Percent N High Low µg/100ga Above 80 µg/100g µg/100g µg/100g Gravina Island - - 0 - - Kah Shakes 50.0 8.2 122 252 30 Steamboat Bay 37.3 0 6 43 32 1995-96 Average 49.4 7.8 128 252 30 a Only visceral samples were used in this summary.
33
Table 11. Southeast Alaska geoduck test fishery 1995 PSP results. % Of Samples
Above Accepted Level Visceral Mean (µg/100 g).
Kah Shakes 21 68 Steamboat Bay 75 140 Vallenar Bay 92 210 Table 12. Southeast Alaska geoduck test fishery 1995-96 PSP survey results. Average viscera count
and percent of unacceptable samples. Bold type indicates toxin levels >80 µg/100g. Average Average Average Average Average WG-V % V-Hot KS-V % V-Hot CU-V % V-Hot LS-V % V-Hot viscera November 260 92 99 61 104 56 99 67 141 December 284 100 42 0 77 44 101 January 162 75 115 42 36 0 59 33 93 February 117 67 38 0 38 0 73 11 67 March 83 22 32 0 46 0 66 33 57 April 101 56 33 0 57 11 62 33 63 May 122 75 48 8 43 11 58 11 68 June 101 42 47 8 46 11 87 44 70 July 174 100 40 0 47 0 76 22 84 August 173 100 90 42 37 0 42 0 86 September 211 100 93 50 37 0 76 44 104 Average 163 75 64 21 48 8 70 31 86
V=viscera T=tissue% V-Hot=percent of viscera samples > 80µg/100g WG=West Gravina KS=Kah Shakes CU=Cape Ulitka LS=Little Steamboat Bay

34
Table 13. Southeast Alaska commercial geoduck fishery age data. 1981 DATA: Mean Age (years) Range Weight (g) Length (mm) Grant Cove (1981) 40 14-54 1,706 166 Vallenar Bay (1981) 30 20-79+ 806 135
(source: Blankenbeckler, 1982) 1996 DATA:
Mean Age Standard Deviation Range N Kah Shakes 36.73 10.35 11-52 29 Little Steamboat Bay 47.9 14.71 11-84 24 Cape Ulitka 47.72 12.7 18-88.7 27 West Gravina Island 39.2 15.7 31-87 40
(source: Hagen and Jaenicke, 1996)
35
Table 14. Compilation of all geoduck weight and length information collected in Southeast Alaska through December 1996.
Weight Length N (g) (mm) Bocas de Finas (Caldo Research - 1980) 1,442 155 8 Biorka Island – Symonds Bay 817 145 20 Cone Island (Caldo Research - 1980) 1,233 147 n/a Gravina Island – Deanna Bay (June 1979) n/a 144 43 Gravina Island – Deanna Bay (Oct. 1980) n/a 146 10 Gravina Island – Deanna Bay (Nov. 1980) n/a 143 115 Gravina Island – Grant Cove (1980) n/a 151 9 Gravina Island – Grant Cove (1981) 1,708 166 10 Gravina Island – Grant Cove n/a 156 209 Gravina Island – Nahenta Bay (June 1978) 1,084 132 18 Gravina Island – Vallenar Bay (1981) 806 135 10 Gravina Island – Vallenar Bay n/a 133 212 Kah Shakes Area - S. Kirk Point (1980) 781 129 20 Kah Shakes Area – Delong Islands (1980) 827 136 20 Kah Shakes Area – Foggy Bay 808 133 39 Long Island 1,646 162 8 Maid Island 681 145 20 Noyes Island – Little Steamboat Bay 1,117 n/a n/a Noyes Island – Little S. B (Aug 1982) 962 141 37 Noyes Island – Steamboat Bay 1,117 n/a n/a Noyes Island – Steamboat Bay (Aug 1982) 1,250 152 67 Noyes Island – Ulitka Bay (Aug 1982) 1,082 148 71 Noyes Island – Ulitka Bay 1,117 n/a n/a Noyes Island combined (Aug 1982) 1,118 148 187 Port Real Marina (Aug 1982) 1,322 152 11 Port Santa Cruz (Caldo Research - 1980) 1,471 156 88 1991-92 Commercial Fisheries a 142 515 1992-93 Commercial Fisheries a 1,059 141 152 1993-94 Commercial Fisheries a 1,002 136 200 1994-95 Commercial Fisheries a 1,054 140 400 1995-96 Commercial Fisheries a 1,005 135 450 1996-97 Commercial Fisheries a 1,065 136 518 Historical Non-Weighted Average 1,103 144 4,000 b
a Information does not include Symonds Bay. b Number is best guess as some information is missing.

36
Admiralty Is.
Chichagof Is.
Baranof Is.
Prince of W
ales Is.
Dixon Entrance
Gravina Is.
Skagway
SitkaBiorka Is.Symonds Bay
(10,000 lb)
Haines
Juneau
Petersburg
Wrangell
N
50 Miles
Ketchikan
Kah Shakes (20,000 lb)2 subareas
Noyes Is.Cape Ulitka (26,000 lb)
Little Steamboat Bay (15,000 lb)Steamboat Bay (64,000 lb)
West Gravina(100,000 to 125,000 lb)
4 subareas
Figure 1. Southeast Alaska geoduck fishery harvest areas.

37
Biorka Is.
Symonds Bay
OPENAREA
EntranceIsland
HanusIsland
Figure 2. Southeast Alaska geoduck fishery at Symonds Bay.
38
Subarea 1
Subarea 2
Kah Shakes Pt.
Kirk Pt.
KahShakesCove
BullheadCove
55°04'06" N. Latitude
Very In
let
55°00'00" N. Latitude
54°57'42" N. Latitude
Figure 3. Southeast Alaska geoduck fishery at Kah Shakes.
39
55°20'52" N. Lat.
VallenarBay
55°22'50"N. Lat.
55°19'00"N. Lat.
55°21'22" N. Lat.
OPENAREA
S. Vallenar Pt.
VallenarRocks
Gravina Is.
55°11'39"N. Lat
55°16'11"N. Lat.
ClosedClosed
Subarea 1
Subarea 3
Subarea 4
Subarea 2
Figure 4. Southeast Alaska geoduck fishery at west Gravina Island.
40
Ulitka BayLittle
SteamboatBay
SteamboatBay
Roller Bay
CapeUlitka
Noyes Is.
Steamboat P
t.
closed south of latitude of Cannery Dock
Pt. Incarnation
Figure 5. Southeast Alaska geoduck fishery at Noyes Island.
41
The Alaska Department of Fish and Game administers all programs and activities free from discrimination based on race, color, national origin, age, sex, religion, marital status, pregnancy, parenthood, or disability. The department administers all programs and activities in compliance with Title VI of the Civil Rights Act of 1964, Section 504 of the Rehabilitation Act of 1973, Title II of the Americans with Disabilities Act of 1990, the Age Discrimination Act of 1975, and Title IX of the Education Amendments of 1972. If you believe you have been discriminated against in any program, activity, or facility, or if you desire further information please write to ADF&G, P.O. Box 25526, Juneau, AK 99802-5526; U.S. Fish and Wildlife Service, 4040 N. Fairfield Drive, Suite 300, Arlington, VA 22203; or O.E.O., U.S. Department of the Interior, Washington DC 20240. For information on alternative formats for this and other department publications, please contact the department ADA Coordinator at (voice) 907-465-4120, (TDD) 907-465-3646, or (FAX) 907-465-2440.