Embed Size (px)
Citation preview
R
AU
Ma
b
c
d
h
•••••
a
ARRA
KGHLMRT
1
t
S
(
h0
Landscape and Urban Planning 127 (2014) 114–123
Contents lists available at ScienceDirect
Landscape and Urban Planning
j o ur na l ho me pag e: www.elsev ier .com/ locate / landurbplan
esearch paper
n historical land conservation analysis in the San Francisco Bay Area,SA: 1850–2010
aria J. Santosa,b,∗, James H. Thornec, Jon Christensend, Zephyr Franka
Spatial History Project, Department of History, Stanford University, United StatesBill Lane Center for the American West, Stanford University, United StatesInformation Center for the Environment, University of California Davis, United StatesDepartment of Urban Studies, University of California Los Angeles, United States
i g h l i g h t s
We reconstructed the process of decadal conservation land acquisition from 1850 to 2010.We assessed the representation of land-cover types within the conservation network.Conservation network growth was gradual with a fill-in effect to a total of 26% of the study region.Intermediary governance levels aimed at providing a specific service (Special Districts) purchased most land.Land cover in properties acquired around the 1900s and after the 1970s changed the least.
r t i c l e i n f o
rticle history:eceived 27 November 2013eceived in revised form 4 April 2014ccepted 5 April 2014
eywords:overnance levelsistoryand-cover typesetropolitan conservation network
epresentationimeline
a b s t r a c t
The last century has seen large changes in land-use and land-cover. We reconstructed the history ofconservation land acquisition (where, when, how much and what) from 1850 to 2010 in the San FranciscoBay Area, California, U.S.A. We hypothesized that the process of land acquisition would be characterized bya fill-in effect – as acquisitions are pursued over time, they complement prior acquisitions by adding morearea and new or underrepresented land-cover types. We also hypothesized that strategic land acquisitionover time would result in representation of all land-cover types, and that these types would subsequentlyshow little transition, except in heavily disturbed locations, such as previously logged redwood forests.Acquisition of conservation lands was continuous and currently represents 31.7% of the Bay Area. SpecialDistricts (local government units delivering a specific service – parks) acquired more area, and citiesacquired numerous small properties. There was a fill-in effect with fewer and larger parcels acquiredbefore 1940 while later acquisitions were more numerous but smaller. At least 20% of every land-covertype is currently conserved, showing the historic complementarity of strategic acquisitions. Land-cover
change was less than 40% in early acquisitions, between 70 and 80% on degraded lands in mid-century,and 45% in recent acquisitions. The history of conservation land acquisition has led to a representativeconservation network in the San Francisco Bay Area. We believe that reconstructing conservation historycan unveil past trends, permit assessment of success, and identify challenges to represent biodiversitywithin a conservation network.© 2014 Elsevier B.V. All rights reserved.
. Introduction
Unprecedented rates of change in land-use and land-cover overhe last century challenge the ability of conservation networks to
∗ Corresponding author. Department of Innovation, Environmental and Energyciences, Utrecht University, The Netherlands. Tel: +31 30 253 5898.
E-mail addresses: [email protected], [email protected]. Santos).
ttp://dx.doi.org/10.1016/j.landurbplan.2014.04.011169-2046/© 2014 Elsevier B.V. All rights reserved.
meet their objectives of conserving biodiversity, and other goals.While reserve network characteristics such as number, size, spatiallocation and proximity, and presence of stepping stone reserves(Heller & Zavaleta, 2012) reflect what is today the accepted ratio-nal for the systematically planned development of a conservationnetwork (Margules & Pressey, 2000), this has not always been the
case (Knight, Rodrigues, Strange, Tew, & Wilson, 2013) especiallyin rapidly growing metropolitan areas. Earlier conservation landacquisition efforts pursued a variety of values in an ad hoc fashionrather than explicit objectives (Cowling, Pressey, Lombard, Desmet,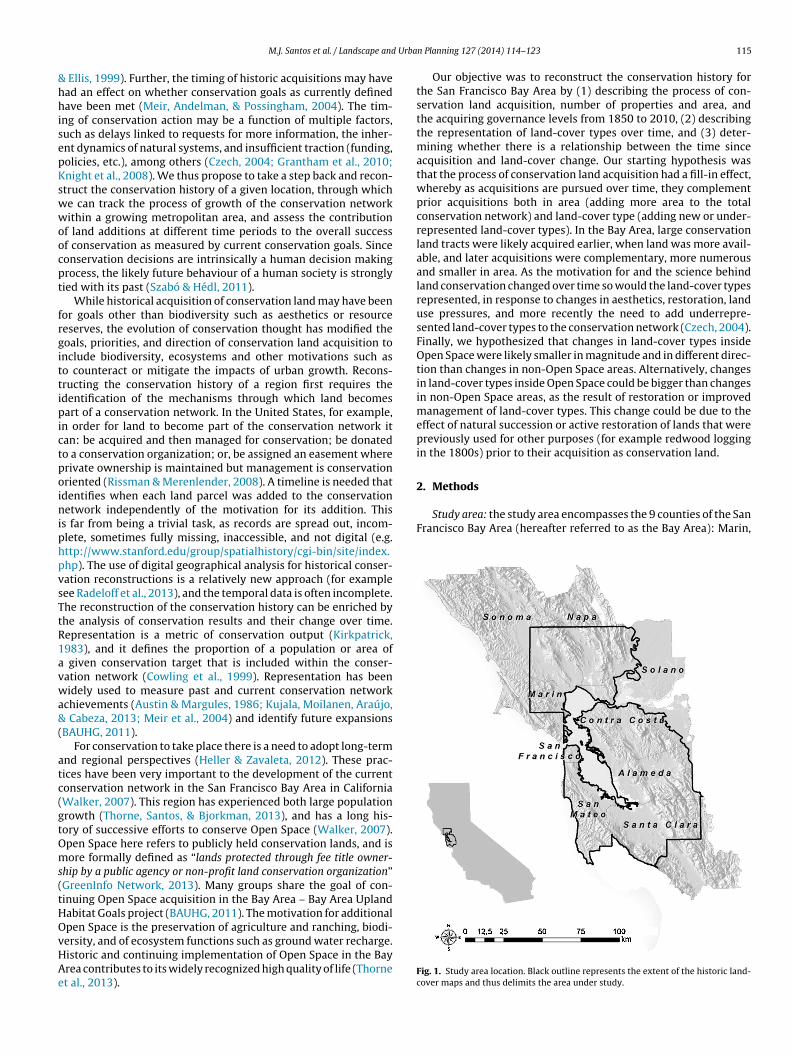
Urba
&hhisepKswwoocpt
frgittipictpoiniphpvsTtR1avwa&(
atc(gtOms(tHOvHAe
2. Methods
Study area: the study area encompasses the 9 counties of the SanFrancisco Bay Area (hereafter referred to as the Bay Area): Marin,
M.J. Santos et al. / Landscape and
Ellis, 1999). Further, the timing of historic acquisitions may havead an effect on whether conservation goals as currently definedave been met (Meir, Andelman, & Possingham, 2004). The tim-
ng of conservation action may be a function of multiple factors,uch as delays linked to requests for more information, the inher-nt dynamics of natural systems, and insufficient traction (funding,olicies, etc.), among others (Czech, 2004; Grantham et al., 2010;night et al., 2008). We thus propose to take a step back and recon-truct the conservation history of a given location, through whiche can track the process of growth of the conservation networkithin a growing metropolitan area, and assess the contribution
f land additions at different time periods to the overall successf conservation as measured by current conservation goals. Sinceonservation decisions are intrinsically a human decision makingrocess, the likely future behaviour of a human society is stronglyied with its past (Szabó & Hédl, 2011).
While historical acquisition of conservation land may have beenor goals other than biodiversity such as aesthetics or resourceeserves, the evolution of conservation thought has modified theoals, priorities, and direction of conservation land acquisition tonclude biodiversity, ecosystems and other motivations such aso counteract or mitigate the impacts of urban growth. Recons-ructing the conservation history of a region first requires thedentification of the mechanisms through which land becomesart of a conservation network. In the United States, for example,
n order for land to become part of the conservation network itan: be acquired and then managed for conservation; be donatedo a conservation organization; or, be assigned an easement whererivate ownership is maintained but management is conservationriented (Rissman & Merenlender, 2008). A timeline is needed thatdentifies when each land parcel was added to the conservationetwork independently of the motivation for its addition. This
s far from being a trivial task, as records are spread out, incom-lete, sometimes fully missing, inaccessible, and not digital (e.g.ttp://www.stanford.edu/group/spatialhistory/cgi-bin/site/index.hp). The use of digital geographical analysis for historical conser-ation reconstructions is a relatively new approach (for exampleee Radeloff et al., 2013), and the temporal data is often incomplete.he reconstruction of the conservation history can be enriched byhe analysis of conservation results and their change over time.epresentation is a metric of conservation output (Kirkpatrick,983), and it defines the proportion of a population or area of
given conservation target that is included within the conser-ation network (Cowling et al., 1999). Representation has beenidely used to measure past and current conservation network
chievements (Austin & Margules, 1986; Kujala, Moilanen, Araújo, Cabeza, 2013; Meir et al., 2004) and identify future expansions
BAUHG, 2011).For conservation to take place there is a need to adopt long-term
nd regional perspectives (Heller & Zavaleta, 2012). These prac-ices have been very important to the development of the currentonservation network in the San Francisco Bay Area in CaliforniaWalker, 2007). This region has experienced both large populationrowth (Thorne, Santos, & Bjorkman, 2013), and has a long his-ory of successive efforts to conserve Open Space (Walker, 2007).pen Space here refers to publicly held conservation lands, and isore formally defined as “lands protected through fee title owner-
hip by a public agency or non-profit land conservation organization”GreenInfo Network, 2013). Many groups share the goal of con-inuing Open Space acquisition in the Bay Area – Bay Area Uplandabitat Goals project (BAUHG, 2011). The motivation for additionalpen Space is the preservation of agriculture and ranching, biodi-ersity, and of ecosystem functions such as ground water recharge.
istoric and continuing implementation of Open Space in the Bayrea contributes to its widely recognized high quality of life (Thornet al., 2013).n Planning 127 (2014) 114–123 115
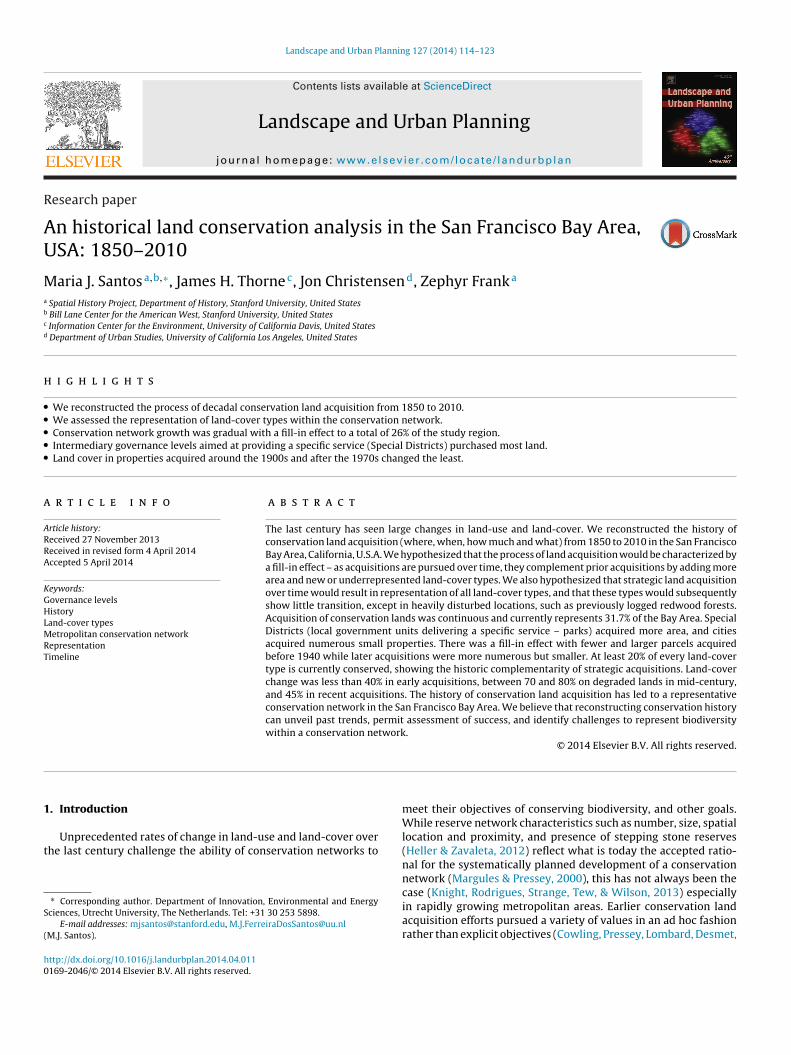
Our objective was to reconstruct the conservation history forthe San Francisco Bay Area by (1) describing the process of con-servation land acquisition, number of properties and area, andthe acquiring governance levels from 1850 to 2010, (2) describingthe representation of land-cover types over time, and (3) deter-mining whether there is a relationship between the time sinceacquisition and land-cover change. Our starting hypothesis wasthat the process of conservation land acquisition had a fill-in effect,whereby as acquisitions are pursued over time, they complementprior acquisitions both in area (adding more area to the totalconservation network) and land-cover type (adding new or under-represented land-cover types). In the Bay Area, large conservationland tracts were likely acquired earlier, when land was more avail-able, and later acquisitions were complementary, more numerousand smaller in area. As the motivation for and the science behindland conservation changed over time so would the land-cover typesrepresented, in response to changes in aesthetics, restoration, landuse pressures, and more recently the need to add underrepre-sented land-cover types to the conservation network (Czech, 2004).Finally, we hypothesized that changes in land-cover types insideOpen Space were likely smaller in magnitude and in different direc-tion than changes in non-Open Space areas. Alternatively, changesin land-cover types inside Open Space could be bigger than changesin non-Open Space areas, as the result of restoration or improvedmanagement of land-cover types. This change could be due to theeffect of natural succession or active restoration of lands that werepreviously used for other purposes (for example redwood loggingin the 1800s) prior to their acquisition as conservation land.
Fig. 1. Study area location. Black outline represents the extent of the historic land-cover maps and thus delimits the area under study.
116 M.J. Santos et al. / Landscape and Urban Planning 127 (2014) 114–123
50 to
NMalwi
PinSNtdmopdca
Fig. 2. Decadal conservation network from 18
apa, Sonoma, Solano, Contra Costa, Alameda, San Francisco, Sanateo, and Santa Clara, in a total area of 9630.8 km2. We focus on
subset of this area that corresponds to the extent of the historicaland-cover maps (Fig. 1). This area has a Mediterranean climate,
ith mild and wet winters and dry and hot summers. Topographys gently rolling with elevations up to 1200 m.
Open Space data: We used the Bay Area subset of the Californiarotected Areas Database (CPAD; GreenInfo Network, 2013), whichncludes information on the spatial representation, name, gover-ance type (for example, City of Berkeley or United States Forestervice) and its level (Federal, State, County, Special District, City,GO, Private and Unknown). We define governance as “a descrip-
ion of the decision-making structure of a protected area and shouldescribe where the decision-making power of delegating manage-ent authority rests. The governance of a protected area legally sets
ut the authority responsible and accountable for managing the
rotected area” (sensu IUCN & UNEP-WCMC, 2013). To enrich theseata, we contacted the federal, state, and local agencies, and Spe-ial Districts (a type of government unit that is formed to providespecific service, such as schools, sewers, street lighting, parks or
2010. Grey represents Open Space properties.
other) and non-governmental organizations (NGO) that owned theland to ask for information on the date of establishment of eachproperty.
Land-cover data: Land-cover in two time periods (historic:1930s; and modern: 2010) was used to assess representation ofvegetation within reserve networks. The choice of these two timeframes may have hindered our ability to detect fast land-cover tran-sitions that could have occurred. Temporal replicates of land-covermaps are, however, few and far between. There is an additional1970s land-cover map, but its thematic resolution (number andtype of land-cover classes) was not comparable to the maps wedid use. Further, we think that faster land-cover transitions weremore likely to have occurred in non-natural land-cover types, suchas agriculture-eucalyptus, agriculture-urban, etc. and probably thevelocity of these transitions is due to intense management. Sincewe were interested in conservation of natural land-cover typeswe believe this does not represent a major caveat of our analy-
sis.The historic land-cover was produced under the Wieslan-der Vegetation Type Mapping project (http://vtm.berkeley.edu/;
Urban Planning 127 (2014) 114–123 117
WSds(gi2
UitC(ahbcwgfrdtge
2
ctwsa
tpllca
atubrttgal
wfrwmcutitld
0.000.501.001.502.002.503.003.50
0100200300400500600
1850
-189
9
1900
-190
9
191 0
-191
9
1920
-192
9
193 0
-193
9
194 0
-194
9
195 0
-195
9
196 0
-196
9
1970
-197
9
1980
-198
9
1990
-199
9
2000
-200
9
Average area (km
2)num
ber o
f pro
pert
ies
Average number of properties Average area
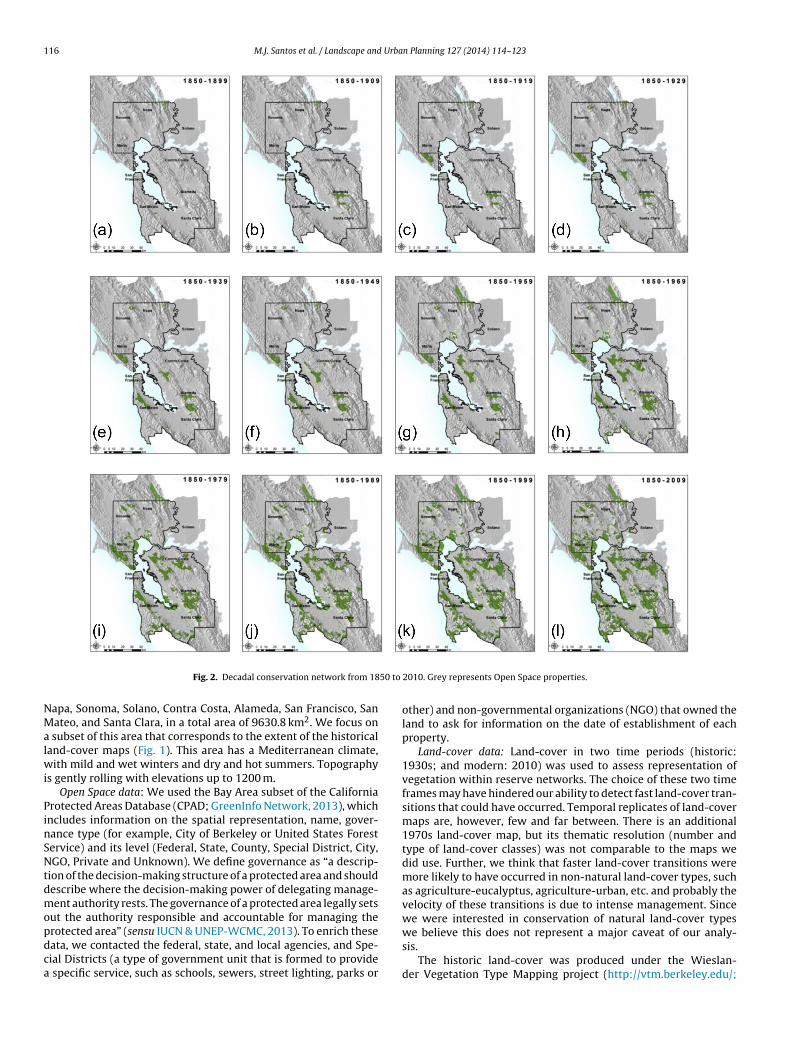
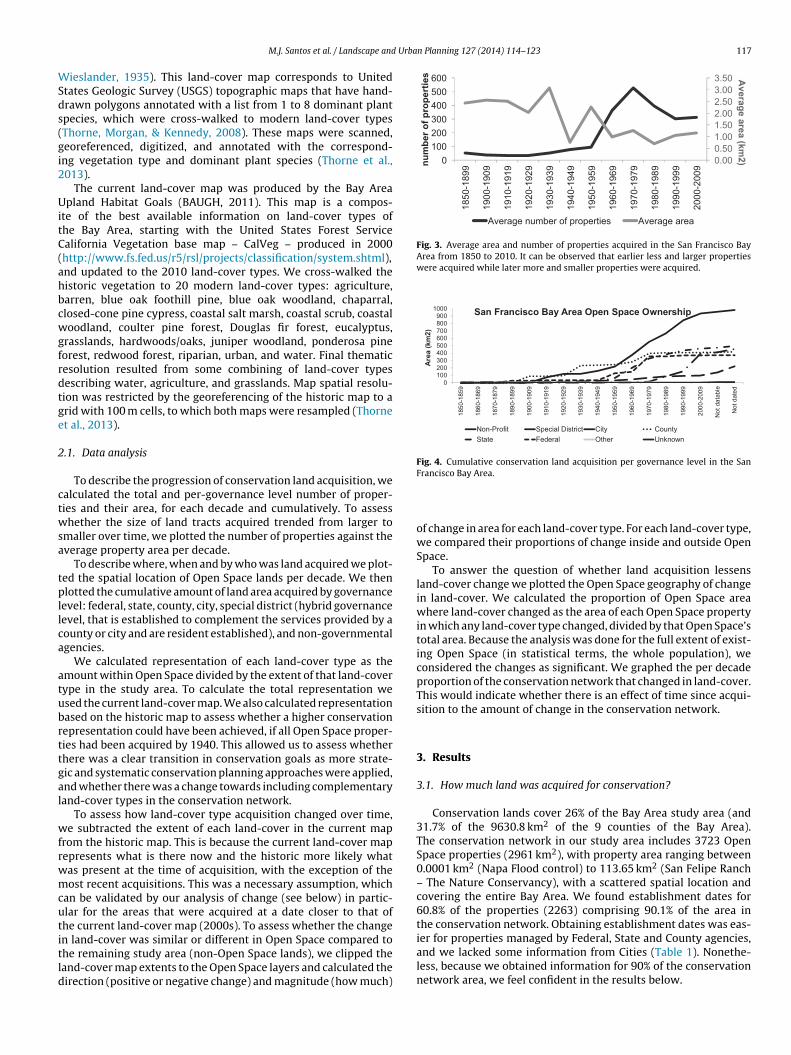
Fig. 3. Average area and number of properties acquired in the San Francisco BayArea from 1850 to 2010. It can be observed that earlier less and larger propertieswere acquired while later more and smaller properties were acquired.
0100200300400500600700800900
1000
1850
-185
9
1860
-186
9
1870
-187
9
1890
-189
9
1900
-190
9
1910
-191
9
1920
-192
9
1930
-193
9
1940
-194
9
1950
-195
9
1960
-196
9
1970
-197
9
1980
-198
9
1990
-199
9
2000
-200
9
Not
dat
a ble
Not
dat
ed
Are
a (k
m2)
San Francisco Bay Area Open Space Ownership
Non-Pro fit Special Distric t Cit y Coun tyState Federal Othe r Unknow n
Fig. 4. Cumulative conservation land acquisition per governance level in the San
M.J. Santos et al. / Landscape and
ieslander, 1935). This land-cover map corresponds to Unitedtates Geologic Survey (USGS) topographic maps that have hand-rawn polygons annotated with a list from 1 to 8 dominant plantpecies, which were cross-walked to modern land-cover typesThorne, Morgan, & Kennedy, 2008). These maps were scanned,eoreferenced, digitized, and annotated with the correspond-ng vegetation type and dominant plant species (Thorne et al.,013).
The current land-cover map was produced by the Bay Areapland Habitat Goals (BAUGH, 2011). This map is a compos-
te of the best available information on land-cover types ofhe Bay Area, starting with the United States Forest Servicealifornia Vegetation base map – CalVeg – produced in 2000http://www.fs.fed.us/r5/rsl/projects/classification/system.shtml),nd updated to the 2010 land-cover types. We cross-walked theistoric vegetation to 20 modern land-cover types: agriculture,arren, blue oak foothill pine, blue oak woodland, chaparral,losed-cone pine cypress, coastal salt marsh, coastal scrub, coastaloodland, coulter pine forest, Douglas fir forest, eucalyptus,
rasslands, hardwoods/oaks, juniper woodland, ponderosa pineorest, redwood forest, riparian, urban, and water. Final thematicesolution resulted from some combining of land-cover typesescribing water, agriculture, and grasslands. Map spatial resolu-ion was restricted by the georeferencing of the historic map to arid with 100 m cells, to which both maps were resampled (Thornet al., 2013).
.1. Data analysis
To describe the progression of conservation land acquisition, wealculated the total and per-governance level number of proper-ies and their area, for each decade and cumulatively. To assesshether the size of land tracts acquired trended from larger to
maller over time, we plotted the number of properties against theverage property area per decade.
To describe where, when and by who was land acquired we plot-ed the spatial location of Open Space lands per decade. We thenlotted the cumulative amount of land area acquired by governance
evel: federal, state, county, city, special district (hybrid governanceevel, that is established to complement the services provided by aounty or city and are resident established), and non-governmentalgencies.
We calculated representation of each land-cover type as themount within Open Space divided by the extent of that land-coverype in the study area. To calculate the total representation wesed the current land-cover map. We also calculated representationased on the historic map to assess whether a higher conservationepresentation could have been achieved, if all Open Space proper-ies had been acquired by 1940. This allowed us to assess whetherhere was a clear transition in conservation goals as more strate-ic and systematic conservation planning approaches were applied,nd whether there was a change towards including complementaryand-cover types in the conservation network.
To assess how land-cover type acquisition changed over time,e subtracted the extent of each land-cover in the current map
rom the historic map. This is because the current land-cover mapepresents what is there now and the historic more likely whatas present at the time of acquisition, with the exception of theost recent acquisitions. This was a necessary assumption, which
an be validated by our analysis of change (see below) in partic-lar for the areas that were acquired at a date closer to that ofhe current land-cover map (2000s). To assess whether the change
n land-cover was similar or different in Open Space compared tohe remaining study area (non-Open Space lands), we clipped theand-cover map extents to the Open Space layers and calculated theirection (positive or negative change) and magnitude (how much)Francisco Bay Area.
of change in area for each land-cover type. For each land-cover type,we compared their proportions of change inside and outside OpenSpace.
To answer the question of whether land acquisition lessensland-cover change we plotted the Open Space geography of changein land-cover. We calculated the proportion of Open Space areawhere land-cover changed as the area of each Open Space propertyin which any land-cover type changed, divided by that Open Space’stotal area. Because the analysis was done for the full extent of exist-ing Open Space (in statistical terms, the whole population), weconsidered the changes as significant. We graphed the per decadeproportion of the conservation network that changed in land-cover.This would indicate whether there is an effect of time since acqui-sition to the amount of change in the conservation network.
3. Results
3.1. How much land was acquired for conservation?
Conservation lands cover 26% of the Bay Area study area (and31.7% of the 9630.8 km2 of the 9 counties of the Bay Area).The conservation network in our study area includes 3723 OpenSpace properties (2961 km2), with property area ranging between0.0001 km2 (Napa Flood control) to 113.65 km2 (San Felipe Ranch– The Nature Conservancy), with a scattered spatial location andcovering the entire Bay Area. We found establishment dates for60.8% of the properties (2263) comprising 90.1% of the area inthe conservation network. Obtaining establishment dates was eas-ier for properties managed by Federal, State and County agencies,and we lacked some information from Cities (Table 1). Nonethe-less, because we obtained information for 90% of the conservation
network area, we feel confident in the results below.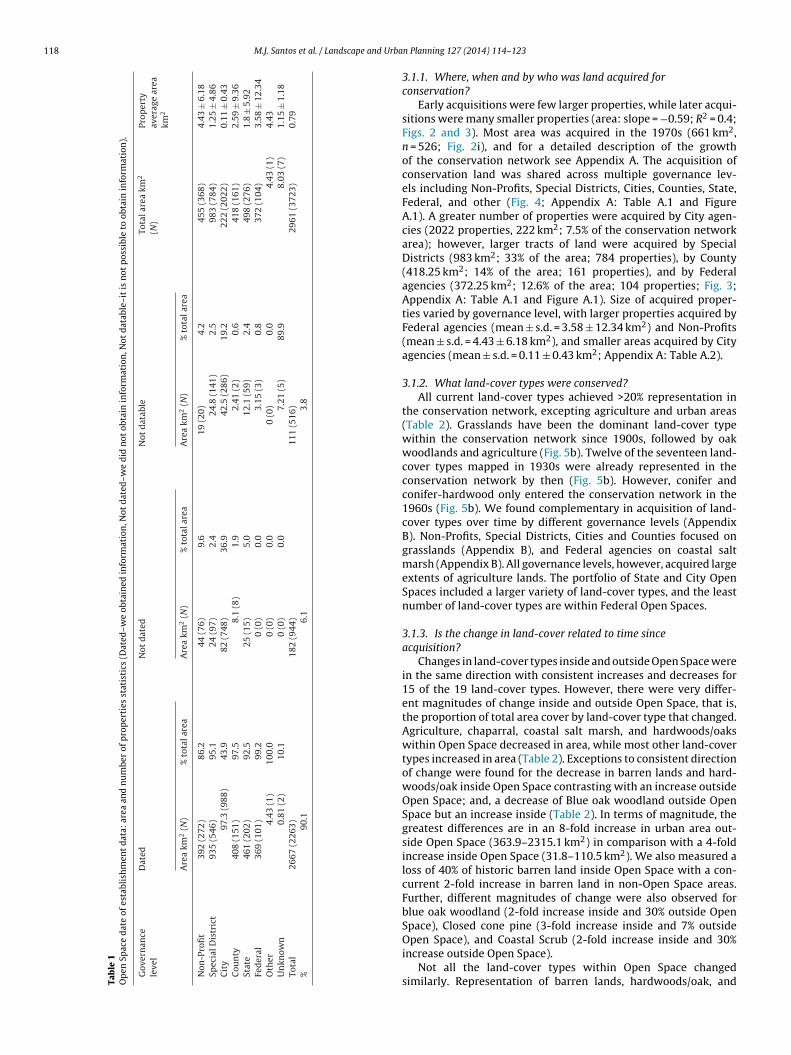
118 M.J. Santos et al. / Landscape and Urba
Tab
le
1O
pen
Spac
e
dat
e
of
esta
blis
hm
ent
dat
a:
area
and
nu
mbe
r
of
pro
per
ties
stat
isti
cs
(Dat
ed–w
e
obta
ined
info
rmat
ion
, Not
dat
ed–w
e
did
not
obta
in
info
rmat
ion
, Not
dat
able
–it
is
not
pos
sibl
e
to
obta
in
info
rmat
ion
).
Gov
ern
ance
leve
lD
ated
Not
dat
ed
Not
dat
able
Tota
l are
a
km2
(N)
Prop
erty
aver
age
area
km2
Are
a
km2
(N)
%
tota
l are
aA
rea
km2
(N)
%
tota
l are
aA
rea
km2
(N)
%
tota
l are
a
Non
-Pro
fit
392
(272
)
86.2
44
(76)
9.6
19
(20)
4.2
455
(368
)
4.43
±
6.18
Spec
ial D
istr
ict
935
(546
)
95.1
24
(97)
2.4
24.8
(141
)
2.5
983
(784
)
1.25
±
4.86
Cit
y
97.3
(988
)
43.9
82
(748
)
36.9
42.5
(286
)
19.2
222
(202
2)
0.11
±
0.43
Cou
nty
408
(151
)
97.5
8.1
(8)
1.9
2.41
(2)
0.6
418
(161
)
2.59
±
9.36
Stat
e
461
(202
)
92.5
25
(15)
5.0
12.1
(59)
2.4
498
(276
)
1.8
±
5.92
Fed
eral
369
(101
)
99.2
0
(0)
0.0
3.15
(3)
0.8
372
(104
)
3.58
±
12.3
4O
ther
4.43
(1)
100.
0
0
(0)
0.0
0
(0)
0.0
4.43
(1)
4.43
Un
know
n
0.81
(2)
10.1
0
(0)
0.0
7.21
(5)
89.9
8.03
(7)
1.15
±
1.18
Tota
l
2667
(226
3)
182
(944
)
111
(516
)
2961
(372
3)
0.79
%
90.1
6.1
3.8
n Planning 127 (2014) 114–123
3.1.1. Where, when and by who was land acquired forconservation?
Early acquisitions were few larger properties, while later acqui-sitions were many smaller properties (area: slope = −0.59; R2 = 0.4;Figs. 2 and 3). Most area was acquired in the 1970s (661 km2,n = 526; Fig. 2i), and for a detailed description of the growthof the conservation network see Appendix A. The acquisition ofconservation land was shared across multiple governance lev-els including Non-Profits, Special Districts, Cities, Counties, State,Federal, and other (Fig. 4; Appendix A: Table A.1 and FigureA.1). A greater number of properties were acquired by City agen-cies (2022 properties, 222 km2; 7.5% of the conservation networkarea); however, larger tracts of land were acquired by SpecialDistricts (983 km2; 33% of the area; 784 properties), by County(418.25 km2; 14% of the area; 161 properties), and by Federalagencies (372.25 km2; 12.6% of the area; 104 properties; Fig. 3;Appendix A: Table A.1 and Figure A.1). Size of acquired proper-ties varied by governance level, with larger properties acquired byFederal agencies (mean ± s.d. = 3.58 ± 12.34 km2) and Non-Profits(mean ± s.d. = 4.43 ± 6.18 km2), and smaller areas acquired by Cityagencies (mean ± s.d. = 0.11 ± 0.43 km2; Appendix A: Table A.2).
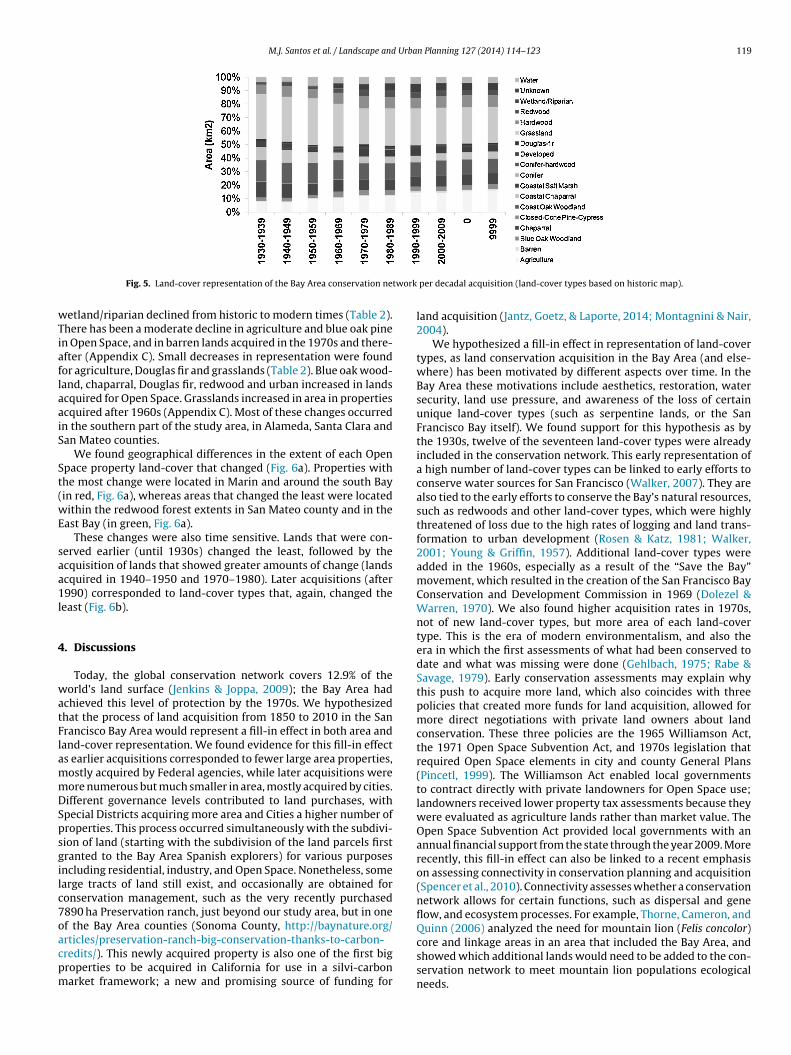
3.1.2. What land-cover types were conserved?All current land-cover types achieved >20% representation in
the conservation network, excepting agriculture and urban areas(Table 2). Grasslands have been the dominant land-cover typewithin the conservation network since 1900s, followed by oakwoodlands and agriculture (Fig. 5b). Twelve of the seventeen land-cover types mapped in 1930s were already represented in theconservation network by then (Fig. 5b). However, conifer andconifer-hardwood only entered the conservation network in the1960s (Fig. 5b). We found complementary in acquisition of land-cover types over time by different governance levels (AppendixB). Non-Profits, Special Districts, Cities and Counties focused ongrasslands (Appendix B), and Federal agencies on coastal saltmarsh (Appendix B). All governance levels, however, acquired largeextents of agriculture lands. The portfolio of State and City OpenSpaces included a larger variety of land-cover types, and the leastnumber of land-cover types are within Federal Open Spaces.
3.1.3. Is the change in land-cover related to time sinceacquisition?
Changes in land-cover types inside and outside Open Space werein the same direction with consistent increases and decreases for15 of the 19 land-cover types. However, there were very differ-ent magnitudes of change inside and outside Open Space, that is,the proportion of total area cover by land-cover type that changed.Agriculture, chaparral, coastal salt marsh, and hardwoods/oakswithin Open Space decreased in area, while most other land-covertypes increased in area (Table 2). Exceptions to consistent directionof change were found for the decrease in barren lands and hard-woods/oak inside Open Space contrasting with an increase outsideOpen Space; and, a decrease of Blue oak woodland outside OpenSpace but an increase inside (Table 2). In terms of magnitude, thegreatest differences are in an 8-fold increase in urban area out-side Open Space (363.9–2315.1 km2) in comparison with a 4-foldincrease inside Open Space (31.8–110.5 km2). We also measured aloss of 40% of historic barren land inside Open Space with a con-current 2-fold increase in barren land in non-Open Space areas.Further, different magnitudes of change were also observed forblue oak woodland (2-fold increase inside and 30% outside OpenSpace), Closed cone pine (3-fold increase inside and 7% outside
Open Space), and Coastal Scrub (2-fold increase inside and 30%increase outside Open Space).Not all the land-cover types within Open Space changedsimilarly. Representation of barren lands, hardwoods/oak, and
M.J. Santos et al. / Landscape and Urban Planning 127 (2014) 114–123 119
twork
wTiaflaaiS
St(wE
saa1l
4
watFlammDSpsgilc7oacpm
Fig. 5. Land-cover representation of the Bay Area conservation ne
etland/riparian declined from historic to modern times (Table 2).here has been a moderate decline in agriculture and blue oak pinen Open Space, and in barren lands acquired in the 1970s and there-fter (Appendix C). Small decreases in representation were foundor agriculture, Douglas fir and grasslands (Table 2). Blue oak wood-and, chaparral, Douglas fir, redwood and urban increased in landscquired for Open Space. Grasslands increased in area in propertiescquired after 1960s (Appendix C). Most of these changes occurredn the southern part of the study area, in Alameda, Santa Clara andan Mateo counties.
We found geographical differences in the extent of each Openpace property land-cover that changed (Fig. 6a). Properties withhe most change were located in Marin and around the south Bayin red, Fig. 6a), whereas areas that changed the least were locatedithin the redwood forest extents in San Mateo county and in the
ast Bay (in green, Fig. 6a).These changes were also time sensitive. Lands that were con-
erved earlier (until 1930s) changed the least, followed by thecquisition of lands that showed greater amounts of change (landscquired in 1940–1950 and 1970–1980). Later acquisitions (after990) corresponded to land-cover types that, again, changed the
east (Fig. 6b).
. Discussions
Today, the global conservation network covers 12.9% of theorld’s land surface (Jenkins & Joppa, 2009); the Bay Area had
chieved this level of protection by the 1970s. We hypothesizedhat the process of land acquisition from 1850 to 2010 in the Sanrancisco Bay Area would represent a fill-in effect in both area andand-cover representation. We found evidence for this fill-in effects earlier acquisitions corresponded to fewer large area properties,ostly acquired by Federal agencies, while later acquisitions wereore numerous but much smaller in area, mostly acquired by cities.ifferent governance levels contributed to land purchases, withpecial Districts acquiring more area and Cities a higher number ofroperties. This process occurred simultaneously with the subdivi-ion of land (starting with the subdivision of the land parcels firstranted to the Bay Area Spanish explorers) for various purposesncluding residential, industry, and Open Space. Nonetheless, somearge tracts of land still exist, and occasionally are obtained foronservation management, such as the very recently purchased890 ha Preservation ranch, just beyond our study area, but in onef the Bay Area counties (Sonoma County, http://baynature.org/
rticles/preservation-ranch-big-conservation-thanks-to-carbon-redits/). This newly acquired property is also one of the first bigroperties to be acquired in California for use in a silvi-carbonarket framework; a new and promising source of funding forper decadal acquisition (land-cover types based on historic map).
land acquisition (Jantz, Goetz, & Laporte, 2014; Montagnini & Nair,2004).
We hypothesized a fill-in effect in representation of land-covertypes, as land conservation acquisition in the Bay Area (and else-where) has been motivated by different aspects over time. In theBay Area these motivations include aesthetics, restoration, watersecurity, land use pressure, and awareness of the loss of certainunique land-cover types (such as serpentine lands, or the SanFrancisco Bay itself). We found support for this hypothesis as bythe 1930s, twelve of the seventeen land-cover types were alreadyincluded in the conservation network. This early representation ofa high number of land-cover types can be linked to early efforts toconserve water sources for San Francisco (Walker, 2007). They arealso tied to the early efforts to conserve the Bay’s natural resources,such as redwoods and other land-cover types, which were highlythreatened of loss due to the high rates of logging and land trans-formation to urban development (Rosen & Katz, 1981; Walker,2001; Young & Griffin, 1957). Additional land-cover types wereadded in the 1960s, especially as a result of the “Save the Bay”movement, which resulted in the creation of the San Francisco BayConservation and Development Commission in 1969 (Dolezel &Warren, 1970). We also found higher acquisition rates in 1970s,not of new land-cover types, but more area of each land-covertype. This is the era of modern environmentalism, and also theera in which the first assessments of what had been conserved todate and what was missing were done (Gehlbach, 1975; Rabe &Savage, 1979). Early conservation assessments may explain whythis push to acquire more land, which also coincides with threepolicies that created more funds for land acquisition, allowed formore direct negotiations with private land owners about landconservation. These three policies are the 1965 Williamson Act,the 1971 Open Space Subvention Act, and 1970s legislation thatrequired Open Space elements in city and county General Plans(Pincetl, 1999). The Williamson Act enabled local governmentsto contract directly with private landowners for Open Space use;landowners received lower property tax assessments because theywere evaluated as agriculture lands rather than market value. TheOpen Space Subvention Act provided local governments with anannual financial support from the state through the year 2009. Morerecently, this fill-in effect can also be linked to a recent emphasison assessing connectivity in conservation planning and acquisition(Spencer et al., 2010). Connectivity assesses whether a conservationnetwork allows for certain functions, such as dispersal and geneflow, and ecosystem processes. For example, Thorne, Cameron, andQuinn (2006) analyzed the need for mountain lion (Felis concolor)core and linkage areas in an area that included the Bay Area, and
showed which additional lands would need to be added to the con-servation network to meet mountain lion populations ecologicalneeds.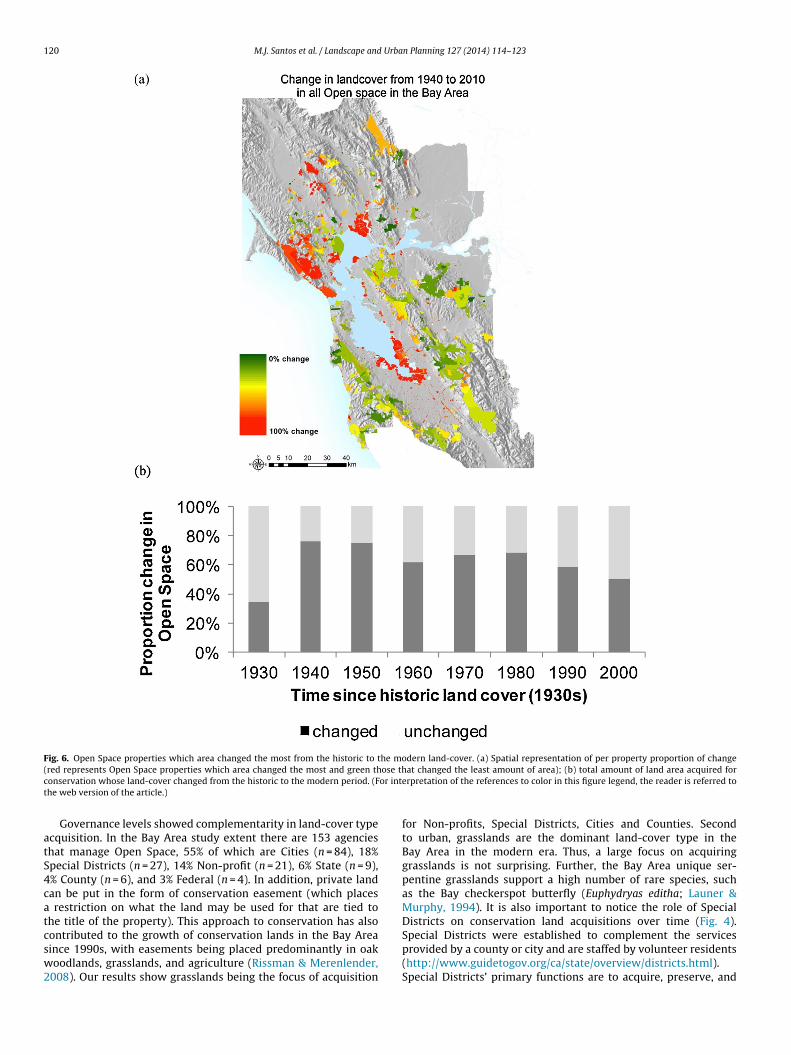
120 M.J. Santos et al. / Landscape and Urban Planning 127 (2014) 114–123
Fig. 6. Open Space properties which area changed the most from the historic to the modern land-cover. (a) Spatial representation of per property proportion of change( ose thc or intt
atS4catcsw2
red represents Open Space properties which area changed the most and green thonservation whose land-cover changed from the historic to the modern period. (Fhe web version of the article.)
Governance levels showed complementarity in land-cover typecquisition. In the Bay Area study extent there are 153 agencieshat manage Open Space, 55% of which are Cities (n = 84), 18%pecial Districts (n = 27), 14% Non-profit (n = 21), 6% State (n = 9),% County (n = 6), and 3% Federal (n = 4). In addition, private landan be put in the form of conservation easement (which places
restriction on what the land may be used for that are tied tohe title of the property). This approach to conservation has also
ontributed to the growth of conservation lands in the Bay Areaince 1990s, with easements being placed predominantly in oakoodlands, grasslands, and agriculture (Rissman & Merenlender,008). Our results show grasslands being the focus of acquisition
at changed the least amount of area); (b) total amount of land area acquired forerpretation of the references to color in this figure legend, the reader is referred to
for Non-profits, Special Districts, Cities and Counties. Secondto urban, grasslands are the dominant land-cover type in theBay Area in the modern era. Thus, a large focus on acquiringgrasslands is not surprising. Further, the Bay Area unique ser-pentine grasslands support a high number of rare species, suchas the Bay checkerspot butterfly (Euphydryas editha; Launer &Murphy, 1994). It is also important to notice the role of SpecialDistricts on conservation land acquisitions over time (Fig. 4).
Special Districts were established to complement the servicesprovided by a county or city and are staffed by volunteer residents(http://www.guidetogov.org/ca/state/overview/districts.html).Special Districts’ primary functions are to acquire, preserve, and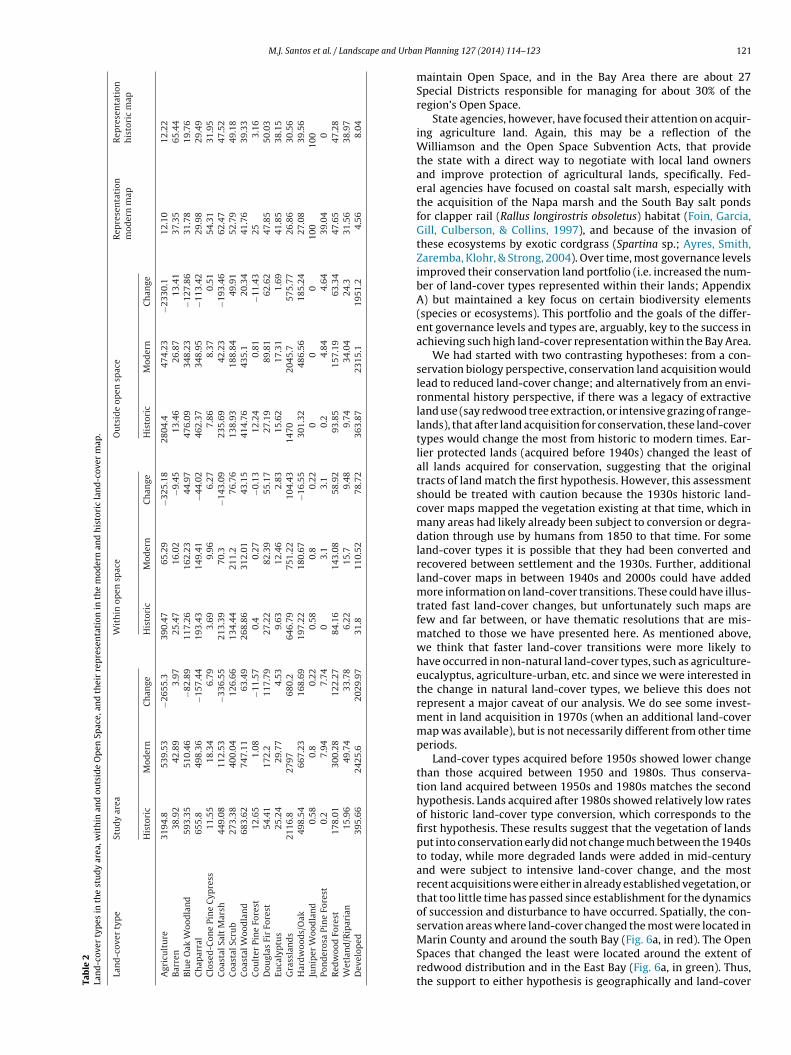
M.J. Santos et al. / Landscape and Urba
Tab
le
2La
nd
-cov
er
typ
es
in
the
stu
dy
area
, wit
hin
and
outs
ide
Op
en
Spac
e,
and
thei
r
rep
rese
nta
tion
in
the
mod
ern
and
his
tori
c
lan
d-c
over
map
.
Lan
d-c
over
typ
e
Stu
dy
area
Wit
hin
open
spac
e
Ou
tsid
e
open
spac
e
Rep
rese
nta
tion
mod
ern
map
Rep
rese
nta
tion
his
tori
c
map
His
tori
c
Mod
ern
Ch
ange
His
tori
c
Mod
ern
Ch
ange
His
tori
c
Mod
ern
Ch
ange
Agr
icu
ltu
re
3194
.853
9.53
−265
5.3
390.
4765
.29
−325
.18
2804
.447
4.23
−233
0.1
12.1
0
12.2
2B
arre
n
38.9
2
42.8
9
3.97
25.4
7
16.0
2
−9.4
5
13.4
6
26.8
7
13.4
1
37.3
5
65.4
4B
lue
Oak
Woo
dla
nd
593.
3551
0.46
−82.
8911
7.26
162.
2344
.97
476.
0934
8.23
−127
.86
31.7
819
.76
Ch
apar
ral
655.
8
498.
36
−157
.44
193.
43
149.
41
−44.
02
462.
37
348.
95
−113
.42
29.9
8
29.4
9C
lose
d-C
one
Pin
e
Cyp
ress
11.5
518
.34
6.79
3.69
9.96
6.27
7.86
8.37
0.51
54.3
131
.95
Coa
stal
Salt
Mar
sh
449.
08
112.
53
−336
.55
213.
39
70.3
−143
.09
235.
69
42.2
3
−193
.46
62.4
7 47
.52
Coa
stal
Scru
b27
3.38
400.
0412
6.66
134.
4421
1.2
76.7
613
8.93
188.
8449
.91
52.7
949
.18
Coa
stal
Woo
dla
nd
683.
6274
7.11
63.4
9
268.
86
312.
01
43.1
5
414.
76
435.
1
20.3
4
41.7
6
39.3
3C
oult
er
Pin
e
Fore
st
12.6
5
1.08
−11.
57
0.4
0.27
−0.1
3
12.2
4
0.81
−11.
43
25
3.16
Dou
glas
Fir
Fore
st54
.41
172.
211
7.79
27.2
2
82.3
9
55.1
7
27.1
9
89.8
1
62.6
2 47
.85
50.0
3Eu
caly
ptu
s
25.2
4
29.7
7
4.53
9.63
12.4
6
2.83
15.6
2
17.3
1
1.69
41.8
5
38.1
5G
rass
lan
ds
2116
.827
97
680.
264
6.79
751.
2210
4.43
1470
2045
.7
575.
77
26.8
6
30.5
6H
ard
woo
ds/
Oak
498.
54
667.
23
168.
69
197.
22
180.
67
−16.
55
301.
32
486.
56
185.
24
27.0
8
39.5
6Ju
nip
er
Woo
dla
nd
0.58
0.8
0.22
0.58
0.8
0.22
0
0
0
100
100
Pon
der
osa
Pin
e
Fore
st
0.2
7.94
7.74
0
3.1
3.1
0.2
4.84
4.64
39.0
4
0R
edw
ood
Fore
st
178.
01
300.
28
122.
27
84.1
6
143.
08
58.9
2
93.8
5
157.
19
63.3
4
47.6
5
47.2
8W
etla
nd
/Rip
aria
n
15.9
649
.74
33.7
8
6.22
15.7
9.48
9.74
34.0
4 24
.3
31.5
6
38.9
7D
evel
oped
395.
66
2425
.6
2029
.97
31.8
110.
52
78.7
2
363.
87
2315
.1
1951
.2
4.56
8.04
n Planning 127 (2014) 114–123 121
maintain Open Space, and in the Bay Area there are about 27Special Districts responsible for managing for about 30% of theregion’s Open Space.
State agencies, however, have focused their attention on acquir-ing agriculture land. Again, this may be a reflection of theWilliamson and the Open Space Subvention Acts, that providethe state with a direct way to negotiate with local land ownersand improve protection of agricultural lands, specifically. Fed-eral agencies have focused on coastal salt marsh, especially withthe acquisition of the Napa marsh and the South Bay salt pondsfor clapper rail (Rallus longirostris obsoletus) habitat (Foin, Garcia,Gill, Culberson, & Collins, 1997), and because of the invasion ofthese ecosystems by exotic cordgrass (Spartina sp.; Ayres, Smith,Zaremba, Klohr, & Strong, 2004). Over time, most governance levelsimproved their conservation land portfolio (i.e. increased the num-ber of land-cover types represented within their lands; AppendixA) but maintained a key focus on certain biodiversity elements(species or ecosystems). This portfolio and the goals of the differ-ent governance levels and types are, arguably, key to the success inachieving such high land-cover representation within the Bay Area.
We had started with two contrasting hypotheses: from a con-servation biology perspective, conservation land acquisition wouldlead to reduced land-cover change; and alternatively from an envi-ronmental history perspective, if there was a legacy of extractiveland use (say redwood tree extraction, or intensive grazing of range-lands), that after land acquisition for conservation, these land-covertypes would change the most from historic to modern times. Ear-lier protected lands (acquired before 1940s) changed the least ofall lands acquired for conservation, suggesting that the originaltracts of land match the first hypothesis. However, this assessmentshould be treated with caution because the 1930s historic land-cover maps mapped the vegetation existing at that time, which inmany areas had likely already been subject to conversion or degra-dation through use by humans from 1850 to that time. For someland-cover types it is possible that they had been converted andrecovered between settlement and the 1930s. Further, additionalland-cover maps in between 1940s and 2000s could have addedmore information on land-cover transitions. These could have illus-trated fast land-cover changes, but unfortunately such maps arefew and far between, or have thematic resolutions that are mis-matched to those we have presented here. As mentioned above,we think that faster land-cover transitions were more likely tohave occurred in non-natural land-cover types, such as agriculture-eucalyptus, agriculture-urban, etc. and since we were interested inthe change in natural land-cover types, we believe this does notrepresent a major caveat of our analysis. We do see some invest-ment in land acquisition in 1970s (when an additional land-covermap was available), but is not necessarily different from other timeperiods.
Land-cover types acquired before 1950s showed lower changethan those acquired between 1950 and 1980s. Thus conserva-tion land acquired between 1950s and 1980s matches the secondhypothesis. Lands acquired after 1980s showed relatively low ratesof historic land-cover type conversion, which corresponds to thefirst hypothesis. These results suggest that the vegetation of landsput into conservation early did not change much between the 1940sto today, while more degraded lands were added in mid-centuryand were subject to intensive land-cover change, and the mostrecent acquisitions were either in already established vegetation, orthat too little time has passed since establishment for the dynamicsof succession and disturbance to have occurred. Spatially, the con-servation areas where land-cover changed the most were located in
Marin County and around the south Bay (Fig. 6a, in red). The OpenSpaces that changed the least were located around the extent ofredwood distribution and in the East Bay (Fig. 6a, in green). Thus,the support to either hypothesis is geographically and land-cover
1 Urba
tltIobhaFciccTtl
5
wflsiigtlftwla
tpticTadtdeTA2yTttst2
tiAbrall
22 M.J. Santos et al. / Landscape and
ype specific. Nonetheless, since the 1930s, we can observe quite aarge amount of land-cover type change, suggesting either restora-ion or natural “succession” leading to changes in land-cover types.n addition to succession, which could be represented by expansionf oak-dominated land-cover types where grazing and logging haseen reduced (Rundel, Montenegro, & Jaksic, 1998), the Bay Areaas a large number of active restoration activities (for example, see
map of active marsh restoration activities on going around the Sanrancisco Bay: http://www.sfbayjv.org/resources.php), which canontribute to the observed patterns of change and to the measuredncreased representation from historic to modern in some land-over types. Also interesting is the return to the acquisition of leasthanged lands later in the timeline of conservation land acquisition.his could correspond to a more systematic approach to selec-ion of lands to preserve that aimed at acquiring underrepresentedands.
. Conclusions
This study shows the growth of the current conservation net-ork in the metropolitan Bay Area through time. We found support
or a fill-in effect both in area and in representation that can beinked to the motivations and policies that resulted in land acqui-ition for conservation. Multiple governance levels and types ofnstitutions were involved in the process, showing complementar-ty in their goals and Open Space land acquisitions, in that differentovernment levels focused on different land-cover type acquisi-ions. Our results also suggest that the magnitude of change amongand-cover types can be greatly diminished after land is acquiredor conservation. A looming challenge for conservation lands inhe Bay Area is to understand how well this conservation networkill conserve biodiversity and other values in light of future chal-
enges, and whether insights from the historical can be used in suchssessments.
The first challenge is the persistence of land-cover conserva-ion goals as climate is predicted to change. Ackerly et al. (2010)redicted that only a selected few of the larger properties inhe Bay area will maintain similar climate ranges as those exist-ng today, and thus current land-cover representation levels mayhange significantly if vegetation shifts in response to climate.he second challenge relates to the persistence of land designateds Open Space, particularly as regards to financing. The recentownturn in the California’s economy has forced, for example,he State Parks system to evaluate the lands they manage andecide how to manage them for the future. Other governance lev-ls have similar sensitivity to financing for ongoing management.he third challenge is the persistence of funding for acquisition.s mentioned above, the Open Space Subvention Act ended in009. There have not been subvention payments in the last 3ears; however, in 2011 the Assembly Bill 1265 was approved.his bill allowed eligible counties to re-gain 10% of the propertyaxes given to their Williamson Act land owners, by shorteninghe contract length. Further, new funding sources are emerging,uch as those from carbon markets and payments for ecosys-em services, which can contribute to conservation (Thomas et al.,013).
Future conservation decisions are not independent of the his-ory of the conservation practice, as conservation in any decades influenced by what has already been accomplished. In the Bayrea, the historical complementarity of land-cover type acquisitiony different government bodies suggests that a multi-government
esponse to new climate and management challenges could beframework that produces positive results. The documentedower rates of change among landcover types on the protectedands also provides motivation to potentially continue to place
n Planning 127 (2014) 114–123
conservation obligations on other lands, with the thought thatthese may provide a longer-term stability to the Bay Area’secosystems and ecosystem services such as groundwater infiltra-tion.
Reconstruction of conservation histories has potential benefitsat multiple scales, and in multiple geographies, and should not berestricted to only our study area. The framework we present herecan, and should, be applied to other geographies and conservationstrategies (for example areas with community based conservation).Comparing and contrasting results from this and other conserva-tion geographies and history may shed light on whether a differentset of conservation measures has resulted in similar biodiversityrepresentation goals.
Acknowledgements
This research was funded by the Spatial History Project (Wallen-berg Foundation) and the Bill Lane Center for the American Westat Stanford University.
Appendix A. Supplementary data
Supplementary data associated with this article can befound, in the online version, at http://dx.doi.org/10.1016/j.landurbplan.2014.04.011.
References
Ackerly, D. D., Loarie, S. R., Cornwell, W. K., Weiss, S. B., Hamilton, H., Bran-ciforte, R., et al. (2010). The geography of climate change: Implicationsfor conservation biogeography. Diversity and Distributions, 16, 476–487.http://dx.doi.org/10.1111/j.1472-4642.2010.00654.x
Austin, M. P., & Margules, C. R. (1986). In M. B. Usher (Ed.), Wildlife ConservationEvaluation (pp. 45–67). London: Chapman & Hall.
Ayres, D. R., Smith, D. L., Zaremba, K., Klohr, S., & Strong, D. R. (2004).Spread of exotic cordgrasses and hybrids (Spartina sp.) in the tidal marshesof San Francisco Bay, California, USA. Biological Invasions, 6, 221–231.http://dx.doi.org/10.1023/B:BINV.0000022140.07404.b7
Bay Area Upland Habitat Goals – BAUHG. (2011). Bay Area Open Space Council, Berke-ley, California. Available:. http://www.bayarealands.org/reports
Cowling, R. M., Pressey, R. L., Lombard, A. T., Desmet, P. G., & Ellis, A. G. (1999). Fromrepresentation to persistence: Requirements for a sustainable reserve system inthe species-rich Mediterranean-climate deserts of southern Africa. Diversity andDistributions, 5, 51–71. http://dx.doi.org/10.1046/j.1472-4642.1999.00038.x
Czech, B. (2004). A transdisciplinary approach to conservation land acqui-sition. Conservation Biology, 16, 1488–1497. http://dx.doi.org/10.1046/j.1523-1739.2002.01046.x
Dolezel, J. M., & Warren, B. N. (1970). Saving San Francisco Bay: A case study inenvironmental legislation. Stanford Law Review, 23, 349–366.
Foin, T. C., Garcia, E. J., Gill, R. E., Culberson, S. D., & Collins, J. N. (1997). Recov-ery strategies for the California clapper rail (Rallus longirostris obsoletus) inthe heavily-urbanized San Francisco estuarine ecosystem. Landscape and UrbanPlanning, 38, 229–243. http://dx.doi.org/10.1016/S0169-2046(97)00036-4
Gehlbach, F. R. (1975). Investigation, evaluation, and priority ranking ofnatural areas. Biological Conservation, 8, 79–88. http://dx.doi.org/10.1016/0006-3207(75)90033-6
Grantham, H. S., Bode, M., McDonald-Madden, E., Game, E. T., Knight, A. T.,& Possingham, H. P. (2010). Effective conservation planning requires learn-ing and adaptation. Frontiers in Ecology and The Environment, 8, 431–437.http://dx.doi.org/10.1890/080151
GreenInfo Network. (2013). Bay Area protected Areas Database – BPAD.http://www.openspacecouncil.org/programs/index.php?program=6
Heller, N. E., & Zavaleta, E. S. (2012). Biodiversity management in the face of climatechange: A review of 22 years of recommendations. Biological Conservation, 142,14–32. http://dx.doi.org/10.1016/j.biocon.2008.10.006
IUCN, & UNEP-WCMC. (2013). The World Database on Protected Areas (WDPA) [on-line]. Cambridge, UK: UNEP-WCMC. Available at: www.protectedplanet.net[accessed 20.11.13]
Jantz, P., Goetz, S., & Laporte, N. (2014). Carbon stock corridors to mitigate cli-mate change and promote biodiversity in the tropics. Nature Climate Change,4, 138–142. http://dx.doi.org/10.1038/nclimate2105
Jenkins, C. N., & Joppa, L. (2009). Expansion of the global terrestrial pro-
tected area system. Biological Conservation, 142, 2166–2174. http://dx.doi.org/10.1016/j.biocon.2009.04.016Kirkpatrick, J. B. (1983). An iterative method for establishing priorities for the selec-tion of nature reserves: An example from Tasmania. Biological Conservation, 25,127–134. http://dx.doi.org/10.1016/0006-3207(83)90056-3
Urba
K
K
K
L
M
M
M
P
R
R
R
M.J. Santos et al. / Landscape and
night, A. T., Cowling, R. M., Rouget, M., Balmford, A., Lombard, A. T., & Camp-bell, B. M. (2008). Knowing but not doing: Selecting priority conservationareas and the research–implementation gap. Conservation Biology, 22, 610–617.http://dx.doi.org/10.1111/j.1523-1739.2008.00914.x
night, A. T., Rodrigues, A. S. L., Strange, N., Tew, T., & Wilson, K. A. (2013). Designingeffective solutions to conservation planning problems. In D. W. Macdonald, & K.J. Willis (Eds.), Key Topics in Conservation Biology (Vol. 2). John Willey and Sons,Ltd.
ujala, H., Moilanen, A., Araújo, M. B., & Cabeza, M. (2013). Conservation plan-ning with uncertain climate change projections. PLoS ONE, 8(2), e53315.http://dx.doi.org/10.1371/journal.pone.0053315
auner, A. E., & Murphy, D. D. (1994). Umbrella species and the conservation ofhabitat fragments: A case of a threatened butterfly and a vanishing grass-land ecosystem. Biological Conservation, 69, 145–153. http://dx.doi.org/10.1016/0006-3207(94)90054-X
argules, C. R., & Pressey, R. L. (2000). Systematic conservation planning. Nature,405, 243–253. http://dx.doi.org/10.1038/35012251
eir, E., Andelman, S., & Possingham, H. P. (2004). Does conservation plan-ning matter in a dynamic and uncertain world? Ecology Letters, 7, 615–622.http://dx.doi.org/10.1111/j.1461-0248.2004.00624.x
ontagnini, F., & Nair, P. K. R. (2004). Carbon sequestration: An underexploited envi-ronmental benefit of agroforestry systems. Agroforestry Systems, 61, 281–295.http://dx.doi.org/10.1023/B:AGFO. 0000029005.92691.79
incetl, S. (1999). Transforming California, the political history of land use in the state.Baltimore: Johns Hopkins University Press.
abe, F. W., & Savage, N. L. (1979). A methodology for the selection of aquaticnatural areas. Biological Conservation, 15, 291–300. http://dx.doi.org/10.1016/0006-3207(79)90050-8
adeloff, V. C., Beaudry, F., Brooks, T. M., Butsic, V., Dubinin, M., Kuermmerle, T.,et al. (2013). Hot moments for biodiversity conservation. Conservation Letters, 6,
58–66. http://dx.doi.org/10.1111/j.1755-263X. 2012.00290.xissman, A. R., & Merenlender, A. M. (2008). The conservation contributions of con-servation easements: Analysis of the San Francisco Bay Area protected landsspatial database. Ecology and Society, 13, 40. http://www.ecologyandsociety.org/vol13/iss1/art40/
n Planning 127 (2014) 114–123 123
Rosen, K. T., & Katz, L. F. (1981). Growth management and land use controls:The San Francisco Bay Area experience. Real Estate Economics, 9(4), 321–344.http://dx.doi.org/10.1111/1540-6229.00247
Rundel, P. W., Montenegro, G., & Jaksic, F. M. (1998). Landscape disturbance andbiodiversity in Mediterranean-type ecosystems. London: Springer.
Spencer, W. D., Beier, P., Penrod, K., Winters, K., Paulman, C., Rustigian-Romsos,H., et al. (2010). California Essential Habitat Connectivity Project: A strategy forconserving a connected California. CA, USA: California Department of Trans-portation, California Department of Fish and Game, and Federal HighwaysCommission.
Szabó, P., & Hédl, R. (2011). Advancing the integration of history and ecologyfor conservation. Conservation Biology, 25, 680–687. http://dx.doi.org/10.1111/j.1523-1739.2011.01710.x
Thomas, C. D., Anderson, B. J., Moilanen, A., Eigenbrod, F., Heinemeyer, A., Quaife, T.,et al. (2013). Reconciling biodiversity and carbon conservation. Ecology Letters,16, 39–47. http://dx.doi.org/10.1111/ele.12054
Thorne, J. H., Cameron, D., & Quinn, J. F. (2006). A conservation design forthe central coast of California and the evaluation of mountain lion asan umbrella species. Natural Areas Journal, 26, 137–148, doi:10.3375/0885-8608(2006)26[137:ACDFTC]2.0.CO;2.
Thorne, J. H., Morgan, B. J., & Kennedy, J. A. (2008). Vegetation change over 60years in the Central Sierra Nevada. Madrono, 55, 223–237. http://dx.doi.org/10.3120/0024-9637-55.3.223
Thorne, J. H., Santos, M. J., & Bjorkman, J. (2013). Regional Assessment of urbanimpacts on landcover and open space finds a smart urban growth policyperforms little better than business as usual. PLoS ONE, http://dx.doi.org/10.1371/journal.pone.0065258
Walker, R. (2001). Industry builds the city: The suburbanization of manufacturingin the San Francisco Bay Area, 1850–1940. Journal of Historical Geography, 27,36–57. http://dx.doi.org/10.1006/jhge.2000.0268
Walker, R. (2007). The country in the city: The greening of the San Francisco Bay Area.University of Washington Press.
Wieslander, A. E. (1935). A vegetation type map for California. Madrono, 3, 140–144.Young, R. N., & Griffin, P. F. (1957). Recent land-use changes in the San Francisco Bay
Area. Geographical Review, 47, 396–405. http://dx.doi.org/10.2307/212013