Embed Size (px)
Citation preview
Digital Commons @ George Fox UniversityFaculty Publications - Grad School of ClinicalPsychology Graduate School of Clinical Psychology
11-1996
An Exploratory Factor Analysis of the Leiter-RMike Bay
Follow this and additional works at: http://digitalcommons.georgefox.edu/gscp_facPart of the Cognitive Psychology Commons
This Dissertation is brought to you for free and open access by the Graduate School of Clinical Psychology at Digital Commons @ George FoxUniversity. It has been accepted for inclusion in Faculty Publications - Grad School of Clinical Psychology by an authorized administrator of DigitalCommons @ George Fox University.
Recommended CitationBay, Mike, "An Exploratory Factor Analysis of the Leiter-R" (1996). Faculty Publications - Grad School of Clinical Psychology. Paper 66.http://digitalcommons.georgefox.edu/gscp_fac/66

An Exploratory Factor Analysis o f the Leiter-R
by
Mi ke Bay
Pres ented to the Faculty of
George Fox Univers ity
i n partial ful f i l lment
of the requi rements for the degree o f
Doctor o f Psychology
i n Clinical Psychology
Newber g , Oregon
November 1 5 , 1 9 9 6
MURDOCK LE/\Rf'm�:G RESOUF!CE CENTER GEJJFtGE FOX Ul'llVEHSiTY NEWBERG, CCtEGON 97132

Leiter-R Facto r Ana l y s i s i i
Approval
An Exploratory Factor Anal y s i s o f the Leiter-R
S i gnature s :
Committee Chai r
Date : --'-4----!.f d_L_9.:.__:_1r ----'--J _
by
Mi ke Bay
Vice President for
Academic Affairs
Date : 'l-2. 2 -&>; 1

Leiter-R Factor Ana l y s i s i i i
A n Exploratory Factor Analys i s of t h e Leiter-R
Mi ke Bay
George Fox College
Newber g , Oregon
Abs t ract
Cognitive a s s e s sment is an important domain in ps ychology .
The development o f nonve rbal cognitive a s s e s sment devices has
been spurred by the increas ingly multicultural nature o f U . S .
society and by legi s l ation cal ling for early identi fi cation and
treatment of chi l dren with cognitive di s abi l i t i e s . The Leiter-R
is a non-verbal test o f intell i gence des i gned chi e f l y for use
with language- and cognitively-impa i red persons a ged 2 -2 1 .
Exploratory factor analys i s ( E FA ) of the Leiter-R was
undertaken i n an e ffort to ( a ) identi fy the factor s t ructure o f
the Leiter-R, ( b ) v e r i f y general visua l i zat ion ( Gv ) and fluid
reasoning ( Gf ) as s econd-level factors i n the Leiter-R, and ( c )
examine evidence for the hypothe s i s that cognitive abi l i t i e s
become increas ingly di f ferentiated with age .
The E FA revealed a strong g influence i n the Leiter-R, with
one- factor model s predominating i n each age group studied .

Leiter-R Factor Ana l ys i s iv
General- factor l oadings of four core Leiter-R subte s t s ( those
subt e s t s common to all age groups ) indicated subtests vary in how
wel l they measure g among di f ferent age groups . Overa l l , thes e
results a r e judged to support the Leiter-R a s a g t e s t o f
intel l i gence .
I n contrast to the f indings of other researchers ( Bos , 1 9 9 5 ;
Bos , Gridle y , & Roi d , 1 9 9 6 ) , only modest evidence was found to
ver i f y Gf and Gv a s second-level factors i n the Leiter-R .
However , analyses o f certain age groups of fered s ome evidence of
a two-factor s tructure . Thi s evidence offered support for the
Leiter-R ' s theoretical s t ructure , with separate Gf and Gv factors
in the 2 - 5 age g roup and a distinct spati a l v i s ua l i zation factor
emerging in the 6 - 1 0 and 1 1 - 2 1 age groups . Little conclusive
evidence wa s found for o r against the age di f f e rentiation
hypothe s i s .
Limi tations o f the present s tudy were noted , most
important l y that not including a l l Leiter-R subtes t s i n the
analys i s , which wa s done for stat i stical reasons , may have made
it more di fficult to extract factor structure . I deas for future
resea rch were presented . At the time of thi s writing , research
related to the Leiter-R is ongoing . Final factor analyses o f the
Leiter-R- -u s i ng the l arger final normative s amp le , including
memory and attention subtests , and perhaps u s ing hierarchical
factor analytic methods - -may help further reveal characteristics
o f the Leiter-R ' s factor s t ructure .

Leiter-R Factor Ana l y s i s v
Approval
Abstract
Table o f Contents
List of Tables
List o f Figure s
Chapter 1 I nt roduction
Pertinent I s sues i n Inte l l i gence Theory
General and Speci fic Abi l ities
Spearman and g theory
Thurstone and s theory
Controve r s y and coming together
Fluid and Crys t a l l i zed Intel l i gence
The Hierarchical View of Int e l l igence
Age Di f ferentiation / Dedi f ferentiation
I nte l l i gence Testing
I ntel l i gence Testing for General Populations
I nt e l l i gence Testing for Special Populat i ons
The Leiter T e s t s
The Original Leiter
Hi story
Rel iabi l i t y
Val idity
The Leiter-R
Rat iona l e for the Leiter-R
ii
i i i
ix
xi
1
2
2
3
3
4
5
7
8
9
1 0
1 2
1 4
1 4
1 4
1 4
1 5
1 5
1 5

Leiter-R Factor Anal ys i s vi
Norms
Theoreti cal foundation
Research
Research Ques t i ons
Chapter 2 Methods
Procedures
Subjects
Examiners
Age Groupings
Instrument
Stat i s t ical Des i gn
Factor Ana l ys i s
Determining the Number o f Factors
Chi- s quare test
E i genvalues
S cree plot
Recka s e ratio
Determining Which Factor ( s ) a Subte s t Represents
Factor Analys i s _Software
Summary
Chapter 3 Re sults
Factor Ana l ys i s of 1 4 Age Groups
Factor Structure for 1 4 Age Groups
Subt e s t Loadings on General Factor
Acros s Age Groups
1 6
1 6
1 9
2 1
2 2
2 2
2 2
2 6
2 6
2 9
32
32
3 3
3 3
3 4
3 4
3 4
3 5
3 6
3 6
3 7
3 7
3 7
4 0

Leiter-R Factor Ana l ys i s vii
Factor Ana l y s i s o f Three Larger Age Groups 4 4
Overall E FA Re sults for Three Larger Age Groups 4 4
Chi- s quare 4 4
E igenvalues 4 6
S cree plots 4 7
Recka s e ratio 4 9
S ummary 5 0
Specific Factor Information for Three Larger
Age Groups
Age s 2 - 5
Age s 6 - 1 0
Ages 1 1 - 2 1
Des i gn Ana l ogies Subtest
Summary
Chapter 4 D i s cu s s i on
Research Ques t i on 1 : Exploration of Leiter-R
5 1
5 1
5 3
5 4
5 6
5 7
5 8
Factor S t ructure 5 8
A Strong g Influence 5 8
E FA Impl ication� for Four Core Leiter-R Subt e s t s 60
Research Que s tion 2 : Ver i f i cation of Gf and Gv in
the Leiter-R
Evidence for Gf and Gv in the Leiter-R
Evidence for a Spati a l Vi sua l i z at i on Factor i n
the Leiter-R
De s i gn Analogies Subtest
62
62
6 4
6 7

Leiter-R Factor Anal ysi s
Re search Que stion 3 : Implications for the
Age Di f fe rentiation Hypothesis
Limitations o f the Study
Ideas for Future Re search
Summary
Re ference s
Appendix A :
Appendix B :
Appendix C :
Sample S P S S S yntax Commands for E FA
Raw Data from All E FAs
Vita
vi ii
6 7
6 9
7 0
7 1
7 4
8 1
8 3
1 0 4

Leiter-R Factor Analy s i s i x
List of Tables
Table 1 Leiter-R Standardi zation Sample : Demographic
Variables . . . . . . . . . . . . .
Table 2 Leiter-R S ubt e s t s in Three Larger Age Groups
Table 3 Internal Con s i stency Rel i abil ity for Leiter-R
Subtests . . . . . . . . . . . . . . . . .
Table 4 Unidimens iona l i t y of Four Core Subte s t s by Age
Table 5 Loadings on General Factor for Four Core Subt e s t s
by Age . . . . . . . . . . . . . . . . . . . . . .
Table 6 Des criptive Statistics for Loadings on General
Factor o f Four Core Subtests Acros s Age Groups
Table 7 Compar i s ons in Mean Factor Loadings on General
2 4
2 8
3 1
3 9
4 0
4 1
Factor for Four Core Subtests in Two Age Categories 4 3
Table 8 Number o f Factors i n Maj or Age Groups : Results
o f Chi-S quare 4 5
Table 9 E igenvalues for Three Maj or Age Groups 4 6
Table 1 0 Unidimens iona l i t y of Leiter-R Subt e s t s for Each
Maj or Age Group 4 9
Table 1 1 Number o f Factors in Maj or Age Groups by
Chi - S quare , S cree , and Eigenvalue Criteria 5 0
Table 12 Two- Factor Model for 2 - 5 Age Group 5 2
Table 1 3 Two- Factor Model for 6 - 1 0 Age Group 5 3
Table 1 4 Two - Factor Model for 1 1 - 2 1 Age Group 5 5

Leiter-R Factor Analy s i s x
Table 1 5 Gener a l - Factor Loadings for Leiter-R Subt e s t s
i n Two Age Groups . . . . . . . . . . . . . . . . . 5 6

Leiter-R Factor Ana l y s i s x i
L i s t o f Figures
Figure 1 Hierarchical S t ructure of the Leiter-R
Figure 2 Scree Plot : Ages 2 - 5
18
48
Leiter-R Factor Anal y s i s 1
Chapter 1
Introduction
The importance of cognitive a s s e s sment was noted by Carroll
( 1 9 9 3 ) , who cited research linking di f ference s in cognitive
abil i t i e s to such realms as educational achievement , occupational
status , and criminal act ivity . L i kewi s e , S now ( 1 9 8 2 ) called
i ntel l igence the most important product of educati on a s well a s
its most important r a w material . Nonverbal cogn i t i ve a s s e s sment
repre sents an important branch of the cognitive a s s e s sment field .
The development and refinement of nonverbal instruments has been
spurred by the need for early identi fication and t reatment of
cognitively di s abled children under the Individual s with
Disabi l i t i e s Education Act ( I DEA ) , as well as by the increas ingly
multicultural ma ke-up o f American society ( Roid , 1 9 9 6 ) . Within
the field o f nonverbal cognitive as s e s sment , researchers are
continuing the i r e f forts to more clearly define , unde rstand , and
measure the various factors that comprise nonverbal cognitive
abi l i t ie s .
The present paper will examine the factor s tructure o f a
nonverbal cogn i t i ve a s s e s sment instrument , the Leiter
International Per formance scale-Revi sed ( Leiter-R ) . To set the
stage for such an examination , it is first nece s sary to explore

Leiter-R Factor Ana l ys i s 2
pertinent i s sues in intel l igence theory and t e s t ing . Thi s
introductory sect i on f i r s t outl ines relevant i s sues i n
intel l igence theory . Next , intelligence testing f o r general and
special popul ations i s di scu s sed . Final ly , the Leiter t e s t s are
detailed , followed by a statement o f the research que stions .
Pertinent I s sues in Intelligence Theory
Thi s sect ion wil l explore several maj or concept s in
intel l i gence theory that are relevant to this pape r . The
following topi cs will be d i s cus sed in turn: general and speci f i c
abi l itie s , f l u i d and crystal l i zed intelligence , hierarchical
views o f int e l l i gence , and the age di f ferentiation and
dedi f ferentiation hypothes e s .
General and Spe c i f i c Abi lities
One o f the foremost i s sues i n the field o f intel l i gence
theory and t e s t ing is general and specific mental abil i t i e s . At
i s sue i s whether human intellectual abi lities are best
conceptuali zed ( and tested ) as an over-arching general abi l ity
(g ) or a s a number o f separate and distinct abi l i t i e s ( s ) .
Although many people contributed to the dialogue over general and
speci f i c abiliti e s , this pape r will frame the i s sue using two
person s - -Charles Spearman and Louis Thurstone--who were among the
most promi nent contributors to the hi storical dialogue and whos e
views quite c l e a r l y repres ent the general and speci fic camps ,
re spective l y .
Leiter-R Factor Anal ys i s 3
Spearman and g theory . Charles Spearman ( 1 9 2 7 ) i s probably
the person mos t indel ibly linked in psychology ' s hi story to the g
theory of intell i gence . Spearman was a pioneer i n the factor
analyt i c approach to intel l igence ( Sattl e r , 1 9 92 ) . Just a fter
the turn o f the century , he introduced a two- factor theory o f
int e l l i gence comprised o f an overarching general factor (g ) along
with one or more speci fi c factors ( s ) . Although speci fic factors
were a part of his theor y , Spearman is known a s a g theor i s t
becaus e he p o s i t e d t h e existence of an overarching general
abi l i t y and cons i dered i t an indi spensable element in
intelligence . I n Spearman ' s theory , every abi l i t y can be divided
into two contribut i ons : a general abi l ity shared with a l l other
abi l i t i e s , and an abi l i t y absolutely speci f i c to that performance
( Catte l l , 1 9 8 7 ) . Spearman believed the influence of g increased
as the complexity o f the intellectual t a s k increas ed .
Thurstone and s theory . Louis Thurstone ( 1 9 3 8 ) , i n
contrast , h e l d that intel l igence could not b e cons i dered a
unitary trait ( Sattler , 1 9 92 ) . I nstead, he empha s i zed the
distinctivenes s of a number of aptitudes he called primary mental
abi l i ti e s : verbal , perceptual speed , i nductive reasoning ,
number , rote memory , deductive reasoning , word fluency , and space
or visuali zation . Thurstone gave equal weight to each o f these
abi l i ti e s . Jus t a s Spearman acknowledged spe c i f i c factors ,
Thurstone recogni zed the exis tence o f a g factor i n intel l i genc e ,
but con s i dered it a second-order factor behind t h e primary
abi lities ( Cattel l , 1 9 8 7 ) .

Leiter-R Factor Ana l y s i s 4
Another prominent multi factor theorist , J . P . Gui l ford
( 1 9 67 ) , deve loped a Structure of Intellect model o f inte l l igence
that include s no l e s s than 1 2 0 separate factor s . Gui l ford ' s
model propos e s human intel l i gence i s best viewed i n three
dimensions: ( a ) the kind o f mental operation per formed
( cognition , memory, divergent production , convergent production ,
and evaluation ) ; ( b ) the kind o f content on which the mental
operation is performed ( fi gural , s ymbol i c , semantic , and
behavioral ) ; and , ( c ) the product o f this interaction ( unit s ,
cla s se s , relations , s ystems , t ransformations , and impl ications ) .
Interact i ons between the s e variables ( 5 operations x 4 contents x
6 product s ) can lead to 1 2 0 separate outcome s .
Controve r s y and coming together . The dialogue over general
and specific abi l it i e s has sparked no small amount o f controve r s y
i n its hi story . I n the early days the debate was o ften
voci ferous , with the camps using di f ferent factor analytic
methods which served to back up their claims . However , the title
of thi s subsection purpos e l y uses the word " and" rather than
" versus , " in recognition that psychology has increas ingly come to
rea l i z e general and speci fic abi lities are two s ides of the same
intell i gence coin . Focus ing exclusively on e i ther general or
speci f i c abi l i t i e s ove r s implifies an exceedingly complex i s sue .
Inte l l i gence researchers wishing to bring together g and s
have t a ken two main approaches : Some , following the lead of
Cattel l ( 1 9 4 1 ) and Horn and Cattell ( 1 9 6 6 ) , have conceptuali zed g
as not one but two or more general factors . Others have

Leiter-R Factor Anal ys i s 5
con s t ructed hierarchical model s whi ch posit the exi stence of g
but a l s o show how various lower levels of more speci f i c factors
serve to comprise and i nfluence g. These two approache s will be
con s i dered i n the following sections .
Fluid and Crystal l i zed I ntel l i gence
According to Raymond Cattell ( 1 9 4 1 ) , work by Spearman and
other intel l i gence res earchers began to hint that g was not a
unitary construct . Cattell now contends there are two factors at
wor k : one i s education , whi ch man i fests i t s e l f most clearly on
schol a s t i c - t ype test s , and the second Cattell cal l s " native wit
( which shows i t s e l f on ) tests of ' gumption ' " ( 1 9 8 7 , p . 9 0 ) .
Cattell l abeled the former factor crystal l i z ed inte l l i gence ( Gc ) ,
and the latter factor fluid intelligence ( Gf ) . Cattel l ,
re ferring t o the g versus � debate , stated, ' ' By now , however ,
through these deve l opments we shall de scribe , whi ch are concerned
with g having split into two general factors , Gc and G f , the se
older di sputes are i rrelevant " ( 1 9 8 7 , p . 3 0 ) .
Fol lowing the postulation of fluid and crystalli zed
intell i gence , Horn and Cattell ( 1 9 6 6 ) further divided g,
propos ing it was comprised of five general -order factors . Added
to Gf and Gc were general vi sua l i z ation ( Gv ) , general fluency
( Gr ) , and general speedines s ( Gs ) . The Gv factor i nclude s almost
all tas ks with f i gural content , Gr reflects the f l exibi l i t y with
whi ch label s for cultural concepts are recalled and organized ,
and Gs involves quickne s s of performance . Thus , to those who

Leiter-R Factor Anal ys i s 6
strictly fol low the Horn-Cattell model , there i s no one general g
factor that stands above all other factors .
Horn and Cattell ' s fluid intelligence ( Gf ) can be defined as
a ba s i c reas oning abi l i t y whi ch can be applied to a wide variety
o f problems . I t i s mos t closely a kin to the g postulated by
Spearman ( Kl ine , 1 9 9 1 ) ; i n fact , Cronbach ( 1 9 8 4 ; i n Kline , 1 9 9 1 )
has proposed G f i s actua l l y Spearman ' s g redi s covered . Fluid
abi l i t y mani fes t s i t s e l f across cultures , educati on level s , and
l ingui s t i c barrier s .
Crys t a l l i zed inte l l i gence ( Gc ) represents envi ronment
speci f i c intellectual s ki l l s . Thu s , crysta l l i zed intel l i gence is
based heavil y on culture and education level ( Horn , 1 9 7 8 ) . In
sum, fluid i nt e l l igence is seen as the intellectual raw material ,
and cryst a l l i zed inte l l i gence i s the particular cultura l /
environmental mol d into whi ch the raw material i s poured ( Kl ine ,
1 9 9 1 ) .
I t i s important to understand the relationship between fluid
and crystal l i zed intel l i gence , as this relat i onship has important
implications for intel l igence tests in general , and particularly
for tests l i ke the Leite r , which is the subj ect of this pape r .
Crystall i z ed inte l l igence i s seen as fluid abi l i t y i n a
particula r , often cultura l l y speci f i c , form . Thus , high scores
on tests of crysta l l i zed intel l i gence , in general , reflect high
fluid abi l i t y . However , it i s vital to recogn i z e that l ow scores
on thes e s ame tests do not neces sarily i ndi cate l ow fluid
abi l ity . Persons with h i gh fluid abi l i t y may perform poorly on
Leiter-R Factor Anal ys i s 7
tests that are high i n crystalli zed content i f the test content
doe s not match the i r particular s ki lls .
A particularly important crystalli zed factor i n thi s country
is language or verbal abi lity . Tests high in verbal content may
not do j us t i ce to those whose fluid abilities are l imited by
verbal or language barriers . Because fluid inte l l igence i s seen
a s more closely a kin to g , in attempts to a s s e s s persons whose
crystall i zed s ki l l s may be unconventional and/or di f ficult to
measure , the main approach has been to l imit or avoid the use of
verbal items . The Leiter and several other inte l l igence tests
have focused on separating out and measuring fluid inte l l i gence .
The Hierarchical View o f Intell i gence
Hierarchical theori e s of i ntelligence repres ent another
approach to bringing together general and spec i f i c abi l i t i es .
Hierarchical theories seek to di scern and rank-order the
components of intellectual abi l i t y . A pioneer in this field was
Phi l ip Vernon ( 1 9 5 0 ) , who advanced a four-level hierarchy o f
intel l i gence , with g at t h e top , followed by two maj or group
factors ( ve rba l -educational and spatial-mechanical ) , six minor
group factor s , and numerous speci fic factors .
I n recent yea r s , researchers have used h i e rarchical theories
to propos e a uni fying s tructure o f cognitive abi l ities . The se
theories attempt to bridge the gap between g and s theories a s
well a s bring together fluid and crystal l i zed inte l l i gence under
one overarching h i e rarchical scheme . Gus t a f s s on ( 1 9 8 4 ) , in a
study o f 1 , 0 0 0 6th-graders given a battery o f 1 6 tests , found

Leiter-R Factor Anal y s i s 8
evidence for co-existence of Thurstone ' s primary abi l i t i e s ,
Cattell and Horn ' s fluid and crysta l l i zed inte l l i gence and
general visua l i zation , and a general g factor as p roposed by
Spearman , which he mel ded into a three-tiered hierarchical model .
More recentl y Carroll ( 1 9 93 a ) has propos ed another three-
tiered hierarchical model containing g at the h i ghest level ;
eight factors at the next level , including fluid and cryst a l l i zed
intel l i gence , memory , vi sual perception , auditory percept ion ,
retrieval abi l i t y , broad cognitive speed, and proce s s ing speed;
and numerous spe c i f i c factors at the l owest level .
The Leiter-R i s based on a model s imi l a r to those proposed
by Gusta f s s on ( 1 9 8 4 ) and Carroll ( 1 9 93 a ) . I t i s des i gned as a
test o f g , but a l s o recogni zes fluid and crystal l i zed
intell i gence , and is based on a hierarchical s tructure ( to be
detailed l ater in this chapter ) which seeks to b ridge the gap
between g and� theorie s .
Age Di f ferentiation / Dedi fferentiation
An i s sue closely related to the three previous topi c s - -
general a n d speci f i c abi lities , fluid a n d crys t a l l i zed
inte l l i gence , and hiera rchical model s o f int e l l igence- - i s the
i s sue o f age di f ferentiat ion/dedi f ferentiation . This i s sue i s
concerned with the e ffect age has o n the structure o f
intellectual abil it i e s .
The age di f f e rentiation/dedi f ferentiation hypothe s i s
actua l l y repres ents two s eparate but related theories :

Leiter-R Factor Ana l y s i s 9
1 . The age di f f e rentiation hypothe s i s ( Burt , 1 9 5 4 ; Garrett ,
1 9 4 6 ) propos e s that a s a person grows from early chil dhood to
early adu lthood , a di f ferentiation in menta l abi l i t i e s occurs ,
such that a general abi l it y changes over time into a l oosely
organ i z ed group o f more speci f i c abi lities ( Kaus l e r , 1 9 8 2 ) .
2 . The age dedi fferentiation hypothes i s ( Ba l i n s ky , 1 9 4 1 )
dea l s with the other end of the age spectrum and propos e s the
opposite resul t . That i s , i n older adults specific intel lectual
abi lities are theori zed to consolidate or degenerate back into a
more gene ral abi l it y .
As noted by Kaus l e r ( 1 9 8 2 ) , empirical support for both parts
o f the age di f ferentiation/dedi f ferentiation hypothes i s is mixed .
The i s sue i s pertinent to this paper because the Leiter-R covers
the age range o f early chi ldhood to early adulthood . A previous
factor anal y s i s o f a field edition o f the Leiter-R by Bos ( 1 9 9 5 )
lent support to the age di f ferentiation hypothe s i s : As chi ldren
increased in age , increas ingly complex factor structures were
neces s a r y to interpret the data . I t i s hoped the present factor
analys i s can shed further l i ght on the age
di f ferentiation / dedi fferentiation hypothe s i s .
Inte l l i gence Testing
Catte l l stated , " Few laymen ( and not a l l scient i st s ) rea l i z e
how much the advance o f science h a s hinged upon the di scovery o f
accurate ways to measure and describe " ( 1 9 8 7 , p . 3 ) . In a
s imi l a r vei n , Kamphaus noted that the Chines e used civil s e rvice

Leiter-R Factor Analy s i s 1 0
exams a s l ong a s 3 , 0 0 0 years ago , and as serted, "There i s
con s i derable agreement that the practice o f a s s e s s ing i ndivi dual
s ki l l s and abil i t i e s is an ancient one " ( 1 9 9 3 , p . 2 ) .
The advent o f modern i nt e l l i gence testing began around the
turn o f this century , a s psychologists sought ways to mea sure
human intel lectual abil i t i e s and di f fe rence s . S ince that time
the field o f inte l l igence testing has grown increas ingly complex .
Besides wide l y u s ed intel l igence tests for general populations ,
numerous speci a l i zed t e s t s have been developed to a s s e s s atypical
groups . In the fol l owing sections , intelli gence tests for
general and special populations will be con s i dered i n turn .
Intel l i gence T e s ting for General Populations
A b r i e f di s cus s ion o f some o f the most wide l y used general
intelligence t e s t s is in order . The tests to be di scussed are
the Stanford-Binet Inte l l igence Scale and the Wechsler
intel l i gence batterie s . The se tests have long hi stories and are
the mos t wide l y used measures o f i nt e l l igence . To a great
extent , they represent the standard by whi ch other inte l l i gence
tests are measured . And perhaps most important for purposes of
this paper , a review of these tests point s out the need for
speci a l i zed intel li gence tests for certain populations .
The Stanford-Binet I ntelligence Scale was introduced in
France by Al fred Binet and Theoph i l ius S imon i n 1 9 0 5 as a 2 9 -item
s cale. Lewi s Terman published the first Engl i s h ver s i on i n 1 9 1 6 .
The current fourth edition of the test con s i st s o f 1 5 subtests .
The Stanford-Binet i s des i gned to provide a mea sure o f g through

Leiter-R Factor Ana l y s i s 1 1
t a s ks representing three sub-areas : fluid intell i gence ,
crysta l l i z ed inte l l igence , and short-term memory .
David Wech s l e r i s the author of three popula r intel l i gence
tests covering the age spectrum : the WPPS I -R , ages 3 to 7 - 3 ( 7
years , 3 months ) ( Wech s l e r , 1 9 8 9 ) ; the WISC- I I I , ages 6 through
1 6 ( Wech s l e r , 1 9 9 1 ) ; and the WAI S-R , ages 1 6 through 7 4
( Wech s l e r , 1 9 8 1 ) . Whi l e the content o f these three t e s t s
neces s a r i l y var i e s due to the a g e ranges involved , t h e Wech s l e r
tests a l l follow a s imi la r format : They a r e des i gned to measure
g through tas ks representing the two sub-areas o f verbal
comprehens ion and perceptual organi zation , commonly known as
verbal IQ and performance IQ, re specti vely .
A maj or reason the Wech s l e r sca l e s gained qui c k acceptance
despite competing with the al ready entrenched Stanford-Binet ( the
first Wech s l e r test wa s int roduced in 1 9 3 9 , more than 2 decades
a fter the 1 9 1 6 Stanford-Binet ) wa s the performance scal e , which
was des i gned to a l l ow for a s s e s sment of l ingui s t i c and cultural
minorities ( Kamphaus , 1 9 9 3 ) . Increas ingly over its history , the
field o f intelli gence testing has come to recogn i z e that certain
populations whos e acculturation , l anguage s ki l l s , and other
mental capacities do not match the societal norm, are di f ficult
to a s s e s s us ing tests de s i gned for general populations . As one
example , Kamphaus ( 1 9 9 3 ) noted the oral instructions for the
WISC-I I I performance battery ' s coding subtest are exceedingly
wordy , making i t l e s s than ideal for use with language-impaired
persons . In contras t , tests l i ke the Leiter include nonverba l

Leiter-R Factor Ana l ys i s 1 2
instruct ions and pantomime as part of the admi n i stration proces s .
E f forts to enhance the ease and accuracy o f testing special
populations has led to the development of inte l l igence tests for
these populati ons , t o be d i s cussed in the next s e ct i on .
Intel l i gence Testing for Special Populations
Madsen ( 1 9 9 6 ) e s t imated in the United States there are more
than 1 . 5 mi ll ion chi l dren and adoles cents age 2 to 2 1 who have
s i gnificant disabi l i t i e s in the cognitive domain . The se
disabi l i t i e s include hearing and speech problems , cognitive delay
( previou s l y ' 'mental retardation " ) , traumatic brain inj ury , and
attention-de ficit /hyperactivity di sorder ( Ame ri can P s ychiatric
As sociation , 1 9 9 4 ) . I n addition , while being from another
culture is by no means a di sabi lity , cultural and l ingu i s t i c
di f ference s often render such persons difficult to a s s e s s u s ing
standard int e l l i gence mea sures .
National l egi s l at i on has had a s i gni ficant impact on
a s s e s sment of pre- school children as well as chi ldren al ready in
school . Many young chi ldren are el igible for s e rvices under the
Individual s with Di s abi lities Education Act ( I DEA ) . This
legi s l ation stipulates via Public Law 1 0 1 - 4 7 6 that such children
must be i denti fied as early as pos sible , between the ages of 0
and 5 , a s early intervent ion i s considered crucial i n preparing
these chi ldren for s chool ( Madsen , 1 9 9 6 ) .
The Educat ion for Al l Handicapped Chi ldren Act of 1 9 7 5 -
Public Law 9 4 - 1 4 2 - - i ncludes among i t s provi s ions the following :
Leiter-R Factor Anal ys i s 1 3
1 . T e s t s are provided and admini stered i n the child ' s
native language or other mode o f communication , unl e s s it i s
c l e a r l y not f e a s ible to d o so .
2 . T e s t s and other evaluat ion mate r i a l s include those
tailored to a s s e s s speci fic areas of education need and not
merely thos e which are des i gned to provide a s ingle general
inte l l i gence quotient .
3 . T e s t s are selected and administered so a s best to
ensure that when a test is administered to a child with
impai red sensory , manual , or speaking s ki l l s , the test
results accurately reflect the chi ld ' s apt i tude or
achievement level or whatever other factors the test
purports to measure , rather than reflecting the chi l d ' s
impai red sensory , manual , or spea king s ki l l s ( except where
those s ki l l s are the factors the test purport s to measure ) .
( Satt l e r , 1 9 92 , p . 7 67 ) .
Taken togethe r , the provi s ions in these pieces o f
legis lation can b e s een a s requiring speci a l i zed inte l l i gence
tests in many cases .
Numerous t e s t s have been developed to a s s e s s intellectual
abil i t i e s i n special populations . Raven ' s Progres s i ve Matrices
( Raven , 1 9 65 ) i s used a s a measure of general inte l l i gence and
requi res minimal l anguage involvement . Li kewi s e , the Columbia
Mental Maturity Scale ( Burgme i s t e r , Blum, & Lorge , 1 9 7 2 ) is a
test of general reasoning abi l ity whi ch does not require the
child to read or speak Engli sh . The Test o f Nonverbal

Leiter-R Factor Anal ys i s 1 4
I nte l l i gence-2 ( TONI -2 ) ( Brown , Sherbenou , & John s on , 1 9 9 0 ) lS a
nonverbal intel l i gence test targeted not only at children but
adult s as wel l . The Hi s key-Nebras ka Tests o f Learning Aptitude
( Hi s ke y , 1 9 6 6 ) i s de s igned speci fica l l y to a s s e s s the cognitive
s ki l l s of dea f children and adolescents .
A comprehens ive review of these tests i s beyond the scope of
this paper ; for such a review , the reader i s re ferred to Sattler
( 1 9 92 ) or other p s ychological a s s es sment textbooks . As the
Leiter-R i s the topic o f thi s pape r , the foll owing sect i ons wil l
present the original and revi sed Leiters i n detai l .
The Leiter Tests
This sect i on will first addre ss the original Leiter : its
hi story, rel i ab i l ity and val idity . Next the paper move s to the
Leiter-R : the rational e for revi sion , the Leiter-R ' s new norms
and theoretical foundation , and research conducted to date .
The Original Leiter
Hi story . The Leiter Internat i onal Performance Scale
( Leiter , 1 9 3 8 ) has exi sted for more than hal f a century as a
nonverba l test o f inte l l i gence . I t s greatest value has been in
a s s e s s ing persons whos e l imited Engl i s h l anguage proficiency
renders it di ffi cult to a s s e s s thei r int e l l i gence u s i ng
traditional verbal inte l l igence tests l i ke the Wechs ler batteries
( e . g . Wechs l e r , 1 9 8 1 ; 1 9 8 9 ; 1 9 9 1 ) .
Rel iabil i t y . The Leiter ' s reliability has been proven i n a
number of studi e s . In the most recent reliab i l ity research this

Leiter-R Factor Ana l ys i s 1 5
author found , Reeve , French , and Hunter ( 1 9 8 3 ) , in a study o f
kindergarten chi ldren , obtained a n internal con s i stency
reliabi l i t y estimate of . 8 9 for the Leiter ; thi s compared to a
rel iabi lity estimate o f . 9 4 for the Stanford-Binet Inte l l i gence
Scale in the s ame study . A study of test-retest reliabi l i t y
( Black , 1 9 7 3 ) revealed a reliabi lity e stimate o f . 9 2 over a 6-
month period with aphas i c children .
Val idit y . Evidence for validity comes f rom numerous
criterion-related val i di t y studies comparing the Leiter with
other int e l l i gence t e s t s . Ratcli f fe and Ratc l i f fe ( 1 9 7 9 )
reviewed these studies and reported the Leiter ' s criterion
related val idity with other int e l l i gence tests a s follows : with
the Stanford-Binet , a median correlation of . 7 7 ; and with the
WISC , val idity coe f f i cients ranging from . 7 7 to . 8 3 .
The Leiter-R
Rati onale for the Leiter-R . At pre sent the Leiter i s
undergoing a comp rehens i ve revi s i on , with the new test called the
Leiter-R ( Leiter-Revi s ed ) . There are two mai n reasons for the
revi sion . Fi r s t , the original Leiter was normed a lmost hal f a
century ago , in 1 9 4 8 ( Bo s , 1 9 95 ; Leite r , 1 9 5 9 ) , suggesting a need
for more up-to-date norms .
Second , although the original Leiter i s qui te well accepted
and has been of value to educators and psychologi s t s a l i ke , its
theoret ical foundation was never clearly articulated by Leiter in
the test manual or e l s ewhere . Bos ( 1 9 9 5 ) noted thi s violates a
maj or tenet o f p s ychological scale construct i on , whi ch demands

Leiter-R Factor Analys i s 1 6
that a s s e s sment instruments clearly state the i r theoretical
grounding and back up theoretical claims with appropriate
research .
Lack o f theoretical foundation hampers e f forts to mea sure a
test ' s val idit y . As di s cus sed earlier , validi t y studi e s o f the
original Leiter relied on compari sons to s imi l ar t e s t s
( criterion-related val idity ) , because to measure construct
validity- -whether a test measures what it purport s to measure-
requi res a construct , or theory , against whi ch to measure the
test ' s performance .
Factor analys i s i s an important method used to examine
construct val i dity . The theoretical foundation o f a test o ften
determines what t ype o f factor analys i s i s used , with di f ferent
types often yielding di fferent results . Thus , factor ana l y s i s
c a n have l imited value i n e stabl ishing t e st val idity i f t h e t e s t
does not have a wel l -establi shed theoretical foundation ( e . g .
Gust a f s s on , 1 9 8 4 ; Satt l e r , 1 9 92 ) . Perhaps for thi s reas on the
original Leiter wa s never factor analyzed .
Norms . The revi sed Leiter , or Leiter-R, addr e s s e s concerns
about norms and theoreti cal foundation . Regarding norms , the
Leiter-R wil l have new norms collected in 1 9 9 5 and re flecting
data from the 1 9 9 0 United States census ( Bos , 1 9 9 5 ) . The
Leiter-R ' s standardi zation population wi l l be detai led further in
chapte r 2 .
Theoretical foundation . Much e f fort has gone into de fining
a theoretical foundat ion for the Leiter-R . The Leiter-R is based

Leiter-R Factor Ana l ys i s 1 7
largely o n the work o f Gustafsson ( 1 9 8 4 ) , Horn and Cat t e l l
( 1 9 6 6 ) , a n d Carroll ( 1 9 9 3 a ) . Fol l owing the i ntent o f the
original Leite r , the Leiter-R is des i gned to mea sure g , or
general inte l l i gence . I t attends exclusive l y to the non- verbal
doma i n , which in Horn and Cattell ' s theory represents fluid
inte l l i gence , a s opposed to language- and culture-dependent
crystal l i zed inte l l igence . The test follows Gust a f s s on ' s basic
hierarchical scheme comp r i s ing three levels o f factors , with g
representing the under lying first-level factor . The Leiter ' s
second level i nclude s four factors : fluid rea soning ( Gf ) ,
general vi sua l i zation ( Gv ) , memory , and attent ion . Expanding
this s econd level beyond Gc and Gf to include other factors such
as memory and attention i s exempli fied in the wor k of Carroll
( 1 9 9 3 a ) . The Leiter ' s third and final level o f more specific
factors is represented by 20 subte sts . Figure 1 i l lu s t rates the
hierarchical s tructure of the Leiter-R .

Figure 1
Leiter-R Factor Analy s i s 1 8
Hierarchical Structure o f the Leiter-R
Fluid Reasoning ( G f )
General Vi suali zation ( Gv )
Memory
Attention
Des i gn Analogies Repeated Patterns Sequenti a l Orde r Cla s s i f i cation
Matching Figure Ground Picture Context Form Completion Paper Folding Figure Rotation
Immediate Recognition Del a yed Recognition Associated Pairs Delayed Pai rs Forward Memory Backward Memory Spatial Memory Trans formation
Sustained Attention Divided Attent ion
The present s tudy i s concerned in part with veri fying the
exi stence o f two o f the Leiter ' s second order factors , fluid
reas oning and general visuali zation . Fluid rea soning i s
conceptuali zed a s representing adaptive nonverbal abil i t i e s . I n
the Leiter-R des i g n , it i s closely akin to Gustafs son ' s g ( 1 9 8 4 ) .
Fluid reasoning i s measured by t a s ks that tap the abi lity to
Leiter-R Factor Ana l y s i s 1 9
recogn i z e s e ri e s , clas s i fications , sequences , patterns , and
anal ogi e s . General visuali zation involves the abil it i e s to
" apprehend , encode , and menta l l y manipulate " vi s ual forms
( Carrol l , 1 9 93 a , p . 3 0 9 ) . It i s measured by t a s k s that requi re
visua l i zat i on , spat i a l orientation , and flexibil ity o f closure .
Research . A number o f studies have been conducted to
provide a research base for the Leiter-R .
A preliminary study ( Mads en , 1 9 9 6 ) yielded h i gh internal
con s i stency reliab i l i t y ( 5 0 % of f i gures > . 9 or ; 8 0 % > . 8 ) and
8 -wee k test -retest reliability ( 5 5 % of f i gures > . 9 ; 8 5 % > . 8 )
for the Leiter - R .
Bos ( 1 9 9 5 ) conducted a factor analys i s o f the Field Edition
of the Leiter-R for three di fferent age groups . He concluded the
Leiter-R fit wel l within its theoret ical base , comparing
favorably to the WPPS I -R and WISC- I I I . His results a l s o o f fered
support for the age di f ferentiation hypothe s i s : a s age
increased , the number o f di st inct factors which emerged increased
as wel l .
Bos , Gridl e y , and Roid ( 1 9 9 6 ) have shown evidence that the
Leiter-R subt e s t s fit the underlying hierarchical g model used in
the test ' s de s i gn .
A maj or goa l o f the Leiter-R i s to enable measurement of
incremental improvement i n cognitive functions . Often , such
gains in cognitive functioning are observed, but are di f fi cult to
document u s ing verbal tests for children with speech impai rments
or from non-Engli sh language backgrounds . In a recent study ,

Leiter-R Factor Ana l y s i s 2 0
Roid and Miller ( 1 9 9 6 ) reported that the Leiter-R scales show
promi s e in mea s uring cognitive improvements across the age range
and acros s leve l s o f di s abi l i t y .
Grant , Roi d , and Fal l ow ( 1 9 9 6 ) compared speech- impai red and
non-speech-impai red children on two Leiter-R fluid rea soning
subtests and found no s i gn i f i cant group di fference s . Madsen and
Fallow ( 1 9 9 6 ) admi n i s t e red seven Leiter-R subt e s t s to a group of
1 7 traumatic brain-inj ured ( TBI ) chi ldren , and reported these
subtests may be helpful i n deve loping cognitive profiles for TBI
cases .
Head ( 1 9 9 6 ) compared children with attention
de ficit /hyperactivity di s order ( ADH D ) (American P s ychiatric
As sociation , 1 9 9 4 ) with a control group of non-ADHD children on
the 2 0 Leiter-R subte s t s . She found s igni f i cant score
di fference s between the groups on 8 of the 2 0 subte s t s .
I n terms o f use fulnes s acros s ethnic groups , several studi e s
(Armenteros & Roi d , 1 9 9 6 ; Flemmer & Roid , 1 9 9 6 ; Grant , Roi d , &
Fallow , 1 9 9 6 ; McLell an & Walton , 1 9 9 6 ; Mellott & McLell a n , 1 9 9 6 )
have shown the Leiter-R subtests to have few s i gn i f i cant
di f ferences between Anglo and Hi spanic samples matched for
parental education leve l s , and between Navaj o and normative
s amples . Madse n , Roi d , and Miller ( 1 9 9 6 ) examined item bias in
10 Leiter-R subt e s t s and found the subtests to be exceptionally
free from di f ferential i tem functioning between Anglo and
Hi spanic and Anglo and African American s amples . Blair ( 1 9 9 6 )
conducted convent i onal item bias stat i s t i c s on four picture-

Leiter-R Factor Ana l ys i s 2 1
oriented Leiter-R subtes t s for matched samples o f Anglo and
Engl i sh-as-a-second-language Hi spanic subj ects . She found onl y
two subtest items with positive partial correlati ons , and these
items were removed from the Leiter-R .
Res earch Que stions
The present s tudy had three separate but related resea rch
goal s :
1 . To explore the factor structure of the Leiter-R .
Exploratory factor analys i s was used in order to explore factor
s t ructure u s ing l imited initial a s s umptions about the data .
2 . To ver i fy the exi stence of two hypothe s i zed second-level
factors , fluid reasoning ( Gf ) and general visuali zation ( Gv ) , in
the Leiter-R .
3 . To addr e s s the age di f ferentiation hypothe s i s . That i s ,
t o a s certain whether the Leiter-R supports the theory that mental
abil i t i e s g row increas ingly di f ferentiated from early chi ldhood
to early adulthood .

Leiter-R Factor Ana l ys i s 2 2
Chapter 2
Methods
This chapter det a i l s the methods used in thi s subscale-level
factor analy s i s of Leiter-R subtests . I t out l ines the
procedure s , instrument , and stat i s t i cal de s i gn used in the
pre sent study , and conclude s with a brief summary sect ion .
Procedures
Subj ects
The Leiter-R sampl e used i n this study ( data collected as of
January , 1 9 9 6 ) i nclude s a total o f 1 , 8 9 0 chi ldren repre sent ing
two broad categories : " atypical " subj ects are those with s ome
form o f cognitive di sabi l i t y , and " t ypica l " children are those
without such di sabil i t i e s . The s ample demographi c s to be
detailed in this s e ct i on refer only to the 1 , 3 7 1 typical
childre n , a s this i s the population to be examined i n the present
factor analys i s . The sample used in this s tudy represents
approximately 8 0 % o f the Leiter-R final normative s ample , a s data
was s t i l l being gathered when this study was initiated .
The Leiter-R standardi zation sample was based on a national
s t rat i f i cation plan which included the following demographic
variables : age , gende r , socioeconomi c level ( ba sed on mother ' s

Leiter-R Factor Anal ys i s 2 3
educational level ) , ethn i c background (African Ame rican , Asi an
Ame ri can , Caucas i an non-Hi span i c , Hi spanic , and Nati ve Ameri can ) ,
geographi c region , and community s i ze . In the case o f several
variables --notab l y ethnic background , socioeconomic l evel , and
geographi c region- -the s ample was intended to match percentages
from the 1 9 93 update o f the 1 9 9 0 U . S . Census . The actual s ample
matched the targeted s t rat i f i cation numbers f a i r l y wel l , given
that it represents about 8 0 % o f the final Leiter-R normative
sample . Table 1 presents Leiter-R s ample demographics , i ncluding
raw numbers where appropriate ( i . e . with the age variable ) and
actual and targeted sample percentages where appropriate .

Table 1
Leiter-R Factor Ana ly s i s 2 4
Leiter-R Standardization Sample : Demographi� Variabl e s
Age Group # o f Participants
2 9 4
3 1 4 1
4 1 4 7
5 1 4 1
6 1 1 2
7 8 0
8 8 6
9 8 0
1 0 8 0
1 1 8 7
1 2 - 1 3 9 5
1 4 - 1 5 7 5
1 6- 1 7 7 4
1 8 -2 1 7 9
Total 1 , 3 7 1
( table continue s )

Table 1 - -Conti nued
Variable
Gende r
Male
Femal e
Parent ' s Education Level
< 1 2
1 2 o r GED
13 +
Ethnicity
Caucasian
African American
Hi spanic
Asian Ame rican
Nati ve Ame rican
Communi t y S i ze
Urban ( > 2 5 0 0 )
Rural ( < 2 5 0 0 )
Geographi c Region
Northea st
Midwe st
South
West
Leiter-R Fa9tor Ana lys i s 2 5
Sample % Target 0 -o
4 8 . 1 5 0
5 1 . 9 5 0
1 9 . 2 2 0
3 5 . 2 3 5
4 5 . 7 4 5
6 1 . 5 6 8
1 8 . 7 1 6
1 4 . 3 1 2
3 . 9 3
1 . 6 1
9 0 . 5 NA
8 . 8 NA
1 1 . 9 1 9
2 7 . 4 2 5
3 3 . 1 3 4
2 7 . 5 2 2

Examiners
Leiter-R Factor Anal ys i s 2 6
Data for the sample used i n this study was gathered by 1 0 8
examiners s elected f rom the four maj or U . S . geographic regions
identi fied in Table 1 . Most of the examiners were clinical
p s ychologi s t s , school p s ychologi sts , special educat ion
a s s e s sments speci a l i st s , or occupational therapy a s s e s sment
specia l i s t s . Most were connected with school di s t r i ct s or
university settings , and all had extensive experience with
i ndividually admi n i s te red tests for chi ldren and adole scent s .
Examiners attended a 4 -day t raining workshop i n Chicago in
June 1 9 9 5 , at which they were taught proper recruitment and
i nformed-cons ent procedures , how to administe r the Leiter-R
tests , and procedures for collecting data for the p roject .
Examiners were i ndividually examined during t raining , and were
required to f i l e s ample protocols for approval prior to test ing .
During the data collection phase , each examiner conducted
between 2 0 and 4 0 1 -hour test ses sions with subj ect s . During
thi s phas e examiners were monitored by phone and received a
news letter containing advice and instructions for the collection
of data .
Age Groupings
This s ecti on explains the age groupings used in the present
factor analys i s . S ubt e s t s named in this sect i on are detailed
further in the I n s trument section immediately following .
As noted in the summary section o f chapter 1 , the present
study examined the Leiter-R in two di f fe rent sets of age

Leiter-R Factor Anal ys i s 2 7
groupings . The f i r s t s e t o f age groupings repre sented 1 4 age
groups , comp r i s i n g 1 -yea r i ntervals from ages 2 to 1 1 ; 2 - year
interva l s from ages 12 to 1 7 ; and a 4 -year interval from ages 1 8
t o 2 1 . The s econd s et o f age groupings repre sented three l a rger
age range s : 2 - 5 , 6- 1 0 , and 1 1 -2 1 .
Two sets o f age g roupings were chosen becaus e the Leiter-R
i s des i gned a s a brief test of inte l l i gence and because not all
subtests are thought to be appropriate for a l l age groups . Thus ,
i n the Leiter-R data collection, not all subt e s t s were
administe red to all age groups . Data acro s s a l l age g roups was
available for four core subte sts , two each representing fluid
reasoning ( the S equenti a l Order and Repeated Patterns subtest s )
and general visualization ( the Figure Ground and Form Completion
subte st s ) .
The three l a r ge r age range s - -2 - 5 , 6- 1 0 , and 1 1 - 2 1 - -were used
because the se range s share larger numbers o f common subt e s t s :
seven , six , and seven subte sts , re spective l y . U s ing these larger
age range s would permit examination of all 10 fluid reasoning and
general visualization subtest s . In addition , i t wa s thought
these larger groups might aid in reveal ing factor s t ructure .
Table 2 shows the Leiter-R subtests comprising each o f the three
larger age groups .
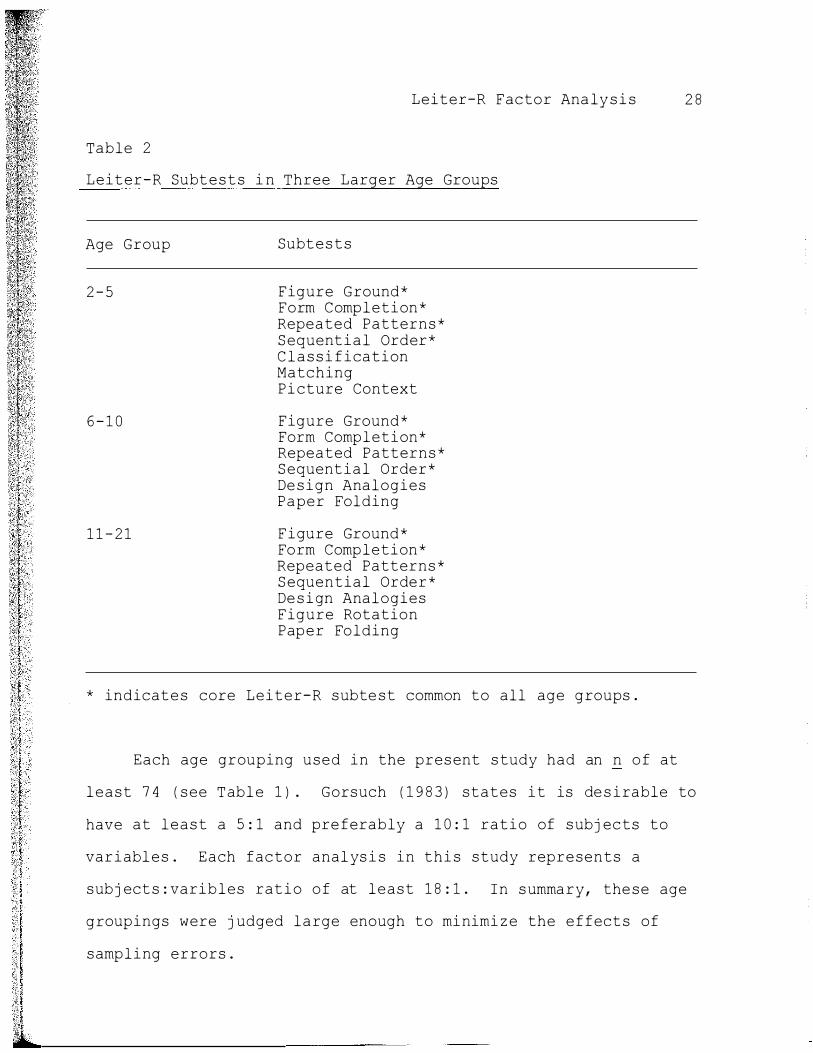
Table 2
Leiter-R Factor Ana ly s i s 2 8
Leiter-R Subt e s t s i n Three Larger Age Groups
Age Group
2 - 5
6 - 1 0
1 1 - 2 1
Subt e s t s
Figure Ground* Form Completion* Repeated Patterns* Sequential Order* C l a s s i fication Matching Pi cture Context
Figure Ground* Form Completion* Repeated Patterns* Sequential Order* De s ign Analogies Paper Folding
Figure Ground* Form Completion* Repeated Patterns* Sequential Order* De s i gn Analogies Figure Rotation Paper Folding
* indicate s core Leiter-R subte st common to all age groups .
Each age grouping used in the present s tudy had an n o f at
least 7 4 ( see Table 1 ) . Gorsuch ( 1 9 8 3 ) states it is de s irable to
have at least a 5 : 1 and pre ferably a 1 0 : 1 ratio of subj ects to
variabl e s . Each factor anal ys i s in thi s study represents a
subj ect s : varibles ratio o f at least 1 8 : 1 . In summary , the se age
groupings were j udged large enough to minimize the e ffect s of
sampling errors .

Leiter-R Factor Ana lys i s 2 9
Instrument
The history and theoret ical foundation of the Leiter-R were
di scu s s e d in chapter 1 . This section details those port i ons o f
the Leiter-R which are the focus of the pre s ent factor anal ys i s .
The present factor analys i s examined two o f the four
Leiter-R s econd-level variabl e s , fluid reasoning and general
vi suali zation , whi ch together repres ent 10 o f the 2 0 total
subtests . The se 1 0 subtests will be detailed beginning i n the
next paragraph . S ubtest de scriptions are taken f rom Roid ( 1 9 9 6 )
and Madsen ( 1 9 9 6 ) .
The fluid reasoning variable i s repre sented by the fol lowing
four subtests :
1 . The Cla s s i fication subtest ( 2 3 items ) a s s e s s e s the
abi l i t y to categorize obj ects and des i gns to determine what
character i s tics they have in common .
2 . The De s i gn Analogies subtest ( 2 9 items ) a s s e s s e s the
abi lity to perceive analogous pai rs of geometric shapes /drawings
and to s elect related pairs from several choice s .
3 . The Repeated Patterns subtest ( 2 9 items ) a s s e s s e s the
abi l i t y to perceive a patte rn , and to hold it in memory long
enough to reproduce it several times .
4 . The Sequential Order subtest ( 4 2 items ) a s s e s s e s the
abi l ity to perceive a logical progres s ion of s t imul i and the
speci fic charact e r i s t i c s whi ch make the progre s si on ordered .
The general visualization variable i s represented by the
following s i x subte s t s :

Leiter-R Facto r Ana ly s i s 30
1 . The Figure Ground subtest ( 3 1 items ) a s s e s s e s the
abi lity to visually perceive an obj ect or shape embedded in a
complex f i gure ; to p i c k a f i gure out of a background .
2 . The Fi gure Rotation subtest ( 1 4 items ) a s s e s s e s the
abi l ity to menta l l y rotate an obj ect or shape in space and to
perceive what i t would look l i ke from another perspect ive .
3 . The Form Completion subtest ( 3 5 items ) a s s e s s e s the
abi l ity to percei ve a whole obj ect when it is pres ented in non
conti guous part s ; "part or whole " or s imultaneous perception .
4 . The Matching s ubtest ( 3 8 items ) a s s e s s e s the abi l i t y to
perceive vi sual s t imul i and to di scriminate from other s imilar
stimul i .
5 . The Paper Folding subtest ( 2 2 items ) a s s e s s e s the
abi l ity to perceive what an unfolded shape would look l i ke i f it
were folded; a form of spatial reasoning .
6 . The Picture Context subtest ( 2 5 items ) a s s e s s e s the
abi l i t y to recogni ze a pictured obj ect that has been removed from
a larger display ( mi s s ing location indicated by mar kings ) , using
vi sual context clue s .
Preliminary internal cons i stency reliab i l i t y e stimates for
the 10 Leiter-R s ubte s t s ( ta ken from Madsen , 1 9 9 6 ) among f ive age
groups are pre sented in Table 3 .

Leiter-R Factor Analy s i s 3 1
Table 3
Preliminary Internal Con s i stency Reliability E s t imates for 1 0
Leiter-R S ubt e s t s
Leiter-R Subtest a
Age of Subj ect n DA RP so CL M FG PC FC PF FR -
2 9 4 . 9 2 . 9 2 . 9 1 . 9 5 . 8 6 . 9 1 . 9 2
3 1 4 1 . 8 3 . 7 6 . 8 8 . 9 5 . 6 8 . 9 0 . 9 0
4 1 4 7 . 8 8 . 7 1 . 8 5 . 9 1 . 7 0 . 9 1 . 8 2
5 1 4 1 . 8 7 . 9 2 . 8 9 . 8 4 . 9 0 . 8 2 . 9 1 . 9 0
6 1 1 2 . 8 7 . 9 2 . 9 5 . 7 4 . 8 3 . 7 6 . 8 9 . 8 7
7 8 0 . 8 3 . 8 3 . 9 5 . 7 4 . 6 8 . 8 3 . 8 6
8 8 6 . 8 9 . 8 0 . 9 3 . 7 6 . 7 7 . 7 0 . 8 4
9 8 0 . 8 9 . 8 1 . 9 1 . 6 0 . 7 9 . 7 2 . 8 4
1 0 8 0 . 8 8 . 8 5 . 9 4 . 6 8 . 7 8 . 6 5 . 8 3
1 1 8 7 . 8 8 . 8 5 . 9 2 . 8 7 . 8 7 . 8 2 . 8 4
1 2 - 1 3 9 5 . 9 1 . 8 9 . 9 4 . 7 4 . 9 4 . 8 4 . 7 6
1 4 - 1 5 7 5 . 9 1 . 8 1 . 9 0 . 62 . 8 7 . 7 9 . 6 9
1 6- 1 7 7 4 . 9 1 . 8 2 . 9 3 . 7 6 . 6 7 . 7 7 . 7 7
1 8 - 2 1 7 9 . 9 2 . 7 9 . 8 8 . 7 3 . 6 5 . 7 3 . 6 7
a DA = Des i gn Analog ie s ; RP = Repeated Patterns ; so = Sequential
Orde r ; CL = Clas s i f i cation ; M = Matching ; FG = Figure Ground ;
PC Picture Context ; FC = Form Completion ; P F = Paper Folding;
FR Figure Rotation .

Factor Ana l y s i s
Leiter-R Factor Ana l ys i s 3 2
Statistical De s i gn
A factor i s a cons truct operationally def i ned by i t s factor
l oadings ( Kl i ne , 1 9 9 1 ) . Factor analysi s i s a technique des i gned
to del ineate a relative l y sma l l number o f dimens ions , or factors ,
which are used to represent relationships among sets o f
interrelated variables ( Norus i s , 1 9 8 8 ) .
Factor analytic methods o ften are divided into two camps ,
exploratory factor analy s i s ( EFA ) and confi rmatory factor
analys i s ( C FA ) . Carroll ( 1 9 9 3 a ) aptly explained the difference
between the two :
C FA i s best employed for testing particular hypotheses
[ empha s i s added ] about the factor compos i t i on o f a s et of
variables . . . . E FA methods , on the other hand , are de s i gned to
' let the data speak for thems elve s , ' that i s , to let the
structure o f the data suggest the most probable factor
analyt i c model . " ( p . 8 2 )
Although the porti on of the Leiter-R to be analyzed doe s
repres ent a hypothetical factor framework--fluid reas oning and
general visualization--exploratory factor analy s i s was chosen
because i t is better suited to reveal nuances o f actual factor
structure observed i n this sample . This i s especially pertinent
given the broad age range to be studied ( ages 2 to 2 1 ) . While
factor structure may i n general remain stable , i n spec i f i c age
groups distinct factor s tructures may emerge .
Leiter-R Factor Ana ly s i s 3 3
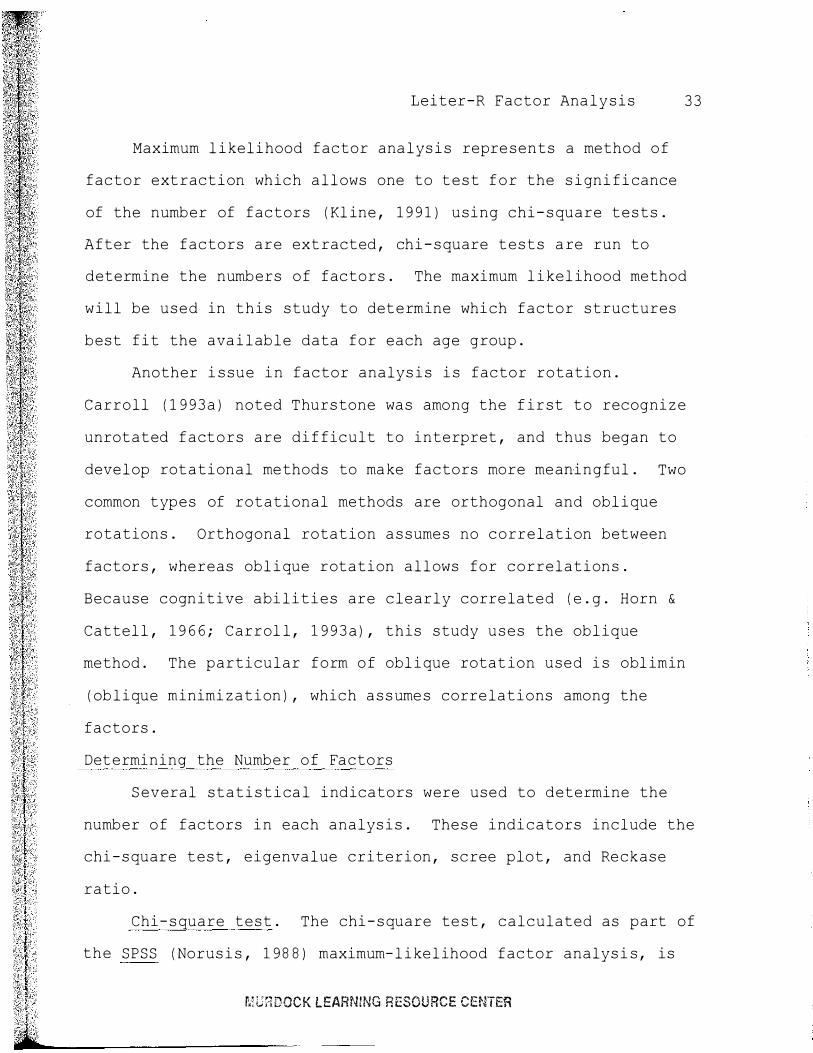
Maximum l i kelihood factor analys i s repre sents a method o f
factor ext raction which allows one to t e s t f o r the s i gni fi cance
of the number of factors ( Kl ine , 1 9 9 1 ) using chi- s quare t e s t s .
After the factors are ext racted , chi - s quare t e s t s a re run to
determine the numbers o f factors . The maximum l i kel ihood method
will be used in this study to determine whi ch factor structures
best fit the ava i l able data for each age group .
Another i s sue i n factor analys i s i s factor rotation .
Carroll ( 1 9 9 3 a ) noted Thurstone was among the f ir st to recognize
unrotated factors are di f ficult to interpret , and thus began to
develop rotational methods to ma ke factors more meaningful . Two
common types of rotational methods are orthogonal and obl i que
rotations . Orthogonal rotation a s sumes no correlation between
factors , whereas obl i que rotation allows for correlations .
Because cognitive abi l i t i e s are clearly correlated ( e . g . Horn &
Cattell , 1 9 6 6 ; Carrol l , 1 9 9 3 a ) , this study u s e s the obl ique
method . The particular form o f obl i que rotat ion used i s obl imin
( oblique minimization ) , which a s s ume s correlations among the
factors .
Determining the Number o f Factors
S everal stat i s t i ca l i ndicators were used to determine the
number o f factors i n each analys i s . These indi cators include the
chi - s quare test , eigenvalue criterion , scree plot , and Reckase
ratio .
Chi- s quare test . The chi- s quare te st , calculated as part of
the SPSS ( Norus i s , 1 9 8 8 ) maximum- l i kelihood factor analys i s , is
MUHDOCK LEARNING RESOURCE CENTER

Leiter-R Facto r Ana l ys i s 3 4
des i gned t o evaluate di s crepancies between a n hypothes i zed model
and the observed correlations of the data ( Jores kog & Sorbom,
1 9 9 3 ) . Chi - s quare results are o ften interpreted i n terms o f the
ratio between chi- s quare and degrees of freedom . Marsh , Balla ,
and McDonald ( 1 9 8 8 ) propose a ratio o f l e s s than 2 : 1 indicates a
good model fit .
E igenvalue s . Guttman ' s ( 1 9 5 4 ) eigenvalue criterion holds
that s i nce each variable in a correlation matrix contr ibutes 1 . 0
to the total extractable variance , any s i gnifi cant variable must
repre sent at least that amount of variance . Whi le e igenvalue > 1
i s a commonly used criterion , it does not always recover the t rue
number o f factors , and i n fact often tends to underestimate the
number o f factors ( Gorsuch , 1 9 8 3 ) . For that reason , Gorsuch
cautions that the eigenvalue > 1 criterion i s best con s i dered as
repre senting a l ower bound for the number of factors .
Scree plot . Cattell ( 1 9 7 8 ) demonstrated that when
eigenvalues are plotted on a chart , the e i genvalues for the
ins i gni f i cant factors wil l form a straight downward- s l oping l ine .
S igni f i cant factors wil l l i e above the line ; the higher above the
l i ne , the greater the s i gnificance .
Reckas e rati o . According to Reckase ( 1 9 7 9 ) , the ratio of
first to s econd eigenvalues i s a measure o f the unidimensional ity
o f a set o f mea s u re s . Ratios o f 5 : 1 or greater represent very
high unidimens i ona l i t y , and rat ios of 3 : 1 con s t i tute good
unidimens ional ity . The Reckase ratio i s di f ferent f rom the three
previous indi cators in that it pertains only to one- factor and

Leiter-R Factor Anal y s i s 3 5
not to mult i factor mode l s . Thus , while it can a s s e s s the
strength o f a one- factor model , it can only indi rectly reflect on
deci s ions about mult iple factors .
Determining Whi ch Fact or ( s ) a S ubtest Represents
In factor analys i s , items ( in the case o f this study,
Leiter-R subtest s ) often will load strongly on a s ingle factor ,
i ndicating they represent a relatively speci f i c and di stinct
construct . I n other cas e s , items may load relative l y s trongly on
two or more factors . I n the se latter cases , i t ems are thought of
as factor i a l l y ambiguous , as they repre sent a number of
construct s .
In the pres ent study , Leiter-R subtests were de fined as
representing a particular factor i f they met two requirements :
first , that the subtest ' s s t rongest factor loading be at least
0 . 4 0 , and second , that the di fference between the subtest ' s
stronge st and s e cond- strongest factor loadings be at least 0 . 1 0 .
According to Gorsuch ( 1 9 8 3 ) , 0 . 3 0 i s typica l l y chosen a s the
minimum l oading needed for interpretation in factor analys i s .
The pre sent study u s ed 0 . 4 0 due to the relatively sma l l �s
involved ( from 6 to 7 subtests ) . The 0 . 1 0 required di f fe rence i n
loadings was chos en to promote adequate di stinction between whi ch
factor a subtes t repres ented . It should be noted that whi l e a
subtest with two relatively strong loading s - - fo r example , 0 . 4 6
and 0 . 3 5 - -would be a s s i gned to a particular factor for purposes
of this s tudy , the subtest would also draw the resea rche r ' s

Leiter-R Factor Ana lys i s 3 6
attention because i t appeared t o have a relatively strong
relat i onship to two factors .
Factor Ana l y s i s Software
All analyses were run u s i ng S P S S /PC+ Advanced Statistics
V2 . 0 ( Norus i s , 1 9 8 8 ) . Maximum-l i kel ihood extraction with obl ique
( oblimin ) rotation was employed , with squared multiple
correlations i n the correlation-matrix diagonal and delta set at
zero .
Summary
Study subj ects were 1 , 3 7 1 " typi cal " children f rom the
Leiter-R standardi zation s ample . Four core Leiter-R s ubt e s t s ,
two each repre senting fluid reasoning and general visua l i zation ,
were anal yzed across 1 4 age groups . Additional factor analyses
were performed using three larger age groups and more Leiter-R
subtest s , i n order to include a l l 10 Leiter-R fluid reas oning and
general visua l i zation subtests and to help reveal factor
structure . The pattern factor matrix resul t s from maximum
l i kelihood exploratory factor analyses ( obl imin rotation ) were
the main focus of the s tudy . Chi - s quare test s , e i genvalue s ,
scree plot s , and the Reckase ratio were chosen to verify the
number of factors . Two criteria were chosen to help determine
which factor ( s ) a substest repre sented .

Leiter-R Facto r Anal ys i s 3 7
Chapter 3
Results
This chapte r reports the results of this s tudy ' s factor
analyses i n two maj or sections : ( a ) factor analys i s of 1 4 age
group s ; and ( b ) factor analysi s of three larger age groups . A
brief s ummary sect i on ends the chapter .
Factor Analys i s of 1 4 Age Groups
Thi s sect i on di scus s e s what exploratory factor ana l y s i s
( E FA ) revealed in terms of factor structure f o r t h e 1 4 a g e groups
( 2 , 3 , 4 , 5 , 6 , 7 ' 8 , 9 , 1 0 , 1 1 , 1 2 - 1 3 , 1 4 - 1 5 , 1 6- 1 7 ' & 1 8 -2 1 ) '
and examines the loadings of the four core Leiter-R subtests on a
general factor for each a ge group .
Factor Structure for 1 4 Age Groups
Expl oratory factor analyses of the four core Leiter-R
subtests across 14 age groups revealed strong unidimens ionality
in each case . Age groups wi ll not be di scu s s e d i ndividually in
terms of factor s t ructure , s ince with few exceptions the measures
used to determine the number of factors--initial E FA extraction ,
chi- s quare t e s t s , eigenvalue s , scree plot s , and Reckase rat i o s -
supported a one- factor model . Exploratory factor analys i s
con s i stentl y computed one structure , and in most cases the S P S S

Leiter-R Factor Ana l ys i s 3 8
statistical software ( Norus i s , 1 9 8 8 ) was unabl e t o compute a two
factor s tructure or chi - s quare . Whereas first e igenvalues were
uni formly high , ranging from 1 . 9 6 to 3 . 0 3 , second e i genvalues all
were at . 8 or below , and none stood above the l ine in the s cree
plot s . Rec kase ratios ranged from 2 . 4 to 5 . 9 , indi cating
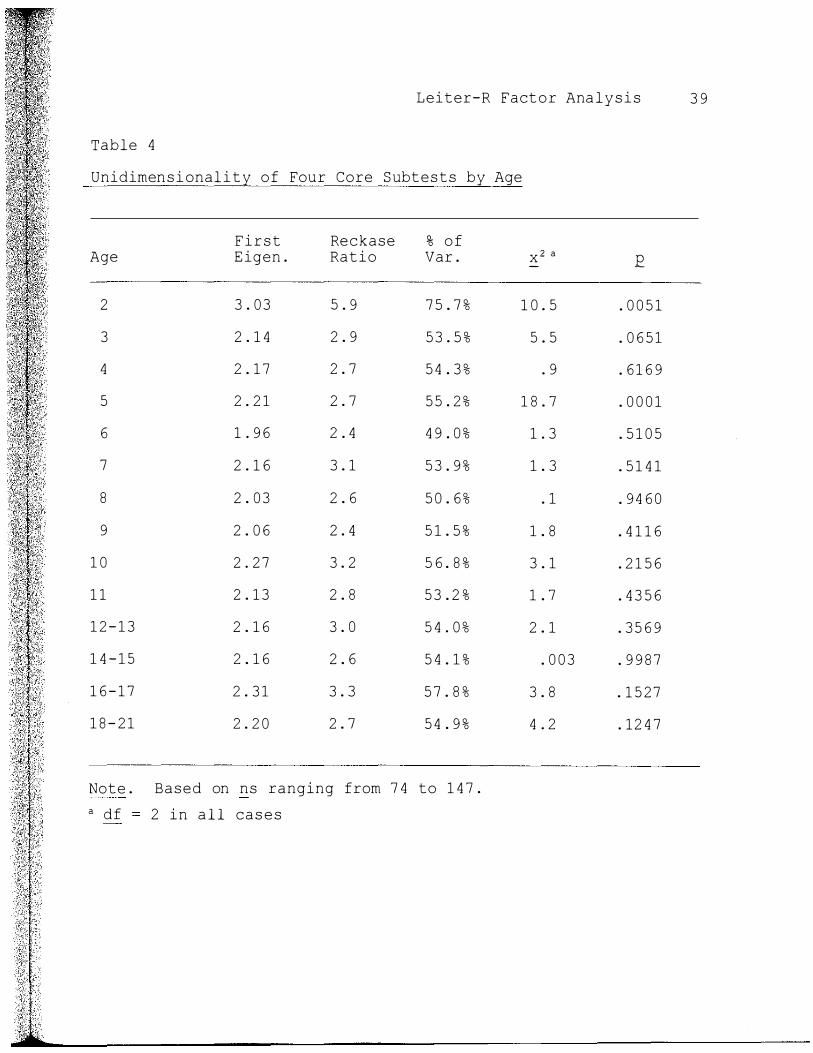
cons iderable overall unidimens ionality . Table 4 i l lustrates the
unidimensionality of factor structure acro s s the 1 4 age g roups .
Leiter-R Factor Anal y s i s 3 9
Table 4
Unidimens i onali t y of Four Core Subtests by Age
First Reckase 9-0 of Age E igen . Ratio Var .
2 3 . 0 3 5 . 9 7 5 . 7 %
3 2 . 1 4 2 . 9 5 3 . 5 %
4 2 . 1 7 2 . 7 5 4 . 3 %
5 2 . 2 1 2 . 7 5 5 . 2 %
6 1 . 9 6 2 . 4 4 9 . 0 %
7 2 . 1 6 3 . 1 5 3 . 9 %
8 2 . 0 3 2 . 6 5 0 . 6 %
9 2 . 0 6 2 . 4 5 1 . 5 %
1 0 2 . 2 7 3 . 2 5 6 . 8 %
1 1 2 . 1 3 2 . 8 5 3 . 2 %
1 2 - 1 3 2 . 1 6 3 . 0 5 4 . 0 %
1 4 - 1 5 2 . 1 6 2 . 6 5 4 . 1 %
1 6 - 1 7 2 . 3 1 3 . 3 5 7 . 8 %
1 8 - 2 1 2 . 2 0 2 . 7 5 4 . 9 %
Note . Based on ns ranging from 7 4 to 1 4 7 .
a df 2 in a l l cas e s
x 2 a -
1 0 . 5
5 . 5
. 9
1 8 . 7
1 . 3
1 . 3
. 1
1 . 8
3 . 1
1 . 7
2 . 1
. 0 0 3
3 . 8
4 . 2
£
. 0 0 5 1
. 0 6 5 1
. 6 1 6 9
. 0 0 0 1
. 5 1 0 5
. 5 1 4 1
. 9 4 6 0
. 4 1 1 6
. 2 1 5 6
. 4 3 5 6
. 3 5 6 9
. 9 9 8 7
. 1 5 2 7
. 1 2 4 7

Leiter-R Factor Ana l y s i s 4 0
Subtest Loadings on General Factor Across Age Groups
As outl i ned previ ou s l y , a one - factor model was ver i fied for
all 14 age groups . Whi l e the four core Leiter-R subt e s t s showed
some di f ferences in how s trongly they loaded on thi s general
factor , e specia l l y across age groups , factor loadings among
subtests showed conside rable cons istency overal l . Table 5 shows
loadings ( from the unrotated general factor ) for the four core
Leiter-R subtests on a general factor across age groups . To
briefly review, the core subtests are Sequenti a l Order ( SO ) ,
Repeated Patterns ( RP ) , Figure Ground ( FG ) , and Form Completion
( FC ) .
Table 5
Loadings on General Factor for Four Core Subt e s t s by Age
Age
1 2 - 1 4 - 1 6- 1 8 -Subtest 2 3 4 5 6 7 8 9 1 0 1 1 1 3 1 5 1 7 2 1
FG . 8 8 . 7 6 . 6 5 . 8 3 . 5 3 . 62 . 6 1 . 6 1 . 6 8 . 7 4 . 5 8 . 3 8 . 5 5 . 4 7
FC . 7 1 . 6 6 . 7 5 . 6 9 . 6 8 . 6 0 . 6 0 . 6 0 . 6 4 . 6 9 . 6 1 . 8 2 . 5 3 . 5 5
so . 8 5 . 4 9 . 6 7 . 5 1 . 6 3 . 6 1 . 6 7 . 8 5 . 6 6 . 5 6 . 6 6 . 7 7 . 8 1 . 6 3
RP . 8 5 . 5 4 . 4 2 . 4 9 . 4 3 . 6 6 . 4 6 . 3 1 . 6 2 . 4 6 . 6 4 . 5 1 . 7 4 . 8 7
Note . FG = Figure Ground subtest ; FC = Form Completion ; so = Sequential Orde r ; R P = Repeated Patterns . Based on ns ranging
from 7 4 to 1 4 7 .

Leiter-R Factor Ana l ys i s 4 1
S equential Order recorded the strongest average l oadings and
the second most con s i stent (� = . 6 7 , S O = . 1 1 ) . The Repeated
Patterns subtest showed the wea kest overall loadings and the
least con s i stent (� = . 5 7 , S O = . 1 6 ) . The most con s i s tent and
second stronges t loadings were repre sented by Form Completion ( M
= . 6 5 , S O = . 0 8 ) . S ubte s t loadings on the general factor are
j udged to represent fair strength , with an overall average
loading of . 6 3 , and good overall con s i s tency , g i ven that the
di fference between the highest ( SO ; M = . 6 7 ) and l owes t ( RP ; M
. 5 8 ) subtest loadings i s 0 . 1 . Table 6 shows average loadings ,
standard deviations , and range of loading scores for the four
subtests .
Table 6
De scriptive Stati s t i cs for Loadings on General Factor o f Four
Core Subt e s t s Acr o s s Age Groups
Subtest
Figure Ground
Form Completion
Sequential Order
Repeated Patterns
Note . N 1 , 3 7 1 .
M
. 6 3
. 6 5
. 6 7
. 5 7
Range
s o Minimum Maximum
. 1 4 . 3 8 . 8 8
. 0 8 . 5 3 . 8 2
. 1 1 . 4 9 . 8 5
. 1 6 . 3 1 . 8 7

Leiter-R Factor Ana l ys i s 4 2
S ubt e s t s showed certain trends over the 2 - 2 1 age span . The
Figure Ground subtest had con s i s tently high loadings in ages 2 -
1 1 , but l oadings dropped o f f in the 1 2 - 2 1 age groups . I n fact ,
when ages are s eparated into two categorie s , 2 - 1 1 and 1 2 - 2 1 ,
Figure Ground had the highest mean loadings in the former
category (� = . 6 9 , S O = . 1 1 ) , but the lowest in the l atter ( M
. 5 1 , S D = . 0 6 ) .
Repeated Patterns yielded nearly the oppos i t e re sul t , having
l ow overall loadings in the 2 - 1 1 age groups (� = . 5 2 , S D . 1 5 ) ,
but high l oadings in ages 1 2 -2 1 ( M = . 6 9 , S D = . 1 5 ) .
An overal l t rend was for the general visual i zation subtests
to have s omewhat higher loadings than the fluid reasoning
subtests among younger chi ldren ( ages 2 - 1 1 ) , but for the fluid
reasoning subtes t s to yield higher loadings among older chi ldren
and young adults ( ages 1 2 -2 1 ) . Table 7 compares mean loadings
for the subtests in the se two broad age categorie s .
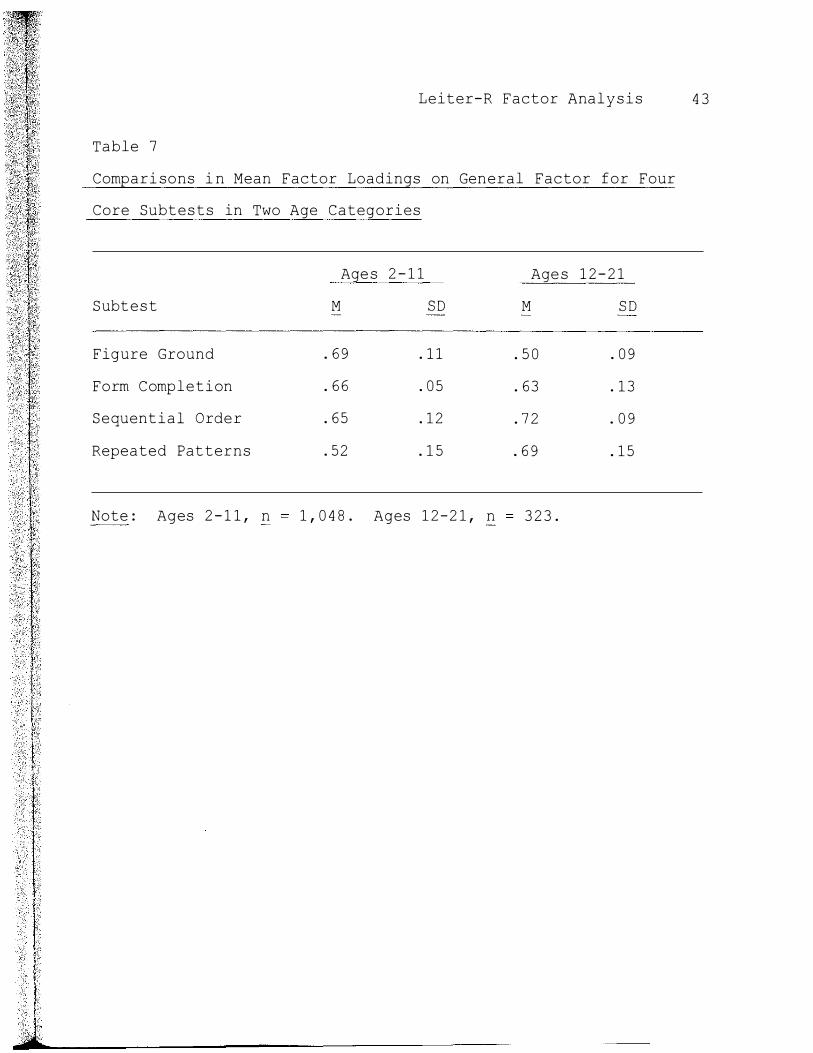
Table 7
Leiter-R Factor Anal y s i s 4 3
Compari sons i n Mean Factor Loadings on General Factor for Four
Core Subtests in Two Age Categories
Age s 2 - 1 1 Age s 1 2 - 2 1
Subtest M s o M s o
Figure Ground . 6 9 . 1 1 . 5 0 . 0 9
Form Completion . 6 6 . 0 5 . 6 3 . 1 3
Sequential Order . 6 5 . 1 2 . 7 2 . 0 9
Repeated Patterns . 5 2 . 1 5 . 6 9 . 1 5
Note : Ages 2 - 1 1 , n 1 , 0 4 8 . Ages 1 2 -2 1 , n 3 2 3 .

Leiter-R Factor Ana l y s i s 4 4
Factor Ana l ys i s o f Three Larger Age Groups
This s ection reports resul t s of the factor analyse s of the
three l a rger age groups : 2 - 5 , 6- 1 0 , and 1 1 -2 1 . Fol l owing an
exploration of the overall results as they relate to factor
s t ructure , speci fic results from each of the age groups a re
examined individually and in greater detail . Fina l l y , a brief
subsection i s dedicated to examining results speci fic to the
Des i gn Analogies subt e s t .
Overall E FA Re sults for Three Larger Age Groups
Exploratory factor analyses ( E FA ) revealed greater
di f ferentiation of factors within the larger age groupings than
with the s ingle-year age groups , though unidimens ionali t y--which
points to a one- factor s tructure--still received the stronge st
statistical support . When EFA were run on the three age groups ,
in each case the S PS S statistical package ( Norus i s , 1 9 8 8 )
initially indicated a one- factor structure . After that , in order
to explore the pos s ibility of additional factors , S P S S wa s
instructed to analyze the data from each age group in terms of a
two- factor s t ructure .
Several indicators were used to determine the number of
factors : chi - s quare t e s t s , eigenvalue s , scree plot s , and the
Reckase ratio .
Chi - s quare . I n terms o f chi - s quare result s , in the 2 - 5 age
group a two- factor model (�� = 1 6 . 4 , df = 8 , £ = . 0 3 7 0 ) produced
a margina l l y better fit than a one - factor model (�2 - = 5 9 . 4 , df =
1 4 , £ = . 0 0 0 0 ) , a s the two- factor model more closely approximated

Leiter-R Factor Ana l ys i s 4 5
Marsh , Balla , and McDonald ' s ( 1 9 8 8 ) proposed 2 : 1 ratio between
x2 : df . S imi l a r results eme rged i n the 1 1 -2 1 age group , where the
two- factor model (�� = 1 1 . 2 , df = 8 , E = . 1 9 0 1 ) produced a
margina l l y better fit than the one - factor model ( �2 - = 4 1 . 9 , df =
1 4 , E = . 0 0 0 1 ) . Chi - s quare results from the 6 - 1 0 age group were
di f f i cult to j udge , with both the two- factor model (�2 = 2 . 8 , df
= 4 , E = . 5 9 5 4 ) and the one-factor model (�2- = 1 9 . 9 , df = 9 , E = . 0 1 8 3 ) yielding acceptable result s . In this age group , the one-
factor model was chosen as best fit due to a 2 : 1 x2 : df ratio and
a reasonable E value given the large sample s i z e ( n = 4 3 8 ) .
Re sults o f chi - s quare tests for one- and two- factor model s are
presented i n Table 8 .
ii •II il , , ·

Leiter-R Factor Analy s i s 4 6
E igenval ue s . Using Guttman ' s ( 1 9 5 4 ) standard o f a minimum
eigenvalue o f 1 . 0 to indicate s i gn i fi cant factor s , eigenvalues
pointed to a one- factor s t ructure as the best fit i n each age
group . However , a s noted by Gorsuch ( 1 9 8 3 ) , the eigenvalue
criterion probably best be conceptuali zed as mea suring the lower
bound for the number of factors rather than measuring the actual
number o f factor s . Table 9 pre sent s the eigenvalues obtained for
each of the three l arger age groups .
Table 9
E i genvalues for Three Maj or Age Groups
Factor Age 2 - 5 Age 6 - 1 0 Age 1 1 - 2 1
1 3 . 7 0 2 . 6 8 3 . 3 7
2 . 8 6 . 8 6 . 8 1
3 . 6 0 . 7 1 . 6 9
4 . 5 4 . 62 . 6 5
5 . 4 8 . 5 9 . 5 3
6 . 4 2 . 5 4 . 5 0
7 . 4 0 . 4 6
Note . Age 2 - 5 , n 5 2 3 . Age 6- 1 0 , n = 4 3 8 . Age 1 1 -2 1 , n 4 1 0 .

Leiter-R Factor Ana l ys i s 4 7
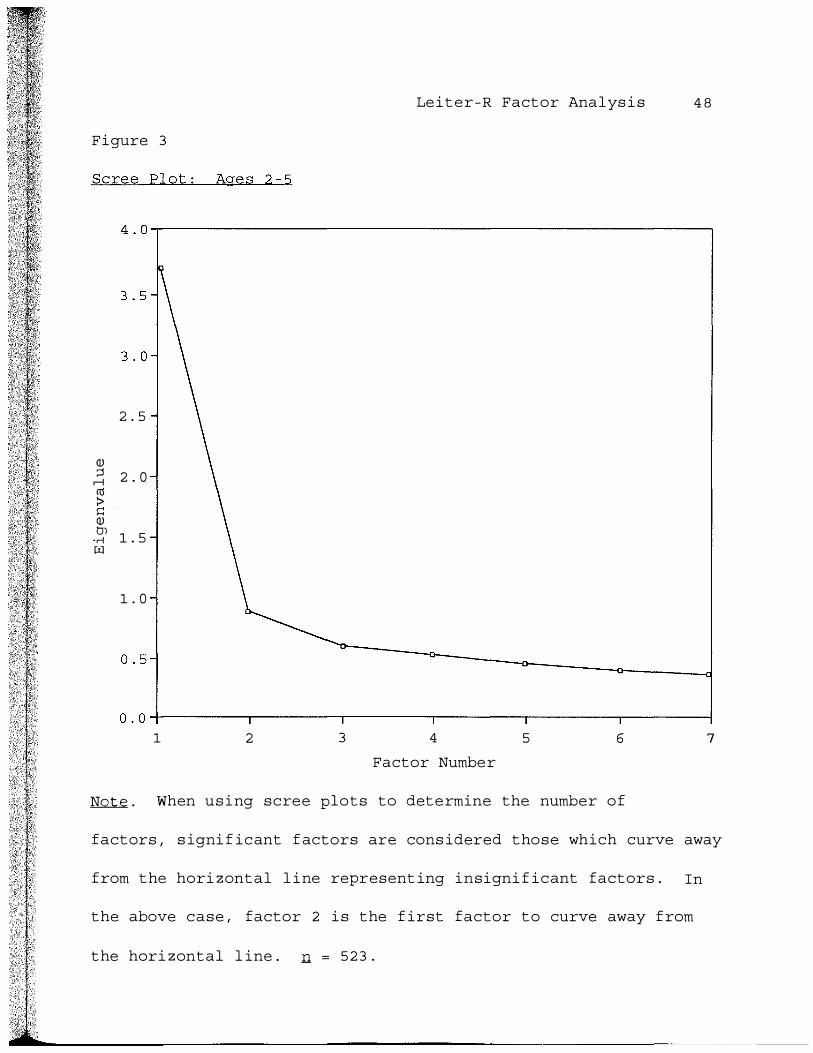
Scree plots . Manual l y ana l yz ing scree plots i ncludes a
degree o f subj ectivity ( Gorsuch , 1 9 8 3 ) , as it i nvolves a vi sual
j udgment o f the point at whi ch s i gnificant factors curve away and
s eparate from the straight l ine compri s ing the i n s i gni fi cant
factors . I n the pres ent study , scree plots from the 6 - 1 0 and 1 1 -
2 1 age groups clearly depicted one - factor mode l s . Howeve r , the
scree plot repre senting the 2 - 5 age group was more di f f i cult to
j udge . Whi l e the curve between the second and third factors did
not repre sent a deci s i ve demarcation , the second factor did
visually deviate upward above the line of ins i gni fi cant factors .
I n this case the two- factor model was chosen a s the best fit ,
based on Gorsuch ' s ( 1 9 8 3 ) view o f scree plot s a s repre senting the
lower bound for number of factors , and on Cattel l ' s ( 1 9 7 8 ) view
that erring on the s i de o f extracting too many factors i s
pre ferable with s cree plot s . Figure 2 i l lu s t rates the scree plot
for the 2 - 5 age group .
Le i t e r - R F a c t o r Ana l ys i s 4 8
F i gure 3
Scree Plot : Ages 2 - 5
2 . 5
� � 2 . 0 � ro ? � � m
1 . 5 ·rl �
1 . 0
1 2 3 4 5 6
Factor Numbe r
� . When u s i ng s c re e pl o t s to det e rmine the numbe r o f
7
f a c t ors , s igni f i c ant f actors are cons idered t ho s e whi c h curve away
f rom t he hori z ont a l l i ne repr e s ent ing i n s i gni f i c ant f a c t o r s . In
t he above c a s e , factor 2 i s t he f i r s t f a c t o r t o curve away f rom
t he hori z ont a l l ine . n = 5 2 3 .

Leiter-R Factor Anal ys i s 4 9
Reckase ratio . As with the 1 4 smaller age groups , the
Reckase ratio for the three larger age groups indicated
cons iderable unidimens ionality . Al l three groups surpas s ed the
3 : 1 standard deemed by Reckase to represent good
unidimensional i t y . However , it is important to note here as in
chapter 2 that whi le the Reckase ratio is use ful in mea suring the
strength of a one- factor model , it can only indi rect ly reflect on
which factor model offers the best fit . Table 1 0 give s the
Reckase ratio as well as the percent of variance accounted for by
the one- factor model in each age group .
Table 1 0
Unidimensionality o f Leiter-R Subtests for Each Maj or Age Group
# o f Fi rst Recka s e % o f Age n Subtests E i gen . Ratio Var . -
2 - 5 5 2 3 7 3 . 7 0 4 . 3 5 2 . 9 %
6 - 1 0 4 3 8 6 2 . 6 8 3 . 2 4 4 . 7 %
1 1 - 2 1 4 1 0 7 3 . 3 7 4 . 2 4 8 . 2 %

Leiter-R Factor Anal ys i s 5 0
S ummary . I n summa r y , the one-factor model predominated in
the E FA o f the three l arger age groups , though there were
indicat ions o f additional factors . Table 1 1 summa r i z e s the
number of factors by age group using chi - s quare , e igenvalue , and
scree plot s .
Table 1 1
Number o f Factors i n Maj or Age G roups by Four Criteria :
Chi - S quare , Scree , E i genvalue , and Reckase Rati o
Age
2 - 5
6 - 1 0
1 1 - 2 1
n
5 2 3
4 3 8
4 1 0
# Subt e s t s
7
6
7
2
1
2
Scree
2
1
1
E i gen >1
1
1
1
Recka s e
4 . 3
3 . 2
4 . 2

Leiter-R Factor Analy s i s 5 1
Spec i f i c Factor I nformation for Three Larger Age Groups
This section detail s EFA results for each o f the three
larger age groups : 2 - 5 , 6- 1 0 , and 1 1 -2 1 .
Age s 2 - 5 . Thi s age group showed the great e s t evidence of a
two- factor s t ructure . The initial EFA extraction o f one factor
and only one eigenvalue � 1 pointed toward a one - f actor mode l ,
and a strong Recka s e ratio ( 4 . 3 : 1 ) indicated strong
unidimens i onality . However , the chi - s quare test and scree plot
indicated a two- factor model .
When instructed to evaluate a two- factor mode l , the
stat i s t i ca l s o ftware produced the fol lowing factor matrix : one
factor represented by the Sequential Order and Repeated Patterns
subtes t s , and another represented by the Figure Ground , Form
Completion , Matchin g , Picture Context , and Cla s s i fi cation
subte sts . Table 1 2 port rays the factor matrix o f the 2 - 5 age
group using a two- factor model .
' i �

Table 1 2
Two - Factor Model for 2 - 5 Age Group
S ubtest
Matching
Cla s s i fication
Picture Context
Form Completion
Repeated Patterns
Sequenti a l Order
Figure Ground
Note . n 5 2 3 .
Factor 1
. 7 9 5 8
. 7 7 4 4
. 6 8 0 9
. 5 3 8 2
- . 0 4 1 6
. 1 4 3 7
. 4 7 0 2
Leiter-R Factor Ana l ys i s 5 2
Factor 2
- . 0 8 8 9
- . 0 1 6 9
. 0 4 5 0
. 2 1 7 8
. 6 7 5 8
. 5 4 2 5
. 3 4 67

Leiter-R Factor Ana l y s i s 5 3
Age s 6 - 1 0 . Most i ndicator s - -initial E FA extract i on ,
eigenvalue crite r i a , scree plot , and Reckase ratio- - s upported a
one- factor model for this age group . Chi - s quare results were
equivocal , supporting either a one- or two- factor model . When
instructed to analyze a two- factor model , EFA produced a factor
matrix that was di f f i cult to interpret , with Figure Ground, Form
Completion , and Sequenti a l Order gathered under the f i r s t factor ,
Paper Folding and De s ign Analogies in the second factor , and
Repeated Patterns having marginal and nearly equal l oadings on
each factor . Table 1 3 portrays the factor matrix o f the 6 - 1 0 age
group using a two- factor model .
Table 1 3
Two-Factor Model for 6 - 1 0 Age Group
S ub test
Sequenti a l Order
Form Completion
Figure Ground
Paper Folding
Des i gn Analogies
Repeated Patterns
Note . n 4 3 8 .
Factor 1
. 6 9 6 1
. 6 5 8 3
. 4 8 4 6
- . 0 4 4 3
. 2 7 65
. 3 0 0 6
Factor 2
- . 0 3 3 8
- . 0 4 4 3
. 1 8 8 4
. 65 1 2
. 4 3 9 8
. 2 8 0 5

Leiter-R Factor Anal y s i s 5 4
Ages 1 1 - 2 1 . As with the 6 - 1 0 age group , mos t evidence -
initial E FA extract ion , e igenvalue criteri a , scree plot , and
Recka s e ratio--of fered support for a one- factor mode l . However ,
the chi - s quare t e s t revealed marginal l y better results i n favor
of a two- factor model . When instructed to analyze a two- factor
model , E FA produced the following factor matrix : a f i r s t factor
repre sented by S e quent i a l Orde r , Repeated Pattern s , and Form
Completion , and a second factor reprented by Paper Folding and
Figure Rotation . Figure Ground and Des i gn Analogies appear to be
factori a l l y ambiguous , with Figure Ground leaning toward the
first factor and De s i gn Analogies the second . Table 1 4 portrays
the factor matrix of the 1 1 - 2 1 age group using a two- factor
model .

Table 1 4
Leiter-R Factor Ana l ys i s 5 5
Two- Factor Model f o r 1 1 - 2 1 Age Group
Subtest Factor 1 Factor 2
Sequenti a l Order . 7 3 6 5 - . 0 6 1 3
Repeated Patterns . 6 6 1 8 - . 0 1 9 1
Form Completion . 5 0 7 4 . 1 5 0 3
Figure Ground . 3 4 9 3 . 2 4 8 6
Figure Rotation - . 0 5 92 . 7 5 0 8
Paper Folding . 1 0 7 3 . 6 5 9 1
Des i gn Analogies . 3 2 9 0 . 4 0 5 0
Note . Factor 2 i s reflected ( po s itive value s are shown a s
negative , and vice-versa ) . n = 4 1 0 .

Design Ana l ogies Subtest
Leiter-R Factor Ana l y s i s 5 6
When a two- factor model was computed, the Des i gn Analogies
subtest was factorially ambiguous in the 1 1 - 2 1 age group ( factor
l oadings o f . 4 0 5 0 and . 3 2 9 0 ) and relative l y ambiguous i n the 6 - 1 0
age group ( factor l oadings of . 4 3 9 8 and . 2 7 65 ) ( De s i gn Analogies
i s not included among the subtests in the 2-5 age group ) .
Howeve r , i n the general- factor model s ( one- factor mode l s ) which
best fit the data for both these age groups , De s i gn Analogies
evidenced the s tronge st overall l oadings of any s ubtest on the
general factor . Table 1 5 shows general- factor l oadings for
Leiter-R subt e s t s in the 6 - 1 0 and 1 1 - 2 1 age groups .
Table 1 5
General - Factor Loadings for Leiter-R Subtests i n Two Age Groups
S ubtest
Des i gn Analogies
Fi gure Ground
Sequent i a l Order
Repeated Patterns
Paper Folding
Form Completion
Figure Rotation
Note . Age s 6 - 1 0 , n
General- Factor Loadings
Age s 6 - 1 0 Ages 1 1 - 2 1
. 62 9 9 . 6 9 62
. 6 3 3 6 . 5 5 9 6
. 62 3 9 . 6 5 4 7
. 5 2 65 . 6 1 3 6
. 4 7 6 9 . 6 5 4 1
. 5 8 3 4 . 6 5 0 5
. 6 0 92
4 3 8 . Ages 1 1 -2 1 , n 4 1 0 .

Leiter-R Factor Anal ys i s 5 7
Summary
A total o f 17 exploratory factor analyse s - - 1 4 on smaller age
groupings , 3 on l a rger age groupings--were conducted u s ing 1 0
subt e s t s o f the Leiter-R . Re sults o f the EFAs on the 1 4 smaller
a ge groups revealed unanimous support for one- factor ( general
factor ) mode l s . General- factor loadings of the four core
Leiter-R subt e s t s were compared across age groups , sugges ting
distinct t rends for individual subtest s .
The E FAs o f the 3 larger age groups showed predominant
support for one- factor mode l s , coupled with s ome evidence
supporting two- factor mode l s . Pos sible two- factor s t ructures for
each o f the three age groups were explored . When two factor
model s were computed , the De sign Analogies subtest wa s found to
be factorially ambiguous , yet to have strong general- factor
loadings .

Leiter-R Factor Ana l y s i s 5 8
Chapte r 4
Di scu s s i on
Thi s chapte r di s cu s s e s the results of the present factor
analyses i n sect ions for each o f the three research ques tions :
( a ) exploration o f Leiter-R factor structure ; ( b ) ver i fication of
Gf and Gv in the Leiter-R; and ( c ) implications for the age
di fferentiation hypothe s i s . In addition , l imitations o f the
s tudy and ideas for future research are discu s s e d , fol l owed by a
brief summary s e ction . Because many of the se i s s ues are closely
related , there is conside rable overlap among section s ,
particula r l y those sections dea l ing with the f i r s t two research
questions .
Re search Que s t i on 1 : Exp loration of Leiter-R Factor S t ructure
The Exploratory Factor Ana l y s i s ( EFA ) reve a l ed certain
characteristics o f Leiter-R factor structure whi ch wi l l be dealt
with in two subsections : ( a ) A Strong g Influence , and ( b ) EFA
Implications for Four Core Leiter-R S ubtests .
A St rong g Influence
Perhaps the mos t notable result of the present E FA was the
robust i n f l uence of g across age groups and acros s Leiter-R
subte sts . For the 1 4 age groups , in each case a one- factor model
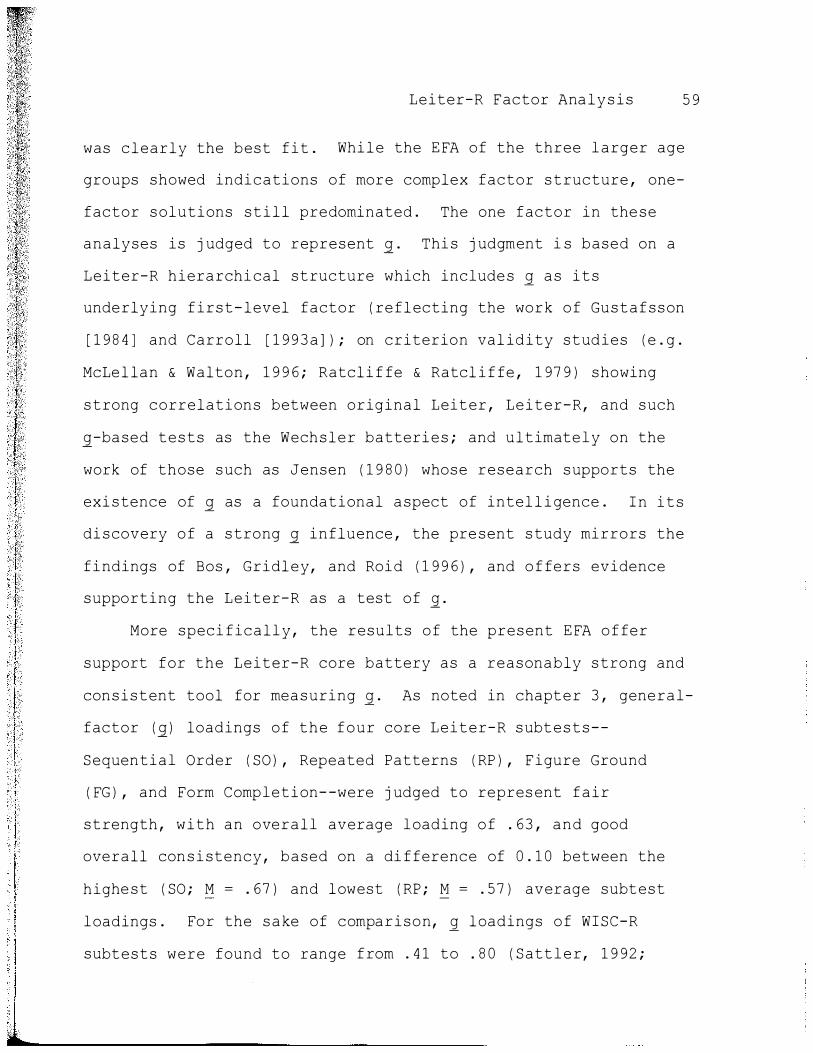
Leiter-R Factor Ana l y s i s 5 9
was clearly the best fit . Whi l e the E FA of the three l arger age
groups showed indications of more complex factor s tructure , one
factor s olutions s t i l l predominated . The one factor in the se
analyses is j udged to represent g . Thi s j udgment i s based on a
Leiter-R hierarchi cal structure which include s g a s i t s
underlying first- level factor ( re flecting the work o f Gustafsson
[ 1 9 8 4 ] and Carroll [ 1 9 9 3 a ] ) ; on criterion val idity studies ( e . g .
McLel lan & Walton , 1 9 9 6 ; Ratcli f fe & Ratcl i f fe , 1 9 7 9 ) showing
s t rong correlations between original Leiter , Leiter-R , and such
g-based t e s t s as the Wechsler batterie s ; and ultimate l y on the
work of those such as Jensen ( 1 9 8 0 ) whose research supports the
exi stence of g as a foundational a spect of intel l i gence . I n i t s
di scovery o f a s trong g influence , the pre sent s tudy mirrors the
findings of Bos , Gridl e y , and Roid ( 1 9 9 6 ) , and o f fers evidence
supporting the Leiter-R as a test of g .
More speci ficall y , the results o f the present E FA o f fer
support for the Leiter-R core battery as a reasonably s trong and
con s i s tent tool for mea suring g . As noted in chapte r 3 , general
factor (g ) loadings o f the four core Leiter-R subt e s t s -
Sequential Order ( SO ) , Repeated Patterns ( RP ) , Figure Ground
( FG ) , and Form Completion- -were j udged to repres ent fair
strength , with an overall average loading o f . 6 3 , and good
overall con s i stency , based on a di fference of 0 . 1 0 between the
highe st ( SO ; M = . 6 7 ) and lowest ( RP ; � = . 5 7 ) average subtest
loadings . For the s a ke of comparison , g loadings o f WI SC-R
subtests were found to range from . 4 1 to . 8 0 ( Satt l e r , 1 9 92 ;

Leiter-R Factor Ana l y s i s 6 0
taken from Kaufman ' s [ 1 9 7 5 ] factor anal ys i s o f 1 1 a g e g roups ages
6 - 1 /2 through 1 6- 1 / 2 ) .
E FA Implications for Four Core Leiter-R subtests
Re sults o f this study may a l s o have specific imp l i cations
for individual subtests i n the Leiter-R core battery . The se
implications are di scussed with caution , a s the present E FA is
among the initial analyses of the Leiter-R .
The results i ndicate the Form Completion ( FC ) subt e s t
provides a s a t i s factory a n d con s i stent measure o f g acros s the
Leiter-R age range ( 2 -2 1 ) , but e specially up to age 1 5 . This
subtest had the lowe st standard deviation of loadings ( S D = . 8 )
among the core Leiter-R subtests , and the second highe s t average
loading (M = . 6 5 ) . The results sugges t FC is a better measure o f
g among chi ldren and e a r l y adoles cents ( ages 2 - 1 5 ) than among
older adole s cents and young adults ( ages 1 6-2 1 ) . The 1 6- 2 1 age
range produced FC ' s two lowest g loadings .
The Figure Ground ( FG ) subtest exhibited a pattern s imi l a r
to FC , w i t h t h e exception that g loadings dropped o f f further and
s oone r . The results indicate FG i s a better measure of g among
children and pre-adol e s cent s ( ages 2 - 1 1 ) than among teenagers and
young adults ( ages 1 2 -2 1 ) . In the younger age category, FG had
the highe st mean g l oading (M = . 6 9 ) , but among the older age
category the l owes t (M = . 5 0 ) .
The Sequential Order ( SO ) subtest produced , with few
exceptions , high g loadings acro s s the entire age range . This
subtest had the h i ghest overall g loading ( M = . 6 7 ) , and appears

Leiter-R Factor Ana l y s i s 6 1
to b e a s a t i s factory measure o f g in most age g roups . The SO
subtest has the most item responses ( 4 7 ) and the best progre s s ion
o f age means among a l l subtes t s .
The Repeated Patterns ( RP ) subtest had the lowe st overall g
loading (� . 5 7 ) . The results indicate RP becomes a better
measure o f g a s age increa s e s . This subtest had the lowe s t
average loading ( M = . 5 3 ) i n ages 1 - 1 1 , but the s econd highest i n
a g e s 1 2 - 2 1 (� = . 6 9 ) and the highest i n ages 1 6-2 1 ( M = . 8 1 ) .
The RP subt e s t has onl y 2 7 items ( vs . 4 7 for S O ) .
The above results combined to create a t rend whe reby the two
subt e s t s ( FC and FG ) repre senting general visua l i zation in the
Leiter-R theoretical s tructure had somewhat higher loadings than
the fluid reasoning subt e s t s among young chi l dren ( ages 3 - 6 ) ,
whi l e the subt e s t s repre senting fluid reasoning yielded markedly
higher loadings among adolescent s and young adults ( ages 1 6-2 1 ) .
One pos s ible reason for this trend i s that general
visua l i zation and fluid reasoning are separate and i denti fi able
factors i n the Leiter-R , a s reported by Bos , Gridl e y , and Roid
( 1 9 9 6 ) , and are factors whose strengths and funct ions change
with a person ' s age . Under this explanat i on , general
visua l i z at ion woul d be more close l y linked to g among younger
people and fluid reasoning would more closely approximate g among
older age groups . Us ing this explanation , the pre sent trend
offers support for the age differentiation hypothe s i s , to be
di scus sed later in this chapter .

Leiter-R Factor Ana l y s i s 62
Another reason for the above-mentioned trend may be test
item di stribution . The general visuali zation subtes t s contain
proportiona l l y greater numbers of test items whi ch have a low
degree of di f ficulty and thus apply to the lower age g roup s ,
while the fluid reasoning test items tend t o cluster higher on
the degree-of-di fficulty and age continuums ( Mads en , Roi d , &
Mil l e r , 1 9 9 6 ) . I t could be that general visua l i zat i on and fluid
rea soning subt e s t s have proportiona l l y greater presence , and
influence as it relates to measuring g, in the younger and older
age range s , respective l y .
Re search Que stion 2 : Ve ri fication of Gf and Gv in the Leiter-R
This section contains three subsections . The f i r s t
subsection di scus s e s veri fication of Gf and G v in t h e Leiter-R,
the second explores evidence for a spatial visuali zation factor
in the Leiter-R, and the third examines E FA results a s they
relate to the De s ign Analogies subtest .
Evidence for Gf and Gv in the Leiter-R
Fluid reasoning ( Gf ) and general visua l i z ation ( Gv ) , as
de fined by Horn and Cattell ( 1 9 6 6 ) , are second-level factors in
the Leiter-R ' s hierarchical structure , which r e s t s largely on the
work of Carroll ( 1 9 93 a ) and Gustafs son ( 1 9 8 4 ) . These factors
have been identi fied by other researchers ( Bos , 1 9 9 5 ; Bos ,
Gridley , & Roid , 1 9 9 6 ) in their factor analyses of the Leiter-R .
The pres ent s tudy did not corroborate the Bos et al . findings .
Thi s section will f i r s t discuss the results o f this study that

l t l
. I I j � I l I I ! I
l 1
. I 0 I
Leiter-R Factor Ana l y s i s 6 3
support a two- factor s tructure , and then explore pos s ib l e
explanations of why more evidence f o r a two- factor structure was
not found .
One factor analys i s in the present study g ave cons iderable
indication of a two- factor structure : the E FA o f the 2 - 5 age
group (� = 5 2 3 ) . In this anal ys i s , chi - s quare and scree plot
resul t s were j udged to favor a two- factor structure , and the
second eigenvalue approached s igni ficance ( . 8 63 ) . When
instructed to analyze the data us ing a two- factor structure , the
statistical software produced a factor matrix which closely
mi rrored the Leiter-R theoret ical structure . One factor can be
ident i fied as fluid reasoning , as repre sented by the Sequential
Order and Repeated Patterns subte sts . A second factor can be
l abeled general visua l i zation , and is repres ented by Figure
Ground, Form Completion , and three other visua l l y oriented
subte sts . The other two age groups - - 6 - 1 0 and 1 1 - 2 1 - -gave l e s s
evidence of a two- factor structure , and the two- factor evidence
which emerged did not closely follow the proposed G f /Gv split .
Why did this study not find stronger evidence o f Gf and Gv?
I t may be that the strong g influence in this s tudy made it
di fficult to dif ferentiate other factors . A factor analyt i c
method which neutra l i z e s t h e influence of g might h e l p clarify
s econd-level factors in the Leiter-R ( G . H . Roi d , personal
communication , October 1 1 , 1 9 9 6 ) . Specific hierarchical factor
analys i s programs have been deve loped for extracting a g factor
a s wel l a s specific factors from correlational dat a , including

Leiter-R Factor Analy s i s 6 4
Gorsuch ' s ( 1 9 8 8 ) UNIMULT program and programs employed by Carrol l
( 1 9 93b ) .
Another potential reason i s that the present study did not
uti l i z e a l l 2 0 Leiter-R subtest s , including the 1 0 s ubte s t s
repre senting t h e s econd-l evel factors o f memory and
concent ration . I ncluding these subtests in factor analyses o f
the Leiter-R tends to help clari fy a l l the second-level factors ,
including general visuali zation and fluid reasoning , according to
one of the authors o f the Leiter-R, G . H . Roi d ( pe r s onal
communi cat i on , October 1 1 , 1 9 9 6 ) .
Final l y , the emergence of a spatial vi sua l i z at i on factor ,
which has been i denti fi ed in the Leiter-R by other researchers
( e . g . Madsen , 1 9 9 6 ; Madsen , Roi d , & Miller , 1 9 9 6 ) , may have
negatively impacted the abi l i t y of the present factor analys i s to
clearly i denti f y Gf and Gv i n the older age groups . This spatial
visuali zation factor wi l l be dis cus sed in the fol lowing s ection .
Evidence for a Spatial Visuali zation Factor in the Leiter-R
The primary focus o f the verification portion o f thi s study
was ident i f i cation of Gf and Gv , as j ust di s cus sed . Howeve r , it
also was expected that evidence might emerge o f a spatial
visual i zation factor among older age groups . Factor analyses of
the 6 - 1 0 and 1 1 - 2 1 age groups suggest emergence o f such a factor .
When directed to compute a two- factor s tructure for the 6 - 1 0
age group , the stat i s t i ca l software produced a factor which had a
strong loading ( . 6 5 ) from the Paper Folding subtest and a
moderate l oading ( . 4 4 ) from the De s i gn Analogies subte st . In the

Leiter-R Factor Ana l y s i s 6 5
1 1 -2 1 a g e g roup , a s imi l ar factor emerged , with s trong l oadings
from Paper Folding ( . 6 6 ) and Figure Rotation ( . 7 5 ) and again a
moderate loading f rom De s ign Analogies ( . 4 0 ) .
I n the Leiter-R theoret ical f ramework, the Paper Folding and
Figure Rotation subtests repres ent a spat ial vi sua l i zation factor
whi ch begins emerging f rom within the Gv subt e s t s once a chi ld
reache s school age . The Des ign Analogies subte st , which
exhibited moderate l oadings on thi s factor , has been found to
have many visual - rotation matrix-reasoning items ( G . H . Roi d ,
personal communi cation , October 1 1 , 1 9 9 6 ) and hence to be
correlated with spatial abi l ity .
Because identi fication o f a spatial vi suali z at i on factor was
not a primary goal o f this s tudy , this construct was not explored
i n previous chapters . A brief exploration fol l ows .
The Leiter-R ' s spat ial vi suali zation factor i s
conceptual i zed not a s a s eparate factor from Gv , but rather a s a
distinct domai n within Gv . Much research has been aimed at
identi fying and di f f e rentiat ing speci fic abi l i t i e s within the
broad scope o f vi sual perception , as i l lustrated in the work of
French ( 1 9 5 1 ) , who l i sted nine separate factors within the domain
o f visual percept ion . French termed one factor space , and
defined it as the abi l i t y to perceive spatial patterns accurately
and compare them with each other . French defined another factor ,
vi sual i zation , a s the abil i t y t o comprehend imaginary movements
in a three-dimensional space or the abi lity to manipulate obj ects
in imagination .
Leiter-R Factor Ana l y s i s 6 6
The factor French called space i s repre sentative o f the
abi l i t y mea sured by the Matching , Figure Ground, Form Completion ,
and Picture Context subtests in the Leiter-R . The s e s ubt e s t s
s t re s s accurate recognition and compari son o f vi sual s timul i .
French ' s vi sual i z at i on factor corre sponds closely to what
Carroll ( 1 9 93 a ) called spat ial rotation , and what the Leiter-R
cal l s a spatial visuali zation factor . The Paper Folding and
Figure Rotation s ubt e s t s and, to the extent it contains vi sual
rotation items , Des i gn Analogie s , go beyond recognition and
comparison of vi sual s timul i ; they requ i re participants to
menta l l y manipulate and/or rotate the stimul i .
In addition , as noted by Carroll ( 1 9 9 3 a ) , spat i a l rotation
t a s ks t ypica l l y are characteri zed not only by the abi l ity to
menta l l y manipulate vi s ua l obj ects , but also the speed with whi ch
the t a s k i s complete d . The three Leiter-R spati a l v i s ua l i zation
subte st s , in contrast to the other seven Leiter-R subt e s t s in the
pres ent study , contain items whi ch a s s e s s and reward speed of
t a s k completion . A t ime bonus i s used for three o f the most
di fficult items i n each o f the spatial vi sua l i zation subtest s .
I n conclusion , whi l e overall EFA results pointed to a one
factor (g) mode l , when a two- factor model was forced, spatial
visuali zation appeared to emerge in the two older age groups .
The se result s o f f e r evidence supporting the relevant Leiter-R
subte sts a s an appropriate measure of spatial visuali zation
ability .

De s i gn Anal ogies Subte s t
Leiter-R Factor Analy s i s 6 7
A s noted in chapte r 3 , the De s i gn Analogie s subte st , which
is included i n the Leiter-R battery for ages 6 - 2 1 , proved to be
factor i a l l y ambiguous in the 1 1 - 2 1 age g roup and relatively
ambiguous i n the 6 - 1 0 age group . At the same t ime , De s ign
Analogies had the s t rongest overall general- factor loadings ln
the combined 6-2 1 age range .
I t appears from the s e results that the Des i gn Analogies
subtest i s a good measure o f g , particularly among adole s cent s .
Des i gn Analogies a l s o appears factorially ambiguous . Whi l e it
measures fluid reasoning abilities , and thus is included among
the Leiter-R fluid reas oning subte sts , it a l s o has a s igni ficant
vi sual component , a s noted in the above sect i on on spati a l
vi sual i zation .
Research Ques tion 3 : Implications for the
Age Di f fe renti ation Hypothe s i s
Based o n the findings of Bos ( 1 9 9 5 ) , it wa s hypothesi zed
that the Leiter- R ' s factor structure would grow incre a s i ngly
complex and di f ferent iated a s age increased . T h i s would lend
support to the age di fferentiation hypothe s i s , whi ch states that
cognitive abil i t i e s grow increas ingly di f ferentiated from early
childhood to early adulthood . However , the present study found
l ittle conclusive evidence addre s sing the age di f fe renti at i on
hypothe s i s . This section discus ses the indi cations of age
di fference s whi ch did emerge , explores pos s ible reas ons why more

Leiter-R Factor Analys i s 6 8
evidence o f age di ffe rentiation was not found , and concludes with
a di scu s s ion o f whether age- related cognitive abi l i t i e s might
better be conceptual i zed in terms of cognitive prominence rather
than i n terms of cognitive di f fe rences .
The stronge st evidence in favor of age di f ferentiation come s
from the rather dramatic di f ference in general- factor ( g )
loadings between t h e f l u i d reasoning and general visuali zation
subt e s t s which emerged among older participants ( especi al l y ages
1 6-2 1 ; see Table 4 , p . 4 0 ) . The se results would sugges t a
distinct fluid rea soning abi l ity may emerge and/or become more
prominent as persons reach later adoles cence .
Why was little conclus ive evidence found for age
di f ferent iation ? One possibility i s that di fferentiation of
cognitive abi l i t i e s does not occur with age . Thi s view i s in
line with that o f Carroll ( 1 9 9 3 a ) , who sugge s t s cognitive factors
are stable over t ime .
Another pos s ib i l i t y i s that di f ferent i at i on o f cognitive
abi l i t i e s does occur , but this s tudy was not able to detect it .
Perhaps the influence o f the spatial visuali zation factor in the
6 - 1 0 and 1 1 - 2 1 age g roups reduced the clarity of factor
structure , and made it more di f ficult to stat i s tically reveal a
more complex factor structure . In addit i on , the pre sent study
included only two of the Leiter-R ' s four maj or second-level
factor s , and compari sons across the age span were l imited to the
four core subte s t s . Thus , the present study may not have been
well suited to reveal di fferent i ation . This latter reason seems

I I � I
Leiter-R Factor Anal y s i s 6 9
the mos t l i ke l y explanation f o r the failure to find support for
the di f ferentiation hypothes i s in the present analys i s .
Fina l l y , in regard to the age di fferent i at i on hypothes i s ,
perhaps age- rel ated cognit ive abi l ities are better conceptual i zed
i n terms o f cognitive prominence than in terms o f cognitive
di f ference s . Under this de finition , age di f ferentiation i s
thought o f a s the t iming o f relative prominence among cognitive
abi l i t i e s . With time , certain l atent cognitive capacities become
more promi nent , whi l e other a lready learned capacities are u s ed
l e s s but remain ava i l able .
Limitations o f the Study
As noted in chapte r 2 , the sampl e used in the pres ent study
repre sents onl y about 8 0 % of the final Leiter-R normative samp l e ,
a s data was sti l l being collected when this study was initiated .
Whi l e ns for a l l age g roups were j udged to be l arge enough to
minimi ze the e f fects o f s ampling errors ( see chapte r 2 for
di s cus s i on ) , it neverthe l e s s would have been pre ferable to
conduct the study with the larger final sample .
Another l imitation i s that the present study did not uti l i ze
a l l 2 0 Leiter-R subtes t s , including the addit i onal 1 0 subt e s t s
representing t h e s econd-level factors of memory and
concentration . The present study was aimed more speci fica l l y at
the other second- level factors of Gv and Gf ; however , including
the memory and attention subtests in the anal y s e s may have helped
clari fy/de l ineate a l l the second-level factor s , i ncluding Gv and

Leiter-R Factor Ana l y s i s 7 0
Gf . I t should be noted that including the addit i onal 1 0 subtests
could have reduced the s ample by about one hal f , given that the
memory subt e s t s were normed on a smaller subsample ( Madsen , Roi d ,
& Mil l e r , 1 9 9 6 ) .
Whi l e the factor analysis model that wa s chosen ( maximum
l i kel ihood E FA , obl imin rotation ) i s not cons ide red a l imitation
in i t s e l f , a factor analytic method whi ch minimi zed the influence
of 2 may have helped identi fy s econd-level factor s . As noted
earlier in this chapt e r , speci fic hierarchical factor analys i s
programs have been devel oped f o r extracting a 2 factor a s wel l a s
speci f i c factors from correlational data . Gorsuch ' s ( 1 9 8 8 )
UNIMULT program i s one such program . Carroll ( 1 9 9 3b ) has
employed s imi l i a r programs , which are based on the wor k o f Schmid
and Leiman ( 1 9 5 7 ) . Because these programs are highly speci a l i zed
and mus t be obtained from the developers , they are less wide l y
ava i l able . Hence , they were not employed in thi s di s sertation .
Future resea rchers could explore such options .
I deas for Future Re search
Given the results of the present study , further research i s
needed to ver i fy G v and Gf as second-level factors in the
Leiter-R . Cons idering the robust influence o f 2r i t i s suggested
that future factor analyses o f the Leiter-R woul d benefit from
using a factor analytic method that can minimi ze the impact of 2 and a l l ow clearer del ineation of second-level factors . Future
factor analyse s might a l s o make use o f the l a rger final Leiter-R

Leiter-R Factor Ana l y s i s 7 1
normative sample , and include a l l 2 0 Leiter-R subte s t s a s an aid
in factor ident i f i cation .
The eme r gence of a spat ial vi sua l i zation factor i n the older
age groups ( 6- 1 0 and 1 1 -2 1 ) sugge sts it may be qui t e a distinct
fact o r , whi ch future research could veri fy . I n a related vein ,
further research could help clari fy the dynamics o f the De s i gn
Analogies subtest , whi ch appeared to be factoria l l y amb i guous ,
l oaded most heavi l y on the spatial vi s ual i z at ion f a ctor , and
proved to be quite a s trong measure of g in the 6 - 2 1 age range .
General- factor ( g ) loading trends o f the four core Leiter-R
subt e s t s acros s age groupings present a fruit ful area for
resea rch . Further studies might help reveal whi ch Leiter-R
subtests are better i ndicators o f g among specific age groups .
Summary
The Leiter-R is a n on-ve rbal test o f intel l igence de s i gned
chi e f l y for use with l anguage- and cognitively-impai red persons
a ged 2 -2 1 . The Leiter-R i s a revi s ion o f the original Leiter .
The revi sed ver s i on was developed to reflect up-to-date norms ,
improved test admi n i stration , and research tying the Leiter-R to
its theoretical base . Re flecting the wor k of Gustafs son ( 1 9 8 4 ) ,
Horn-Catte l l ( 1 9 6 6 ) , and Carroll ( 1 9 93a ) , the Leiter-R i s based
on a three-level hierarchical theory o f inte l l igence , with g at
the hi ghest l evel , f our second-level factors , and a number of
l ower-level factors represented by 20 separate subtests .

I 1 I I I I l J
I I I ! I
I I I I
11
Leiter-R Factor Ana l y s i s 7 2
Exploratory factor analys i s ( E FA ) o f the Leiter-R wa s
undertaken in an e ffort to ( a ) explore the factor s t ructure o f
the Leiter-R, ( b ) ver i fy general vi sua l i zation ( Gv ) and fluid
reas oning ( Gf ) a s second-level factors in the Leiter-R, and ( c )
interpret the results a s they relate to the age di fferentiation
hypothes i s .
The E FA revealed a st rong g influence i n the Leiter-R, with
one- factor model s predominating in each age g roup studi ed .
General- factor l oadings of four core Leiter-R subt e s t s ( those
subte s t s common to all age groups ) indicated subtests vary i n how
wel l they measure g among di ffe rent a ge group s . Overall , these
results are j udged to s upport the Leiter-R as a g test o f
int e l l i gence .
In contrast to the findings of other researchers ( Bos , 1 9 95 ;
Bos , Gridley, & Roi d , 1 9 9 6 ) , little evidence was found to veri fy
Gf and Gv a s s econd-level factors in the Leiter-R . However ,
analyses o f certain age groups offered s ome evidence o f a two-
factor s t ructure . Thi s evidence offered modes t support for the
Leiter-R ' s theoret i cal s tructure , with s eparate Gf and Gv factors
in the 2 - 5 age g roup and a distinct spatial vi sual i zation factor
emerging i n the 6 - 1 0 and 1 1 -2 1 age groups . The De s ign Analogies
subtest eme rged as being a good measure o f g and a s being
factoria l l y amb i guous , as it appears to represent both fluid
reasoning and visua l / spatial abilities .
Mild evidence wa s found to support the age di fferent iation
hypothe s i s , in that fluid reasoning appeared to emerge a s a more

Leiter-R Factor Ana l y s i s 7 3
prominent cogn i t i ve abil i t y among 1 6- to 2 1 -year-olds . Clearer
findings o f age di f fe renti ation may have been hampered by this
study ' s format . Or , this study ' s results may reflect Carroll ' s
( 1 9 9 3 a ) viewpoint that cognitive factors remain stable over t ime .
Limitations o f the present study were noted , i ncluding an
abbreviated study s ample , and exclusion o f memory and
concentration subtes t s in order to maintain s ampl e s i z e . Ideas
for future re s earch were presented, i ncluding further examination
of the Des i gn Analogies subtest and further exploration o f the
four core Leiter-R subtests and their relationship to g in
specific age groups . Future research could include a factor
analys i s o f the Leiter-R using the full normati ve s ample , and
using a hierarchical factor analytic method speci ficall y des i gned
to extract both general ( g ) and speci fic ( s ) intelli gence factors
from the data .

Leiter-R Factor Ana l y s i s 7 4
References
American Psychi atric As sociation ( 1 9 9 4 ) . Diagnost i c and
statistical manual of mental disorders ( 4 th e d ) . Washington ,
D . C . : Author .
Armenteros , E . C . , & Roi d , G . H . ( 1 9 9 6 , August ) . Nonverbal
abi l it i e s of Hi spanic and speech-impai red p re s chool e r s . Paper
pre sented at the meetings of the American P s ychological
As sociation , Toronto .
Bal i n s ky , B . ( 1 9 4 1 ) . An analy s i s o f the mental factors o f
various a g e groups from nine to s ixty . Genetic P s ychology
Monograph s , 2 3 , 1 9 1 - 2 3 4 .
B inet , A . , & S imon , T . ( 1 9 0 5 ) . Methode s nouve l l e s pour le
diagno s t i c du niveau intellectual de s anormaux . L ' Annee
Psychologique , 11, 1 9 1 -2 4 4 .
Black , W . F . ( 1 9 7 3 ) . Use o f the Leiter Internat ional
Performance Scale with apha s i c children . Journal o f Speech
and Hearing Research , 1£ ( 3 ) , 5 3 0 - 5 3 3 .
Blair , R . J . ( 1 9 9 6 ) . Item bias analys i s o f the Leiter-R for
Engl i s h a s a second l anguage popul at i ons . Unpub l i shed
doctoral di s s e rtation , George Fox Unive r s i t y , Newber g , OR .
Bos , J . S . ( 1 9 9 5 ) . Factor structure of the field edition of the
Leiter International Performance Scale-Revi sed . Unpub l i shed
doctoral di s s e rtation , George Fox Unive r s i t y , Newber g , OR .

Leiter-R Factor Anal y s i s 7 5
Bos , J . S . , Gridley, B . E . , & Roid , G . H . ( 1 9 9 6 , August ) .
Con f i rmatory factor analys i s o f non-verbal cognitive measures .
Paper presented at the meetings of the American P s ychological
As s ociation , Toronto .
Brown , 1 . , Sherbenou , R . J . , & Johnson , S . K . ( 1 9 9 0 ) . Test of
nonverbal intel l i gence : A language free mea sure o f cognitive
abil i t y ( 2nd ed . ) . Aus t i n , TX : Pro Ed .
Burgme i s t e r , B . , Blum, 1 . H . , & Lorge , I . ( 1 9 7 2 ) . Columbia
Mental Maturity Scale . New York : Harcourt Brace Jovanovi ch .
Burt , C . ( 1 9 5 4 ) . The di f ferentiation o f int e l lectual abi lities .
British Journal o f Educational Psychology, 1ir 7 6- 9 0 .
Carrol l , J . B . ( 1 9 9 3 a ) . Human cognitive abi l i t i e s : A survey of
factor analytic studie s . Cambridge , England : Cambridge
Unive r s i t y Pres s .
Carrol l , J . B . ( 1 9 9 3b ) . Exploratory factor analy s i s programs
for the I BM-PC ( unpubli shed computer software ) . Chapel Hi l l ,
NC : Unive r s i t y of North Carolina .
Catte l l , R . B . ( 1 9 4 1 ) . Some theoretical i s sues in adult
intel l i gence testing . Psychological Bulleti n , �' 5 92 .
Catte l l , R . B . ( 1 9 7 8 ) . The scientific use o f factor analysis in
the behavioral and l i fe science s . New Yor k : Plenum Pre s s .
Catte l l , R . B . ( 1 9 8 7 ) . I ntelligence : I t s structure , growth , and
action . Amsterdam : North-Holland .
Cronbach , 1 . J . ( 1 9 8 4 ) . Essentials of p s ychological testing
( 4 th ed . ) . New York : Harper & Row .

Leiter-R Factor Analy s i s 7 6
Educat i on for All Handi capped Chi ldren Act of 1 9 7 5 , 2 0 U . S . C . § §
1 4 0 0 - 1 4 6 1 ( 1 9 8 2 ) ( codifying Pub . L . No . 9 4 - 1 4 2 , 8 9 Stat . 7 7 3
[ 1 9 7 5 ] and subsequent amendments ) .
Flemmer , D . , & Roi d , G . H . ( 1 9 9 6 , August ) . Nonve rbal cognitive
abi l it i e s i n ado l e scent Hi spanic and speech - impaired s amples .
Paper pres ented at the meetings o f the Ame rican Psychological
As sociation , Toronto .
French , J . W . ( 1 9 5 1 ) . The descript i on of apt itude and
achievement tests in terms of rotated factors .
Monographs , No . 5 .
Psychometric
Garrett , H . E . ( 1 9 4 6 ) . A development theory o f inte l l igence .
Ame rican P s ycholog i s t , 1, 3 7 2 -3 7 8 .
Gorsuch , R . L . ( 1 9 8 3 ) . Factor analys i s ( 2 nd ed . ) . New Jersey :
Erlbaum .
Gorsuch , R . L . ( 1 9 8 8 ) . UniMult ( computer so ftware ) . Pasadena ,
CA : Ful l e r Theological Seminary .
Grant , G . , Roi d , G . H . , & Fallow , G . ( 1 9 9 6 , Apr i l ) . Fai rne s s of
intellectual a s s e s sment for children with speech impai rment s .
Paper presented at the meetings o f the Western P s ychological
As sociation , San Jose , CA .
Gui l ford , J . P . ( 1 9 6 7 ) . The nature of human intel l i gence . New
York : McGraw-H i l l .
Gustafsson , J . E . ( 1 9 8 4 ) . A uni fying model for the s t ructure of
Intel l i gence , �' 1 7 9 - 2 0 3 . intellectual abi l i t i e s .
Guttman , L . ( 1 9 5 4 ) . Some nece ss ary condit ions for common- f actor
anal ys i s . Ps ychometr i ka , 12, 1 4 9 - 1 6 1 .

Leiter-R Factor Anal ysis 7 7
Head , J . ( 1 9 9 6 ) . As s e s sment o f nonverbal cognitive proce s s e s in
children with attention de fi cit hyperactivity dis orde r .
Unpubli shed doctoral di s s e rtation , George Fox Unive r s i t y ,
Newberg , OR .
Hi s ke y , M . S . ( 1 9 6 6 ) . H i s key-Nebras ka Test o f Learning
Aptitude . Lincoln , NE : Union College Pres s .
Horn , J . L . , & Cattell , R . B . ( 1 9 6 6 ) . Refinement and test o f
the theory o f f l u i d and crystall i zed intel l i gence . Journal of
Educational P s ychology , 5 7 , 2 5 3-2 7 0 .
Individual s with Disabi lities Education Act o f 1 9 9 0 , 2 0 U . S . C . § §
1 4 0 0 et s eq . : U . S . Statutes at Large , 1 0 4 , 1 1 0 3 - 1 1 5 1 .
Jensen , A . R . ( 1 9 8 0 ) . Bias in mental testing . New York : Free
Pres s .
Jores kog , K . G . , & Sorbom, D . ( 1 9 9 3 ) . L I S REL 8 users reference
guide . Chicago : S cientific Software .
Kamphaus , R . W . ( 1 9 9 3 ) . Clinical as ses sment o f children ' s
inte l l i gence . Boston : Al l yn & Bacon .
Kaufman , A . S . ( 1 9 7 5 ) . Factor analysis of the WI SC-R at 1 1 age
leve l s between 6 - 1 /2 and 1 6- 1 /2 years . Journal of Consulting
and Clinical P s ychology, jl, 1 3 5 - 1 4 7 .
Kausle r , D . H . ( 1 9 8 2 ) . Experimental psychology , cognition , and
human aging . New York : Springer-Verlag .
Kline , P . ( 1 9 9 1 ) . I nt e l l i gence : The psychometric view . London :
Routledge .

Leiter-R Factor Ana l y s i s 7 8
Leit e r , R . G . ( 1 9 3 8 ) . A comparative study o f the gene ral
intel l i gence o f Cauca s i a n , Chinese , and Japane s e chil dren a s
mea s ured by the L e i t e r International Performance Scale .
Unpubli shed doctoral di s sertation, University o f Southern
Cal i forni a , Los Ange l e s .
Leite r , R . G . ( 1 9 5 9 ) . Part 1 o f the manual for the 1 9 4 8
revi s ion of the Leiter International Performance Scale .
Psychological Service Center Bul letin , 11, 1 - 7 2 .
Mads en , D . H . ( 1 9 9 6 ) . Nonverbal cognitive growth s cale s .
Unpub l i shed research grant proposal . Wood Dale , I L : Stoelting
Co .
Madse n , D . H . , & Fal low , G . ( 1 9 9 6 , April ) . Nonverbal cognitive
scales for the a s s e s sment o f t raumatic brain inj ury case s .
Paper presented at the meetings of the Western Psychological
As sociation , S an Jos e , CA .
Madse n , D . H . , Roi d , G . H . , & Mi l l e r , L . J . ( 1 9 9 6 , August ) .
Nonverbal intellectual a s s e s sment : Restandardi z at ion o f the
Leiter-R . Paper pre sented at the meetings o f the American
Psychological As sociation , Toronto .
Marsh , H . W . , B a l l a , J . R . , & McDonald, R . P . ( 1 9 8 8 ) .
Goodne s s - o f - fit indexes in con f i rmatory factor analys i s : The
e f fect of s ampl e s i ze . Psychologi cal Bull e t i n , 1 0 3 , 3 9 1 - 4 1 0 .
McLe l l a n , M . J . , & Walton , M . J . ( 1 9 9 6 , August ) . Concurrent
val i dation of the Leiter-R with W I S C- I I I with Navaj o children .
Paper pre sented at the meetings o f the Ame ri can Psychological
Association , Toronto .

Mel l ott , M . J . , & McLel lan , M . J .
Leiter-R Factor Anal y s i s 7 9
( 1 9 9 6 , Apr i l ) . U s ing
nonverbal cognitive scales with Navaj o chi l dren . Paper
presented at the meetings o f the Western P s ychological
Association , San Jos e , CA .
Norusi s , M . J . ( 1 9 8 8 ) . S P S S / PC+ advanced stati stics V2 . 0 .
Chicago : S P S S I nc .
Ratcli f fe , K . J . , & Ratcli ffe , M . W . ( 1 9 7 9 ) . The Leiter scale s :
A review of val idity findings . Ameri can Annals o f the Dea f ,
1 2 4 ( 1 ) , 3 8 - 4 4 .
Raven , J . C . ( 1 9 6 5 ) . Raven ' s progres s ive matrice s . New Yor k :
The Psychological Corporation .
Reckase , M . D . ( 1 9 7 9 ) . Uni factor latent trait model s applied to
multi factor t e s t s . Journal o f Educational S tatistics , i r
2 0 7 - 2 3 0 .
Reeve , R . R . , French , J . L . , & Hunter , M . ( 1 9 8 3 ) . A validation
o f the Leiter I nternational Performance Scale with
kindergarten chil dren . Journal of Consulting and Cl inical
Psychology, � ( 3 ) , 4 5 8 - 4 5 9 .
Roid, G . H . ( 1 9 9 6 , April ) . Research on nonverbal cognition :
As s e s sment in ethnic and di sability case s . Paper pre sented at
the meetings of the Western Psychological As sociation , San
Jos e , CA .
Roid , G . H . , & Mi l l e r , L . J . ( 1 9 9 6 , April ) . Development o f
nonverbal cognitive scales sensitive t o incremental
improvement . Paper presented at the meetings o f the We stern
Psychological As s ociation, San Jos e , CA .

Satt l e r , J . M .
Leiter-R Factor Anal y s i s 8 0
( 1 9 92 ) . As s e s sment of children ( 3 rd ed . ) . San
Diego : Jerome M . Sattler .
Schmid , J . , & Leiman , J . M . ( 1 95 7 ) . The developmental o f
hierarchical factor solutions . Psychometr i ka , �' 5 3 - 6 1 .
Snow , R . E . ( 1 9 8 2 ) . Inte l l i gence and educat ion . I n R . J .
Sternberg ( Ed . ) , Handbook o f human intel l i gence ( pp . 4 93 - 5 8 5 ) .
Cambridge , England : Cambridge University Pre s s .
Spearman , C . E . ( 1 92 7 ) . The abi lities of man . New Yor k :
Macmi l l an .
Thurstone , L . L . ( 1 9 3 8 ) . Primary mental abi l it ie s .
Psychometric Monographs , No . 1 .
Vernon , P . E .
Yor k : Wiley .
( 1 9 5 0 ) . The structure o f human abi l i t i e s . New
Wechsl e r , D . ( 1 9 8 1 ) . Manual for the Wech s l e r Adult I nt e l l igence
Scale-Revised ( WAI S - R ) . New York : The Psychological
Corporation .
Wechs ler , D . ( 1 9 8 9 ) . Wechsler Preschool and Primary Scale o f
Int e l l i gence-Revi sed . New York : The Psychological
Corporation .
Wechs l e r , D . ( 1 9 9 1 ) . Wechsler I nt e l l igence Scale for Children
Third Edi t i on : Manual . New Yor k : The Psychological
Corporation .

Leiter-R Factor Ana l ys i s 8 1
Appendix A
S ampl e S P S S S yntax Commands for E FA

USE ALL .
Leiter-R Facto r Ana l ys i s 8 2
COMPUTE f i lter $ = ( ageyear >= 2 & age year <=5 ) . VARIABLE LABEL-fi lter $ ' ageyear >= 2 & ageyear <=5 ( FI LTER ) ' . VALUE LABELS f i lter $ 0 ' Not Selected ' 1 ' Selected ' . FORMAT filter $ ( f l�O ) . FILTER BY filter $ . EXECUTE . FACTOR
/VARIABLES fgz fez s o z rpz cz mz pcz /MI S S ING L I STW I S E /ANALYS I S f g z fez soz rpz cz mz pcz / PRINT UNIVARIATE INIT IAL KMO EXTRACTION ROTAT ION / PLOT E I GEN /CRITERIA MINEI GEN ( l ) ITERATE ( 2 5 ) /EXTRACTION ML /CRITERIA ITERATE ( 2 5 ) DELTA ( O ) / ROTATI ON OBLIMIN .

Leiter-R Factor Ana l ys i s 8 3
Appendix B
Raw Data from All EFAs
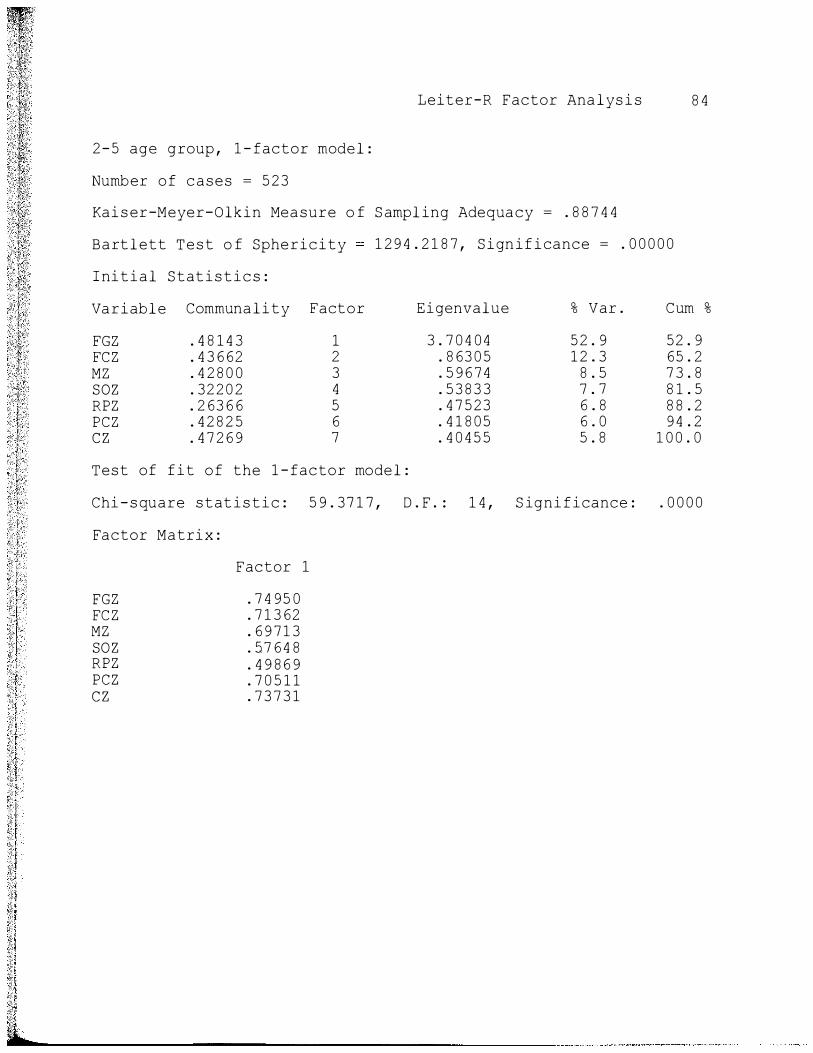
I I
I I I I I
. I ! "' I ..
' I i I d ' I
' I
I : I ' I
I : I � I
: ,� �· ,{ •. <.· ·.· l
2 - 5 age group , 1 - factor model :
Number of cases = 5 2 3
Leiter-R Factor Ana l ys i s 8 4
Kai s er-Meyer-Olkin Mea sure o f S ampl ing Adequacy = . 8 8 7 4 4
Bart l ett T e s t o f Sphericity 1 2 9 4 . 2 1 8 7 , S i gn i f i cance = . 0 0 0 0 0
I ni t i a l Stat i s t i c s :
Variable Communa l i t y Factor Eigenvalue % Var . Cum %
FGZ . 4 8 1 4 3 1 3 . 7 0 4 0 4 5 2 . 9 52 . 9 FCZ . 4 3 6 62 2 . 8 63 0 5 1 2 . 3 65 . 2 MZ . 4 2 8 0 0 3 . 5 9 6 7 4 8 . 5 7 3 . 8 soz . 3 2 2 0 2 4 . 5 3 8 3 3 7 . 7 8 1 . 5 RPZ . 2 63 6 6 5 . 4 7 5 2 3 6 . 8 8 8 . 2 PCZ . 4 2 8 2 5 6 . 4 1 8 0 5 6 . 0 9 4 . 2 c z . 4 7 2 6 9 7 . 4 0 4 5 5 5 . 8 1 0 0 . 0
Test of fit of the 1 - factor model :
Chi - s quare stat i s t i c : 5 9 . 3 7 1 7 , D . F . : 1 4 , S igni ficance : . 0 0 0 0
Factor Matrix :
Factor 1
FGZ . 7 4 95 0 FCZ . 7 1 3 62 MZ . 6 9 7 1 3 so z . 57 6 4 8 RPZ . 4 9 8 6 9 PCZ . 7 0 5 1 1 c z . 7 3 7 3 1

2 - 5 age group , 2 - factor model :
Number o f cases = 5 2 3
Leiter-R Factor Ana l ys i s 8 5
Kai s e r -Meyer-Olkin Mea sure o f Sampling Adequacy = . 8 8 7 4 4
Bartlett Test o f Sphericity 1 2 9 4 . 2 1 8 7 , S i gni fi cance = . 0 0 0 0 0
Initial Stat i s t i c s :
Variable Communa l i t y Factor Eigenvalue % Var . Cum %
FGZ . 4 8 1 4 3 1 3 . 7 0 4 0 4 5 2 . 9 5 2 . 9 FCZ . 4 3 6 6 2 2 . 8 63 0 5 1 2 . 3 6 5 . 2 MZ . 4 2 8 0 0 3 . 5 9 6 7 4 8 . 5 7 3 . 8 soz . 3 2 2 0 2 4 . 5 3 8 3 3 7 . 7 8 1 . 5 RPZ . 2 6 3 6 6 5 . 4 7 5 2 3 6 . 8 8 8 . 2 PCZ . 4 2 8 2 5 6 . 4 1 8 0 5 6 . 0 9 4 . 2 c z . 4 7 2 6 9 7 . 4 0 4 5 5 5 . 8 1 0 0 . 0
Test o f fit o f the 2 - factor model :
Chi - s quare s tati sti c : 1 6 . 4 0 1 7 , D . F . : 8 , S igni fi cance : . 0 3 7 0
Pattern Matrix :
Factor 1 Factor 2
FGZ . 4 7 0 2 0 . 3 4 6 7 1 FCZ . 5 3 8 2 5 . 2 1 7 8 3 MZ . 7 9 5 8 3 - . 0 8 8 9 3 soz . 1 4 3 6 8 . 5 4 2 5 5 RPZ - . 0 4 1 62 . 6 7 5 8 5 PCZ . 6 8 0 9 6 . 0 4 5 0 3 c z . 7 7 4 4 2 - . 0 1 6 92
Factor Correlation Matrix :
Factor 1 Factor 2
Factor 1 1 . 0 0 0 0 0 Factor 2 . 6 9 3 1 6 1 . 0 0 0 0 0

I I I
I ,, ! I
6 - 1 0 age group , 1 - factor model :
Number of cases = 4 3 8
Leiter-R Factor Ana l y s i s 8 6
Kai s er -Meyer-Olkin Mea s u re o f S ampling Adequacy = . 8 8 2 1 4
Bartlett Test o f Sphericity 4 9 1 . 0 3 6 0 0 , S i gn i f i cance = . 0 0 0 0 0
Initial S t at i st i c s :
Variable Communa l i t y Factor Eigenvalue % Var . Cum %
FGZ . 2 8 8 6 1 1 2 . 6 8 3 0 4 4 4 . 7 4 4 . 7 DAZ . 2 9 7 6 4 2 . 8 5 5 4 1 1 4 . 3 5 9 . 0 FCZ . 2 6 1 9 7 3 . 7 1 0 52 1 1 . 8 7 0 . 8 so z . 2 9 3 7 3 4 . 6 2 32 3 1 0 . 4 8 1 . 2 RPZ . 2 0 9 9 8 5 . 5 8 5 0 5 9 . 8 9 1 . 0 PFZ . 1 9 3 0 9 6 . 5 4 2 7 6 9 . 0 1 0 0 . 0
Test of fit o f the 1 - factor model :
Chi- s quare stat i s t i c : 1 9 . 9 3 8 3 , D . F . : 9 , S i g n i f i cance : . 0 1 8 3
Factor Matrix :
FGZ DAZ FCZ so z RPZ PFZ
Factor 1
. 6 3 3 5 9
. 6 2 9 8 5
. 5 8 3 3 8
. 6 2 3 9 1
. 5 2 6 5 0
. 4 7 6 9 1

Leiter-R Factor Ana l ys i s 8 7
6 - 1 0 age g roup , 2 - factor model :
Number o f cases = 4 3 8
Kai s er-Meyer-Olkin Mea sure o f S ampling Adequacy = . 8 8 2 1 4
Bartlett Test o f Sphericity 4 9 1 . 0 3 6 0 0 , S i gn i ficance = . 0 0 0 0 0
Initial Stati stics :
Variable Communa l i t y Factor Eigenvalue % Var . Cum %
FGZ . 2 8 8 6 1 1 2 . 6 8 3 0 4 4 4 . 7 4 4 . 7 DAZ . 2 9 7 6 4 2 . 8 5 5 4 1 1 4 . 3 5 9 . 0 FCZ . 2 6 1 9 7 3 . 7 1 0 5 2 1 1 . 8 7 0 . 8 so z . 2 9 3 7 3 4 . 62 32 3 1 0 . 4 8 1 . 2 RPZ . 2 0 9 9 8 5 . 5 8 5 0 5 9 . 8 9 1 . 0 PFZ . 1 9 3 0 9 6 . 5 4 2 7 6 9 . 0 1 0 0 . 0
Test of fit of the 2 - factor model :
Chi - s quare stat i stic : 2 . 7 7 9 1 , D . F . : 4 , S i gn i f i cance : . 5 95 4
Pattern Matrix :
FGZ DAZ FCZ so z RPZ PFZ
Factor 1
. 4 8 4 6 1
. 2 7 64 8
. 6 5 8 32
. 6 9 6 1 0
. 3 0 05 7 - . 0 4 3 3 7
Factor Correl at i on Matrix :
Factor 1 Factor 2
Factor 1
1 . 0 0 0 0 0 . 6 4 7 7 7
Factor 2
. 1 8 8 4 3
. 4 3 9 1 7 - . 0 4 4 2 9 - . 0 3 3 8 1
. 2 8 0 5 0
. 6 5 1 2 1
Factor 2
1 . 0 0 0 0 0

I I
I !
I I
1 1 -2 1 age group , 1 - factor model :
Number o f cases = 4 1 0
Leiter-R Factor Ana l ys i s 8 8
Kai s er-Meyer-Ol ki n Measure of Sampling Adequacy = . 8 6 9 3 1
Bartlett T e s t o f Sphericity 7 8 2 . 2 8 0 4 8 , S igni f i cance = . 0 0 0 0 0
Initial Statistics :
Variable Communa l i t y Factor E igenvalue % Var . Cum %
FGZ . 2 6 8 2 3 1 3 . 3 7 1 6 9 4 8 . 2 4 8 . 2 DAZ . 3 8 3 9 1 2 . 8 1 3 0 2 1 1 . 6 5 9 . 8 FCZ . 3 2 1 5 5 3 . 6 8 9 9 7 9 . 9 6 9 . 6 soz . 3 3 4 7 6 4 . 6 4 7 5 3 9 . 3 7 8 . 9 RPZ . 3 1 2 3 3 5 . 5 2 65 7 7 . 5 8 6 . 4 PFZ . 4 1 0 95 6 . 4 9 9 8 9 7 . 1 9 3 . 6 FRZ . 3 4 0 7 0 7 . 4 5 1 3 1 6 . 4 1 0 0 . 0
Test o f fit o f the 1 - factor model :
Chi - s quare stati stic : 4 1 . 9 4 2 1 , D . F . : 1 4 , S igni fi cance : . 0 0 0 1
Factor Matrix :
FGZ DAZ FCZ soz RPZ PFZ FRZ
Factor 1
. 5 62 7 2
. 6 9 0 1 7
. 6 1 5 7 3
. 6 1 5 4 0
. 5 9 4 6 6
. 6 9 7 6 4
. 6 1 8 7 0

Leiter-R Factor Ana l y s i s 8 9
1 1 -2 1 age group , 2 - factor mode l :
Number of cases = 4 1 0
Kai s e r -Meyer-Ol kin Mea sure o f S ampl ing Adequacy = . 8 6 9 3 1
Bartlett Test o f Spheri city 7 8 2 . 2 8 0 4 8 , S i gn i f i cance = . 0 0 0 0 0
Initial Stat i s t i cs :
Variable Communa l i t y Factor Eigenvalue % Var . Cum %
FGZ . 2 6 8 2 3 1 3 . 3 7 1 6 9 4 8 . 2 4 8 . 2 DAZ . 3 8 3 9 1 2 . 8 1 3 0 2 1 1 . 6 5 9 . 8 FCZ . 3 2 1 5 5 3 . 6 8 9 9 7 9 . 9 6 9 . 6 soz . 3 3 4 7 6 4 . 6 4 7 5 3 9 . 3 7 8 . 9 RPZ . 3 1 2 3 3 5 . 5 2 65 7 7 . 5 8 6 . 4 PFZ . 4 1 0 95 6 . 4 9 9 8 9 7 . 1 9 3 . 6 FRZ . 3 4 0 7 0 7 . 4 5 1 3 1 6 . 4 1 0 0 . 0
Test o f fit o f the 2 - factor model :
Chi - s quare stati stic : 1 1 . 2 0 9 8 , D . F . : 8 , S igni ficance : . 1 9 0 1
Pattern Matrix :
Factor 1
FGZ . 3 4 9 3 2 DAZ . 3 2 9 0 3 FCZ . 5 0 7 3 6 soz . 7 3 6 4 6 RPZ . 6 6 1 7 6 PFZ . 1 0 7 3 5 FRZ - . 0 5 92 4
Factor Correlation Matrix :
Factor 1 Factor 2
Factor 1
1 . 0 0 0 0 0 - . 7 0 7 8 2
Factor 2
- . 2 4 8 5 7 - . 4 0 5 0 1 - . 1 5 0 3 5
. 0 6 1 3 2
. 0 1 9 0 9 - . 6 5 9 0 6 - . 7 5 0 8 3
Factor 2
1 . 0 0 0 0 0
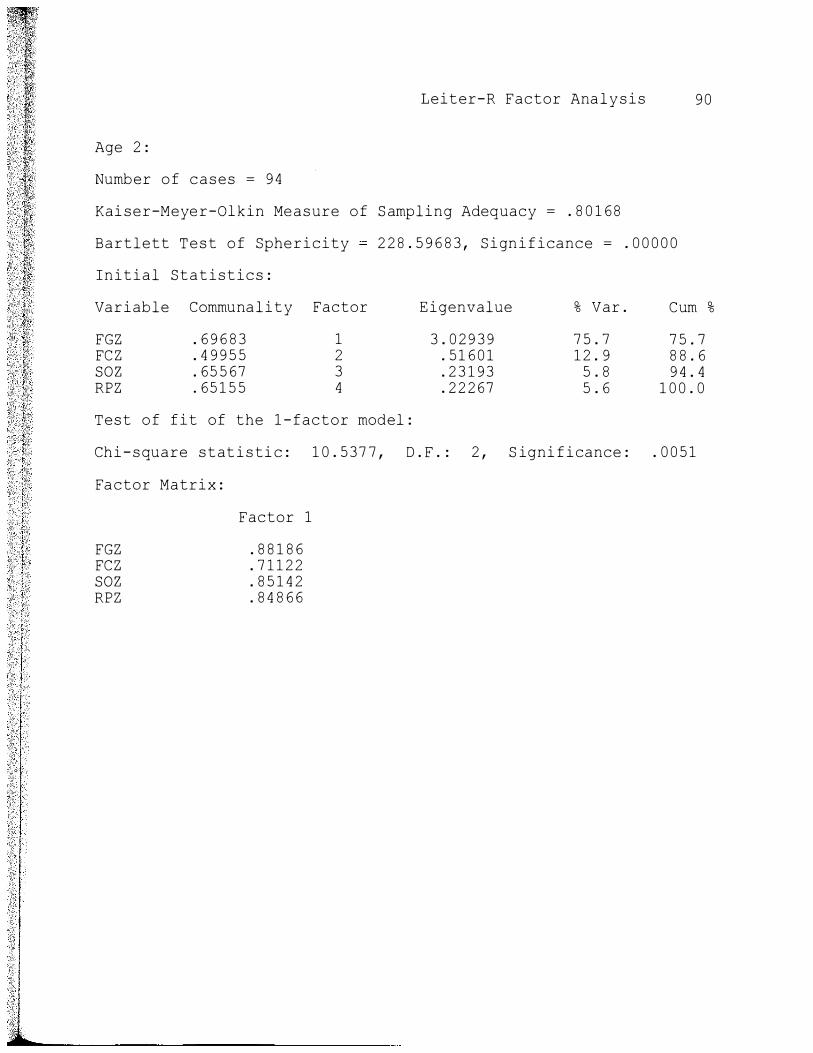
Age 2 :
Number o f cases = 9 4
Leiter-R Factor Anal y s i s 9 0
Kai ser-Meye r-Ol kin Measure o f S ampling Adequacy = . 8 0 1 6 8
Bartlett T e s t o f Sphericity 2 2 8 . 5 9 6 8 3 , S i gni ficance = . 0 0 0 0 0
Initial Statistics :
Variable Communality Factor Eigenvalue % Var . Cum %
FGZ . 6 9 6 8 3 1 3 . 0 2 9 3 9 7 5 . 7 7 5 . 7 FCZ . 4 9 9 5 5 2 . 5 1 6 0 1 1 2 . 9 8 8 . 6 so z . 6 5 5 67 3 . 2 3 1 9 3 5 . 8 9 4 . 4 RPZ . 6 5 1 5 5 4 . 2 2 2 67 5 . 6 1 0 0 . 0
Test o f fit of the 1 - factor model :
Chi - s quare stat i s ti c : 1 0 . 5 3 7 7 , D . F . : 2 , S igni f i cance : . 0 0 5 1
Factor Matrix :
FGZ FCZ soz RPZ
Factor 1
. 8 8 1 8 6
. 7 1 1 2 2
. 8 5 1 4 2
. 8 4 8 6 6

Age 3 :
Number of ca s e s = 1 4 1
Leiter-R Factor Analy s i s 9 1
Kai s e r -Meyer-Olkin Measure o f Sampling Adequacy = . 6 9 4 9 4
Bartlett Test o f Sphericity 1 0 3 . 7 3 3 3 6 , S i gn i f i cance = . 0 0 0 0 0
Initial Statistics :
Variable Communality Factor E igenvalue % Var . Cum %
FGZ . 3 6 4 92 1 2 . 1 4 0 4 5 5 3 . 5 5 3 . 5 FCZ . 3 1 6 6 6 2 . 7 2 8 3 8 1 8 . 2 7 1 . 7 soz . 1 9 5 9 1 3 . 6 9 8 60 1 7 . 5 8 9 . 2 RPZ . 2 3 1 7 4 4 . 4 3 2 5 7 1 0 . 8 1 0 0 . 0
Test o f fit o f the 1 - factor model :
Chi - s quare stat i stic : 5 . 4 65 2 , D . F . : 2 , S igni f i cance : . 0 6 5 1
Factor Matrix :
FGZ FCZ soz RPZ
Factor 1
. 7 63 6 1
. 6 6 4 5 1
. 4 9 0 7 6
. 5 4 0 5 9

Age 4 :
Number o f cases = 1 4 7
Leiter-R Factor Analys i s 9 2
Kai s e r -Meyer-Ol kin Measure of Sampling Adequacy = . 7 3 5 6 1
Bartlett T e s t o f Sphericity 1 1 1 . 9 9 2 0 6 , S igni f icance = . 0 0 0 0 0
Initial Stat i s t i c s :
Variable Communa l i t y Factor Eigenvalue % Var . Cum %
FGZ . 3 0 2 2 6 1 2 . 1 7 1 0 8 5 4 . 3 5 4 . 3 FCZ . 3 5 8 3 3 2 . 7 9 7 4 6 1 9 . 9 7 4 . 2 soz . 3 1 1 6 6 3 . 5 4 4 7 7 1 3 . 6 8 7 . 8 RPZ . 1 3 8 3 1 4 . 4 8 6 9 9 1 2 . 2 1 0 0 . 0
Test of fit o f the 1 - factor model :
Chi - s quare stat i s t i c : . 9 6 6 1 , D . F . : 2 , S igni fi cance : . 6 1 6 9
Factor Mat rix :
FGZ FCZ soz RPZ
Factor 1
. 6 5 4 5 9
. 7 4 60 8
. 6 7 0 3 8
. 4 2 4 6 9

Age 5 :
Number o f cases = 1 4 1
Leiter-R Factor Ana l ys i s 9 3
Kai s er-Meyer-Ol kin Measure o f Sampl ing Adequacy = . 62 4 92
Bartlett Test o f Sphericity 1 3 2 . 3 7 4 6 9 , S i gn i fi cance = . 0 0 0 0 0
Initial Statistics :
Variable Communa l i t y Factor E igenvalue % Var . Cum %
FGZ . 4 5 0 1 9 1 2 . 2 0 9 9 8 5 5 . 2 5 5 . 2 FCZ . 4 0 3 9 3 2 . 8 3 4 4 8 2 0 . 9 7 6 . 1 so z . 2 7 1 9 3 3 . 62 1 7 3 1 5 . 5 9 1 . 7 RPZ . 2 7 7 9 8 4 . 3 3 3 8 1 8 . 3 1 0 0 . 0
Test o f fit o f the 1 - factor model :
Chi - s quare stat i stic : 1 8 . 7 3 7 3 , D . F . : 2 , S i gn i f i cance : . 0 0 0 1
Factor Matrix :
FGZ FCZ soz RPZ
Factor 1
. 8 2 8 3 9
. 6 9 4 4 5
. 5 0 7 2 1
. 4 8 9 0 0

Age 6 :
Number o f cases = 1 12
Leiter-R Factor Anal ys i s 9 4
Kai ser-Meye r-Olkin Measure o f Sampling Adequacy = . 6 9 9 5 5
Bartlett Test o f Sphericity 5 6 . 7 6 0 97 , S i gni fi cance = . 0 0 0 0 0
Initial S tati stics :
Variable Communa l i t y Factor Eigenvalue % Var . Cum %
FGZ . 1 8 2 2 7 1 1 . 9 5 9 0 6 4 9 . 0 4 9 . 0 FCZ . 2 6 0 92 2 . 8 1 3 3 9 2 0 . 3 6 9 . 3 soz . 2 3 9 7 4 3 . 6 7 8 5 8 1 7 . 0 8 6 . 3 RPZ . 1 2 5 7 6 4 . 5 4 8 97 1 3 . 7 1 0 0 . 0
Test o f fit o f the 1 - factor model :
Chi- s quare stat i st i c : 1 . 3 4 4 7 , D . F . : 2 , S i gn i f i cance : . 5 1 0 5
Factor Matrix :
FGZ FCZ so z RPZ
Factor 1
. 5 3 1 1 5
. 6 7 7 2 7
. 6 2 6 2 3
. 4 2 5 2 5

Age 7 :
Number of cases = 8 0
Leiter-R Factor Analy s i s 9 5
Kai s er-Meyer-Ol kin Measure of Sampling Adequacy = . 7 4 0 7 0
Bartlett Test o f Sphericity 5 4 . 62 97 5 , S i gni f i cance = . 0 0 0 0 0
Initial Stat i s t i c s :
Variable Communa l i t y Factor Eigenvalue % Var . Cum %
FGZ . 2 5 7 0 0 1 2 . 1 5 5 8 3 5 3 . 9 5 3 . 9 FCZ . 2 4 9 5 8 2 . 7 0 5 3 7 1 7 . 6 7 1 . 5 soz . 2 5 0 9 0 3 . 6 0 4 5 3 1 5 . 1 8 6 . 6 RPZ . 2 8 2 6 6 4 . 5 3 4 2 7 1 3 . 4 1 0 0 . 0
Test o f fit o f the 1 - factor model :
Chi - s quare s t a t i s t i c : 1 . 3 3 0 6 , D . F . : 2 , S i gn i f i cance : . 5 1 4 1
Factor Matrix :
FGZ FCZ soz RPZ
Factor 1
. 6 1 5 9 6
. 6 0 3 1 3
. 6 0 6 5 6
. 6 5 7 2 7

Age 8 :
Number o f cases = 8 6
Leiter-R Factor Ana l ys i s 9 6
Kai s er-Meyer-Olkin Measure of S ampl ing Adequacy = . 7 2 8 9 0
Bartlett Test o f Sphericity 4 7 . 1 9 7 9 6 , S i gni ficance = . 0 0 0 0 0
Initial Stati stics :
Variable Communality Factor Eigenvalue % Var . Cum %
FGZ . 2 3 0 5 6 1 2 . 0 2 5 5 3 5 0 . 6 5 0 . 6 FCZ . 2 2 7 7 8 2 . 7 6 6 9 4 1 9 . 2 6 9 . 8 soz . 2 6 2 7 7 3 . 6 2 4 1 0 1 5 . 6 8 5 . 4 RPZ . 1 4 0 0 5 4 . 5 8 3 4 2 1 4 . 6 1 0 0 . 0
Test o f fit o f the 1 - factor model :
Chi - s quare stati s t i c : . 1 1 1 0 , D . F . : 2 , Significance : . 9 4 6 0
Factor Matrix :
FGZ FCZ soz RPZ
Factor 1
. 6 0 8 4 4
. 6 0 3 1 3
. 6 6 8 0 7
. 4 5 8 2 0

Leiter-R Factor Ana l y s i s 9 7
Age 9 :
Number o f cases = 8 0
Kai s er-Meyer-Olkin Measure of S ampling Adequacy = . 6 6 7 3 8
Bartlett T e s t o f Sphericity 5 5 . 2 3 9 0 5 , S igni f i cance = . 0 0 0 0 0
Initial Stat i s t i c s :
Variable Communality Factor Eigenvalue % Var . Cum %
FGZ . 2 92 3 7 1 2 . 0 6 1 4 6 5 1 . 5 5 1 . 5 FCZ . 2 7 7 3 2 2 . 8 5 2 7 7 2 1 . 3 7 2 . 9 soz . 4 0 4 0 1 3 . 6 7 5 3 6 1 6 . 9 8 9 . 7 RPZ . 0 9 1 0 7 4 . 4 1 0 4 2 1 0 . 3 1 0 0 . 0
Test o f fit o f the 1 - factor model :
Chi - s quare stat i s t i c : 1 . 7 7 5 6 , D . F . : 2 , Signi fi cance : . 4 1 1 6
Factor Matrix :
FGZ FCZ so z RPZ
Factor 1
. 6 0 62 3
. 5 9 5 7 8
. 8 4 7 0 5
. 3 0 5 9 8

Age 1 0 :
Number o f cas e s = 8 0
Leiter-R Factor Ana l y s i s 9 8
Kai s er-Meyer-Olkin Measure o f Sampling Adequacy = . 7 3 7 92
Bartlett T e s t o f Spher i ci t y 6 7 . 32 7 3 9 , S i gn i f icance = . 0 0 0 0 0
Initial Stat i stics :
Variable Communa l i t y Factor E igenvalue % Var . Cum %
FGZ . 3 2 8 5 3 1 2 . 2 7 1 2 9 5 6 . 8 5 6 . 8 FCZ . 3 0 3 4 3 2 . 6 9 6 0 7 1 7 . 4 7 4 . 2 so z . 3 1 5 4 6 3 . 5 7 3 3 0 1 4 . 3 8 8 . 5 RPZ . 2 92 0 7 4 . 4 5 93 3 1 1 . 5 1 0 0 . 0
Test o f fit o f the 1 - factor model :
Chi - s quare stat i s t i c : 3 . 0 6 8 3 , D . F . : 2 , S i gn i f i cance : . 2 1 5 6
Factor Mat rix :
FGZ FCZ soz RPZ
Factor 1
. 6 7 9 1 1
. 6 3 9 6 8
. 6 6 0 6 8
. 62 4 7 8

Age 1 1 :
Number of cases = 8 7
Leiter-R Factor Ana l ys i s 9 9
Kai s er-Meyer-Ol kin Measure o f S ampling Adequacy = . 7 1 4 0 4
Bartlett T e s t o f Sphericity = 6 0 . 5 9 03 9 , S igni f icance = . 0 0 0 0 0
Initial Statistics :
Variable Communal ity Factor Eigenvalue % Var . Cum %
FGZ . 3 4 3 7 4 1 2 . 1 2 7 0 5 5 3 . 2 5 3 . 2 FCZ . 3 2 0 8 8 2 . 7 6 4 7 2 1 9 . 1 7 2 . 3 soz . 2 2 7 1 1 3 . 6 4 6 95 1 6 . 2 8 8 . 5 RPZ . 1 67 5 5 4 . 4 6 1 2 8 1 1 . 5 1 0 0 . 0
Test of fit o f the 1 - factor model :
Chi - s quare stat i stic : 1 . 6 62 0 , D . F . : 2 , S igni fi cance : . 4 3 5 6
Factor Matrix :
FGZ FCZ soz RPZ
Factor 1
. 7 3 8 1 5
. 6 8 7 4 8
. 5 5 8 2 0
. 4 6 4 3 6

Ages 1 2 - 1 3 :
Number o f cases = 9 5
Leiter-R Factor Ana l ys i s 1 0 0
Kai s e r -Meyer-Ol kin Measure o f Sampling Adequacy = . 7 3 7 1 8
Bartlett Test o f Sphericity 6 6 . 3 3 9 9 6 , S i gn i f i cance = . 0 0 0 0 0
Initial S t at i stics :
Variable Communa l i t y Factor Eigenvalue % Var . Cum %
FGZ . 2 3 7 5 9 1 2 . 1 5 9 5 3 5 4 . 0 5 4 . 0 FCZ . 2 5 7 8 5 2 . 7 2 7 5 9 1 8 . 2 7 2 . 2 soz . 2 8 7 4 2 3 . 5 8 0 5 2 1 4 . 5 8 6 . 7 RPZ . 2 7 3 2 9 4 . 5 3 2 3 5 1 3 . 3 1 0 0 . 0
Test o f fit o f the 1 - factor model :
Chi- s quare stat i s ti c : 2 . 0 6 0 4 , D . F . : 2 , S i gn i fi cance : . 3 5 6 9
Factor Matrix :
FGZ FCZ so z RPZ
Factor 1
. 5 7 95 4
. 6 1 1 9 9
. 6 6 0 2 6
. 6 3 5 2 4

Ages 1 4 - 1 5 :
Number o f cases = 7 5
Leiter-R Factor Analy s i s 1 0 1
Kai s e r -Meyer-Ol kin Measure o f Sampl ing Adequacy = . 7 0 4 62
Bartlett Test o f Sphericity 6 1 . 1 9 0 5 3 , S i gni ficance = . 0 0 0 0 0
I nitial Statistics :
Variable Communality Factor Eigenvalue % Var . Cum %
FGZ . 1 1 8 4 0 1 2 . 1 62 4 7 5 4 . 1 5 4 . 1 FCZ . 4 4 0 8 5 2 . 8 1 7 9 4 2 0 . 4 7 4 . 5 so z . 4 2 1 2 0 3 . 6 4 65 1 1 6 . 2 9 0 . 7 RPZ . 2 0 7 4 3 4 . 3 7 3 0 8 9 . 3 1 0 0 . 0
Test o f fit o f the 1 - factor model :
Chi - s quare statistic : . 0 0 2 6 , D . F . : 2 , S i gni ficance : . 9 9 8 7
Factor Matrix :
FGZ FCZ soz RPZ
Factor 1
. 3 8 6 9 4
. 8 1 5 6 4
. 7 6 6 8 3
. 5 1 4 9 5
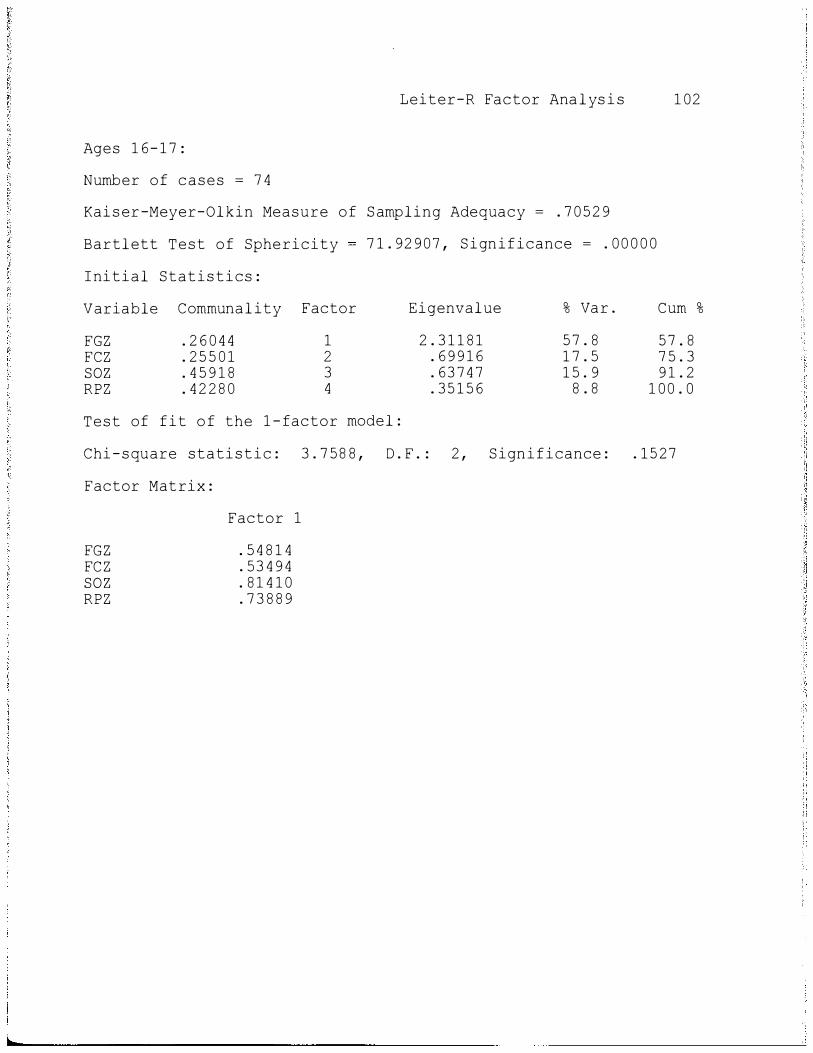
Ages 1 6- 1 7 :
Number o f cases = 7 4
Leiter-R Factor Ana l ys i s 1 02
Kai s er -Meyer-Ol kin Measure o f S ampling Adequacy = . 7 0 5 2 9
Bartlett Test o f Sphericity 7 1 . 9 2 9 0 7 , S i gn i f icance = . 0 0 0 0 0
I ni t i a l Stati s t i cs :
Variable Communal ity Factor Eigenvalue % Var . Cum %
FGZ . 2 6 0 4 4 1 2 . 3 1 1 8 1 5 7 . 8 5 7 . 8 FCZ . 2 5 5 0 1 2 . 6 9 9 1 6 1 7 . 5 7 5 . 3 soz . 4 5 9 1 8 3 . 6 3 7 4 7 1 5 . 9 9 1 . 2 RPZ . 4 2 2 8 0 4 . 3 5 1 5 6 8 . 8 1 0 0 . 0
Test of fit o f the 1 - factor model :
Chi - s quare stati s t i c : 3 . 7 5 8 8 , D . F . : 2 , S i gn i f icance : . 1 5 2 7
Factor Matrix :
FGZ FCZ so z RPZ
Factor 1
. 5 4 8 1 4
. 5 3 4 9 4
. 8 1 4 1 0
. 7 3 8 8 9
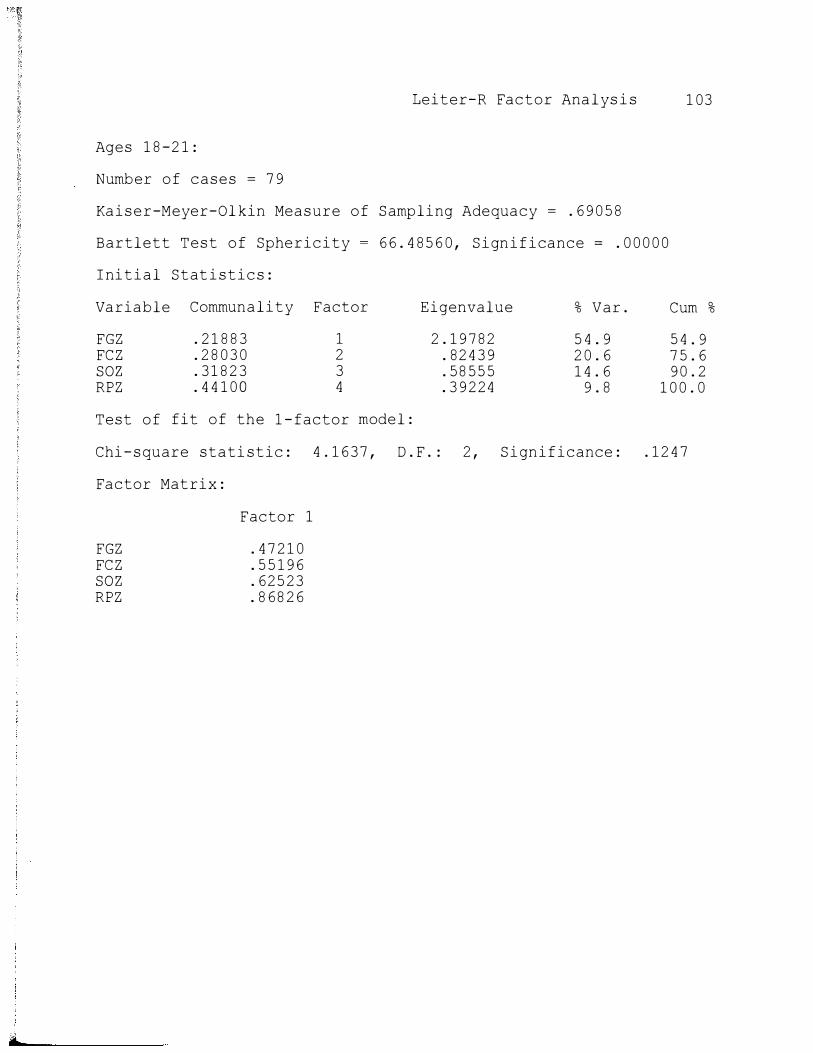
Ages 1 8 -2 1 :
Number of cases = 7 9
Leiter-R Factor Ana l ys i s 1 03
Kai s e r -Meyer-Ol kin Measure of Sampling Adequacy = . 6 9 0 5 8
Bartlett Test of Sphericity 6 6 . 4 8 5 6 0 , S i gn i f i cance = . 0 0 0 0 0
I ni t i a l Stat i st i c s :
Variable Communa l i t y Factor Eigenvalue % Var . Cum %
FGZ . 2 1 8 8 3 1 2 . 1 9 7 8 2 5 4 . 9 5 4 . 9 FCZ . 2 8 0 3 0 2 . 8 2 4 3 9 2 0 . 6 7 5 . 6 soz . 3 1 8 2 3 3 . 5 8 5 5 5 1 4 . 6 9 0 . 2 RPZ . 4 4 1 0 0 4 . 3 9 2 2 4 9 . 8 1 0 0 . 0
Test of fit of the 1 - factor model :
Chi - s quare stati stic : 4 . 1 6 3 7 , D . F . : 2 , S i gn i f i cance : . 1 2 4 7
Factor Matrix :
FGZ FCZ so z RPZ
Factor 1
. 4 7 2 1 0
. 5 5 1 9 6
. 6 2 5 2 3
. 8 6 8 2 6

Leiter-R Factor Analys i s 1 0 4
Appendix C
Vita

Leiter-R Factor Analy s i s 1 0 5
Curriculum Vita
Steven M . "Mi ke " Bay
Current Addre s s : Permanent Addre s s : 8 0 Greencres t Terrace Akron , OH 4 4 3 1 3
6 8 3 8 Boston Harbor Rd . N . E . Olympia , WA 9 8 5 0 6
Education
Master ' s i n clini cal p s ychology , George Fox Unive r s i t y , 1 9 9 4 .
Doctorate i n clinica l ps ychology ( expected ) , George Fox Unive r s i t y , 1 9 9 7 .
Bachelor ' s i n communi cations ( cum l aude ) , Washington S tate Unive r s i t y , 1 9 8 3 .
Ps ychology Experience
Predoctoral I nternship
Septembe r 1 9 9 6-present , EMERGE Mini strie s , Akron , OH . EMERGE i s a Chr i s t i an mental health cent e r whi ch receive s mos t o f i t s referra l s from pastors and churches , and s e rves mini sters and mi s s i onaries from around the world . EMERGE provides over 2 0 0 therapy hours per wee k to adult s , couple s , fami li e s , adoles cent s , and children . Outpat i ent experience : * Individual therapy and a s s e s sment with adults and
*
*
adole s cents Marital therapy For M . A . level pastoral counsel ing students from Ashl and Theological Seminary, co-led group therapy , supervi sed practicum experience , and taught a course in developmental psychology
I npatient experi ence ( EMERGE ' s inpatient program at Cuyahoga Fal l s General Hospital ) : * Led 1 /2 -hour devot ional group * Led 1 -hour therapy group ( combination didacti c /proce s s ) * I ndividual therapy with patients
Practicum, January 1 9 9 5 - June 1 9 9 5 , sex o ffender unit , Green Hill S chool , Chehali s , WA . Green Hill is a maximum- security j uven i l e detention cente r . Experience : * I ndividual therapy with adole s cent s * Co-facil itated anger management groups * Led two proce s s -oriented men ' s i s sues groups

Leiter-R Factor Ana l ys i s 1 0 6
Practicum, September 1 9 9 4 -December 1 9 9 4 , p s ychology services department , Federal Correctional Institution , Sheri dan , OR . Experience : * P s ychological intake evaluati ons * Individual therapy * Co-taught drug abuse education cours e
Practi cum, September 1 9 9 3 - June 1 9 9 4 , The Grotto Counseling Cent e r , Portland, OR . The Grotto i s a Catholic- sponsored faci l i t y o ffering low-cost therapy to persons with no mental health insurance . Experience : * Individual therapy with adult s * Marital therapy
Asses sment Experience
The table below l i s t s tests and approximate number of times admi n i s tered, scored, and/or interpreted .
Test # MMPI - 2 5 0 + Ror s chach ( Exner ) 1 5 WAI S - R 1 5 W I S C- I I I 3 Sentence Completion 5 0 + Personal Problems Checkli s t 5 0 + Deve reux Scales o f Mental Di sorders 1 0 Bender Visual Motor Gestalt 1 0 Hou s e /Tree / Person Drawings 1 0 TAT 5 Roberts Apperception Test-Chi ldren 5 WRAT- 3 5 Gates -MacGinitie Reading Test 5
Teaching Experience
As part o f predoctoral internship , taught 1 0 -week course on human growth and development for 50 master ' s level pastoral counseling s tudent s from Ashland Theological S eminary . Course i nvolved 1 0 hours o f lectures covering l ate childhood through the elde r l y ; two exams ; and a 1 5 - 2 0 page paper on relevent topics in developmental p s ychology .
Taught b a s i c coun s e ling s ki l l s to pastors a s part o f 4 -day pastoral counseling seminar at EMERGE .
Di s s ertation/Re search
Di s s e rtation ent i t l ed An Exploratory Factor Analys i s of the Leiter- R . The Leiter-R i s a nonverbal intel l i gence test for chi ldren . Succe s s fu l l y defended final oral s , November 1 9 9 6 .

Leiter-R Factor Ana l ys i s 1 0 7
Currentl y conducting research proj ect a t EMERGE . Proj ect explores the kinds of problems reported by men and women in Chri s t i an mini s t ry , based on the re sponses of several hundred pastors and mi s s ionaries to the Personal Problems Checkl i s t .
Execut i ve Fell owship
During 1 9 9 5 - 9 6 s chool year was executive fel low for Dr . Rodge r Bufford, Ph . D . , Di s s e rtation Chairman for the George Fox University g raduate ps ychology program . Primary duty was editing Psy . D . student dissertations for l iterary qua l i ty and APA style . Al s o a s s i sted with other res earch and academic dut i e s .
Profe s s i onal Act ivities /Affiliations
Participated in the Akron Kiwani s 1 9 9 7 Parenting Fai r ; gave presentation on "When Parents Feel Like Fai lure s . "
Coll ected data ( interviewed faculty , alumn i , and student s ) for a survey a s s e s s i n g trends i n ps ychol ogy and graduate education ; survey conducted by Nati onal Council of S chools of Profe s s i onal Psychology ( NCSPP ) .
Student a f f i l i at e , American Psychological Association .
Personal Background
Upon receiving bachelor ' s degree in communications in 1 9 8 3 , worked for 1 0 years i n the field o f public relation s / j ourna l i sm , 2 - 1 /2 yea r s a s a n a s s i stant editor a t the Seattle office o f a nationwide bus i ne s s news s e rvice and 7 years a s an information officer at the Washington State Senate in Olymp i a . Whi l e working at the Senate , I applied to graduate school to pursue a doctorate in p s ychology . I was accepted to the George Fox Unive r s i t y Psy . D . program a n d began coursework in Septembe r 1 9 92 .
Career Obj ective
To s t rengthen the body of Christ through a min i s t ry of Chri stian couns e l ing .
Particular S k i l l s
Extens i ve experience i n writing , editing , and i s sues research .