Embed Size (px)
Citation preview

An Australian Government Initiative
An Exploration of early intervention for continence management following stroke, to minimise long-term disability Final report Date: 21 October 2005 Dr Barbara Hanna Ms Christie Fullarton Ms Peta Hocking Dr Michael Bennett Ms Bernadine Charles

Acknowledgments The authors would like to thank all of the research team for their contributions throughout the course of this project. Peta Hocking, for her assistance in implementing the BBCIA, and for feedback into the project. Heather Jarman for her initial work on the project. Nicole Lowry for her work in evaluating the use of the assessment and intervention chart by nursing staff. Dr. Michael Bennet for his guidance, relating to the medical care of stroke sufferers. To the steering committee including those mentioned above, and Bernadine Charles, Anne Fairbairn, and Jannie Selvidge; thank you for all of your input and suggestions. To all staff in participating hospitals, we would like to acknowledge and thank-you for your support and assistance throughout the project period. This project is an Australian Government Initiative Dr Barbara Hanna (Principal Investigator) Ms. Christie Fullarton (Associate Investigator / Research Fellow) Ms. Peta Hocking (Associate Investigator) Dr Michael Bennett (Associate Investigator) Ms. Bernadine Charles (Associate Investigator)
II

Table of contents Page Acknowledgments ii List of Tables v List of Figures vi List of Appendices vii Executive Summary 7
Rationale for the development of the research project 7
Literature Review 12
Method 16
Aim 16
Participants 16
Procedure 16
Tools 18
Data analysis 19
Results 20
Inferential Statistics 41
Within Groups Analysis 41
Between Groups analysis 42
Discussion 43 Issues encountered during the project life span 47
Conclusions / Achievement of Objectives 48
Recommendations and future research suggestions 52
References 53
List of Abbreviations 58
III

List of Tables Page Table 1: FIM assessment times for each group 17 Table 2: Stroke type definitions 18 Table 3: Scoring categories and descriptions for the FIM 19 Table 4: Sample Descriptive Statistics for Age, Length of Stay and Stroke Severity and FIM scores 20 Table 5: Participant numbers, age group and gender 22 Table 6: Discharge Destination for the overall sample 24 Table 7: Presence of pre-existing incontinence in CRS and RS 25 Table 8: Age group and pre-existing incontinence status CRS and RS 26 Table 9: Overall sample FIM 1 Item G scores 28 Table 10: Overall sample FIM 2 Item G scores 28 Table 11: FIM 2 Item G scores for CRS & RS on admit to rehab 31 Table 12: FIM 2 Item F scores (toileting) for CRS & RS on admit to rehab 32 Table 13: FIM 3 Item G scores for CRS & RS on discharge from rehab 33 Table 14: Stroke type and gender 34 Table 15: Age group and stroke type for CRS and RS samples 35 Table 16: Results of Marginal Homogeneity Analysis on FIM Item G according to discharge destination 42 Table 17: Descriptives for between groups analysis – CRS and RS 42 Table 18: Frequency of scores below and above the median 43 Table 19: Cell frequencies for Chi-square analysis of FIM 2 Item by Group (CRS vs. RS) 43 Table 20: Cell frequencies for Chi-square analysis of FIM 3 Item G by Group (CRS vs. RS) 44 Table 21: Cell frequencies for Chi-square analysis of FIM 2 Item F (Toileting) by Group (CRS vs. RS) 44
IV

List of Figures Page Figure 1: Participant Age 22 Figure 2: Stroke type 23 Figure 3: Length of Stay in Acute Care 23 Figure 4: Length of stay in Rehabilitation (Sub-acute care) 24 Figure 5: Pre-existing Incontinence (PI) 25 Figure 6: Age group and pre-existing incontinence status 25 Figure 7: FIM 1 Total score for CRS and Home groups 27 Figure 8: FIM 2 and 3 total scores for CRS and RS groups 27 Figure 9: % of cases for FIM Item G across time for CRS 29 Figure 10: % of cases for FIM Item G across time for RS 29 Figure 11: % of cases for FIM Item G across time for Home group 30 Figure 12: FIM 2 and 3 Item G scores for CRS and RS 31 Figure 13: FIM 2 Item F scores (toileting) for CRS & RS on admit to rehab 33 Figure 14: Stroke type and age group 35 Figure 15: Stroke type and LOS Acute 36 Figure 16: Stroke type and LOS rehabilitation 37 Figure 17: Stroke type and discharge destination 38 Figure 18: Stroke type and FIM 1 total score 39 Figure 19: Stroke type and FIM 1 Item G score 39 Figure 20: Stroke type and FIM 1 Item F score 40
V

List of Appendices Appendix A FIM (Functional Independence Measure) assessment tool Appendix B B&B continence initial assessment
Appendix C Participant consent form
VI

Executive Summary Rationale In Australia currently, as many as 48,000 people have a stroke every year. Furthermore, stroke has been found to be one of the leading causes of disability among the adult population in Australia (National Stroke Foundation, 2005). Many of those affected experience impairment or disability of normal functioning, with urinary incontinence (UI) being one of the most common. Over 2 million Australians feel the impact of incontinence (Department of Health and Ageing, 2005), not including the many friends and families who are affected in other ways by the condition. UI specifically, has been identified as a major factor influencing the functional recovery of patients experiencing stroke (Barer, 1989). The prevalence of incontinence in stroke patients is very high, and its presence has been linked to disability and the need for institutionalisation (Patel, Coshall, Rudd, & Wolfe, 2001; Bean, Kiely, Cairns, & Morris, 2003). In addition, research has shown UI to be an indicator of poor prognosis following stroke (Hankey, Jamrozik, Broadhurst, Burvill, Anderson, Stewart-Wynne, 2000; Thommessen, Bautz-Holter, Laake, 1999; Wade & Hewer, 1985; Wade, Wood & Hewer, 1985) and the strongest single predictor of disability following stroke (Taub, Wolfe, Richardson & Burney, 1994). It has also been demonstrated that stroke sufferers with premorbid UI were less likely to have a successful functional outcome at 6 months post stroke than those who were not incontinent prior to experiencing a stroke (Jawad, Ward, & Jones, 1999). Research has also indicated that longer periods of time between admission to rehabilitation and stroke occurrence are a factor influencing patient’s functional independence upon discharge (Gross, 1998). Research has demonstrated that intervention for continence issues upon admission to the acute setting after stroke, may improve continence rates (Chan, 1997). The use of the Functional Independence Measure (FIM) as an intervention for UI stroke patients has been examined with the results suggesting that the FIM contributed to a reduction in UI as well as improving patient well-being (Wikander, Ekelund & Milsom, 1998). Due to the low numbers involved in the study, it is suggested that a larger study be employed to further determine the use of FIM as a means of reducing UI in stroke patients.
Investigation of the literature surrounding treatment for UI in stroke patients appears to be lacking and requires further examination (Brittain, Peet & Castleden, 1998). While more recent suggestions indicate that treatment should be preceded by a thorough assessment to determine the cause and type of incontinence being experienced by the patient. Following this, several interventions can be trialled (Olsen-Vetland, 2003). Nonetheless, research suggests that many nurses lack the knowledge to adequately manage UI in acute care settings (Cooper & Watt, 2003; Connor & Kooker, 1996). Although incontinence cannot be prevented in stroke patients, its incidence post stroke can potentially be reduced through proper management and care. Through assessment and intervention during the acute phase of care, it is envisaged that continence issues can be improved. This may assist sufferers to obtain independence, and in turn reduce the need for spouse or carer intervention after discharge from an acute setting. Furthermore, this may result in a reduction in the number of stroke patients being admitted to aged care homes due to disability from incontinence and stroke.
7

Rationale for the development of the research project This research study evolved out of concerns around the continence management of patients who had a diagnosis of stroke. The accepted practice in the research site was that patients were generally discharged at approximately one to two weeks post stroke from the acute setting either to the home environment or to a sub-acute facility. It had been observed that patients discharged into the sub-acute facility, frequently experienced urinary continence problems. Although patients were assessed on admission to the sub-acute setting using a Functional Independence Measure (FIM) to assess their level of functional ability, they were not assessed in the acute setting. As well not having a FIM assessment in the acute setting, the management of continence took an ad-hoc approach or ‘usual’ care approach, as there was no formalised protocol for the management of continence following a diagnosis of stroke. This was a concern for staff since urinary continence was recognised as an important issue following stroke and a predictor of independent functioning and disability. Furthermore, patient outcomes were emerging as an important issue and staff were therefore eager to improve the continuity of care, between the acute and sub-acute facility. Staff from both the acute and sub-acute setting met to discuss this issue. An outcome from the initial meeting was the development of a continence assessment and intervention protocol. Primary Aim To determine if an early comprehensive assessment and appropriate intervention for incontinent stroke patients, improved urinary continence. Objectives
o Knowledge as to whether an early (within 48 hours of admission) assessment and intervention reduces urinary incontinence
o Knowledge as to the usefulness of the FIM as a guide for rehabilitation in
urinary incontinent stroke patients
o Knowledge as to whether the attached assessment and intervention and FIM assisted in reducing urinary incontinence in stroke patients
Procedure Participants were recruited from an acute unit within a regional Hospital. Potential participants were approached during their hospital stay to ask if they would like to participate in the research study. An assessment and intervention for incontinence using the BBCIA (Bladder & Bowel Continence Initial Assessment), was undertaken and the Functional Independence Measure (FIM) was used to measure its impact on overall level of functioning bladder management and toileting; twice for the group discharged home, and three times for the group who went on to rehabilitation. After extensive consultation with expert medical and nursing clinicians, and due to time restrictions related to following up participants in the study, it was decided to limit the assessment to urinary continence rather than bladder and bowel continence assessment.
8

Summary of FIM scoring assessment times for each group Group Time One (FIM 1) Time two (FIM 2) Time Three (FIM 3)Home On admission to
acute care (within 48 hours) n = 39*
Two weeks after discharge from acute care n = 32
Not taken
Current Rehabilitation Sample (CRS)
On admission to acute care (within 48 hours) n = 25
On admission to sub-acute care (rehabilitation) n = 24
On discharge from rehabilitation n = 24
Retrospective Rehabilitation Sample (RS)
No FIM scores available
On admission to sub-acute care (rehabilitation) n = 24
On discharge from rehabilitation n = 24
NOTE: * Two participants were deceased before time two and were therefore not included in the above figures for n. Participants / Sample A total of 105 people were approached to participate in the study. From this a total of 66 participants provided consent. Participants were recruited from the acute unit of a regional hospital from June 2004 to February 2005. In total 105 people were approached during the period, 39 of those approached did not participate, or were unable to be followed up after being given a brief outline of the study. Reasons for this include leaving the hospital earlier than expected, not completing the consent forms, or deciding not to participate. The sample was aged between 48 and 91, with equal amounts of males and females. The sample consisted of 66 in total. Thirty eight percent of the sample went on to rehabilitation, 59% went home, and 3% became deceased during acute care. The retrospective sample, were made up of 24 in total (10 males and 14 females). Tools Functional Independence Measure (FIM) The FIM consists of 18 items that assess seven different elements of physical functioning, communication and social cognition. Fundamentally, the FIM is useful to determine strengths and weaknesses in patients. Scores on each item range from a “7” defined as independence, to a “1”, where an individual requires total assistance. The lowest score of functioning is to be recorded. The FIM in Australia is widely used in hospital settings, and is in fact a DHS (Department of Human Services, Victoria) reporting requirement measure for rehabilitative services. Research has indicated the internal consistencies as assessed for stroke patients using the FIM, are over 0.93, whilst reliability coefficients ranged from 0.86 to 0.97 for each subscale (Stineman, Shea, Jette, Tassoni, Ottenbacher, Fieldler & Granger, 1996). The Bladder & Bowel Continence Initial Assessment The Bladder & Bowel Function Initial Assessment (BBCIA; see Appendix A) used in the current study, was an existing chart that at the time of the study was being developed further by a group of health professionals as an assessment and intervention guide for continence management. The first section (Section One) requires the nurse to tick boxes indicating the presence of certain symptoms relating to incontinence, both urinary and faecal, however for the purpose of this study only urinary incontinence was assessed. The second section which are interventions
9

aimed at addressing the possible causes of the incontinence was only completed when there was a “yes” response indicated from section one, indicating that there is a potential problem with incontinence. Achievement of Objectives / Major project findings The specific objectives of the project were:
o To identify the impact of an acute comprehensive continence assessment and implementation of associated interventions on continence outcomes for incontinent stroke patients.
Overall The acute comprehensive continence assessment and interventions provided favourable results for the groups involved. Over half the participants in the CRS, were discharged home (59%) after acute care. Furthermore, 85% of participants in the overall current sample at FIM 2 (following the intervention) scored a 6 (modified independence) or a 7 (complete independence), which indicates a person is having no accidents and is therefore continent. Home Group A significant proportion (59%) of the sample diagnosed with a stroke, were discharged home after a brief stay on average of seven days. The FIM total scores at time two (FIM 2) were on average 120 out of a possible 126, which is a very positive outcome and suggests a high level of independent functioning. In particular, the average FIM score on Item G (Bladder Management) at time one was 5 (with scores ranging from 1 to 7), suggesting that there was still a great amount of variation in continence levels upon admission. In comparison, the average score for FIM Item G two weeks after discharge was 6.7, with a range of score being only a 6 or 7. This was a significant improvement in scores over time and suggests that potentially the assessment and intervention may have played a part in this result. Current Rehabilitation Sample (CRS) and Retrospective Sample (RS) Taken together, the results for FIM 2 total and FIM 2 item F and G scores, suggests that the intervention may have played some part in the results. As previous research has suggested incontinence is an indicator of poor outcome after stroke, and the results imply that overall the level of functioning was higher in the CRS group at FIM 2 (as indicated by the total FIM score and item F), and incontinence scores as assessed by FIM item G were on average higher than those in the RS.
o To address a gap in the research, pertaining to assessment and interventions for incontinent stroke patients.
The BBCIA chart was at its most fundamental, successful at increasing awareness about incontinence care and management in stroke patients for nurses on the Acute Unit; however adjustments are required to assist with clarity. Anecdotal discussion with a number of nurses in the unit resulted in a number of suggested changes to ensure a more user-friendly and effective tool for nurses and patients.
o To identify the usefulness of the FIM as a guide for the rehabilitation process. FIM scoring was introduced as standard practice / care in the Unit where the research was conducted, just prior to the commencement of this project, and is conducted as a team effort on the unit involved. The scoring has provided information on the severity of the stroke in terms of the persons’ level of functioning, and their level of care needs (dependence vs. independence). FIM scoring also assists medical staff in determining stroke type and gives an indication of which parts of the brain have been affected.
10

o To provide a basis for further research to be conducted to validate the findings.
The research could be replicated with a refined version of the BBCIA. In addition, we believe other aspects of stroke management should be assessed, such as nurse’s knowledge surrounding continence, the cultural norms and beliefs surrounding continence, and the impact this has on nurse’s care. In interviewing some of the nurses involved about their experiences with the BBCIA and their implicit knowledge surrounding continence care, it is evident that these areas are having an impact on the care of stroke patients. In addition, it appears that the chart needs some further clarification in terms of wording and on-going evaluation to ensure it is consistent with current knowledge and practices in the area of continence care. Barriers to achievement of Aims
• Recruitment – this was time consuming due to the nature of the illness and availability of patients
• Sample size was slightly smaller than expected • Follow-up for progress was sometimes difficult (FIM scores) • Completion of BBCIA – inadequate documentation by nurses • Lack of knowledge by nurses surrounding continence care, and associated
procedures • Beliefs relating to continence, held by nurses which may be considered
inaccurate • Perceived lack of time by nurses – BBCIA was seen as additional work and
paperwork • Perception that the BBCIA is not going to be useful for nurses • Lack of understanding of the BBCIA or the interventions • Nurses hesitant to ask doctors or other medical staff to perform interventions
when required
11

Summary of Recommendations
1. On-going development and refinement of the BBCIA to ensure its clarity and relevance to care. In addition, the chart should continue to reflect current knowledge and practice in the area of continence care for people diagnosed with stroke.
2. Thorough education surrounding both incontinence care, and correct use of
the BBCIA for nurses working with stroke patients is needed. This should be put into place if the chart is to continue being used.
3. Ensure support and knowledge of continence care initiatives by all who work
with stroke patients, including doctors and allied health staff. This assists with collaboration among all levels of staff and areas of expertise.
4. Further research should examine the BBCIA (after amendments have been
made) taking into account nurses knowledge and culture (attitudes and beliefs). A future study could examine the use of the BBCIA and the impact of current levels of knowledge surrounding continence, and determine the cultural norms and beliefs held by nurses that are negatively and positively influencing continence care. From this, educational needs (such as a cultural change program) can be determined which will aim to challenge negative beliefs and attitudes, and reinforce the positive ones. In addition, the research would also provide information surrounding education needs of nurses relating to continence care, and where this needs to be directed.
5. Prospective research should also examine and incorporate the incidence of
discharge destination (% home, % rehabilitation) as an outcome measure for successful assessment and interventions for incontinence.
6. The study provides evidence of a need for a continence advisor in both the
hospital setting and rehabilitation. After a continence assessment using the BBCIA, it would useful for those who are identified as having continence issues, to be referred on to someone who is regarded as a specialist in this area, to ensure that the most appropriate interventions are made and ongoing care is provided. This is likely to encourage collaboration between nurses and the continence advisor, and in the process nurses may gain further insight into incontinence.
12

Literature Review In Australia today, 48,000 people suffer from a stroke each year (National Stroke Foundation, 2005). Consequently, stroke in Australia is the third largest cause of death, and one of the main causes of disability in adults in the country (National Stroke Foundation, 2005). As a result of stroke, many sufferers experience impairment or disability of normal functioning, one of the most common being urinary incontinence (UI). Over 2 million Australians are affected by incontinence (Department of Health and Ageing, 2005), not including the many friends and families who are also affected in other ways by the condition. UI specifically, has been identified as a major factor impacting on the functional recovery of patients experiencing stroke (Barer, 1989). It is a devastating condition, both physically and psychologically. Physically, the person has little control over bladder movements and psychologically it can be very damaging through a loss of independence, and diminished quality of life (Gross, 1998). UI can also have a significant effect on social life and many of those with the condition may feel unable to discuss the problem with others due to embarrassment (NCMS, 2001). Research into UI and stroke has suggested that the presence of UI between 7 and 10 days post stroke will significantly influence the survival and functional recovery of the patient (Wade, Wood, & Hewer, 1985; Wade & Hewer, 1985).
There appears to be lack of consensus over the potential contributing factors related to UI after stroke. On one hand, some research has shown decreased mental ability in those who experience UI after stroke (Castleden, Duffin, Asher, & Yeomason, 1985), whilst another study has found severe motor problems (Borrie, Campbell, Caradoc-Davies, Spears, 1986) to be a factor in the relationship between incontinence and stroke. Whether these factors are causal of UI in stroke patients, is yet to be established. The literature has demonstrated the significance of UI as an indicator of poor prognosis following stroke (Hankey, Jamrozik, Broadhurst, Burvill, Anderson, Stewart-Wynne, 2000; Thommessen, Bautz-Holter, Laake, 1999; Wade & Hewer, 1985; Wade, Wood & Hewer, 1985). Research by Taub, Wolfe, Richardson, and Burney (1994) found that incontinence was the strongest single predictor of disability following stroke. Whilst other studies found UI associated with increased rates of institutionalisation and increased disability three months post stroke (Patel, Coshall, Lawrence, Rudd & Wolfe, 2001). Age has also been identified as a prognostic factor for recovery from UI following stroke, with much of the research indicating that older stroke sufferers have low prognosis of recovery (Patel, Coshall, Rudd & Wolfe, 2001; Meins, Meir-Baumgartner, Neetz, & von Renteln-Kruse, 2001; Patel, Coshall, Lawrence, Rudd & Wolfe, 2001). In addition to this, a recent study has also found that stroke sufferers with pre-existing UI were less likely to have a functional outcome at 6 months post stroke than those who were not incontinent prior to experiencing a stroke (Jawad, Ward, & Jones, 1999). The incidence of UI in stroke patients varies across the literature, depending on setting and method used in the research. In an earlier study, Brocklehurst, Andrews, Richards and Laycock (1985) found 51% of stroke patients were incontinent at some point during the 12 month post stroke period, decreasing to 23% and 24% at two and three years respectively, and then dropping down to 14% in line with the general elderly population rate. Patel, Coshall, Rudd, and Wolfe (2001) found the incidence of UI in a sample of stroke sufferers was initially 40%, dropping to 15% and 10% respectively for one and two years post stroke. Furthermore, van Kuijk, van der Linde, and van Limbeek, (2001) reported the incidence of UI in stroke patients as 29 cases per 1000 people, which is slightly lower than that suggested by previously mentioned
13
studies. However, this result may have been impacted on by the exclusion criteria used, and a small sample size. The causes of UI in stroke patients, has not been extensively researched. One study that has focused on the mechanisms behind UI in stroke patients is Gelber, Good, Laven, and Velhulst (1993). Their research pertaining to causes of UI in stroke patients demonstrated suggested the following three main causes. The first is the disruption of particular neurological pathways. The second proposed cause was, cognitive and language problems due to the stroke. The final cause was identified as either neuropathy or use of medications. As a follow on from their research, it is suggested that treatment strategies based on the causes identified should be examined more extensively. More recently, Olsen-Vetland (2003) examined causes of incontinence in stroke patients and defined them in terms of neurological, functional and cognitive. However, she argues that certain complications following a stroke can also contribute to incontinence. Recent studies have also examined the effect of educational programs on nursing practice with stroke patients. For example, Booth, Hillier, Waters and Davidson (2005) found some change in physical interactions with patients in line with therapeutic practices taught, and with no increase in time exhibited. As a consequence, it is argued by the researchers that common reports about nurses’ perceived lack of time as a reason for not completing rehabilitative tasks may actually be due to a lack of confidence and skills in dealing with the problem at hand, such as UI. Brooks (2004) reports on an audit prior to and following the implementation of a set of guidelines for dealing with UI in stroke patients. However, while the outcomes stated look positive, the results were taken from case histories and only descriptive analysis was provided. Moreover, the author argues that further research is needed to assess the effectiveness of interventions in improving incontinence in stroke patients. Treatment or interventions for UI in stroke patients have not been adequately addressed in the literature. A review of stroke and UI literature by Brittain, Peet and Castleden (1998) found treatment for stroke patients with UI, needs to be investigated further. Many researchers also support this suggestion (Brittain, Peet, &Castleden, 1998; Owen, Getz, & Bulla, 1995; Patel, Coshall, Lawrence, Rudd, & Wolfe, 2001). Wade and Hewer (1985) argued that the presence of UI, can assist medical professionals through identification of those patients that may require additional attention as part of their treatment. Furthermore, Barer (1989) from his research found that recovery from incontinence seemed to promote increased self-esteem and morale, which in turn may speed up the recovery process. As a result of this observation, it was recommended that future research study the effects of addressing incontinence in the early stages following stroke. Gross (1998) in a study which examined the characteristics of continent and incontinent stroke patients, found that stroke patients who stayed incontinent, were often admitted to rehabilitation later than others, and had lower functional independence (as assessed by the FIM) upon admission. These two studies potentially indicate that early intervention for incontinence may be a useful strategy to reduce incontinence in stroke patients. It has been argued by Gross (2000) that incontinence is a predictor of functional independence. Gross discovered that a longer period of time between admission to rehabilitation and stroke was a factor influencing patient’s functional independence upon discharge. This is supported by Chan’s (1997) earlier work examining bladder management of UI in stroke patients in an acute setting upon admission. The results of the study showed 84% of the UI patients became continent within one month post stroke. The above studies all suggest that early intervention may be beneficial in reducing disability post stroke due to incontinence. Given these results, it is
14

recommended that future research needs to be more stringent and ongoing in the early stages following stroke and should focus more on the functional outcome rather than the urology of UI stroke patients (Gross, 2000).
Measures of functional independence include the FIM. As an outcome measure for stroke, the FIM is one of the top two measures (Torenbeek, Caulfield, Garrett & Van Harten, 2001). In comparison to other health measures, the FIM has excellent psychometric properties. In particular, the internal consistencies as assessed for stroke patients using the FIM are over 0.93, whilst reliability coefficients ranged from 0.86 to 0.97 for each subscale (Stineman, Shea, Jette, Tassoni, Ottenbacher, Fieldler & Granger, 1996). Further research by Dodds, Martin, Stolov and Deyo (1993) also reported high internal consistencies and high discriminant ability among stroke patients. The use of the Functional Independence Measure (FIM) as an intervention for UI stroke patients has been examined with the results suggesting that the FIM contributed to a reduction in UI as well as improving patient well-being (Wikander, Ekelund & Milsom, 1998). It can be argued therefore that the FIM as well as being a valid and reliable indicator of stroke outcome, may also be beneficial to the recovery and rehabilitation process in stroke patients It is unfortunate, that there appears to be a lack of literature relating to assessment and interventions for UI in stroke patients. It is suggested by many researchers that this is an area where research should be focused (Gelber, Good, Laven & Verhulst, 1993; Patel, Coshall, Lawrence, Rudd and Wolfe, 2001). The current study is an attempt to address this gap in the research.
15

Method Aim To determine if an early comprehensive assessment and appropriate intervention for incontinent stroke patients, improved urinary continence. Participants A total of 66 participants were recruited for the study. Participants were recruited from the acute unit at a 315-bed facility in a regional publicly funded hospital from June 2004 to February 2005. In total 105 people were approached during the period, 39 of those approached did not participate, or were unable to be followed up following a brief outline of the study for various reasons including: * Leaving the hospital earlier than planned
* Deciding not to participate
* Not completing the consent forms
* Short length of stay
* Further medical complications
* Difficulty obtaining 3rd party consent
* Found not to have suffered from a stroke * Moved to another unit within the hospital Procedure Following ethical approval from relevant bodies, participants were recruited from an acute unit at a 315-bed facility in a regional publicly funded Hospital. Potential participants were approached during their hospital stay to ask if they would like to participate in the research study. In cases where the patients were not able to give written informed consent, a third party form was signed by a close relative, to acknowledge they had received information on the study, and did not object to participation. Each person approached about being a part of the study was given an explanation about the study and what would be involved with participation (overview). An opportunity to ask questions was provided to all participants, as well as time to look over the information and discuss the project with other relatives or friends. In the case of third party consent, the procedure was the same. The assessment and intervention conducted by nurses on the unit, took place within the 48-hour period following the patient’s admission. The assessment and intervention was introduced onto the unit with nurses expected to complete the form for each new stroke patient admitted. The process in more detail for participants was the following:
• FIM (Functional Independence Measure; see Appendix A) scores were determined as part of the initial continence assessment, thereby providing base line measurement of independence with daily tasks including toileting and current level of functioning. FIM scores were established as part of a team effort between allied health staff and nurses, to ensure accuracy. In addition, stroke classifications according to the OCSP Oxfordshire Stroke Classification System (OCSP; Bamford, Sandercock, Dennis, Burn & Warlow, 1991) were also determined by medical staff, as a team.
• Nurses were to follow the “Bladder and Bowel Continence Initial Assessment” (BBCIA; see Appendix B) document and tick the boxes in the assessment section according to the symptoms exhibited. Interventions were then to be undertaken according to individual patient need as determined by the assessment. More specifically, if there was a “Yes” response ticked in any
16
boxes of the assessment section on urinary continence nurses were to continue with the intervention component on the second half of the page.
• If the discharge destination after acute care was rehabilitation, the
FIM scores were taken on admission to the facility (time 2 / FIM 2), and then upon their discharge from the facility (time / FIM 3). Most participants attended a public regional rehabilitation facility however four participants went to private care. There was no difference in FIM scoring procedures between the public and private facility, and as a result were examined together.
• If discharge destination after acute care was home, a phone FIM (time 2 / FIM
2) was administered two weeks after discharge by one of the FIM trained associate investigators.
Additional information obtained from the medical history of participants was age, gender, stroke type, pre-existing incontinence, length of stay (acute care and rehabilitation if applicable), and discharge destination. Table 1: FIM assessment times for each group Group Time One Time two Time Three Home On admission to acute
care (within 48 hours) n = 39*
Two weeks after discharge from acute care n = 32
Not taken
Current Rehabilitation Sample
On admission to acute care (within 48 hours) n = 25
On admission to sub-acute care (rehabilitation) n = 24
On discharge from rehabilitation n = 24
Retrospective Rehabilitation Sample
No FIM scores available
On admission to sub-acute care (rehabilitation) n = 24
On discharge from rehabilitation n = 24
NOTE: * =two participants were deceased before time two and were therefore not included in the above figures for n; Home = those who were discharged home from acute care; Current Rehabilitation Sample = those who went on to rehabilitation following acute care (n=25) includes 4 participants who went to a private rehabilitation, where the FIM scoring procedure did not differ to those in the public group, and as a result, are included as part of the CRS group statistics; RS = Retrospective Rehabilitation Sample Retrospective Sample A list of 40 patients who had been admitted to both the hospital and rehabilitation unit where the study was being conducted, and who had been diagnosed with a stroke in the 6 months prior to the study being conducted, was compiled by Health Information Services. From this list the retrospective participant selection was conducted by selecting the first 15 on the list that were available. Another 15 were requested at a later date, and were selected on the basis that they were available. A total of 24 retrospective patient histories were selected for comparison against the 25 in the current sample who had been admitted for rehabilitation to a sub-acute setting. Stroke Classifications The classification of stroke types was consistent with the Oxfordshire Community Stroke Project, a large-scale project examining first time stroke. As a result of this study, a method for classifying stroke type was determined and referred to as Oxfordshire Stroke Classification System (OCSP; Bamford et al, 1991). In addition, the current study also included TIA and Haem. The four stroke types (and TIA & HAEM) and their definitions are as follows:
17

Table 2: Stroke type definitions Stroke Type Symptoms / Presentation LACI (Lacunar infarct) Outcome = usually good
• Pure motor OR pure sensory stroke • OR a combination of motor and sensory
(sensorimotor) • OR ataxic hemiparesis
TACI (Total Anterior Circulation Infarct) Outcome = usually poor
• Motor and or sensory deficits which effect the arm, leg and face in at least two areas
• AND Hemianopia (visual problems) • AND Higher cerebral dysfunction such as
dysphasia; visual field disturbance PACI (Partial Anterior Circulation Infarct) Outcome = varied
• Any two components of a TACI • OR Isolated cerebral dysfunction, which are
more restrictive than in a LACI classification.
POCI (Posterior Circulation Infarct) Outcome = varied
• Symptoms of brainstem dysfunctioning • OR Hemianopia (isolated)
TIA (Transient Ischaemic Attack) Symptoms resolve within 24 hours however 5-10% will develop an infarct (stroke) in the 12 months following.
This is like a warning stroke, where neurological symptoms occur suddenly, when inadequate blood supply reaches the brain
HAEM (haemorrhage stroke) Outcome = usually poor
Bleeding from a ruptured blood vessel in the brain, this restricts the oxygen and nutrients getting to the brain. Can cause brain damage.
NOTE: Hemianopia = a person is only able to see to one side when they are looking straight ahead. Dysphasia = problems using language which can be either expressive (trouble speaking) or receptive (understanding) Ataxic Hemiparesis = muscle weakness present on one side of the body along with uncoordinated movement. Source: Lindsay, K.W., & Bone, I. (2004). Neurology and neurosurgery illustrated. (4th ed.). London: Churchill Livingstone. For the current study, stroke type was determined by medical staff for the CRS and home groups. For the RS, stroke type was determined by members of the research team however medical staff were consulted if there were any uncertainties. Tools Functional Independence Measure (FIM) The FIM consists of 18 items that assess seven different elements of physical functioning, communication and social cognition. Fundamentally, the FIM is useful to determine strengths and weaknesses in patients. Scores on each item range from a “7” defined as independence, to a “1”, where an individual requires total assistance (refer to Table 3 for a description). In particular, Item G on the FIM is an indicator of an individual’s level of urinary incontinence (Keith, Granger, Hamilton & Sherwin, 1987). The item deals with two components, namely bladder management and frequency of incontinence. Also, Item F of the FIM is an indicator of Toileting ability. This item refers to the ability of the individual to maintain hygiene and adjust clothing both before and after going to the toilet. The lowest score of functioning is recorded.
18

Table 3: Scoring categories and descriptions for the FIM
Scoring Category Description 1 Person requires total assistance (person contributes 0%+) 2 Person requires maximal assistance (Person contributes
25%+) 3 Person requires a moderate amount of assistance (Person
contributes at least 50%) 4 Person requires minimal assistance (Person contributes 75%+) 5 Person requires supervision to perform task 6 Person requires a device to assist them with the task (modified
independence) 7 Completely independent – person requires no assistance from
a person or a device to compete the task A survey of rehabilitation measures in five different countries, found the FIM (see Appendix A) to be one of the top two stroke outcome measures used in Europe (Torenbeek, Caulfield, Garrett & Van Harten, 2001). The FIM in Australia is widely used in hospital settings, and is the DHS (Department of Human Services, Victoria) reporting requirement measure for a variety of rehabilitative services. Specifically, research into the validity of the FIM indicates that its psychometric properties are very favourable in comparison to other standardised health measures. In particular, the internal consistencies as assessed for stroke patients using the FIM are over 0.93, whilst reliability coefficients ranged from 0.86 to 0.97 for each subscale (Stineman, Shea, Jette, Tassoni, Ottenbacher, Fieldler & Granger, 1996). Further research by Dodds, Martin, Stolov and Deyo (1993) also reported high internal consistencies and high discriminant ability among stroke patients. FIM scoring for the current study was completed as a team exercise at all sites where the project was conducted. The allied health staff providing patient care determined the scoring. The Bladder & Bowel Continence Initial Assessment The Bladder & Bowel Function Initial Assessment (BBCIA; see Appendix B) used in the current study, was developed by a group of health professionals as a guide for nurses to assist them in deciding whether patients are incontinent, and require further assessment and interventions. The first section (Section One) required the nurse to tick boxes indicating the presence of certain symptoms relating to incontinence. The second section, which are interventions aimed at addressing the possible causes of the incontinence was only completed when there was a “yes” response indicated from section one, suggesting that there was a potential problem with incontinence. Data analysis Both descriptive and inferential statistics were provided. Data was analysed using SPSS for windows version 12.0. Comparisons were made both within groups and between groups where appropriate. Inferential statistics included marginal homogeneity analysis (Item G scores within groups across time), chi-square (Item G and F scores between the CRS and RS group) and the median test (FIM total scores between the CRS and RS groups).
19
Results Table 4 presents the sample descriptive for variables in the dataset for the current and retrospective samples. Data is presented in groups according to discharge destination following acute care, these being: home, current rehabilitation sample (CRS) and retrospective sample (RS). Table 4: Sample Descriptive Statistics for Age, Length of Stay and Stroke Severity and FIM scores Variable N Mean St D Range Min Max Skew Kurtosis Mode MedAge 66 72.83 11.07 43 48 91 -0.31 -0.91 * 75 Home / Dec 41 70.75 11.03 41 48 89 -0.35 -1.15 * CRS 25 76.24 10.45 34 57 91 -0.23 -1.00 * 76 RS 24 78.71 8.91 40 51 91 -1.23 2.7 * 80 LOS Acute 66 9.97 5.97 33 3 36 1.98 5.67 * 9 Home 31 7.41 3.24 12 3 15 0.76 -0.31 * 6 CRS 25 12.72 5.21 22 7 29 1.50 -2.70 * 11 RS 24 12.71 9.12 29 3 32 1.15 -0.06 * 9 LOS Rehab CRS 25 39.2 25.38 92 11 103 1.25 1.06 * 34 RS 24 32.67 25.31 103 6 109 1.47 2.17 * 25 FIM 1 Tot 65 81.80 30.31 108 18 126 -0.62 -0.53 * 90 Home / Dec 36 96.72 24.18 104 22 126 -1.45 2.28 * 102 CRS 21 64.48 24.34 91 18 109 -0.13 -0.44 * 65
FIM 1 (G) 65 4.37 2.25 6 1 7 -0.44 -1.37 6 5 Home / Dec 36 5.22 1.94 6 1 7 -1.17 0.35 6 7 CRS 21 3.38 2.13 5 1 6 0.09 -1.78 1 3
FIM 2 Tot 58 106.9 20.71 77 49 126 -1.21 0.76 * 113 Home 32 120.0 7.64 30 96 126 -1.64 2.26 * 123 CRS 19 93.15 13.72 52 61 113 -0.61 0.13 * 94 RS 24 83.29 18.03 73 50 123 0.08 -0.05 * 83
FIM 2 (G) 58 6.22 1.20 6 1 7 -2.09 5.39 7 7 Home 32 6.75 0.44 1 6 7 -1.21 -0.57 7 7 CRS 19 5.89 1.10 3 4 7 -0.61 -0.87 7 6 RS 24 5.29 1.68 6 1 7 -0.62 -0.13 7 5.5
FIM 2 (F) CRS 19 5.1 1.66 6 1 7 -0.83 0.33 6 6 RS 24 3.9 1.73 6 1 7 -0.37 -0.79 5 4
FIM 3 Tot CRS 19 111.4 11.85 47 76 123 -1.85 3.60 * 115 RS 24 105.8 15.02 53 73 126 -0.95 -0.19 * 112
FIM 3 (G) CRS 19 6.42 1.12 3 4 7 -1.76 1.56 7 7 RS 24 6.58 0.71 2 5 7 -1.47 0.79 7 7 NOTE: N = total number of participants with useable data; FIM item G = Bladder management; FIM Item F = Toileting; St D = Standard Deviation; Med = Median; Mode = Most common response; * = Multiple values obtained or not applicable to data type.
20

Age The average age of participants in the sample overall was 72.8, while for each of the groups this ranged between 70 and 78 years. LOS Acute / Rehabilitation The average Length of Stay (LOS) was 7.4 days in acute for those who went home. This is compared to 112.7 days each for CRS and RS. Mean LOS for those that went to Rehabilitation was 39.2 days for the CRS (median=34) and 32.6.for the RS (median=25). FIM 1 Total / FIM 1 Item G Overall FIM 1 Total scores were higher on average in the Home group at 96.7 and just 64.4 for the group that went on to Rehabilitation. The median FIM score for Item G for the group discharged home was 7, while for the CRS this was just 3. FIM 2 Total / FIM 2 Item G The mean total score for FIM 2 for the Home group was high at 120 out of a possible 126 and indicates a high level of independent functioning. The mean score for RS was 83 with a median of 83, as compared to CRS, which had a mean of 93 and a median of 94. This indicates on average a higher level of independent functioning in the current group upon admission to rehabilitation, occurring after the assessment and intervention. FIM 2 Item G and F FIM 2 Item G for the home group suggests that many participants were independent with bladder functioning two weeks after their discharge from hospital (mean = 6.75; median = 7). For the CRS the median was slightly higher (6) than those in the RS (5.5) within the same range. FIM 2 Item F referring to toileting suggests that overall those in the CRS had higher scores than those in the RS. The mean, mode and median for the CRS was higher, than for those in the RS, suggesting that more of those in the CRS were able to attend to their own hygiene needs and adjust clothing when going to the toilet, without the assistance of a helper. FIM 3 Total / FIM 3 Item G FIM 3 Total scores taken upon discharge from rehabilitation for the CRS and RS indicated that overall, the CRS had a higher average FIM score (111 as compared to 105 respectively). FIM Item G scores were the same with a median of 7 in both CRS and RS groups.
21

Table 5: Participant numbers, age group and gender RS CRS Home Age Group M F Total M F Total M F Total 48-55 1 0 1 0 0 0 2 2 4 56-60 0 0 0 1 1 2 3 3 6 61-65 0 0 0 2 1 3 2 3 5 66-70 1 1 2 1 0 1 1 0 1 71-75 2 3 5 3 3 6 3 4 7 76-80 2 2 4 2 2 4 3 2 5 81-85 2 6 8 0 1 1 5 3 8 86-91 2 2 4 3 5 8 0 1 1 TOTAL 10
(42%) 14
(58%) 24 12
(48%) 13
(52%) 25 21
(51%) 20
(49%) 41
NOTE: RS = Retrospective Sample; CRS = Current Rehabilitation Sample The RS is made up of 24 participants, with 14 females (58%) and 10 males (42%), while the CRS (25) was made up of 48% males and 52% females. There are no participants aged between 56 and 65 from the RS, and none aged between 48 and 55 in the CRS. The majority of participants were aged between 86-91 for CRS while in the RS the majority of participants were from the 81 to 85 years. The group who went home were varied in terms of age, whereas gender numbers were quite similar, with the exception of those in the 81 to 85 year age group, where significantly more men than women were discharged home. Figure 1: Participant Age
0%
5%
10%
15%
20%
25%
30%
35%
48-55 56-60 61-65 66-70 71-75 76-80 81-85 86-91
Age group
Cas
es
CRS RS Home
NOTE: CRS = Current rehabilitation sample; RS = Retrospective sample For the group who were discharged home, there was a participant in each of the age groups. The CRS had no participants in the 48 to 55, or the 66 to 70 year age group. Most participants came from either the 86 to 91 or 71 to 75 year age groups equally. The RS group had no participants in the 56 to 60 and 61 to 65 year age group, with the majority of them coming from the 81 to 85 year age bracket. It is evident that the older participants were most likely to go to rehabilitation, rather than be discharged home.
22

Figure 2: Stroke type
0%
10%
20%
30%
40%
50%
60%
LACI PACI POCI TACI TIA HAEM Not strokeStroke type
% C
ases
CRS RS Home Deceased
NOTE: CRS = Current Rehabilitation Sample; RS = Retrospective Sample; LACI = Lacunar Infarct; PACI = Partial Anterior Circulation Infarct; POCI = Posterior Circulation Infarct; TACI = Total Anterior Circulation Infarct; TIA = Transient Ischaemic Attack; Haem = Haemorrhage Stroke; NS = Not stroke (those participants initially diagnosed with a stroke, but after further investigation were found to have a differential diagnosis). Approximately 50% of those in the group that were discharged home had a LACI (see Figure 2). More than 60% of those in the RS group were diagnosed with either a LACI or PACI stroke. Those in the CRS were diagnosed with a POCI or LACI most frequently. There was no diagnosis of TACI in the home group, as expected due to the severe nature of symptoms exhibited. Moreover, all of those diagnosed with TIA were discharged home and required no rehabilitation. Figure 3: Length of Stay in Acute Care
0%
10%
20%
30%
40%
50%
60%
70%
80%
1=Totalassist (0%)
2=Max assist(25%)
3=Mod assist(50%)
4=Min assist(75%)
5=Supv'n 6=Modifiedindep
7=Completeindep
FIM 2 CRS FIM 2 RS FIM 3 CRS FIM 3 RS
NOTE: CRS = Current Rehabilitation Sample; RS = Retrospective Sample
23

Figure 3 presents the length of stay (LOS) for each group. The group discharged home spent the least amount of time in hospital, as would be expected, while the CRS participants spent between 6 and 30 days in acute care. The RS group had the biggest variation in LOS ranging from 1 to 36 days in total. Figure 4: Length of stay in Rehabilitation (sub-acute care)
0%
10%
20%
30%
40%
50%
60%
70%
1 to 30 days 31 to 60 days 61 to 90 days 91 to 120 days
CRS RS
NOTE: CRS = Current Rehabilitation Sample; RS = Retrospective Sample Length of stay in rehabilitation was varied across the two groups. Sixty seven percent of those in the RS were discharged from rehabilitation in the first thirty days, while this was true for only 30% of the CRS. In contrast, just 13% of the RS group, were discharged between 31 and 60 days while 50% from the CRS group were discharged after this amount of time. In both the CRS and RS, there were few participants staying longer than 91 days in rehabilitation. Overall, the figure above indicates that the LOS in rehabilitation was greater for the CRS. Table 6: Discharge Destination for the overall sample Male Female TOTAL Rehabilitation 12 13 25 (38%) Home 19 20 39 (59%) Deceased 2 0 2 (3%) TOTAL 33 33 n=66
Discharge destination for participants is indicated in the table above. Thirty eight percent of the total sample went on to rehabilitation, while 59% were able to go home. Three percent passed away during the acute phase
24

Pre-existing Incontinence Figure 5: Pre-existing Incontinence (PI)
0%
10%
20%
30%
40%
50%
60%
70%
80%
90%
CRS RS Home
PI = Yes PI = No
Table 7: Presence of pre-existing incontinence in CRS and RS PI CRS RS Home Cases % Cases % Cases % Male 2 29% 1 25% 3 43% Female 5 71% 3 75% 4 57% Total 7 100% 4 100% 7 100% Table 7 and Figure 5 above both indicate that many more females than males experienced incontinence prior to their stroke. In addition, there were almost twice as many cases of pre-existing incontinence in the CRS. Also interesting to note is that proportionally more in the home group had PI in comparison to those in the RS, yet they were discharged home. Figure 6: Age group and pre-existing incontinence status
0%
10%
20%
30%
40%
50%
60%
70%
80%
90%
100%
48-55 56-60 61-65 66-70 71-75 76-80 81-85 86-91 TOTALAge group
% C
ases
Yes No
25

Figure 6 above indicates that none of those in the 48 to 55, 61 to 65, or 66 to 70 year age groups had premorbid incontinence. Evident is an increase in the incidence of pre-existing incontinence from 23% in the 71 to 75 year age group, to 67% in the 86 to 91 year age group. In total, 18 out of 66 (29%) participants were identified as having premorbid incontinence. Table 8: Age group and pre-existing incontinence status CRS and RS RETROSPECTIVE (RS) CURRENT (CRS) AGE GROUP PI = Yes PI = No TOTAL PI = Yes PI = No TOTAL 48-55 0 1 1 0 0 0 56-60 0 0 0 0 2 2 61-65 0 0 0 0 3 3 66-70 0 2 2 0 0 0 71-75 0 5 5 0 5 5 76-80 1 3 4 1 2 3 81-85 2 6 8 1 0 1 86-91 1 3 4 5 2 7 TOTAL 4 20 24 7 14 21 No participants under the age of 75 from the RS or CRS, who went to acute care after being diagnosed with stroke, had existing incontinence problems. However, the incidence of incontinence appeared to increase with age, especially for the current sample, where 75% of those in the 86 to 91year age group had pre-existing incontinence issues. Overall, the incidence of incontinence for the RS was 17%, while for the current sample this was double at 33%.
26

FIM Total scores Figure 7: FIM 1 Total score for CRS and Home groups
0%
10%
20%
30%
40%
50%
60%
70%
1 to 20 21 to 30 31 to 40 41 to 50 51 to 60 61 to 70 71 to 80 81 to 90 91 to100
101 to110
111 to120
121 to126
FIM score total
% C
ases
FIM 1 Home FIM 1 CRS FIM 2 Home FIM 2 CRS
Figure 7 indicates that the group who were discharged home had higher overall FIM 1 total scores, ranging from 21 to 126, while the CRS group had scores ranging between 61 and 110. FIM 2 total scores for the group that went home were taken two weeks after discharge, while for the CRS group they were taken upon admission to rehabilitation. As indicated, the group going home had a much smaller range of high scores from 91 to 126, while the CRS ranged from just 41 to 120 for FIM 2 total. Figure 8: FIM 2 and 3 total scores for CRS and RS groups
0%
10%
20%
30%
40%
50%
60%
1 to 20 21 to30
31 to40
41 to50
51 to60
61 to70
71 to80
81 to90
91 to100
101 to110
111 to120
121 to126
Total FIM score
Cas
es
FIM 2 CRS FIM 2 RS FIM 3 CRS FIM 3 RS
27

FIM 2 and 3 total scores for CRS and RS are presented in the graph above. FIM 2 CRS scores range from 61 to 120, while for the RS group from 41 to 126. Sixty nine percent of scores for CRS at FIM 2 are above 91, while just 33% of those cases in the RS group scored above 91. FIM Item G Scores (Bladder Functioning) Table 9: Overall sample FIM 1 Item G scores FIM 1 Item G Male Female TOTAL % 1 = Total assist 3 5 8 17% 2 = Maximal assist 1 1 2 4% 3 = Moderate assist 1 2 3 6% 4 = Minimal assist 2 3 5 11% 5 = Supervision 4 2 6 13% 6 = Modified independence 10 5 15 32% 7 = Complete independence 2 6 8 17% TOTAL 23 24 47 100% Table 9 gives an indication of the varying levels of bladder management in the sample at FIM 1. In terms of bladder accidents, those scoring a one, two or three would have had an incidence of incontinence during the first 48 hours of their stay in acute care. For the current sample this was 27%. However, a score of 4 or 5 means that the person requires assistance from others with bladder management. In terms of incontinence, these people have accidents no more than weekly for a score of 5 and no more than two weekly for a score of 4. Twenty four percent of the sample fell into this category at FIM 1. Those scoring a 6 do not have any accidents or require any assistance, but may use a device such as a pad or bedpan and possibly control medication. Therefore, these people are at risk of having an accident and use a device for preventative measures. Thirty two percent of the sample was at this level within 48 hours of admission to acute care. Seventeen percent of the sample had complete independence during the first 48 hours after admission, and were therefore classed as continent. In terms of gender, three times as many females were completely independent (7) at FIM 1, while in contrast twice as many men had modified independence (6). There were however almost twice as many Females scoring a 1 within 48 hours of admission to acute care. Table 10: Overall sample FIM 2 Item G scores FIM 2 Item G Male Female TOTAL % 1 = Total assist (0%) 1 0 1 2% 2 = Maximal assist (25%) 0 0 0 0% 3 = Moderate assist (50%) 0 0 0 0% 4 = Minimal assist (75%) 1 3 4 9% 5 = Supervision 1 1 2 4% 6 = Modified independence 8 6 14 30% 7 = Complete independence 12 14 26 55% TOTAL 23 24 47 100% Just two percent of the sample, were incontinent (scoring a 1, 2 or 3) for Item G FIM scoring at time two (see Table 10). Thirteen percent of participants required
28

assistance (scored 4 or 5) from others with bladder management. These people have accidents no more than weekly for a score of 4, and no more than two weekly for a score of 5. Thirty percent of the sample scored 6 meaning they had no accidents and required no supervision, while 55% of the sample had complete independence with bladder management, at FIM scoring time 2. FIM Item G Scores by group Figure 9: % of cases for FIM Item G across time for CRS
0%
10%
20%
30%
40%
50%
60%
70%
80%
1 Total assist(0%)
2 Max assist(25%)
3 Mod assist(50%)
4 Min assist(75%)
5 Supv'n 6 Modifiedindep
7 Completeindep
FIM 1G FIM 2G FIM 3G
The range of scores across time for the CRS group varied a great deal at time one (see Figure 9). FIM 2 shows an improvement in scores, while FIM 3 indicates that just over 70% of the group were completely independent with bladder management tasks upon discharge from rehabilitation. Figure 10: % of cases for FIM Item G across time for RS
0%
10%
20%
30%
40%
50%
60%
70%
80%
1 Totalassist (0%)
2 Maxassist(25%)
3 Modassist(50%)
4 Minassist(75%)
5 Supv'n 6 Modifiedindep
7 Completeindep
FIM 2G RS FIM 3G RS
29
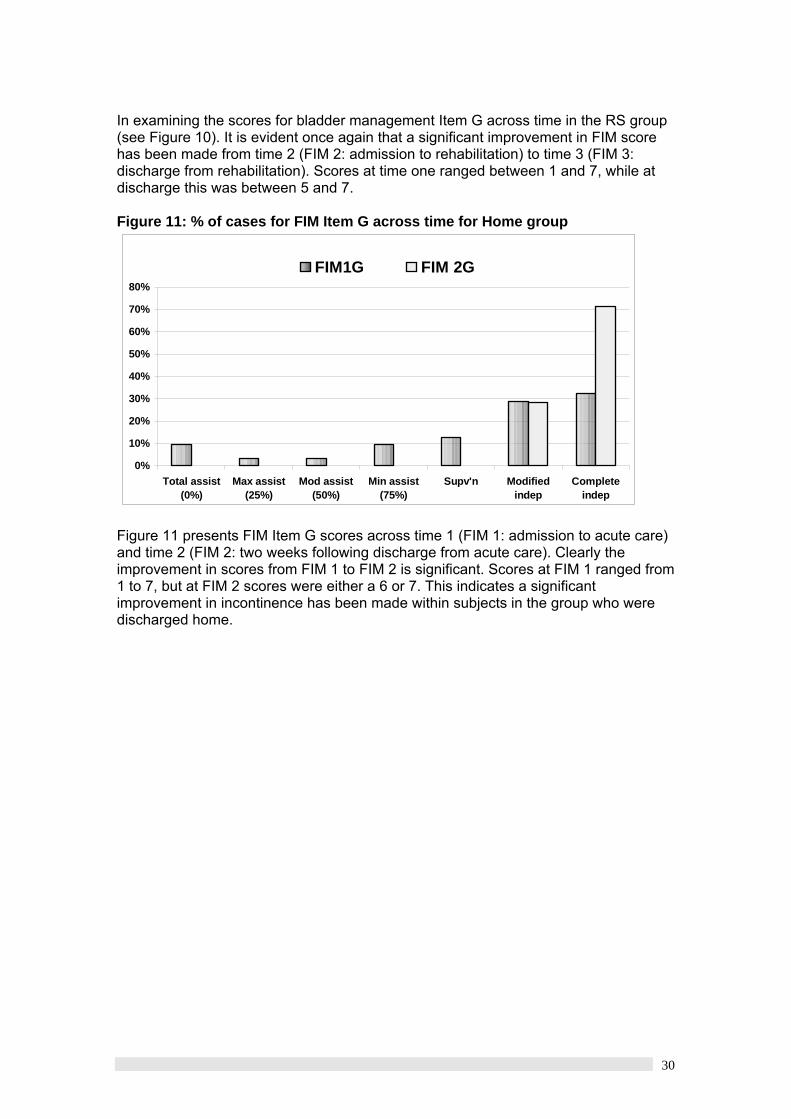
In examining the scores for bladder management Item G across time in the RS group (see Figure 10). It is evident once again that a significant improvement in FIM score has been made from time 2 (FIM 2: admission to rehabilitation) to time 3 (FIM 3: discharge from rehabilitation). Scores at time one ranged between 1 and 7, while at discharge this was between 5 and 7. Figure 11: % of cases for FIM Item G across time for Home group
0%
10%
20%
30%
40%
50%
60%
70%
80%
Total assist(0%)
Max assist(25%)
Mod assist(50%)
Min assist(75%)
Supv'n Modifiedindep
Completeindep
FIM1G FIM 2G
Figure 11 presents FIM Item G scores across time 1 (FIM 1: admission to acute care) and time 2 (FIM 2: two weeks following discharge from acute care). Clearly the improvement in scores from FIM 1 to FIM 2 is significant. Scores at FIM 1 ranged from 1 to 7, but at FIM 2 scores were either a 6 or 7. This indicates a significant improvement in incontinence has been made within subjects in the group who were discharged home.
30
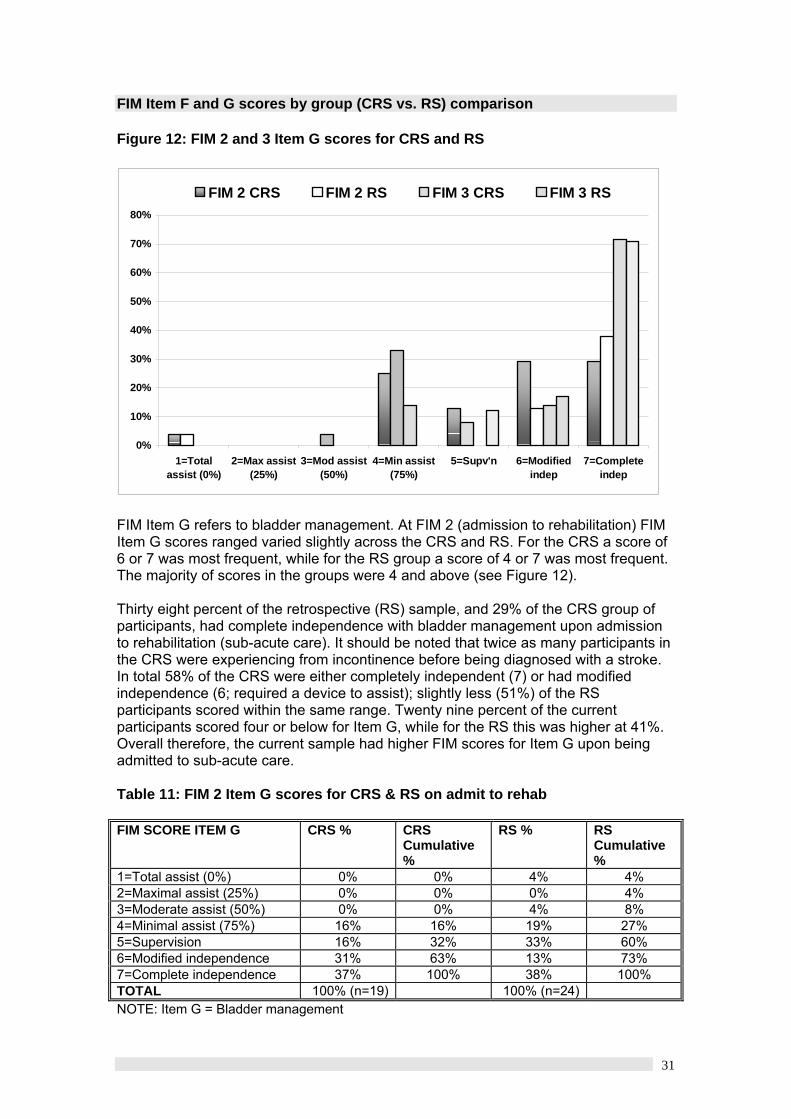
FIM Item F and G scores by group (CRS vs. RS) comparison Figure 12: FIM 2 and 3 Item G scores for CRS and RS
0%
10%
20%
30%
40%
50%
60%
70%
80%
1=Totalassist (0%)
2=Max assist(25%)
3=Mod assist(50%)
4=Min assist(75%)
5=Supv'n 6=Modifiedindep
7=Completeindep
FIM 2 CRS FIM 2 RS FIM 3 CRS FIM 3 RS
FIM Item G refers to bladder management. At FIM 2 (admission to rehabilitation) FIM Item G scores ranged varied slightly across the CRS and RS. For the CRS a score of 6 or 7 was most frequent, while for the RS group a score of 4 or 7 was most frequent. The majority of scores in the groups were 4 and above (see Figure 12). Thirty eight percent of the retrospective (RS) sample, and 29% of the CRS group of participants, had complete independence with bladder management upon admission to rehabilitation (sub-acute care). It should be noted that twice as many participants in the CRS were experiencing from incontinence before being diagnosed with a stroke. In total 58% of the CRS were either completely independent (7) or had modified independence (6; required a device to assist); slightly less (51%) of the RS participants scored within the same range. Twenty nine percent of the current participants scored four or below for Item G, while for the RS this was higher at 41%. Overall therefore, the current sample had higher FIM scores for Item G upon being admitted to sub-acute care. Table 11: FIM 2 Item G scores for CRS & RS on admit to rehab FIM SCORE ITEM G CRS % CRS
Cumulative %
RS % RS Cumulative %
1=Total assist (0%) 0% 0% 4% 4% 2=Maximal assist (25%) 0% 0% 0% 4% 3=Moderate assist (50%) 0% 0% 4% 8% 4=Minimal assist (75%) 16% 16% 19% 27% 5=Supervision 16% 32% 33% 60% 6=Modified independence 31% 63% 13% 73% 7=Complete independence 37% 100% 38% 100% TOTAL 100% (n=19) 100% (n=24) NOTE: Item G = Bladder management
31

Table 11 gives an indication of the varying levels of bladder management in the RS and CRS. In terms of bladder accidents, those scoring a one, two or three would have had an incidence of incontinence during the first 48 hours of their stay in acute care. In the CRS group this was just 5%, while for the RS group this was 8%. A score of 4 or 5 indicates that a person requires assistance from others with bladder management. In terms of incontinence, these people have accidents no more than weekly for a score of 5, and no more than two weekly for a score of 4. In the RS group 50% of the sample scored this or below and were therefore having bladder accidents. In comparison, 38% of the CRS group scored 5 or below indicating that 62% of this group were continent and 50% of the RS group can be defined as continent. Those scoring a 6 don’t have any accidents or require any assistance, but may use a device, such as a pad or bedpan or possibly control medication. Therefore, these people are at risk of having an accident and use preventative/containment measures. Thirteen percent of those in the RS group and 29% from the CRS group scored a six at FIM 2. Thirty eight percent of those in the RS had complete independence at FIM 2, compared to 33% in the CRS group. It should be noted that twice as many participants in the current sample were experiencing incontinence before being diagnosed with a stroke. In total 58% of the current sample were either completely independent (a score of 7 on FIM Item G) or had modified independence requiring a device to assist (a score of 6 on FIM Item G). Slightly less, (51%) of the RS scored within the same range. Overall therefore, the current sample had higher FIM scores for Item G upon being admitted in rehabilitation. Table 12: FIM 2 Item F scores (toileting) for CRS & RS on admit to rehab FIM SCORE ITEM F CRS % CRS
Cumulative %
RS % RS Cumulative %
1=Total assist (0%) 5% 5% 13% 12% 2=Maximal assist (25%) 0% 5% 13% 25% 3=Moderate assist (50%) 11% 16% 8% 33% 4=Minimal assist (75%) 21% 37% 21% 54% 5=Supervision 11% 48% 29% 83% 6=Modified independence 31% 79% 13% 96% 7=Complete independence 21% 100% 4% 100% TOTAL 100% (n=19) 100% (n=24)
32

Figure 13: FIM 2 Item F scores (toileting) for CRS & RS on admit to rehab
0%
5%
10%
15%
20%
25%
30%
35%
1=Tot assist 2=Max assist 3=Modassist
4=Min assist 5=Supv'n 6=Modifiedindep
7=Completeindep
% C
ases
CRS % RS %
Table 12 and Figure 13 both indicate that a large proportion of those in the CRS group required no helper (score of 6 or 7) with toileting tasks such as adjusting clothing and maintaining hygiene. The RS group in contrast scored predominantly below 6, suggesting they were overall less able to perform these tasks without a helper, and were therefore functioning at a lower level. Table 13: FIM 3 Item G scores for CRS & RS on discharge from rehab FIM SCORE ITEM G CRS % CRS
Cumulative %
RS % RS Cumulative %
1=Total assist (0%) 0% 0% 0% 0% 2=Maximal assist (25%) 0% 0% 0% 0% 3=Moderate assist (50%) 0% 0% 0% 0% 4=Minimal assist (75%) 16% 16% 0% 0% 5=Supervision 0% 16% 12% 12% 6=Modified independence 10% 26% 17% 29% 7=Complete independence 74% 100% 71% 100% TOTAL 100% (n=19) 100% (n=24) Note: rehab = rehabilitation Table 13 suggests that there was little variation in the scores for Item G bladder management upon discharge from rehabilitation. This is to some extent expected, as patients would need to be at a high level of functioning to render them suitable for discharge home.
33

Stroke type Table 14: Stroke type and gender RS CRS Home & Deceased Stroke Type M F TOT M F TOT M F TOT LACI 2 6 8 6 2 8 9 10 19 PACI 4 1 5 1 7 8 1 1 2 POCI 3 4 7 2 2 4 5 2 7 TACI 1 1 2 1 0 1 1 0 1 TIA 0 0 0 0 0 0 1 6 7 HAEM 2 1 3 0 3 3 2 0 2 NS 0 0 0 0 0 0 2 1 3 TOTAL 12 13 25 10 14 24 21 20 41 NOTE: N=66; LACI = Lacunar Infarct; PACI = Partial Anterior Circulation Infarct; POCI = Posterior Circulation Infarct; TACI = Total Anterior Circulation infarct; TIA = Transient Ischaemic Attack; Haem Stroke = Haemorrhage Stroke; NS=Not Stroke. The most common stroke type diagnosed for both females and males who were discharged home was a LACI (see Table 14 above). In terms of gender the second most frequent stoke type for males was POCI and for females this was a TIA. The least common for males was a TIA, while for females this was TACI and HAEM equally. For the CRS and RS the most frequent stroke types were LACI, PACI and POCI. In relation to gender, there were significantly more PACI and HAEM stroke diagnosed for females in the RS compared to the CRS. In contrast, females in the CRS were diagnosed with LACI and PACI most frequently. Males from the RS were most frequently diagnosed with LACI, while males in the CRS were most frequently diagnosed with PACI, followed closely by POCI. Those diagnosed with a LACI or TIA had the most favourable outcome; in terms of discharge destination many were able to go home from acute care.
34

Figure 14: Stroke type and age group
0%
10%
20%
30%
40%
50%
60%
48-55 56-60 61-65 66-70 71-75 76-80 81-85 86-91
Age group
% C
ases
LACI PACI POCI TACI TIA HAEM
NOTE: LACI =Lacunar Infarct; PACI = Partial Anterior Circulation Infarct; POCI = Posterior Circulation Infarct; TACI = Total Anterior Circulation Infarct; Haem = Haemorrhage Stroke. Figure 14 suggests that the most frequent stroke type across the age groups was LACI. TACI was only diagnosed in those in the older age groups ranging from 66 to 91. No TIA’s were diagnosed in anyone aged between 61 and 70 years of age. The POCI and PACI occurrence was fairly evenly spread between the age groups. The two age groups of 48 to 55 and 66 to 70 had the least amount of stroke occurrence. One third of the sample, were aged between 71 and 80 years at the time of their stroke. Table 15: Age group and stroke type for CRS and RS samples LACI PACI POCI TACI HAEM TOTALS Age group
CRS RS CRS RS CRS RS CRS RS CRS RS CRS RS
48-55 0 0 0 0 0 0 0 1 0 0 0 1 56-60 0 0 0 0 1 0 0 0 1 0 2 0 61-65 1 0 1 0 0 0 0 0 1 0 3 0 66-70 0 1 0 1 0 0 0 0 0 0 1 2 71-75 1 2 1 1 2 1 0 0 1 1 6 5 76-80 1 2 1 2 1 0 0 0 0 0 4 4 81-85 1 1 0 4 0 2 0 0 0 1 1 8 86-91 2 2 2 0 2 1 1 0 0 1 8 4 Total 6 8 5 8 6 4 1 1 3 3 25 24 NOTE: LACI =Lacunar Infarct; PACI = Partial Anterior Circulation Infarct; POCI = Posterior Circulation Infarct; TACI = Total Anterior Circulation Infarct; Haem = Haemorrhage Stroke. The greatest variation in stroke type across the sample can be seen in the age groups 71 to 75 and 86 to 91; these two groups also had greater numbers of participants (see Table 15). The younger participants (under 70 years) had fewer strokes in the current sample. In the age group 81 to 85 years, there is just one participant.
35

Just one participant was diagnosed with a TACI in the 48 to 55 year age group. In the 66 to 70 and 76 to 80 age groups there were only LACI and PACI strokes diagnosed. The most variation in stroke type and higher numbers, were in the older age groups from 81 to 85 and 86 to 91. Half of those from the RS in the 81 to 85 year age group, suffered from a PACI stroke. No participants under 71 years suffered from a Haem or POCI stroke in the RS. Figure 15: Stroke type and LOS Acute
0%
10%
20%
30%
40%
50%
60%
1-5 Days 6-10 Days 11-15 Days 16-20 Days 21-25 Days 26-30 Days 31 -36Days
LOS Acute
% C
ases
LACI PACI POCI TACI TIA HAEM
NOTE: N=66; LACI = Lacunar Infarct; PACI = Partial Anterior Circulation Infarct; POCI = Posterior Circulation Infarct; TACI = Total Anterior Circulation Infarct; TIA = Transient Ischaemic Attack; Haem = Haemorrhage Stroke. It is evident from Figure 15 above, that those diagnosed with a TACI or HAEM stroke, remained in acute care for the longest period, which suggests a potentially poorer outcome. As would be expected, those diagnosed with TIA had the shortest stay and therefore it is expected that they would have the best outcome from any of the stroke types.
36

Figure 16: Stroke type and LOS rehabilitation
0%
10%
20%
30%
40%
50%
60%
70%
1 - 20 Days 21 - 30 Days 31 - 40 Days 41 - 50 Days 61 - 70 Days 81-115 Days
LOS Rehabilitation
% C
ases
LACI PACI POCI TACI HAEM
NOTE: LACI = Lacunar Infarct; PACI = Partial Anterior Circulation Infarct; POCI = Posterior Circulation Infarct; TACI = Total Anterior Circulation Infarct; TIA = Transient Ischaemic Attack; Haem = Haemorrhage Stroke. Figure 16 presents the LOS within rehabilitation according to stroke type. Clearly, the LOS for TACI and HAEM stroke produced the most variation. The shortest LOS tended to be for those who were diagnosed with LACI. Those staying in rehabilitation the longest were diagnosed with the more severe stroke types of HAEM and TACI, which would be consistent with the descriptions of each stroke type and outcome (Lindsay and Bone, 2004). presented earlier in this report by Those diagnosed with a LACI spent the least amount of time in rehabilitation ranging from one to fifty days.
37

Figure 17: Stroke type and discharge destination
0%
10%
20%
30%
40%
50%
60%
70%
80%
90%
100%
LACI PACI POCI TACI TIA HAEMStroke type
% C
ases
CRS Home Deceased
NOTE: LACI = Lacunar Infarct; PACI = Partial Anterior Circulation Infarct; POCI = Posterior Circulation Infarct; TACI = Total Anterior Circulation Infarct; TIA = Transient Ischaemic Attack; Haem = Haemorrhage Stroke. All participants diagnosed with a TIA, were discharged home (see Figure 17). As expected, those with a TACI and HAEM had the least favourable outcomes, with death and rehabilitation in most cases. A large proportion of those diagnosed with a LACI were discharged home from acute care, while in contrast a large proportion of those diagnosed with a PACI, went on to rehabilitation. Those diagnosed with a POCI had a fairly even split in terms of going home or rehabilitation, and suggests that for this type of diagnosis, the decision to go on to rehabilitation will likely depend on individual factors.
38

Figure 18: Stroke type and FIM 1 total score
0%
5%
10%
15%
20%
25%
30%
35%
40%
45%
1 - 20 21 - 30 31 - 40 41 - 50 51 - 60 61 - 70 71 - 80 81 - 90 91 -100
101 -110
111 -120
121 -126
Total FIM score
% C
ases
LACI PACI POCI TACI TIA HAEM
NOTE: LACI = Lacunar Infarct; PACI = Partial Anterior Circulation Infarct; POCI = Posterior Circulation Infarct; TACI = Total Anterior Circulation Infarct; TIA = Transient Ischaemic Attack; Haem = Haemorrhage Stroke; FIM 1 = FIM score within 48 hours of admission to acute care. Participants who were diagnosed with a TACI or HAEM had lower overall FIM scores indicating a low level of independent functioning (See Figure 18). Those diagnosed with a TIA had the highest overall FIM scores. Those diagnosed with a PACI generally had scores less than 70, while those diagnosed with a POCI had a wide range of scores from 21 to 126. Approximately 21% of FIM One total scores were below 60, while around 63% of scores were within the range of 61 to 110. Figure 19: Stroke type and FIM 1 Item G score
0%
10%
20%
30%
40%
50%
60%
70%
1=Total assist(0%)
2=Max assist(25%)
3=Mod assist(50%)
4=Min assist(75%)
5=Supv'n 6=Modifiedindep
7=Completeindep
% C
ases
LACI PACI POCI TACI TIA HAEM
NOTE: LACI =Lacunar Infarct; PACI = Partial Anterior Circulation Infarct; POCI = Posterior Circulation Infarct; TACI = Total Anterior Circulation Infarct; Haem = Haemorrhage Stroke.
39
Figure 19 above indicates that those diagnosed with a TIA had the highest bladder management scores indicating that they were able to manage bladder tasks with at the least, supervision (Item G score = 5). In contrast, those diagnosed with a TACI or HAEM were severely impaired in their ability to manage their bladder. Forty three percent of those diagnosed with a PACI were at a level of total assist with Bladder Management after their stroke, while an equal amount were at a level of modified independence, where they required equipment to manage such as a urinal bottle, use of a pad or some other type of continence device. Overall, just 17% of those who had a stroke were at a level of complete independence within 48 hours of being diagnosed with a stroke. Figure 20: Stroke type and FIM 1 Item F score
0%
10%
20%
30%
40%
50%
60%
70%
80%
90%
100%
1=Totalassist (0%)
3=Modassist (50%)
5=Supv'n 7=Completeindep
% C
ases
LACI PACI POCI TACI TIA HAEM
NOTE: LACI =Lacunar Infarct; PACI = Partial Anterior Circulation Infarct; POCI = Posterior Circulation Infarct; TACI = Total Anterior Circulation Infarct; Haem = Haemorrhage Stroke. Figure 20 indicates that a large proportion of those diagnosed with a TACI or HAEM stroke, were most likely to score low on Item F (toileting). Those diagnosed with TIA had higher scores on average. PACI, POCI and LACI outcomes varied for different individuals.
40

Inferential Statistics FIM reliability Reliability analysis of the FIM instrument as a whole using Cronbach’s alpha on the current sample (n=65) is very high at 0.97. Within Groups Analysis For the sample discharged home after their stay in acute care, differences in their scores for Item G (Bladder Functioning) on the FIM were examined using the non-parametric technique marginal homogeneity. Before this analysis was conducted 7 participants in this sample were removed due to the intervention having not been completed during their stay in acute care. A further 3 had incomplete data and were also excluded from further statistical analysis (N=28). In the CRS group five participants were omitted from the original CRS sample due to the intervention having not being completed, and a further one participant who was readmitted to acute care due to complications, was also omitted from this analysis (n=19). Consistent with the original numbers obtained for the CRS group, the total sample size for the RS group was therefore slightly higher at (n=24). Within groups analysis – FIM total scores Current Rehabilitation Sample (CRS) A Friedman test was used to determine if the differences in scores across the three times were significant. Results indicate that there was a significant difference in FIM total scores across the three times χ2 (2, N 19) = .34.10, p < .05. Retrospective Group (RS) The Wilcoxin signed-rank test was used to determine if there were any differences between FIM total scores on admission to rehabilitation and discharge from, for the RS. The results indicate a significant difference exists between scores at each time z = -4.28, p <.05 with scores significantly higher on discharge as would be expected. Home Group The Wilcoxin signed-rank test was used once again to determine if there were any significant differences in scores across time for the group who were discharged home. Results indicate z = -4.45, p <.05 meaning that scores were significantly higher at time two (two weeks following discharge from acute care). Within groups analysis – FIM Item G scores Comparison of scores for Item G on admission to acute care (FIM 1 / time 1) and two weeks following discharge (FIM 2 / time 2), were analysed using Marginal Homogeneity (MH). The results of this analysis are presented below in Table 16.
41
Table 16: Results of Marginal Homogeneity Analysis on FIM Item G according to discharge destination Group Mean MH
Statistic Std. Deviation of MH Statistic
Std. MH Statistic Sig. (2-tailed)
Home 1G and 2G 96.5 4.72 -3.50 0.00
CRS FIM 1G and 2G
72.5 6.02 -3.57 0
CRS FIM 2G and 3G
54 2.23 -2.23 0.02
RS FIM 2G and 3G
62.5 4.92 -3.15 0.00
Note: CRS = Current Rehabilitation Sample; RS = Retrospective Sample Table 16 indicates that all of the samples have statistically significant differences in the distribution of scores at each time or measurement for each group. This result is consistent with the descriptives above, which also suggest improvements in the mean score over time. Between Groups Analysis Table 17: Descriptives for between groups analysis – CRS and RS
FIM1 tot FIM2 tot FIM2 tot FIM3 tot FIM3 tot CRS CRS RS CRS RS N 19 19 24 19 24 Mean 68.05 93.15 83.29 111.47 105.83 Median 65.00 94.00 83.50 115.00 112.50 Std. Deviation 22.34 13.72 18.03 11.85 15.02 Variance 499.16 188.25 324.91 140.59 225.54 Skewness -0.11 -0.61 0.08 -1.85 -0.95 Kurtosis -0.24 0.13 -0.05 3.60 -0.19 Range 84.00 52.00 73.00 47.00 53.00 Minimum 25.00 61.00 50.00 76.00 73.00 Maximum 109.00 113.00 123.00 123.00 126.00 Percentiles 25th 53.00 80 72.00 109.00 93.25 50th 65.00 94.00 83.50 115.00 112.50 75th 89.00 102.00 95.75 119.00 117.50 NOTE: CRS = Current rehabilitation sample; RS= Retrospective sample; Table 17 presents the sample descriptives for the statistical analysis. As would be expected, those who went to rehabilitation had on average lower scores upon admission to acute care (FIM 1Item G). At time two (FIM 2: admission to rehabilitation) for the RS and CRS, the mean Item G score was slightly higher for the CRS than for the RS. In addition, the 50th percentile for the CRS was a score of 6, while for the RS this was 5.5. This may have been due to the intervention. Mean and median scores for FIM 2 total and FIM 3 total were slightly higher for the CRS group in the sample for analysis.
42

Between groups analysis in RS and CRS for FIM 2 and 3 total scores The sample did not meet the stringent requirements of a parametric test; therefore a non-parametric alternative, the Median test, was used to examine differences in the median between the two groups. This test was chosen to assess the two groups rather than the Kruskal-Wallis, as it is statistically more powerful. The results of the test are presented in Table 18 below. Table 18: Frequency of scores below and above the median FIM Group
CRS RS Fim2 total > Median 13 8
<= Median 6 16 Fim3 total > Median 11 10
<= Median 8 14 The median test indicated that there was a significant difference between the median scores in the CRS and RS groups at FIM 2 χ2 (1, N=43) = 5.22, p <.05. In examining the frequency table, it is evident that the CRS group for FIM 2, have significantly more scores higher than the median, than the RS group. Between groups analysis in RS and CRS for FIM Item G (Bladder Management) FIM 2 Item G This was assessed using Chi-square analysis. The scores were allocated into one of two categories for analysis. A score of 1 was given for scores between 1 and 5 (varying levels of assistance required with bladder management tasks), and a score of 2 was given to those with an original score of 6 or 7 (no assistance required by others) for Item G. This enabled a Chi-square analysis to be completed with an adequate sample size. Table 19 below presents the cell frequencies. The table indicates that for the CSR group, a larger proportion of participants (84%) had a higher level of bladder functioning upon admission to rehabilitation, than those in the RS group (58%). However, the Chi-square analysis demonstrated that this was almost at a statistically significant level χ2 (1, N =43) = 3.36, p = .06 Table 19: Cell frequencies for Chi-square analysis of FIM 2 Item by Group (CRS vs. RS)
CRS RS TOTAL Count 1 (1-5 FIM score) 3 (16%) 10 (42%) 13 Expected Count 5.7 7.3 13 Count 2 (6-7 FIM score) 16 (84%) 14 (58%) 30 Expected Count 13.3 16.7 30 Count (TOTAL) 19 24 43 Expected Count 19 24 43
43

FIM 3 Item G Table 20: Cell frequencies for Chi-square analysis of FIM 3 Item G by Group (CRS vs. RS)
CRS RS Total Count (1-5 FIM score) 6 (29%) 7 (29%) 13 Expected Count 6.1 6.9 13 Count (6-7 FIM score) 15 (71%) 17 (71%) 32 Expected Count 14.9 17.1 32 Count (TOTAL) 21 24 45 Expected Count 21 24 45 This was again assessed using Chi-square analysis. It was expected that scores at this time would not differ, due to patients having to be at a certain level of functioning to enable them to be discharged from rehabilitation. To enable chi-square analysis of FIM 2 Item G, different categories were established. The scores were allocated into one of two different categories for analysis. A score of 1 was given for scores between 1 and 6 (varying levels of assistance required with bladder management tasks OR a device), and a score of 2 was given to those with a score of 7 (Complete independence) for Item G. The categories reflect the improvement that should be evident at FIM three. Examination of Table 20 indicates that at time three (FIM 3) Item G scores of 7 (complete independence) were equal for both CSR and RS groups. Therefore as expected, the Chi-square demonstrated there were no differences between the groups on FIM 3 Item G scores χ2 (1, N =43) = .04, p = .83. Table 21: Cell frequencies for Chi-square analysis of FIM 2 Item F (Toileting) by Group (CRS vs. RS) Item F CRS RS TOTAL Count 1 (1-5 FIM score) 9 (47%) 20 (83%) 29 Expected Count 12.8 16.2 29 Count 2 (6-7 FIM score) 10 (53%) 4 (17%) 14 Expected Count 6.2 7.8 14 Count (TOTAL) 19 24 43 Expected Count 19 24 43 FIM Item F (toileting) gives an indication of the individual’s ability to maintain hygiene and adjust clothing whether using a toilet or bedpan. A score of 6 or 7 is reflective of a person who does not require a helper with these tasks when going to the toilet. As indicated by Table 18 above, over half of the CRS who went on to rehabilitation were able to perform toileting tasks without assistance. This is in contrast to the RS where only 17% were at this level of functioning at FIM 2. A chi-square analysis was performed on the data indicating that there is a relationship between FIM score Item F and group χ2 (1, N =43) = 6.24, p = .01. The data in Table 21 above suggests that CRS had significantly more, higher scores than those in the RS.
44

Discussion This study examined the impact of an acute comprehensive assessment and intervention for urinary incontinence in a group of stroke patients. Differences across time for both those who were discharged to rehabilitation and home were examined separately. Firstly, the difference in Item G scores across time for both those that were discharged home, and those that went on to rehabilitation, were statistically significant. This suggests that there was significant improvement across time in continence status. While improvement is expected, it should be noted that it is not known to what extent this improvement would be without the intervention in place. However in favour of the BBCIA used for the current research sample, 59% of participants were discharged home from acute care. Furthermore, 85% of participants in the current sample at FIM 2 scored a 6 (modified independence) or a 7 (complete independence). In support of the BBCIA, the findings also revealed that on average for the rehabilitation groups, those that were in the current sample and had undergone the intervention had consistently higher total FIM scores across time than those in the RS Specifically, 57% of scores in the CRS group were above 91, while just 33% from the RS were above 91. Moreover, the Median test indicated that there was a significant difference between the overall FIM median scores for the two groups. The CRS (Current Rehabilitation Sample) had higher median scores than those in the RS (Rehabilitation Sample). This may indicate that the intervention was successful in improving urinary incontinence in CRS while in the acute setting. It is at this point where the result should be most evident as to whether or not the BBCIA was effective, as this FIM assessment follows the intervention. This result is consistent with Barer (1989) who stated that UI specifically, has been identified as a major factor influencing the functional recovery of patients experiencing stroke. While a Chi-square analysis did not reveal a significant difference between the CRS and RS groups on Item G scores at FIM 2 and FIM 3. It should be noted that for FIM 2 (admission to rehabilitation), 76% of participants in the CRS group scored either a 6 (device required for bladder management) or a 7 (completely independent). In comparison, just 58% from the RS group managed to obtain a score of 6 or 7 at FIM 2. This indicates that even though there was not a statistically significant difference, the CRS groups had more participants scoring higher at FIM 2, and therefore suggests that the intervention may have been successful at reducing incontinence. Just 15% of the whole sample at FIM 2 scored a 5 or below on item G, as compared to 51% at FIM 1, which suggests continence levels improved noticeably over time; this is supported by the data, which shows that improvement for each of the groups over time was significant. This finding is consistent with the literature, which hints that earlier intervention may improve outcomes in those patients with incontinence (Gross, 2000; Chan, 1997). In further support of the BBCIA, there were almost twice as many participants in the CRS who had pre-existing incontinence compared to the RS, which may have resulted in decreased scores for Item G in those participants, and therefore influencing the level of significance. Additional support for the BBCIA comes from the results for FIM 2 Item F (Toileting). In comparing both the CRS and RS results statistically significant differences were found between the two groups, suggesting that many more participants from the CRS were able to independently complete toileting tasks without assistance, upon admission to rehabilitation. Taken together, the results of FIM 2 total scores and Items F and G suggest that the BBCIA may have
45

contributed to a reduction in urinary incontinence as seen through the higher levels of functioning exhibited consistently. Differences at FIM 3 were not apparent, with both groups having the same amount of participants scoring a 7 upon discharge. This was expected, as to be able to leave the rehabilitation facility participants generally would have to be functioning at a high level. Stroke type and outcome Consistent with the definitions provided by Lindsay and Bone (2004), stroke outcomes for Haem and TACI for the sample were overall poor. For PACI and POCI, some went on to rehabilitation, which is consistent with the varied outcomes expected from these two diagnoses. In these circumstances, rehabilitation decisions may be more based on individual factors. All those diagnosed with TIA were discharged home. It would appear that those with poorer outcomes are most likely to stay in acute care for a longer period of time, and require rehabilitation. Length of Stay In comparing the length of stay for the two groups (CRS vs. RS) there were no apparent differences during the acute phase. Although the CRS group tended to stay longer in rehabilitation, this was no more than a week on average. There are a number of potential explanations for this. Firstly, it may be that staffing levels or access to allied health staff has differed across time, or participants had to wait for modifications to be made to their homes or carers to be arranged before they were discharged. In contrast, those participants in the RS group may have been faced with limited beds, and therefore were sent home earlier with supports. Age In terms of age group, those that are younger at the time of their stroke had higher FIM scores on admission, and were typically able to make a more successful recovery. In addition, the sample descriptives indicated that those in the younger age groups were less likely to have pre-existing problems with incontinence. From age 71 to 91, there was an apparent increase in the number of participants with incontinence before stroke. It was also evident from the results that the incidence of stroke increased with age. Results also suggest that those in the older age groups were more likely to go to rehabilitation. This is likely due to the natural decline in physical and mental ability in old age, potentially made more severe by the occurrence of a stroke. Pre-existing incontinence Slightly more of those with existing incontinence problems were discharged to rehabilitation. Worth noting is that almost twice the amount of participants in the current sample had PI in comparison to the RS (approximately one third of the sample had pre-existing incontinence). This may have impacted on the results of the Item G analysis, not being at a statistically significant level. It may be useful for similar research in the future to use a matched sample, to eliminate its potential as a confounding factor on the results. In relation to gender, it was found that there were more females than males with PI. This is consistent with research that suggests females are most likely to have incontinence problems rather than men (Newman, 2004). Incontinence and gender Examination of results for Item G and gender indicates that there were three times as many females with complete independence at FIM 1 than there were males. However, there were also almost twice as many females as males scoring a 1 (total assistance) within 48 hours of admission to acute care. This shows a large degree of variation
46

among women in continence levels. The results suggest that men tended to score higher on bladder functioning, yet were less likely than females to have a complete level of independence within 48 hours of admission to the acute unit. It is possible that this was due to the severity and type of stroke being experienced rather than a gender specific difference. In examining the descriptive data, it also appears that in the CRS and RS groups discharged to rehabilitation included more females in the older age range (81 to 91) compared to males. This suggests that more females are having strokes at an older age than males. Potentially, this may mean that there are fewer females able to be discharged home after a stroke because they have no at-home carer. Or it may be that females have outlived their male partners. The data indicates that there were more than twice as many males in the age group 81 to 85 discharged home compared to females. Having several urinary incontinent patients in an acute setting at once, are typically regarded by nurses, as stressful and time consuming. It is suggested that assessment of UI patients in acute care is flagged by inadequacies in knowledge, as demonstrated by the use of diapers as a frequent intervention (Conner & Kooker, 1996). Consistent with this research, assessment and interventions suggested on the BBCIA were not always followed by nurses. Anecdotal discussion with several nurses on the unit suggest knowledge and beliefs surrounding continence management may have been lacking, as well as the perception that there is a lack of time to complete the documentation, even though the BBCIA was a tick box exercise. Earlier research by Cheater (1993) also found that UI is underreported and not always documented accurately in patient records. This is consistent with our experiences in collecting the RS data in particular. Evident at times in medical histories were contradictory notes relating to patient incontinence status. In turn, these attitudes, lack of knowledge and insufficient documentation are likely to be contributing to some inadequacies in management and care of patients experiencing UI. However, results do suggest an improvement in patient level of functioning and continence in the current study. Issues encountered during the project life span Recruitment Initially, recruitment was to be completed within the first 48 hours of admission to the research unit so that the assessment and intervention also occurred within this time frame. However, this became a problem due to both the time constraint and ability to speak to the person or their close relative within such a short time frame of the trauma occurring. We were able to change the procedure due to the rollout of the assessment and intervention form in the research unit where the project was being conducted, enabling recruitment to occur any time after the stroke. Recruitment was far more time consuming than originally expected. It was difficult to find a suitable time to obtain informed consent from potential participants due to their allied health appointments and medical rounds. It meant having to be in the research unit more frequently to ensure adequate numbers of participants. Follow-up At times it became difficult to follow up participants two weeks post their hospital stay. Some were unable to be contacted within a reasonable time frame after discharge, and therefore there FIM results are unable to be used for data analysis. Completion of the assessment / intervention forms There were some problems with the completion of the assessment and intervention forms by nurses. The intervention component was not completed for many
47

participants, while in some cases the assessment and intervention as a whole were not completed at all. Some evaluative research involving interviews with nurses on the ward regarding their thoughts on the BBCIA revealed that this was due to a number of factors including: • lack of understanding of the assessment / intervention form; • lack of knowledge surrounding incontinence; • lack of knowledge surrounding incontinence interventions; • cultural issues, such as a beliefs and attitudes that continence issues are “normal
when you get older and there is nothing that can be done about it”; and • nurses were hesitant to ask doctors or other medical staff to perform interventions
when required Limitations in sample There is potentially some bias in the sample due to the following: • all participants were stoke patients at a regional hospital, who were admitted to
research unit; • not all stroke patients were approached to take part in the study due to brief
hospital stays and time constraints of the research grant; and • some potential participants were unable to be recruited to age restrictions in the
sample of below 30 years of age, and above 95 years of age. It was deemed that these extremes of age might have skewed the results.
Sample size The sample size was limited due the following factors: • the assessment and intervention was not completed for some participants, and
therefore their results could not be used; • some participants were unable to be contacted for follow up FIM scores once they
were discharged home; • there was a gastroenteritis outbreak on the unit where stroke patients were
admitted, during the recruitment phase. This meant that for two to three weeks, recruitment had to cease and interventions were not always completed for a number of weeks following this (approximately 3 weeks); and
• some participant’s who were initially diagnosed with a stroke, were found to have a different medical diagnosis after further medical examination.
FIM scoring accuracy There is some concern over the accuracy of the FIM scores obtained in the RS. In collating this sample, there were some inconsistencies in FIM scoring compared to nursing records of what the patients’ level of functioning and incontinence status was. In terms of FIM scoring, there is uncertainty about when refresher training for medical staff has been provided, which if this has been lengthy, potentially may have influenced the accuracy of the scoring. This finding is consistent with Cheater (1993) who also found inconsistencies in recording of incontinence information in her retrospective research.
48

Conclusions / Achievement of Objectives
o To identify the impact of an acute comprehensive continence assessment and implementation of associated interventions on continence outcomes for incontinent stroke patients.
Overall The acute comprehensive continence assessment and interventions provided favourable results for the groups involved. A statistical analysis of the results indicated that FIM 2 Total scores for the current sample that went on to rehabilitation (CRS) were significantly higher than those in the Retrospective sample (RS). This suggests that the assessment and intervention may have contributed to the higher scores. In support of this it was found that over half the participants in the sample, were discharged home (59%) after acute care. Furthermore, 85% of participants in the current sample at FIM 2 (following the interventions) scored a 6 (modified independence) or a 7 (complete independence), which indicates a person is having no accidents and is therefore continent. Home Group A significant proportion (59%) of the sample diagnosed with a stroke, were discharged home after a brief stay on average of seven days. The FIM 2 total scores (2 weeks after discharge from acute care) were on average 120 out of a possible 126, which is a very positive outcome and suggests a high level of independent functioning. In particular, the average FIM Item G score (Bladder Management) at FIM 1 (within 48 hours of admission to acute care) was 5, with scores ranging from 1 to 7. This suggests that there was still a great amount of variation in continence levels upon admission. In comparison, the average score for FIM 2 Item G (two weeks after discharge) was 6.7, with a range of score being only a 6 or 7. This was a significant improvement in scores over time and suggests that potentially the acute assessment and interventions may have played a part in this result. Current Rehabilitation Sample (CRS) and Retrospective Sample (RS) A total of 19 participants formed the CRS group and 24 from RS. The CRS group received the intervention, while the RS were a control group who received no specific intervention. These participants were examined to determine if there were any statistically significant differences between both groups FIM scores on admission to rehabilitation. On admission to acute care (FIM 1) the CRS group had an average FIM total score of 64.4 out of a possible 126. The RS sample did not have FIM scores assessed when they were admitted to acute care, so this is unable to be compared. Upon admission to rehabilitation the FIM 2 total score on average for CRS was 93.1, with a median of 94. For the RS group, this was 83.2, with a median of 83. This difference was found to be statistically significant at a level of (<.05) indicating that in the CRS group of participants who underwent the intervention and significantly higher scores on admission to rehabilitation, compared to a retrospective control group. This suggests that the assessment and interventions during acute care may have played some part in the results. For FIM 2 Item G (bladder management) the median score for the CRS group was 5.8 with a median of 6, while for the RS group 5.2 with a median of 5.5. The CRS group, therefore have a slightly better score on FIM2 Item G (Bladder management) than the RS group. Further examination of the data revealed that many more participants from
49

the CRS had higher median scores than those in the RS group. A median test however, revealed that this was almost at a statistically significant level. Analysis of FIM item F (toileting) between the two groups revealed that the groups were significantly different in scores. Examination of the scores revealed that the CRS group had overall higher levels of functioning on this item. This is consistent with research, which suggests that a lower level of functioning is associated with incontinence (Taub, 1994;Patel, 2001). Taken together, the results for FIM 2 total and FIM 2 item F and G scores, suggests that the assessment and interventions may have played some part in the results. As previous research has suggested incontinence is an indicator of poor outcome after stroke, and the results imply that overall the level of functioning was higher in the CRS group at FIM 2 (as indicated by the total FIM score and item F), and incontinence scores as assessed by FIM item G were on average higher than those in the RS. Average FIM 3 total score for the CRS group was 111.4 with a median of 115, while for the RS group; this was 105.8, with a median of 112. Although the scores for the CRS group were higher, this was not found to be at a statistically significant level. This result is somewhat anticipated, due to the expectation that patients need to be at a certain level of functioning before they are discharged. More specifically, FIM 3 Item G (bladder management) average scores for the two groups were 6.4 for CRS and 6.5 for RS, both with a median of 7. Clearly these scores are very similar and therefore were not statistically significant.
o To address a gap in the research, pertaining to assessment and interventions for incontinent stroke patients.
The BBCIA chart used in the current study, was at its most fundamental, successful at increasing awareness about incontinence care and management in stroke patients for nurses on the Acute Unit; however adjustments are required to assist with clarity. Anecdotal discussion with a number of nurses in the unit resulted in a number of suggestions for amendments to be made, to ensure a more user-friendly and effective tool for nurses and patients. The BBCIA chart during the project period was a trial medical record (MR) form for the hospital involved. It has since been developed further to reflect current knowledge and incorporate suggestions from both other professionals in the area, and nurses using the tool. The BBCIA chart with several modifications, is currently an MR form for the hospital involved, however amendments will continue to be made according to research findings and practical knowledge.
o To identify the usefulness of the FIM as a guide for the rehabilitation process. FIM scoring was introduced as standard practice / care in the acute unit where the research was conducted, just prior to the commencement of this project and is conducted as a team effort on the unit involved. The scoring has provided information on the severity of the stroke in terms of the persons’ level of functioning, and their level of care needs (dependence vs. independence). FIM scoring also assists medical staff in determining stroke type and gives an indication of which parts of the brain have been affected. It can provide very useful information for allied health staff, in particular, it may be useful to determine whether disability aids are required to be fitted in a persons home before they return; for example a shower or toilet rail, or a walking frame. In addition, the FIM score is certainly a useful comparison measure to assess the individual’s progress from when they began, to their current state of functioning.
50

o To provide a basis for further research to be conducted to validate the findings.
The research could be replicated with a refined version of the BBCIA chart. In addition, we believe other aspects of stroke management should be assessed, such as nurse’s knowledge surrounding continence, the cultural norms and beliefs surrounding continence care, and the impact this has on nurse’s care. In interviewing some of the nurses involved about their experiences with the BBCIA and their implicit knowledge surrounding continence, it is evident that these areas are having an impact on the care of stroke patients. In addition, it appears that the chart in its current form needs some further clarification in terms of wording and on-going evaluation to ensure it is consistent with current knowledge and practices in the area of continence care. It appears that the BBCIA chart had some impact on the results obtained in the current study. Specifically, those who were discharged home and those who went to rehabilitation had significantly higher scores on Item G (Bladder Management) of the FIM across time. In comparing the two groups from the CRS and the RS, the CRS had a consistently higher mean and median at scoring time FIM 1 and FIM 2. In addition, the median test found that the level of difference in the median total FIM scores between the groups was at a statistically significant level. This result suggests that the intervention (BBCIA) was likely to have contributed to this positive result. In comparing CRS and RS scores on Item G at FIM 2, it was apparent that the CRS group had a larger portion of scores above the median. However, statistical analysis did not support this at a significant level. It should be noted that the CRS group had proportionally almost twice as many participants with PI than the RS group, as well as overall less time in acute care. This may have influenced the results enough to ensure that the amount of difference between the results obtained was not at a statistically significant level. It is therefore likely that the assessment and interventions using the BBCIA chart has improved the level of continence in participants. A further study should use a matched sample to rule out the above confounding factors. Further research needs to be conducted to validate and extend the findings of the current study with a larger sample.
51

Recommendations and future research suggestions
1. On-going development and refinement of the BBCIA to ensure its clarity and relevance to care. In addition, the chart should continue to reflect current knowledge and practice in the area of continence care for people diagnosed with stroke. This would be best done through collaboration, possibly through a working party between all relevant stakeholders including specialists in the area of stroke such as consultants, rehabilitation specialists, nurses and allied health staff. This would ensure the chart is relevant, easy to use and provides useful information as well as improved outcomes for incontinent patients. It may be useful for the chart to specify which types of interventions are most beneficial for the different types of incontinence, through examining the literature in the area.
2. Ongoing and thorough education surrounding both incontinence care, and
correct use of the BBCIA for nurses working with stroke patients is needed and should be put into place if the chart is to be continued to be used without amendments. In addition, ensure support and knowledge of continence care initiatives by all who work with stroke patients, including doctors and allied health staff. This assists with collaboration among all levels of staff and areas of expertise. This could be done through educational seminars, workshops, or guest speakers to attend meetings.
3. Further research should again examine the BBCIA (after amendments have
been made) and take into account continence knowledge and culture. A future study should examine the use of the BBCIA and the impact of current levels of knowledge surrounding continence, and determine the cultural norms and beliefs held by nurses, which are influencing continence care. From this, educational needs (such as a cultural change program) can be determined which will aim to challenge negative beliefs, and reinforce the positive ones. In addition, the research would also provide information surrounding education needs of nurses relating to continence care, and where this needs to be directed. Potentially, a trial could be conducted where a group of nurses receives training, and a control group do not. An assessment of knowledge, attitudes and beliefs could then be ascertained for each group and compared. Following this, the group who did not receive training, could receive training and then the assessment of knowledge, attitudes and beliefs could again be taken and compared to the pre-education responses. The information could then be used to determine what educational needs are most appropriate in terms of both the BBCIA and incontinence in general. Finally, education programs such as workshops, guest speakers at meetings, or information booklets could all be effective ways of disseminating the information.
4. Prospective research should also examine and incorporate the incidence of
discharge destination (% home, % rehabilitation) as an outcome measure for successful assessment and interventions for incontinence.
5. The study provides evidence of a need for a continence advisor in both the
hospital setting and rehabilitation. After a continence assessment potentially using the BBCIA, it would useful for those who are identified as having continence issues, to be referred on to someone who is regarded as a
52

specialist in this area, to ensure that the most appropriate interventions are made and ongoing care is provided. This is likely to encourage collaboration between nurses and the continence advisor, and in the process nurses may gain further insight surrounding incontinence.
53

References
Bamford, J., Sandercock, P., Dennis, M., Burn, J., Warlow, C. (1991). Classification
and natural history of clinically identifiable subtypes of cerebral infarction. The
Lancet, 337, 1521-1526.
Barer, D.H. (1989). Continence after stroke: Useful predictor or goal of therapy. Age
and Ageing, 18, 183-191.
Bean, J.F., Kiely, D.K., Cairns, K.D., & Morris, J.N. (2003). Influence of poststroke
urinary incontinence on disability: the nursing home setting. American Journal
of Physical and Medical Rehabilitation, 82, (3), 175-181.
Booth, J., Hillier, V.F., Waters, K.W., Davidson, I. (2005). Effects of stroke
rehabilitation education programme for nurses. Journal of Advanced Nursing,
49, (5), 465-473.
Borrie, M.J., Campbell, A.J., Caradoc-Davies, T.H., & Spears, G.F.S. (1986). Urinary
incontinence after stroke: A prospective study. Age and Ageing, 15, 177-181.
Brittain, K.R., Peet, S.M., & Castleden, C.M. (1998). Stroke and incontinence. Stroke,
29, 524-528.
Brocklehurst, J.C., Andrews, K., Richards, B., & Laycock, P.J. (1985). Incidence and
correlates of incontinence in stroke patients. Journal of the American Geriatric
Society, 33, 540-542.
Brooks, W. (2004). The use of practice guidelines for urinary incontinence following
stroke. British Journal of Nursing, 13, (20), 1176-1179.
Castleden, C.M., Duffin, H.M., Asher, M.J., & Yeomanson, C.W. (1985). Factors in
influencing outcome in elderly patients with urinary incontinence and detrusor
instability. Age and Ageing, 14, 303-307.
Chan, H. (1997). Bladder management in acute care of stroke patients: A quality
improvement project. Journal of Neuroscience Nursing, 29, 187-190.
54

Cheater, F.M. (1993). Retrospective document survey: identification, assessment and
management of urinary incontinence in medical and care of the elderly wards.
Journal of Advanced Nursing, 18, 1734-1746.
Commonwealth Department of Health and Aged Care. (2001). National continence
management strategy – information booklet on the strategy.
Connor, P.A., & Kooker, B.K. (1996). Nurses knowledge, attitudes, and practices in
managing urinary incontinence in the acute care setting. Medisurgical Nursing,
5, (2), 87-117.
Cooper, G., & Watt, E. (2003). An exploration of acute care nurses’ approach to
assessment and management of people with urinary incontinence. Journal of
Wound Ostomy and Continence Nursing, 30, 305-313.
Department of Health and Ageing. (2005). Continence. Retrieved 1st June, 2005 from
http://www.health.gov.au/internet/wcms/Publishing.nsf/Content/Continence-2
Dodds, T.A., Martin, D.P., Stolov, W.C., & Deyo, R.A. (1993). A validation of the
functional independence measure and its performance among rehabilitation
inpatients. Archives of Physical and Medical Rehabilitation, 74, 531-536.
Gelber, D.A., Good, D.C., Laven, L.J., Verhulst, S.J. (1993). Causes of urinary
incontinence after acute hemispheric stroke. Stroke, 24, 378-382.
Gross, J.C. (1998). A comparison of the characteristics of incontinent and continent
stroke patients in a rehabilitation program. Rehabilitation Nursing, 23, 132-140.
Gross, J.C. (2000). Urinary incontinence and stroke outcomes. Archives of Physical
Medicine and Rehabilitation, 81, 22-27.
Hankey, G.J., Jamrozik, K., Broadhurst, R.J., Burvill, P.W., Anderson, C.S., &
Stewart-Wynne, E.G. (2000). Five-year survival after first ever stroke and
related prognostic factors in the Perth community stroke study. Stroke, 31, (9),
2080-2086.
55

Jawad, S.H., Ward, A.B., & Jones, P. (1999). Study of the relationship between
premorbid urinary incontinence and stroke functional outcome. Clinical
Rehabilitation, 13, 447-452.
Keith, R.A., Granger, C.V., Hamilton, B.B., Sherwin, F.S. (1987). The functional
independence measure: A new tool for rehabilitation. Advances in Clinical
Rehabilitation, 1, 6-18.
Lindsay, K.W., & Bone, I. (2004). Neurology and neurosurgery illustrated. (4th ed.).
London: Churchill Livingstone.
Meins, W., Meier-Baumgartner, H.P., Neetz, D., & von Renteln-Kruse, W. (2001).
Predictors of favourable outcome in elderly stroke patients two years after
discharge from geriatric rehabilitation. Gerontology, 34, 395-400.
National Stroke Foundation (2005). Statistics for stroke incidence. Retrieved May 10th,
2005 from http://www.strokefoundation.com.au
Newman, D.K. (2004). Report of a mail survey of women with bladder control
disorders. Urologic Nursing, 24, (6), 499-506.
Olsen-Vetland, P. (2003). Urinary incontinence after cerebrovascular accident.
Nursing Standard, 17, (39), 37-41.
Owen, D.C., Getz, P.A., & Bulla, K. (1995). A comparison of characteristics of patients
with completed stroke: those who achieve continence and those who do not.
Rehabilitation Nursing, 20, 197-203.
Patel, M., Coshall, C., Lawrence, E., Rudd, A.G., & Wolfe, C.D.A. (2001). Recovery
from poststroke urinary incontinence: Associated factors and impact on
outcome. Journal of the American Geriatrics Society, 49, 1229-1233.
Patel, M., Coshall, C., Rudd, A.G., Wolfe, C.D.A. (2001). Natural history and effects
on 2-year outcomes of urinary incontinence after stroke. Stroke, 32, 122-127.
56

Stineman, M.G., Shea, J.A., Jette, A., Tassoni, C.J., Ottenbacher, K.J., Fiedler, R., &
Granger, C.V. (1996). The functional independence measure: Tests of scaling
assumptions, structure and reliability across twenty diverse impairment
categories. Archives of Physical Medicine and Rehabilitation, 77, 1101-1108.
Taub, N.A., Wolfe, C.D.A., Richardson, R.G.N., & Burney, P.G.J. (1994). Predicting
the disability of first-time stroke sufferers at 1 year. Stroke, 25, 352-357.
Thommessen, B., Bautz-Holter, E., & Laake, K. (1999). Predictors of outcome of
rehabilitation of elderly stroke patients in a geriatric ward. Clinical
Rehabilitation, 13, (2), 123-128.
Torenbeck, M., Caulfield, B., Garret, M., Van Harten, W. (2001). Current use of
outcome measures for stroke and low back pain rehabilitation in five European
countries: first results of the ACROSS project. International Journal of
Rehabilitation Research, 24, 95-101.
van Kuijk, A.A., van Der Linde, H., van Limbeek, J. (2001). Urinary incontinence in
stroke patients after admission to a postacute inpatient rehabilitation program.
Archives of Physical Medicine and Rehabilitation, 82, 1407-1411.
Wade, D.T., & Hewer, R.L. (1985). Outlook after an acute stroke: Urinary incontinence
and loss of consciousness compared in 532 patients. Quarterly Journal of
Medicine, 56, 601-608.
Wade, D.T., Wood, V.A., & Hewer, R.L. (1985). Recovery after stroke – the first three
months. Journal of Neurology, Neurosurgery and Psychiatry, 48, 7-13.
Wikander, B., Ekelund, P., & Milsom, I. (1998). An evaluation of multidisciplinary
intervention governed by functional independence measure (FIM) in
incontinent stroke patients. Scandinavian Journal of Rehabilitative Medicine,
30, 15-21.
57

List of Abbreviations General FIM Functional Independence Measure BBCIA Bladder & Bowel Continence Initial Assessment CRS Current rehabilitation sample RS Retrospective (Rehabilitation) sample Rehab Rehabilitation UI Urinary Incontinence FIM 1 FIM score taken within 48 hours of admission to acute care FIM 2 FIM score taken either two weeks after discharge from acute
Care, (if discharge destination is home) OR upon admission to rehabilitation (sub-acute)
FIM 3 FIM score taken upon discharge from rehabilitation (sub-acute) LOS Length of Stay DEC Deceased TOT Total ST D Standard Deviation Skew Skewness Med Median FIM Item G Bladder Management FIM Item F Toileting PI Pre-existing Incontinence Stroke types LACI Lacunar Infarct – outcome usually good TACI Total Anterior Circulation Infarct – outcome usually poor PACI Partial Anterior Circulation Infarct – outcome is varied POCI Posterior Circulation Infarct – outcome is varied
58

TIA Transient Ischaemic Attack – symptoms resolve in 24 hours HAEM Haemorrhage Stroke – outcome usually poor FIM Item scoring Max Assist Maximum assistance Mod Assist Moderate assistance Min Assist Minimal assistance Supv’n Supervision Modified indep Modified independence Complete indep Complete independence
59

Appendix A: FIM (Functional Independence
Measure) Data Collection Sheet
TOTAL (FIM)
Q. Problem Solving
R. Memory
P. Social Interaction
Social Cognition O. Expression
N. Comprehension
Communication
L. Walk / wheel chair
Locomotion
M. Stairs
K. Bath, shower
J. Toilet
I. Bed, chair, w/chair
Mobility H. Bowel G. Bladder Sphincter F. Toileting
E.Dressing – lower D Dressing – upper C. Bathing
B Grooming
A. Feeding
Self Care
Date Discharge or 4 weeks (Sub-acute)
Date Admission Sub-acute or home (2 weeks)
Date Admission (Acute)
April 04 Version 2
Independence (No helper) 7 Complete Independence (Timely, Safely) 6 Modified Independence (Device) Modified dependence (Helper required) 5 Supervision 4 Minimal Assist (Person @ 75%+) 3 Moderate Assist (Person @ 50%+) Complete dependence (Helper essential) 2 Maximal Assist (Person @ 25%+) 1 Total Assist (Person @ 0%+)
Comments:………………………………………………………………………………………… Name:……………………………………………………………………………………………… Signature:…………………………………………………………………………………………..
60

Appendix B: Bladder and Bowel Continence Initial Assessment
Urinary Continence Yes No
Does the patient wear a pad?
Is there evidence of wet clothing or bedding?
Is their leakage/ dribbling when coughing, laughing, sneezing, lifting or exercising? (Please circle)
Does the person have nocturia, frequency, urgency, diminished stream? (Please circle)
Does the people have difficulty mobilising or with manual dexterity related to toileting?
Does the person’s cognitive ability affect toileting?
Faecal Continence
Is there evidence of soiled clothing or bedding?
Does the person seem unaware of the urge to use bowels?
Does the person strain, have pain or feel “blocked” when using their bowels?
Does the person have to use their bowels urgently?
Does the patient feel as though their bowel is not empty when finished?
Does the person use manual methods to aid bowel emptying?
NAME & SIGNATURE: ……………………………………. DATE: …. ……………….. TIME: …..………
ACTION: If you have answered yes to any of the above questions continue with steps 1 to 9 below and record findings/actions in MR14:
Yes (tick)
No Date
1. Ensure patient has access to toilet or call bell and that cognition, mobility & functional needs have been assessed and care needs recorded on Nursing Care Plan.
2. DIP - Ensure that a ward urinalysis has been done and record abnormalities in MR14. Collect MSU if nitrates are evident & report to RMO.
3. FEEL - Record last bowel action, if unsure or BNO 3 days commence a bowel chart & refer to RMO. Request RMO to perform physical and / or PR examination & medication review. RMO to consider urology/gynaecology referral. Comment:
4. SCAN - Perform post void bladder scan, record on MR14 and report residual of above 200ml to RMO. Consider rescan, intermittent catheter or IDC for 5 days & trial of void – discuss options with Medical Team Comment:
5. Refer patient to pharmacist and Dietician if required.
6. Record input and output on FBC and/or commence a 3 day Void and Bowel chart
7. Provide patient and carer education and information on resources.
8. Referral to Home Referral Service for Continence Service, Continence Nurse, Domiciliary Nursing for post discharge care.
9. Refer to RMO to ensure information on continence status and management is contained in the discharge summary.
©
61

Appendix B: Consent Principal Investigator Dr. Barbara Hanna, Deakin University
Co-investigators Ms. Christie Fullarton, Deakin University
Ms. Bernadine Charles, Ms. Peta Hocking and Dr. Michael Bennet, Barwon Health, Nicole Lowry, Deakin University
This Participant Information and Consent Form is 4 pages long. Please make sure you have all the pages. This following contains detailed information to assist you in deciding whether or not you would like to take part. Please read this Participant Information carefully. Feel free to ask questions about any information in the document. You may also wish to discuss the project with a relative or friend. Feel free to do this.
You are invited to take part in a research study titled: An exploration of early intervention for continence management following stroke to minimise long term disability.
The purpose of this project is to find out whether an early assessment and appropriate care of incontinent (leakage of urine from the bladder) stroke patients in an acute setting, (hospital) will lead to improved continence (reducing the leakage of urine from the bladder) over time.
Previous experience has shown that many people become incontinent, following a stroke. Research has indicated that incontinence following a stroke leads to the person being less able to do things for themselves, and a reduced chance of a successful recovery. Aside from this, incontinence can be very distressing due to a loss of independence and quality of life. Current research has hinted that early assessment and appropriate care of incontinence may contribute to improved continence outcomes in stroke patients. The current proposed research would assist us to see whether this may be the case.
Your participation in this study involves allowing the researchers access to details about yourself including, gender, age, date of birth, length of stay, continence issues and an assessment of how the stroke affects you will have been made and recorded in your notes, and will also be collected. If you go home, as a part of current care, you will be phoned to check on your progress two weeks after being discharged from the acute unit. If you go to a nursing home or rehabilitation unit, we will continue to monitor your progress, through your medical record at your destination. Please be aware that if you consent to being a participant, you do not have to do anything additional, and all of the information required is accessible by viewing your medical records. If you choose to take part in this study, any information we obtain about you from medical records will remain strictly confidential, and will only be used for the purpose of this research project. Specific information collected from medical records will be age, gender, duration of stay in hospital, location and severity of stroke and prior incontinence. The recording of your medical details for the purposes of the study will involve your name being replaced with a code, to maintain your anonymity. Our
62

records will be stored in a locked cupboard at Deakin University, and will be destroyed after a 7-year period. The results of the study will be submitted for publication in professional journals, but no names will be included. We will send you a summary of the findings of this research if you are interested in receiving them. There are no possible risks from your participation in this study. However, there are possible benefits to both yourself and incontinent stroke patients in the future. This may include an increase in the level of continence, resulting in less dependence on others for assistance. Should you find you have any issues arising from the conduct of the research, the researchers can provide you with clarification of information. Please phone the principal researcher. While I encourage you to participate, please be aware that participation is voluntary and you have the right to withdraw at any time, or not to answer questions if you do not wish to. If you choose not to participate in the study it will in no way affect the health care you receive. By signing the Consent Form, you indicate that you understand the information and that you give your consent to participate in the research project. You will be given a copy of the Participant Information and Consent Form to keep as a record.
Your Rights This study has been jointly reviewed by the Human Research Ethics Committees of Deakin University and Hospital X. If you have any complaints about any aspect of the project, the way it is being conducted or any questions about your rights as a research participant, then you may contact
Deakin University Hospital X Name: Position: Secretary, Ethics Committee,
Telephone:
Name: Position: Ethics Committee Secretary,
Hospital
Telephone:
You will need to tell the contact the name of one of the researchers given in the first section of this document.
63

RESEARCH INFORMED CONSENT FORM
In partnership with Deakin University
Consent Form
Full Project Title: An exploration of early intervention for continence management following stroke to minimise long term disability I have read, or have had read to me in my first language, and I understand the Participant Information. I have been given the opportunity to ask questions regarding the study, and any questions that I have asked were answered to my satisfaction.
I freely agree to participate in this project according to the conditions in the Participant Information.
I will be given/offered a copy of this the Participant Information and Consent form to keep
I understand that the researcher has agreed not to reveal my identity and personal details if information about this project is published or presented in any public form.
Participants name (printed)…………………………………………………………………..
…………………………………………. ……../……/…….
Signature of Participant: Date:
Name of Witness to participant’s signature (printed) ………………………………………………
Signature:…………………………………………….. Date:…..…./………../……….
64

Would you like a copy of the study report sent to you?
□ Yes □ No
If yes, please provide your address
………………………………………………………………………………………………………………………………………………………………………….Postcode………………………..
DECLARATION BY Researcher: I have given a verbal explanation of the research project, its procedures and risks and I believe that the participant has understood that explanation. Researchers name (printed):……………………………………………………………………… ……………………………………………… ……./……./…… Signature Date A senior member of the research team must provide the explanation and the provision of information concerning the research project NOTE: All parties signing the Consent form must date their own signature.
65