Embed Size (px)
Citation preview
June 2006 Volume XVI Number 2
AN EXPLORATION OFDEFINITION AND PROCEDURAL
FLUENCY ININTEGRAL CALCULUS
Todd A. Grundmeier , Jennifer Hansen , and Emily Sousa
ADDRESS: Department of Mathematics, California Polyt echn ic St ateUniversity, San Luis Obispo CA 93407 USA. t g r undme@c a lpol y . edu.
ABSTRACT: A survey was administered to calculus students who hadpr eviously been exposed to a course on integral calc ulus. T he pur poseof t he survey was to explore st udents ' understanding of the definit ion of a definite integra l, t hei r abilit ies to evaluate definite integrals ,and their gra phica l interpret ations of definite integrals. The analysisof par ti cipants ' survey responses developed insight into their conceptions of integration. Survey results sugges t that understanding thedefiniti on of a definite integral did not imply pro cedural fluency andthat these students did not make connect ions between defini t ions andprocedures in integral calculus.
KEYWORDS: Calculus, integration , procedural fluency, conceptual understandi ng.
INTRODUCTION
In Jan Bezuidenhout 's [1] paper , First-year Uni versi ty Students' Understanding of Rate of Change, he poses the questions: "Do calculus st udentsin general achieve the desired level of understanding? Do these st udentsdevelop reliable intui ti ve ideas and the mathematical competence ... to findcounter-examples, to use the meaning of concepts to ana lyze problem situat ions, to penetrate from the sur face to the central idea and to expressthemselves in clear and conc ise mathematical lan guage?" [1, p . 378] Theseinquiries were not the resul t of a new concern. For some t ime, mathemati cs
178
Grundmeier , Hansen, and Sousa Definition and Procedural Fluency
educators have been concerned that calculus students may not be developinga clear concept ua l understanding of the mathematical content of calculus[1]. Past st udies have shown that there is often a gap in what st udentsshould take from their calculus classes, and what they actually take fromthem [1, 2, 3]. Studies suggest that students' abilities to conduct routinestandard procedures (commonly as a product of memorization) are oftenmistaken for conceptua l understanding of the underlying concepts [1, 2, 3].
In an attempt to both understand st udents' conceptions of calculus andoffer suggestions to bridge the gap in their procedural and conceptua l underst anding several st ud ies have been conducted on st udents ' understandingof calculus in general, as well as on specific areas of calculus such as limits, deriva tives, and integrals [1, 2, 3]. The common goa l of these st udieswas to determine if students have specific cognit ive obstacles to conceptua lunderstanding of calculus, and if so what they might be, in the hope thateducators aware of these obstacles might be better able to recognize andad dress them in their teaching.
Bezuid enh ou t [2] concludes that much of what first-year calculus st udents know about limi ts, continuity, and derivatives is based on distinctfacts , and that few st ude nts have been able to dr aw connections or see relati onships between the ideas. Furtherm ore, it is likely that as st udentsenter calc ulus courses at the college level, after having been exposed to theconcepts of limi t and cont inuity, their knowledge of these ideas may not besufficient to allow them to successfully understand the ideas of differentiat ion and int egration.
In a 1998 st udy Bezuid enhout concluded that severa l students had developed fun dam ental misconcepti ons, in addit ion to having false intuitionabout ideas of differentiati on . Specifically, a number of st udents revealedthro ugh tests and interviews that there was a common confusion aboutideas of average rate of cha nge, average value of a cont inuous functi on , andarithmetic mean. For exa mple Bezuid enhout concluded that st udents wereunder the assumption that average rate of cha nge is calculated by findin gvalues of the derivative function. He also found that several students had atendency to relate average rate of cha nge to the famili ar idea of arithmet icmean (average) . Moreover , he stressed tha t the level of concern for thisconfusion should be high , as misconceptions of the elementary ideas of calculus can lead to more deep-rooted probl ems as st udents progress in theirst udies.
The Role of Definitions in the Teaching and Learning of Mathematics,by Shlomo Vinner [5] describ es the differences between a "concept definition" and a "concept image" and the implicati ons that the formation of
179
June 2006 Volume XVI Number 2
each have on underst anding new mathemat ical concepts . Vinner considers "concept definition" as that which can be wri t ten or spoken by thelearner and "concept image" as that which is perceived by the learner ofthe mathematical idea. Vinner describ es two "cells" in our minds for eachconcept, one for the concept definition and one for the concept image. Hestates that in technical thinking, st udents are expected to refer to the concept definit ion to help solve problems and perform tasks, but in practi cethe intuiti ve response is to first refer to the concept image. There can bedisagreements between the definition and image for any given concept andt he image and/or definit ion may vary from situation to sit uation. Vinner believes such disagreements and discrepancies may be the cause of the"erroneous principles" that Bezuid enhout [1] found to be so resistant tocorrect ion in the students he observed.
Several years prior to Bezuidenhout 's studies, Orton [3] published astudy on students' understanding of int egration and also found disagreements in st udents' concept definitions and images. Like Bezuid enhout, Orto n was suspicious that alt hough st udents may be able to accurate ly carryout integration pro cedures, they may not have a real understanding, orprop erly developed concept image, of the pro cess. In an attempt to reveal and sup port his claims, Orton carr ied out a cross-sectiona l st udy on110 calc ulus st udents from Britain , ages 16-22 . Each st udent par ticipatedin two one-hour interview sessions where they were presented wit h variousintegration- related tasks.
Orton concluded that the main difficulty among these st udents arisesfrom their lack of understanding of int egration as the limi t of sums . Hepoin ts out that many st udents had serious difficulti es with tasks in this area,and st resses that the st udents may be better abl e to gras p these imp or tantsteps if mathemati cs educators, when int roducing the idea of integration ,focused more on the basic concept (determining the area under a curve as alim it of est imations) rather tha n on routine int egration meant for obtainingthe answers to simple applications.
Bezuid enhout [2] and Orton [3] both look to methods of teaching as apossible cause for the lack of underst anding among students. Bezuidenhout[2] claims that much misunderst anding
. .. may be mainly due to a learning and teaching approach thatemphasizes to a large extent the procedural aspects of the calculus, and neglect s a solid grounding in the understanding ofthe conceptual underpinnings of the calculus. Moreover , thestereotyped exercises that are a feature of several calculus textsoften encourage an instrumental approach, ra ther than a rela-
180
Grundmeier, Hansen, and Sousa Definition and Procedural Fluency
tional understanding of calculus concepts. Taking into accountthe procedure-oriented nature of some calculus texts, it shouldnot be considered as strange if a student confuses manipulativeskills with a real understanding of calculus content [2, p. 498].
Orton stresses that "ru les without reason cannot be justified" and thatit is necessary for educators to lay a solid foundation in limits and differentiation before tackling ideas of integration.
All of the work above except for Orton's focused on students' conceptions of differential calculus. This suggests a further need to explore students' understanding of integral calculus with the hope of identifying possible misconceptions and suggesting how these misconceptions may be addressed through mathematics instruction. Therefore, using similar methodsto Bezuidenhout and Orton, this study explored and offers an interpretation of students' understanding of integration. This exploration was accomplished by surveying calculus students who had previously taken a calculusclass that covered the theory and techniques of integration. The experimentand results are discussed in detail below.
EXPERIMENT
The following survey was completed by 52 students who had taken a calculusclass that covered the theory and techniques of integration. The survey wasdesigned to examine participants' understanding of integration using fivecriteria:
a) interpreting and representing the meaning of integration in words,
b) defining a definite integral using mathematical symbols,
c) interpreting and representing the meaning of integration graphically,
d) evaluating integrals, and
e) recognizing applications of integration in the real world.
Survey responses to each question were divided into researcher-developedcategories that exhausted all answers given. For example, in analyzing answers from question 2, in the first set of 4, researchers first determined allcorrect verbal definitions of a definite integral. The remaining 34 responseswere categorized individually until all responses fit in a category that hadbeen developed. Each of these 34 responses included some concept of area,suggested that a definite integral was equivalent to an anti-derivative, focused on the idea of an infinite sum, mentioned a bounded quantity, or wasblank.
181
June 2006 Volume XVI Number 2
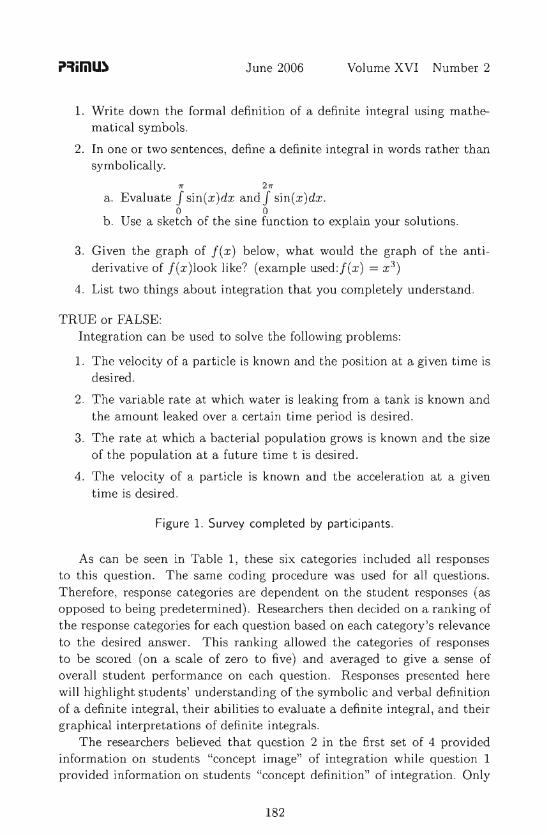
1. Wri te dow n the formal definit ion of a definit e integral using mathematical symbols.
2. In one or two sentences, define a definite integral in words rather thansymbolica lly.
7'( 27'(
a . Evaluate Jsin(x)dx an d J sin(x)dx.o 0
b. Use a sketc h of the sine function to explain your solutions.
3. Given the gra ph of f (x ) below, what would the gra ph of the ant iderivative of f (x )look like? (exa mple used:f(x ) = x 3 )
4. List two things ab ou t integration that you complete ly underst and.
TRUE or FALSE:Integration can be used to solve the following problems:
1. The velocity of a particle is known and the position at a given time isdesired.
2. The variable rate at which water is leaking from a tank is known andt he amount leaked over a certain t ime period is desired .
3. The rate at which a bacterial population grows is known and the sizeof the populat ion at a fut ure t ime t is desired.
4. T he velocity of a part icle is known and the acceleration at a givent ime is desired.
Figure 1. Survey completed by participants.
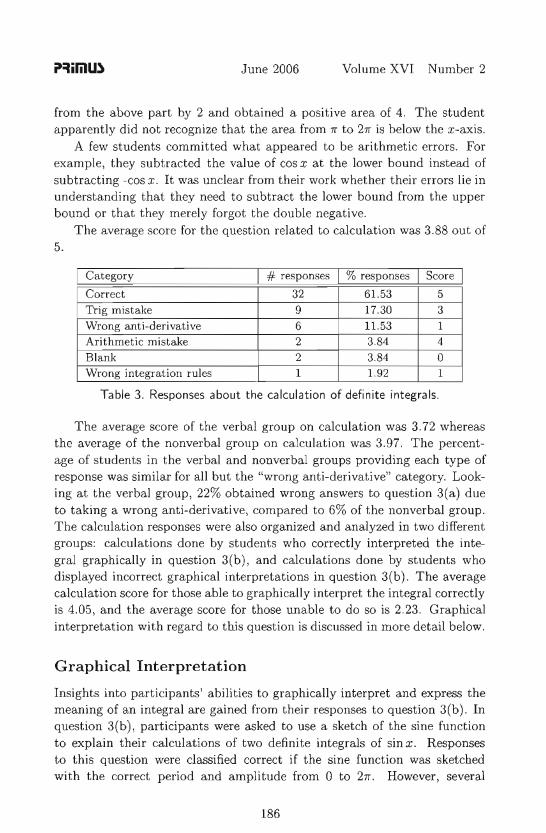
As can be seen in Table 1, t hese six categor ies included all responsesto this question. The same coding pro cedure was used for all questi ons.Therefore, response categories are depend ent on th e student responses (asopposed to being predet ermined ). Researchers then decided on a ra nking ofthe response categories for each questi on bas ed on each category's relevanceto the desired answer . This ranking allowed the categories of responsesto be scored (on a scal e of zero to five) and averaged to give a sense ofovera ll st udent performance on each question. Responses pr esented herewill highli ght students' understanding of the symbolic and verb al definitionof a definit e integral , t heir abilit ies to evaluate a definite integral , and theirgra phica l interpret ations of definite integrals.
The researchers believed that question 2 in the first set of 4 providedinformation on st udents "concept image" of integration while questi on 1provid ed informati on on students "concept definition" of integration. Onl y
182
Grundmeier , Hansen , and Sousa Definition and Procedural Fluency
one st udent answered question 1 correctly, so the researchers decided tocompare t he responses of st udents who provided a correct verbal definition(verbal group) and st udents who did not provide a correct verbal definitionof a definite int egral (nonverba l group) rather than compare th e resp onsesof groups divided by the symbolic definitions provided . For all questionsexcept number 2 in the first 4, the average score of the 18 st udents in theverbal group was computed and compared to the average score of the 34st udents in the nonverbal gro up. Because of this choice of organization ofthe data , results related to the verbal definit ion will be presented first.
Also, to assist in analysis of the relationship between calculation andgraphical abilit ies, the calc ulation responses to quest ion 3(a) of the 40 st udents who correctly graphed responses to questi on 3(b) were singled out.Average calculat ion scores for the students who provided correct graphs andincorrect gra phs were calculated and compared.
RESULTS
Verbal D efinition
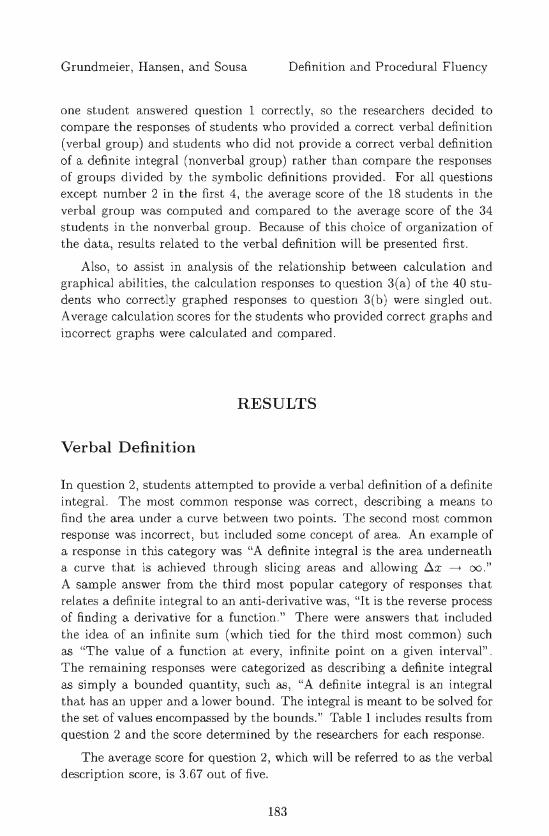
In question 2, students attempted to provide a verbal definition of a definiteint egral. The most common response was correc t, describing a means tofind the area under a cur ve between two points. The second most commonresponse was incorrect , bu t included some concept of area. An example ofa resp onse in this category was "A definite int egral is the area underneatha curve that is achieved through slicing areas and allowing ~x -> 00."
A sample answer from t he third most popular category of responses thatrelates a definite integral to an an ti-derivative was , "It is the reverse processof findin g a derivative for a function ." There were answers that includedthe idea of an infinite sum (which ti ed for the third most common) suchas "T he value of a function at every, infinite point on a given interval" .The remaining responses were categorized as describin g a definite integralas simply a bounded qu an tity, such as, "A definite int egral is an integralthat has an upper and a lower bound. The int egral is meant to be solved forthe set of valu es encompassed by the bounds." Table 1 includes results fromquesti on 2 and the score determined by the researchers for each response.
The average score for question 2, which will be referred to as the verbaldescripti on score, is 3.67 out of five.
183
June 2006 Volume XVI Number 2
I Category I # responses I % responses I Score ICorrect 18 34.6 1 5Some concept of area 17 32.69 4Integral equivalent to anti-derivative 5 9.6 1 3Idea of an infinite sum 5 9.61 3
Blank 4 7.69 0A bounded quantity 3 5.76 1
Table 1. Responses about verbal definitions of a definite integral.
Symbolic Definition
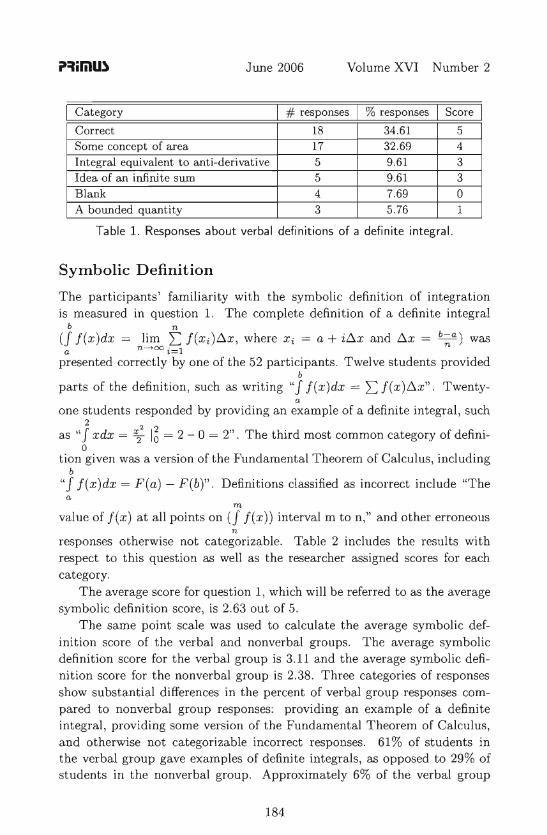
The participants ' famil iarity with the symbolic definition of int egrationis measured in question 1. The complete definition of a definite integra l
b n
(J j (x )dx = lim I.= j (Xi )6.x , where Xi = a + i6.x and 6.x = b:;;a ) wasa n --+ (X) i= l
presented correc tly by one of th e 52 participants. Twelve students providedb
par ts of the definition, such as writing "J j (x )dx = I.= j (x )6.x" . Twenty-a
one st udents responded by providing an example of a definite integral , such2 2
as "Jxdx = x2 I~ = 2 - 0 = 2" . The third most common category of definio
tio n given was a version of the Fundam ental Theorem of Calculus , includingb
"J j (x )dx = F (a) - F (b)" . Definit ions class ified as incorrect include "T hea
m
value of j (x ) at all points on (J j (x )) int erval m to n," and ot her erroneousn
respo nses ot herwise not catego rizable. Tabl e 2 includes the resul ts withresp ect to this questi on as well as the researcher assigned scores for eachcategory.
The average score for question 1, which will be referred to as the avera gesymbolic definition score, is 2.63 out of 5.
The same point sca le was used to calculate the average symbolic definition score of the verbal and nonverbal groups. T he average symbolicdefinition score for the verbal group is 3.11 and the average symbolic definition score for the nonverbal group is 2.38. T hree catego ries of respo nsesshow substant ial differences in the percent of verbal group responses compared to nonverbal group responses: providing an example of a definiteintegral , providing some version of the Fundamental Theorem of Calculus,and ot herwise not categorizable incorrect responses. 61% of students inthe verbal gro up gave examples of definite integrals, as opposed to 29% ofst ude nts in the nonverb al group. App roximately 6% of the verbal group
184
Grundmeier, Hansen, and Sousa Definition and Procedural F luency
provided some version of the Fundamental Theorem of Calculus, comparedto 24% of the nonverbal group. Finally, no student in the verbal gro up gaveunrecognizably incorrect answers, whereas 17% of students in the nonverbalgroup did.
I Category I # responses I % responses I Score ICorrect definit ion 1 1.92 5Some components of the correct defi- 12 23.07 4nit ionExample of a definite integral 21 40.38 3Some version of the fundamental the- 9 17.30 2orem of calculusDefinition of derivative 3 5.76 1Incorrect 6 11.53 0
Table 2. Responses about the symbolic definition of a definite integral.
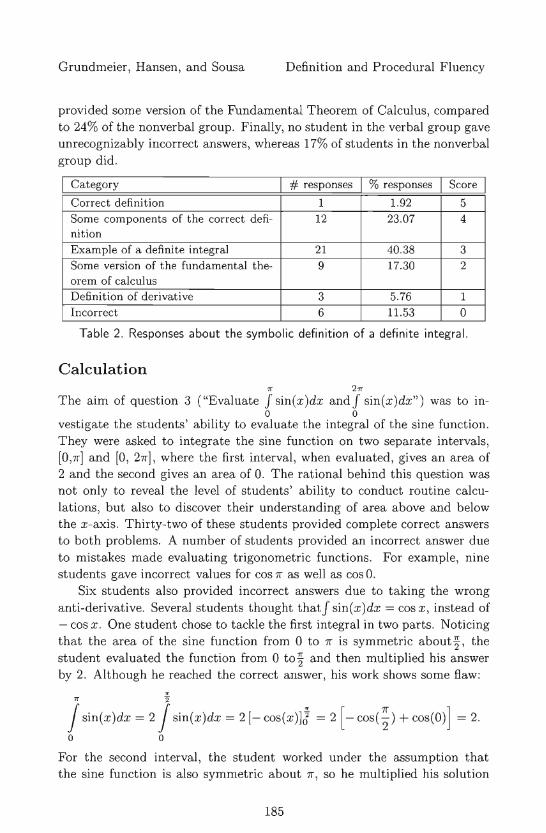
Calculation71" 271"
The aim of question 3 ("Evaluate Jsin(x)dx andJ sin(x)dx") was to in-a a
vestigate the st udents ' ability to evaluate the integral of the sine function .They were asked to integrate the sine function on two separate intervals,[O,n] and [0, 2n], where the first interval , when evaluated, gives an area of2 and the second gives an area of O. The rational behind this question wasnot only to reveal the level of st udents' ab ility to cond uct rout ine calculations, but also to discover their understanding of area above and belowthe x-axis. Thirty-two of these students provided complete correct answersto both problems. A number of students provided an incorrect answer dueto mistakes made evaluating trigonometric functions . For example, ninestudents gave incorrect values for cos n as well as cos O.
Six students also provided incorr ect answers due to taking the wronganti-derivative. Several students thought thatJ sin(x)dx = cos x , instead of- cos x. One student chose to tackle the first integral in two parts. Noticingthat the area of the sine function from 0 to n is symmetric about~, thestudent evaluated the function from 0 to~ an d then multiplied his answerby 2. Although he reached the correct answer, his work shows some flaw:
7r ~Jsin(x)dx = 2Jsin(x)dx = 2 [- cos(x)]! = 2 [- cos( ~) + cos(O)] = 2.
a a
For the second interval, the st udent worked under the assumption thatthe sine function is also symmetric about n, so he mu ltiplied his solution
185
June 2006 Volume XVI Number 2
from the above part by 2 and obtained a positive area of 4. T he st udentapparent ly did not recog nize that the area from 7r to 27r is below the x-axis.
A few st udents commit ted what appeared to be arit hmet ic errors. Forexample, t hey subt racted the value of cos x at the lower bound instead ofsubt racting -cos x . It was unclear from their work whether their errors lie inunderstanding that they need to subtract t he lower bound from the upperbound or t hat they mer ely forgot the double negati ve.
The average score for the question related to ca lculation was 3.88 out of5.
I # res po nses I % responses I Scor e ICorrect 32 61.53 5Trig mistake 9 17.30 3Wr ong ant i-derivative 6 11.53 1Arithmet ic mist ake 2 3.84 4Blank 2 3.84 0Wrong int egrati on rul es 1 1.92 1
I Category
Table 3. Responses about the calculation of definite integrals .
The average score of the verbal group on calculation was 3.72 whereasthe average of the nonverbal group on calculation was 3.97. The percentage of students in the verbal and nonverb al groups pr oviding each ty pe ofresponse was similar for all but the "wrong ant i-derivative" category. Looking at the verb al group, 22% obtained wrong answers to question 3(a ) dueto taking a wron g ant i-derivative, compared to 6% of the nonverb al group.The calculat ion responses were also organi zed and an alyzed in two differentgroups: ca lcula t ions done by students who correctly interpreted the integral graphica lly in questi on 3(b ), and ca lculat ions done by students whodisplayed incorrect gra phica l interpretations in question 3(b ). The averagecalculation score for those able to graphically interpret the integ ral correctlyis 4.05, and the avera ge score for those unable to do so is 2.23. Graphicalinterpretation with regard to this questi on is discussed in more det ail below.
Graphical Interpretation
Insights into participants ' abilities to graphically interpret and express themeaning of an integral are gained from their responses to question 3(b). Inquestion 3(b) , parti cipants were asked to use a sketch of the sine functionto explain their calculations of two definite integrals of sin x . Responsesto this question were classified correct if the sine function was sketchedwith the correct period and amplit ude from 0 to 27r . However , several
186
Grundmeier , Hansen , and Sousa Definition and Procedural Fluency
student s who sketched, sha ded and lab eled the sketches correctly calculatedthe integrals incorrectly and were un abl e to recognize the discrepan cies intheir responses. For exa mple, a student sketched , lab eled and shaded the
11'
area beneath the sine curve from 0 to 7r but calculated Jsin(x)dx to bea
1 (instead of 2), alt hough the sketch dr awn clearl y shows the valu e mustbe more than 1, as the shaded region is mor e tha n half the area in therectangle with verti ces (0,0), (0,1), (7r , 0) and (7r , 1). The st udent includedthe followin g explanation in the response, indi cating that the mistake went
11'
undetected: "For Jsin(x )dx , t he solut ion came out to be 1. By lookin g ata
the gra ph of sin(x), the sha ded region under the function is ind eed equa l tothe 1 also."
Sketches of the wrong function includ ed sketches of the cosine fun ction,the negative cosine function and unrecognizabl e functions tha t seemed tocombine the sine and cosine functions. Student s who dr ew these sketchesoft en calculated the integral correc t ly, bu t did not acknowledge the discrepancies between their numerical and gra phical responses. One such st udent
11' 211'
calculated Jsin(x )dx = 2 and J sin(x)dx = 0, bu t sketched the cosinea a
func ti on and shaded first the area from 0 to 7r (which is 0, not 2) and thenthe area from 0 to 27r , which is 0 (as the area under the sine curve wouldcoincidentally also be).
Sketches of the sine function with an incorrect period showed the fun ction with half or twice the correct period (7r or 47r ). While some student savoided calculating and reported incorrect numerical valu es for the integrals that were consistent with their sketches, there were st ill some studentswho cont ra dicted themselves completely. For exa mple, a st udent calculated11' 211'
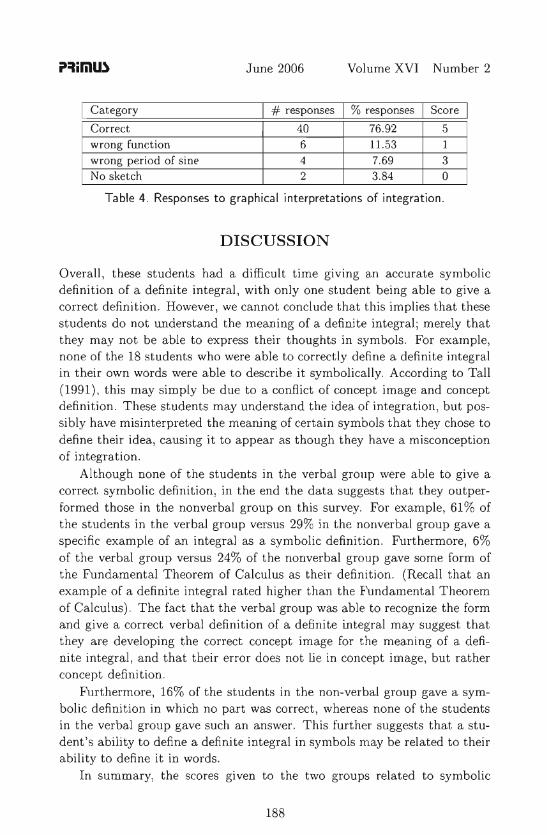
Jsin(x)dx = 0 and J sin(x)dx = - 2, but drew a graph of the first half of aa aperiod of the sine funct ion stretched from 0 to 27r . The student 's curve onlyshows sine to be 0 at x = 0 and x = 27r, and never shows negative valuesfor the sine fun cti on , contradict ing the valu es the student provides. Table 4 shows the classification of responses. The average score for graphicalinterpretati on of the sine functi on is 4.19 out of five.
Responses from student s in the verb al and nonverbal groups, shown inTabl e 4, are scored on the same sca le describ ed above and their averagesare 4.55 and 4.00, respectively. This difference in graphical int erpretationaverages can be attributed lar gely to the approximately 10% increase in thenumber of correct sketches, and the approximately 9% decrease in sketchesof the wrong fun ction between these two groups.
187
June 2006 Volume XVI Number 2
I # responses I % responses I Score ICorrect 40 76.92 5wrong function 6 11.53 1wrong period of sine 4 7.69 3No sketch 2 3.84 0
I Category
Table 4. Responses to graphica l interpretations of integration.
DISCUSSION
Overall, t hese students had a difficult time giving an accurate symbolicdefinition of a definite int egral , wit h only one student being ab le to give acorrec t definition. However , we cannot conclude that thi s implies that thesestudents do not understand th e meaning of a definite integral ; merely thatthey may not be ab le to express their thoughts in symbols . For example,none of th e 18 students who were ab le to correctly define a definite int egralin their own words were ab le to describe it symbolically . According to Tall(1991), this may simply be due to a conflict of concept image and conceptdefinition. These students may understand the idea of integration , bu t possibly have misinterpret ed the meaning of certain symbols that they chose todefine their idea , causing it to appear as though they have a misconceptionof integration.
Alth ough none of the st udents in the verbal group were able to give acorrect symbolic definition , in the end the data suggests that they outperformed those in the nonverbal group on this survey. For example, 61% ofthe st udents in the verbal group versus 29% in the nonverb al group gave aspecific exa mple of an integral as a symbolic definition. Fur th ermore, 6%of the verbal group versus 24% of the nonverbal group gave some form ofthe Fundam ental Theorem of Ca lculus as their definition . (Recall that anexample of a definit e integral rated higher than the Fundam ental Theoremof Calculus). The fact that the verbal group was ab le to recognize the formand give a correc t verbal definition of a definit e int egral may suggest thatthey are developing the correct concept image for th e meaning of a definite int egra l, and that their error does not lie in concept image, but ratherconcept definition.
Furthermore, 16% of the students in the non-verbal group gave a symbol ic definition in which no part was correct, whereas none of th e studentsin the verbal group gave such an answer. This fur ther suggests th at a student 's ability to define a definite int egral in symbols may be related to theirability to define it in words.
In summary, the scores given to the two groups related to symbolic
188
Grundmeier , Hansen , and Sousa Definition and Procedural Fluency
definition were notabl y different . The non-verbal group scored an averageof 2.38 on symbolic definition , while the verbal gro up scored an averageof 3.11 on symbolic definition. This data suggests that the ability to givea correct symbolic definition may depend on the ability to give a correctverbal definition ; however , the latter does not ensure the former .
Comparisons aside, overa ll this portion of the survey reveals a crit icalmisconcepti on among these st udents. The symbolic definition of a definiteintegral had never been complete ly learned by these st udents and only 35%of these st udents could give a correct verb al definition . Lacking a st rong understanding of the definition of integrals may caus e fur ther misconceptionsabout ideas in int egral calculus to arise.
The results related to the calculat ion of definit e int egrals suggest thatthese students are fairly comfortable with computing int egrals. Although alarge percentage of students (40%) made mistakes, only 13% of the studentsmade mist akes related to int egration. Furthermore, the maj ority (in factall bu t one) of those that commit ted integration errors simply neglectedto make cosine negative when int egrating sine. However , the st udent th atcommitted an integration erro r not related to an incorrect ant i-derivativeseems to be under a false impression that an area under the x-axis is positive.
Such a small number of integration mistakes might lead one to believethat these st udents understand integration. However , there were severalst ude nts who calculated quest ion 3 correctly, bu t could not give a correctsymbolic or verbal definit ion of what an integral is. Specifically, approximately 66% of the students who correctly evaluated the int egrals in questi on3 were not able to give a correct verb al definition of a definite integral. Thissuggests that these students may rely on memorization of methods in orderto find values of integrals, and are not fully aware of what it is they aredoing and why.
Or ton makes similar conclusions regarding a question on his survey involving calculat ion. Orton asked students to find the area under a givencurve (the equa t ion of the curve was supplied). A large number of thest udents evaluated the integral correctly. However, Orton commented ,".. . many students appeared to know what to do, but, when questionedabout their method, didn't really know why they were doing it. "
Overall , it does not appear that knowledge of the definition of a definite int egral affects a st udent 's ability to conduct routine int egration. Forexample, the average score on the calculat ion portion of the sur vey for thest udents in the verb al group was 3.72 , while the average score for those inthe nonverbal group was 3.97. The two groups were equa lly able to calculatet he integral , regardless of their ability to verbally define a definit e int egral.
189
June 2006 Volume XVI Number 2
For these students it seems that calculation ability may be related totheir ability to gra phica lly interpret an integral. T here is a substant ia l difference between the calculat ion scores of the students who displayed thisgra phica l ability (4.05) and those who did not (2.23) . However , t his doesnot necessarily imply that gra phica l ability affects the ability to calculate,or vice versa . The higher-scoring st udents may simply have a better overa llunderstanding of integrat ion , including evaluation and graphical representation. Another possibility is that the two abilit ies are correlated thro ughst udents ' recognit ion of their calculation errors. T he graphical ability mayprovid e st udents wit h a bet ter idea of what the numbers in their calculat ions signify, allowing them to at least recogn ize, and possibly correct t heirown mistakes. T his recognit ion is by no mean s universal in st udents whodemonstrated graphica l ability (Cl.'3 seen in quoted responses included in theresul ts) but does seem to be more prevalent in these st udents tha n in thosewho did not demonstrate graphical ability in question 3(b) on the survey.
CONCLUSION
T he participan ts in this exploratory st udy demonstrated a st rong understand ing of the calculation process in integral calc ulus, but lacked well developed concept defini tions an e! concept images of integrat ion. These resultssupport past research which suggests th at having knowl edge that a procedure resul ts in the correct answer does not imply an understanding of whythat procedure is correct . Part icipan ts could not symbo lica lly define a defini te integral , less than half could verbally define a definite integral , yetmore than 60% could correc t ly evaluate a defini te integral of a trigonometric function . So alt hough these st udents could not describe in symbols or intheir own words what a definite integral represents, t he majority could perform a routine ca lculation . This suggest th at t hese st udents are performingintegrati on as a pro cedure with limi ted understanding that they are findin gthe area under a curve an d that this ar ea is being found as a limi t of est imati ons for that area. Also, participants who could graphica lly represent thedefinit e integral presented on the survey had the highest average for abilityto calc ulate the integral.
These results suggest that if ins tructors do not focus on the definition(especia lly verbal) and gra phica l representations of definite integrals, manystudents may leave calc ulus with the ability to perform rout ine calculations(procedural fluency) bu t withou t a conceptual understanding of the pro cedures they are able to perform . Calculus instructors should be aware ofresults such as these and consider their implications for attaining the goa ls
190
Grundmeier, Hansen, and Sousa Definition and Procedural Fluency
of their courses as they prepare students for careers in science, mathematics,technology, and engineering.
REFERENCES
1. Bezuidenhout, Jan. 1998. First-Year University Students ' Understanding of Rate of Change. International Journal of Mathematical Education in Sci ence and Technology. 29:389-399 .
2. Bezuidenhout, Jan. 2001. Limits and Continuity: Some Conceptionsof First-Year Students. International Journal of Mathematical Educationin Science and Technology. 32: 487-500.
3. Orton, A. 1983. Students ' Understanding of Integrat ion. EducationalStudies in Mathematics. 14: 1-18 .
4. Tall, David. 1991. The Psychology of Advanced Mathematical Thinking. In David Tall (Ed.), Advanced Mathematical Thinking. pp. 3-21. London: Kluwer Academic Publishers.
5. Vinner, Shlomo . 1991. The Role of Definitions in the Teaching andLearning of Mathematics. In Dav id Tall (Ed.), Advanced Math ematicalThinking. pp . 65-81. London: Kluwer Academic Publishers.
BIOGRAPHICAL SKETCH
Todd Grundmeier is in his third year as an Assistant Professor of Mathematics at Cal Poly, his background is in mathematics education and hispast research has focused on problem posing with prospective elementaryand middle school teachers. Todd plans to continue to explore un iversitystudents understanding of calculus concepts, including integration.
Jennifer Hansen and Emily Sousa are 2005 graduates of Cal Poly mathematics department and our currently attending credential programs. BothJen and Emily plan to teach secondary school mathematics. This researchwas begun as their senior project work at Cal Poly.
191