Embed Size (px)
Citation preview
www.policyschool.ca
Volume 8 • Issue 38 • November 2015
† This paper is part of a three-part series on public infrastructure spending and financing in Canada, along with Optimal Public Infrastructure: Some guideposts to ensure we don’t overspend by Philip Bazel and Jack M. Mintz, and Striking the Right Balance: Federal Infrastructure Transfer Programs, 2002–2015 by Bev Dahlby and Emily Jackson.
* The authors wish to acknowledge the insight and helpful comments of Richard M. Bird and Enid Slack, as well as two anonymous referees.
AN EXPLORATION INTO THE MUNICIPAL CAPACITY TO FINANCE CAPITAL INFRASTRUCTURE†
Almos T. Tassonyi & Brian W. Conger*
SUMMARYMunicipal governments own and maintain two-thirds of Canada’s stock of public infrastructure. This burden is met by municipalities within the parameters afforded to them by their respective provinces. As a result, municipalities throughout the country rely on three primary revenue streams: issuing debt, financing from dedicated revenue and transfers from higher levels of government. At the same time, strict rules on borrowing, sometimes self-imposed, have left municipalities with considerable unrealized borrowing capacity. Importantly, a shift towards increased borrowing, away from a reliance on intergovernmental grants, would reinforce the linkage between local government spending and accountability and keep spending priorities in order.
This paper focuses on infrastructure spending in Alberta and Ontario to illuminate how municipalities in both provinces cope with demands to provide capital- and labour-intensive programs and services. In both provinces, transportation, environmental services and recreation and culture comprise the bulk of infrastructure expenditure.
In Ontario, as of 2013, 18 of the largest municipalities held assets valued at $111.8 billion. After accumulated depreciation, those assets are now estimated to be worth $73.8 billion, having lost $38 billion in value since their acquisition — although municipalities’ diligence varies. Mississauga has preserved 82.6 per cent of its assets’ original cost; Thunder Bay has only managed 45.6 per cent.
In Alberta, 21 of the largest municipalities held assets valued at $51.7 billion in 2013, although thanks to depreciation, their value is now estimated at $37.8 billion. Again, there is significant variability between municipalities, with Wood Buffalo having preserved 98.6 per cent of its assets’ original value, and Crowsnest Pass with 43.9 per cent. In both provinces, the older the municipality and the weaker its fiscal capacity, the lower the net book value of its capital assets.
While an ongoing nation-wide shift to modified accrual accounting has encouraged municipalities to plan long-term, the legacy of past decisions means that substantial underinvestment in infrastructure exists, and that the net book value of municipal assets is generally below the cost of their acquisition. Through an examination of municipal budgeting and the revenue-generating means at municipalities’ disposal, this paper argues that fiscal policy reform is essential, if municipalities are to serve Canadians to the best of their abilities.
1
Two-thirds of the stock of public infrastructure is owned and maintained by municipal governments in Canada.1 As a consequence, municipal governments play a key role in the selection, operation and financing of public infrastructure nationwide. Many have argued that the limited taxation and financing powers of municipal governments have hampered their ability to provide adequate infrastructure investments.2 They point to the long-term decline in urban infrastructure investment from the early 1960s to the mid-2000s that occurred prior to programs like A New Deal for Canada’s Communities, nestled in Budget 2005, that revived federal and provincial spending in this area. At the same time, the growing reliance on intergovernmental transfers (i.e., grants) has led to concerns that the link between local spending and local political accountability has been broken.3 In light of these concerns, and the growing importance of cities in the national agenda, this paper examines issues related to the capacity of municipal governments to finance adequate levels of public infrastructure. Taking a general look at municipalities across the country, with a focus on Ontario and Alberta, this paper discusses the framework within which municipalities make decisions to finance the acquisition of capital and the various sources of revenue available to them. While there is evidence that suggests municipalities could do more with available resources —whether through borrowing or realizing their tax room— capacity is not evenly distributed amongst municipalities in any given province, nor is their political will to fully utilize this capacity at the expense of maintaining some local fiscal flexibility. Overcoming the institutional reluctance of local decision-makers to adopt a more self-sustaining approach to financing local infrastructure needs will take time and effort.
DEFINING MUNICIPAL CAPITAL INFRASTRUCTURE
In 2009, municipalities throughout Canada implemented modified accrual accounting as the basis for financial reporting. Consequently, the definition of municipal infrastructure (aka tangible capital assets) has become more formalized, although the concept of municipal capital infrastructure has multiple facets. The Public Sector Accounting Board (PSAB), in PS 3150, defines tangible capital assets as non-financial assets having physical substance that: (i) are held for use in the production or supply of goods and services, for rental to others, for administrative purposes or for the development, construction, maintenance or repair of other tangible capital assets; (ii) have useful economic lives extending beyond an accounting period; (iii) are to be used on a continuing basis; and (iv) are not for sale in the ordinary course of operations.4
Based on this definition, municipal infrastructure includes items such as the development and purchase of land and buildings, rolling stock including vehicles and machinery, water and sewage systems, roadways, bridges, sidewalks, traffic lights and street lighting, landfill sites, furniture and office equipment and information technology. In general, the expenditure and financing decisions, as well as time series analysis of municipal fiscal decision-making, have
1 Philip Bazel and Jack Mintz, “The Free Ride is Over: Why Cities, and Citizens, Must Start Paying for Much-Needed Infrastructure,” The School of Public Policy Research Papers 7, no.14 (2014): 8.
2 For example see Federation of Canadian Municipalities, “Strengthening Canada Through Our Hometowns: FCM Budget 2015 Submission,” Federation of Canadian Municipalities (2015).
3 Jack Mintz, “Jack Mintz: Municipal Mythologies,” Financial Post, December 05, 2011.4 Public Sector Accounting Handbook, “Section 3150 - Tangible Capital Assets” accessed September 15, 2015 from:
http://www.municipalaffairs.gov.ab.ca/documents/ms/PSAB_3150_4_toolkit_full_document.pdf.
2
to recognize that the acquisition and construction of the assets, as well as furnishings, studies and all associated items to bring the facilities into operation, tend to be fiscally lumpy in nature. Further, the definition includes not just purchases but also major rehabilitation of the above, on the assumption that these assets normally have a useful life of more than one year. A more formal definition of capital cost is set out in Ontario’s Development Charges Act:5
The following are capital costs… if they are incurred or proposed to be incurred by a municipality or a local board directly or by others on behalf of, and as authorized by, a municipality or local board:1. Costs to acquire land or an interest in land, including a leasehold interest.2. Costs to improve land.3. Costs to acquire, lease, construct or improve buildings and structures.4. Costs to acquire, lease, construct or improve facilities including,
i. rolling stock with an estimated useful life of seven years or more,ii. furniture and equipment, other than computer equipment, andiii. materials acquired for circulation, reference or information purposes by a library
board as defined in the Public Libraries Act.5. Costs to undertake studies in connection with any of the matters referred to in paragraphs
1 to 4.6. Costs of the development charge background study required under section 10.7. Interest on money borrowed to pay for costs described in paragraphs 1 to 4.
1997, c. 27, s. 5 (3).
It should also be noted that the concept of municipal infrastructure encompasses both the flow of services from the physical facility and the stock of capital that actually generates the service flow. The former provides a nexus for the charging of fees (in most cases) to fund at least part of the costs of acquisition.6
MUNICIPAL RESPONSIBILITIES
Solving the issues surrounding the provision and financing of local infrastructure has been a perpetual feature of the Canadian public policy landscape. Senior levels of government have both aided and constrained local initiatives to finance capital investment, since Francis Hincks established the Municipal Loan Fund in 1850 as an imaginative way to tap local fiscal resources in the Province of Canada.7
In Canada, as in other federal systems, certain expenditure responsibilities and revenue sources have been assigned to local governments. This occurred as part of the constitutional bargaining
5 Ontario Development Charges Act, 1997 S.0. Chapter 27s.5(3)accessed September 15, 2015 from: http://www.ontario.ca/laws/statute/97d27.
6 James Alm, “Financing Urban Infrastructure: Knowns, Unknowns, and a Way Forward,” Journal of Economic Surveys 29, no.2 (2015): 232.
7 For more information see Richard M. Bird and Almos Tassonyi, “Constraining sub-national fiscal behavior in Canada: Different Approaches, similar results?,” in Fiscal Decentralization and the Challenge of Hard Budget Constraints, eds. Jonathan A. Rodden, Gunnar S. Eskeland and Jennie Litvack. (Cambridge, MA: MIT Press, 2003), 101.
3
that occurred at the inception of these federal systems. Oates in various writings formalized the so-called Subsidiarity Principle, also sometimes referred to as the Decentralization Theorem.8 This principle states that government services should be provided by the lowest level of government that can do so efficiently. To meet local preferences and to be aware of local limitations on fiscal capacity, local governments may be in the best position to determine both. However, given certain realities, vertical fiscal imbalances that have developed may require intergovernmental transfers to resolve differences in revenue capacity. As one observer has noted, “the federal government has the money, the provincial governments have the constitutional authority, and local governments have the responsibility for making the actual investments.”9 Furthermore, senior levels of government may choose to control revenue parameters, delivery standards and the ability of subnational governments to incur debt.
Of the three levels of government in Canada, the municipal level is most visibly a provider of services to its inhabitants. The services for which municipalities are responsible vary from those that require considerable capital investment (water supply) to those that are highly labour-intensive (social services). Since most Canadians live in cities, it is not surprising that provincial politicians, despite some continuing rural bias in constituencies, often act in ways that imply that there is a strong implicit provincial guarantee of the services nominally financed through local budgets. The increasing entanglement of policymaking, service delivery and funding between the provincial and municipal level has motivated reviews, involving both levels, when either frustration or an exogenous shock has motivated realignments of finance and functions.10 At times, these reviews have addressed the issues raised by the pressures to finance adequate levels of municipal capital infrastructure to meet both existing and anticipated pressures.
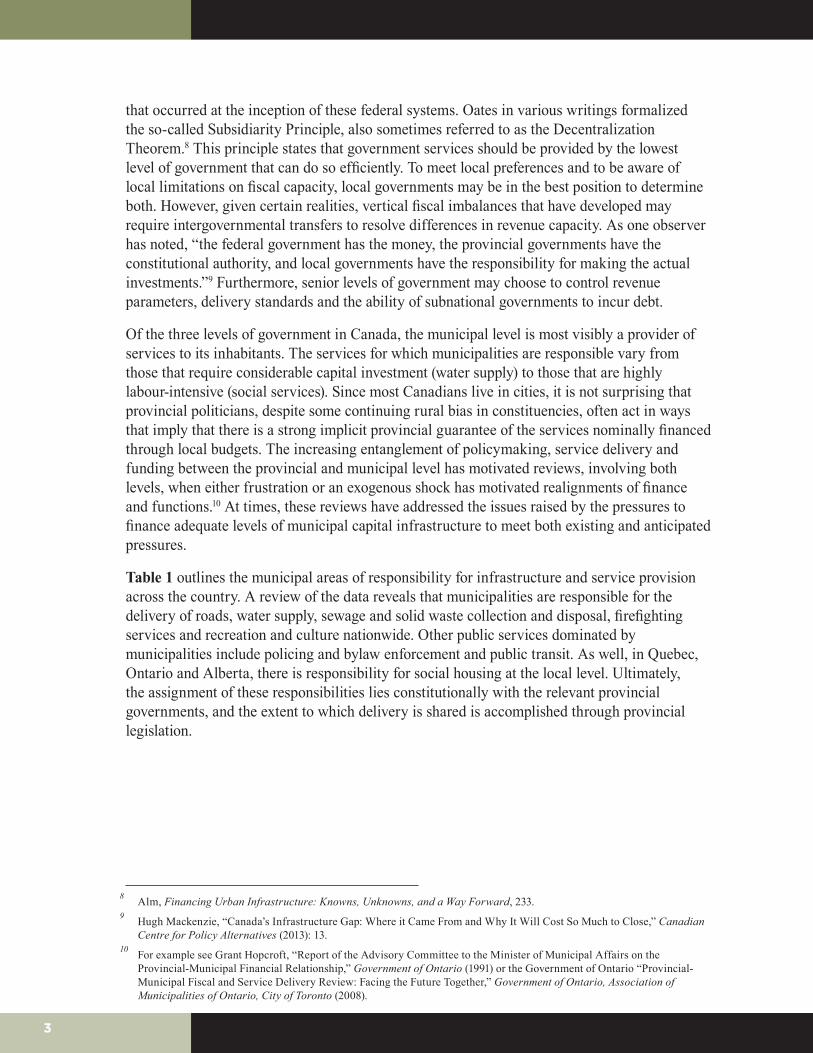
Table 1 outlines the municipal areas of responsibility for infrastructure and service provision across the country. A review of the data reveals that municipalities are responsible for the delivery of roads, water supply, sewage and solid waste collection and disposal, firefighting services and recreation and culture nationwide. Other public services dominated by municipalities include policing and bylaw enforcement and public transit. As well, in Quebec, Ontario and Alberta, there is responsibility for social housing at the local level. Ultimately, the assignment of these responsibilities lies constitutionally with the relevant provincial governments, and the extent to which delivery is shared is accomplished through provincial legislation.
8 Alm, Financing Urban Infrastructure: Knowns, Unknowns, and a Way Forward, 233.9 Hugh Mackenzie, “Canada’s Infrastructure Gap: Where it Came From and Why It Will Cost So Much to Close,” Canadian
Centre for Policy Alternatives (2013): 13.10 For example see Grant Hopcroft, “Report of the Advisory Committee to the Minister of Municipal Affairs on the
Provincial-Municipal Financial Relationship,” Government of Ontario (1991) or the Government of Ontario “Provincial- Municipal Fiscal and Service Delivery Review: Facing the Future Together,” Government of Ontario, Association of Municipalities of Ontario, City of Toronto (2008).
4
TABLE 1 A COMPARISON OF MUNICIPAL AREAS OF RESPONSIBILITY11
Municipal Responsibility NL PEI NS NB QC ON MB SK AB BC
General Government Services X X X X X X X X X X
Courts of Law X
Policing & Bylaw Enforcement X X X X X X X X X
Firefighting X X X X X X X X X X
Regulatory Measures X
Roads and Streets X X X X X X X X X X
Public Transit X X X X X X X
Hospital Care X
Preventative Care X
Other Health Services X X X
Social Assistance X X
Other Social Services X X X X
Agriculture X X
Tourism / Promotion & Trade / Industry X X X X
Water Purification and Supply X X X X X X X X X X
Sewage Collection and Disposal X X X X X X X X X X
Garbage / Waste Collection & Disposal X X X X X X X X X X
Recreation & Culture X X X X X X X X X X
Housing X X X
Regional Planning & Development X X X X X X X X X X
INFRASTRUCTURE ALLOCATION & THE BUDGETING PROCESS
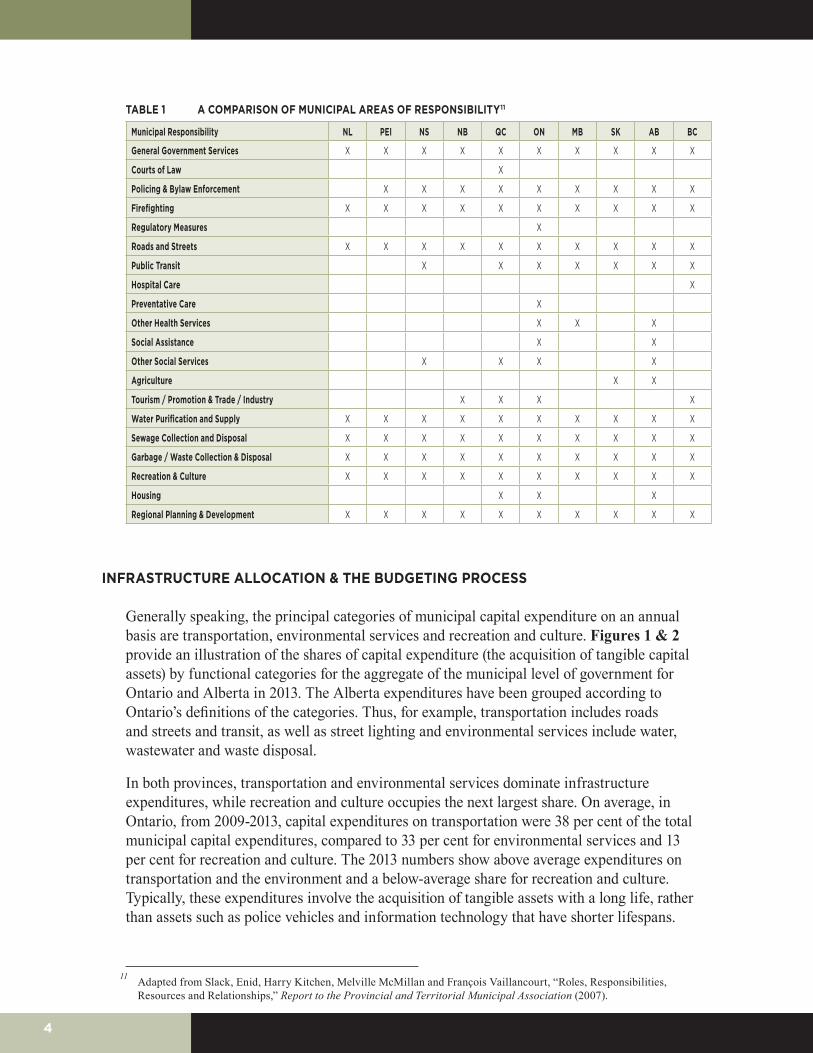
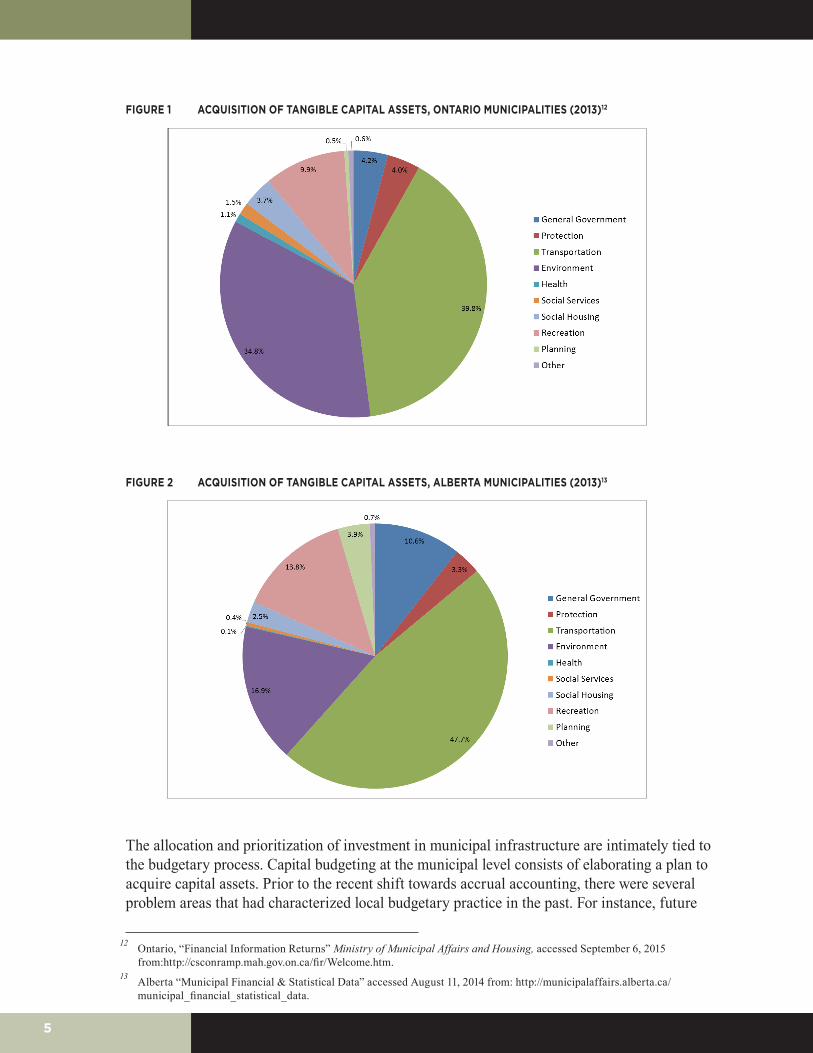
Generally speaking, the principal categories of municipal capital expenditure on an annual basis are transportation, environmental services and recreation and culture. Figures 1 & 2 provide an illustration of the shares of capital expenditure (the acquisition of tangible capital assets) by functional categories for the aggregate of the municipal level of government for Ontario and Alberta in 2013. The Alberta expenditures have been grouped according to Ontario’s definitions of the categories. Thus, for example, transportation includes roads and streets and transit, as well as street lighting and environmental services include water, wastewater and waste disposal.
In both provinces, transportation and environmental services dominate infrastructure expenditures, while recreation and culture occupies the next largest share. On average, in Ontario, from 2009-2013, capital expenditures on transportation were 38 per cent of the total municipal capital expenditures, compared to 33 per cent for environmental services and 13 per cent for recreation and culture. The 2013 numbers show above average expenditures on transportation and the environment and a below-average share for recreation and culture. Typically, these expenditures involve the acquisition of tangible assets with a long life, rather than assets such as police vehicles and information technology that have shorter lifespans.
11 Adapted from Slack, Enid, Harry Kitchen, Melville McMillan and François Vaillancourt, “Roles, Responsibilities, Resources and Relationships,” Report to the Provincial and Territorial Municipal Association (2007).
5
FIGURE 1 ACQUISITION OF TANGIBLE CAPITAL ASSETS, ONTARIO MUNICIPALITIES (2013)12
FIGURE 2 ACQUISITION OF TANGIBLE CAPITAL ASSETS, ALBERTA MUNICIPALITIES (2013)13
The allocation and prioritization of investment in municipal infrastructure are intimately tied to the budgetary process. Capital budgeting at the municipal level consists of elaborating a plan to acquire capital assets. Prior to the recent shift towards accrual accounting, there were several problem areas that had characterized local budgetary practice in the past. For instance, future
12 Ontario, “Financial Information Returns” Ministry of Municipal Affairs and Housing, accessed September 6, 2015 from:http://csconramp.mah.gov.on.ca/fir/Welcome.htm.
13 Alberta “Municipal Financial & Statistical Data” accessed August 11, 2014 from: http://municipalaffairs.alberta.ca/municipal_financial_statistical_data.
6
annual operating and maintenance costs were often ignored in making decisions on capital projects. Likewise, opportunity costs (the value of forgone alternatives) were also ignored. Before the change to accrual accounting, depreciation or asset replacement costs were ignored in calculating annual operating costs, and capital programs were seldom integrated with growth management objectives. As such, the emphasis in many councils tended to be on shortterm projects rather than longer-term projects. Municipalities have begun to address some of these issues with the change in accounting methodology reflected in financial statements begun in 2009.14
Depending on the services being provided, particularly in multi-tier local governments (where local responsibilities are apportioned between upper and lower-tier local governments), capital budgeting is affected by various factors including: i) the extent of known deficiencies in hard services such as water, sewer and roads networks; ii) the need for facilities to deliver soft services serving existing urbanized areas; and iii) the implications for land use consequent on the extension of urban services. Factors such as the state of the capital market (in terms of its receptiveness to municipal borrowing), the willingness of council to bear interest costs and the availability of various types of revenues (such as development charges) may also affect the timing of infrastructure investments. In multi-tier governments, coordination of the actual works being contemplated will also affect the timetable for the capital budget; for example, if the upper tier is responsible for water and sewer services, replacement works are often coordinated with the lower tier’s road replacement program.
COMPONENTS OF A CAPITAL BUDGET
The following steps are involved in the development of a capital budget:
1. Inventory of Capital Assets;
2. Developing a Multi-Year Capital Investment Plan (CIP);
3. Developing the Financing Plan; and
4. Implementing the Capital Budget.
An inventory of capital assets is a critical piece of information for the operation of municipal services. The inventory can provide information on the capacity of the infrastructure in place and the likely timing of replacement. Accordingly, it can also be an important input into the land-use planning process. The development of a multi-year capital investment plan can provide municipal administrators with several tangible benefits. These include an enhanced ability to program the use of scarce resources and the selection of cost-effective solutions. A multi-year plan can also assist in the development of prudent borrowing and other debt policies, and can enhance revenues by providing guidance on the extent to which surplus funds exist and can be left invested. A multi-year capital plan should be integrated with a multi-year operating plan to
14 For more information see “Benjamin Dachis and William B.P. Robson, “Baffling Budgets: Canadian Cities Need Better Financial Reporting,” C.D.Howe Institute, Commentary 397 (2014) and for a defence of cash-based budgeting see Bev Dahlby and Michael Smart, “The Structure and Presentation of Provincial Budgets,” The School of Public Policy Research Papers 8, no. 25 (2015). As yet, there is no requirement that budgeting be accrual-based.
7
avoid the common failure to provide for future increases in operating and maintenance funding over time. The integration of operational and capital planning can also assist a municipality in avoiding the underutilization or overbuilding of facilities.
The success of the capital budgeting process is highly dependent on public participation, and acceptance of the capital budget is often crucial to its realization. Public acceptance may depend on the degree of urgency involved — as, for example, where water pressure in fire lines is deficient, or underground sewers built at the turn of the twentieth century have collapsed, creating the conditions for basement backups. Elsewhere, the benefits derived from new neighbourhood development or commercial and industrial development may facilitate public acceptance. Ratepayers are also likely to be concerned with costs and the resultant impact on existing levels of user fees, taxes and development charges of system improvements.
The geographic extension of enhanced services or capacity enhancements to existing facilities may also affect land use and land values by opening up the possibility for urban development of rural land or the redevelopment of underutilized land in existing urban service areas. Some capital projects may be opposed precisely because of the development that may be enabled.
COMPOSITION OF INFRASTRUCTURE DEVELOPMENT
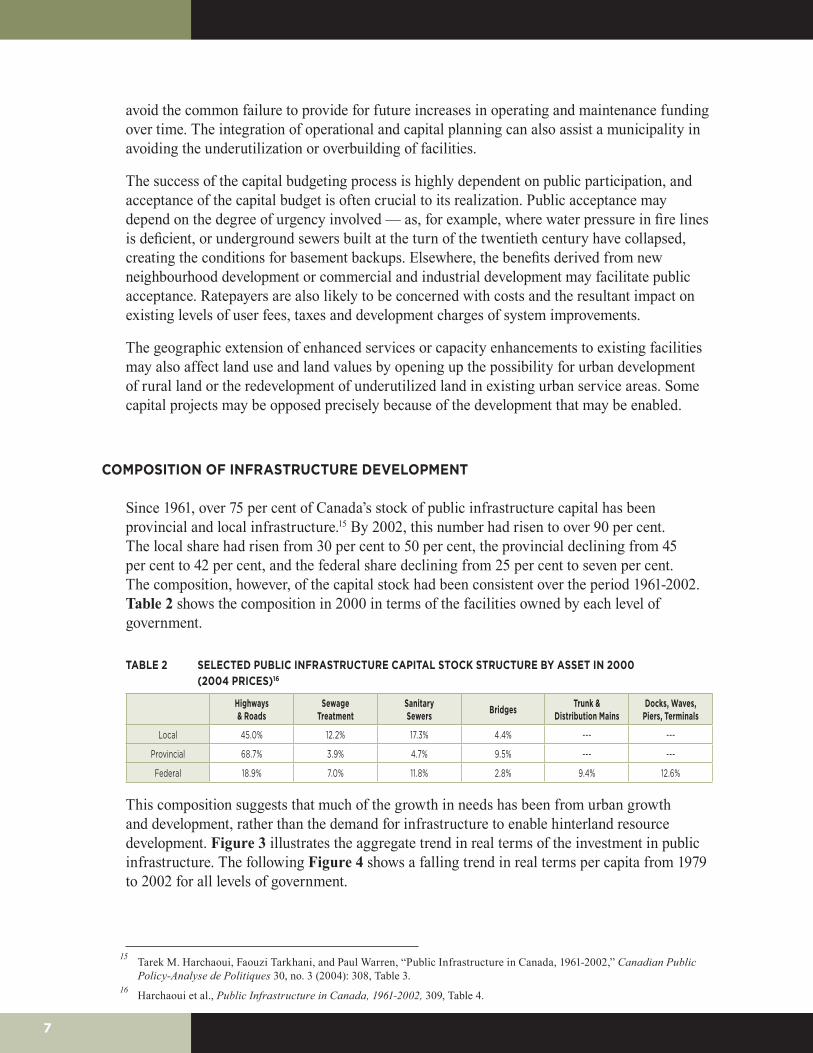
Since 1961, over 75 per cent of Canada’s stock of public infrastructure capital has been provincial and local infrastructure.15 By 2002, this number had risen to over 90 per cent. The local share had risen from 30 per cent to 50 per cent, the provincial declining from 45 per cent to 42 per cent, and the federal share declining from 25 per cent to seven per cent. The composition, however, of the capital stock had been consistent over the period 1961-2002. Table 2 shows the composition in 2000 in terms of the facilities owned by each level of government.
TABLE 2 SELECTED PUBLIC INFRASTRUCTURE CAPITAL STOCK STRUCTURE BY ASSET IN 2000 (2004 PRICES)16
Highways & Roads
Sewage Treatment
Sanitary Sewers Bridges Trunk &
Distribution MainsDocks, Waves,
Piers, Terminals
Local 45.0% 12.2% 17.3% 4.4% --- ---
Provincial 68.7% 3.9% 4.7% 9.5% --- ---
Federal 18.9% 7.0% 11.8% 2.8% 9.4% 12.6%
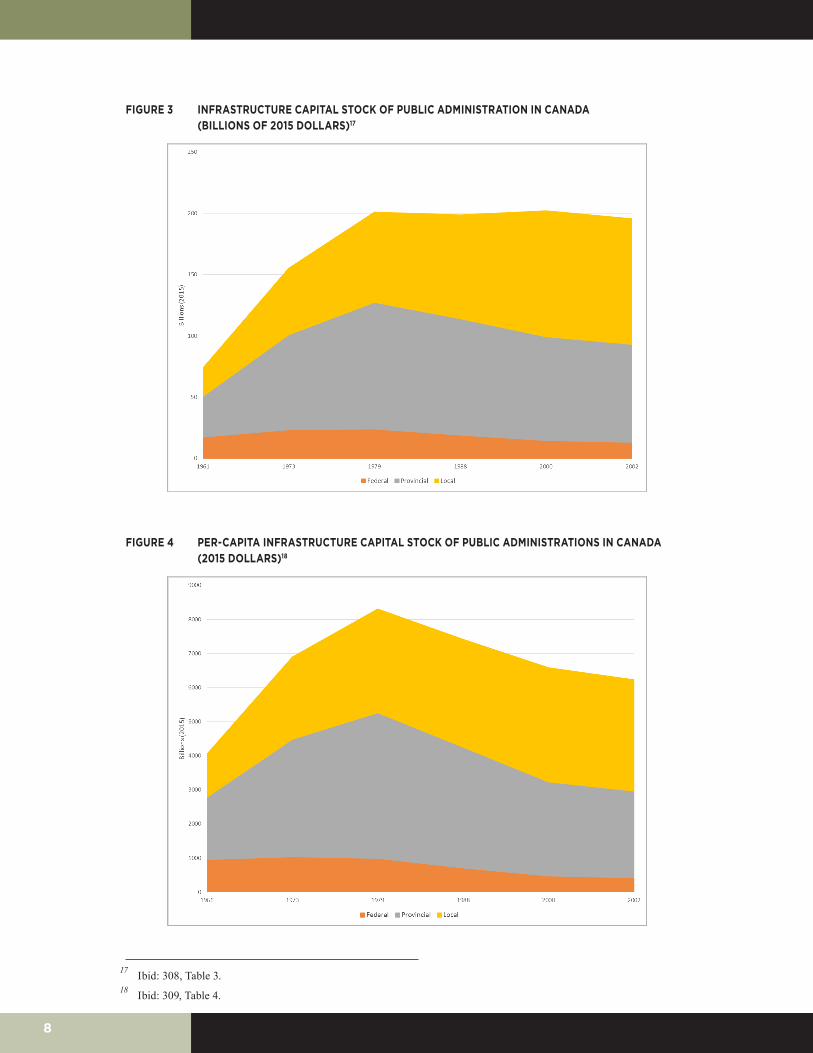
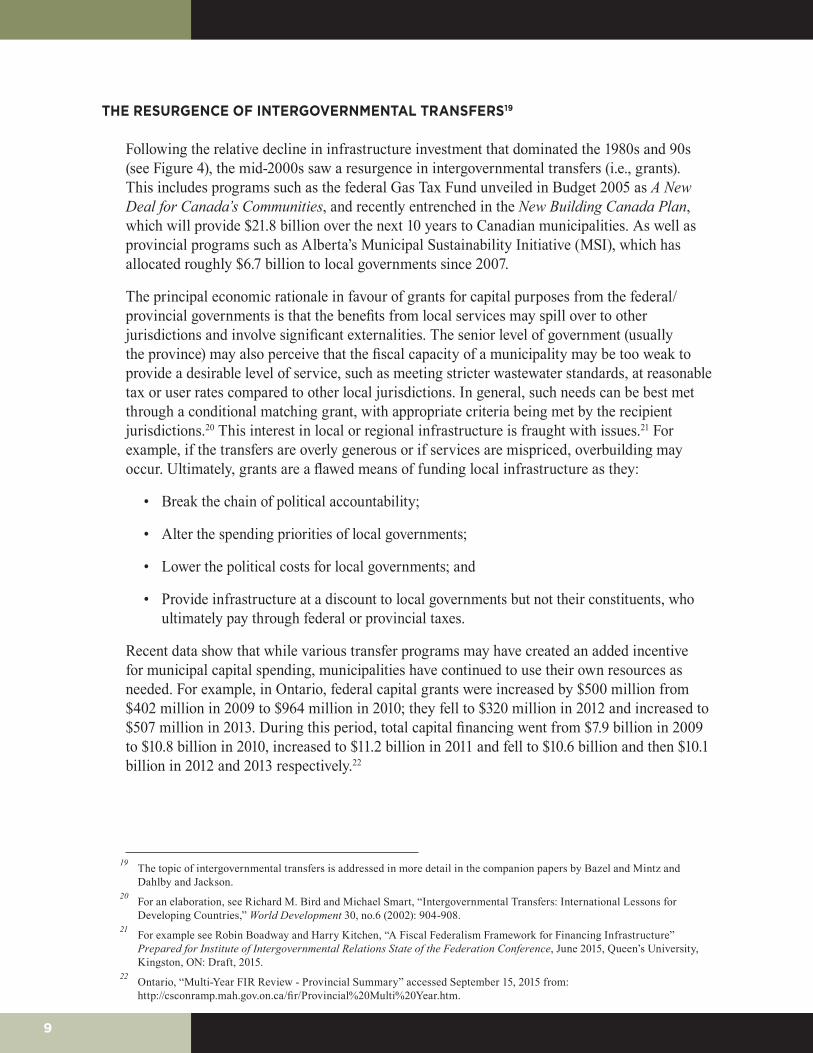
This composition suggests that much of the growth in needs has been from urban growth and development, rather than the demand for infrastructure to enable hinterland resource development. Figure 3 illustrates the aggregate trend in real terms of the investment in public infrastructure. The following Figure 4 shows a falling trend in real terms per capita from 1979 to 2002 for all levels of government.
15 Tarek M. Harchaoui, Faouzi Tarkhani, and Paul Warren, “Public Infrastructure in Canada, 1961-2002,” Canadian Public Policy-Analyse de Politiques 30, no. 3 (2004): 308, Table 3.
16 Harchaoui et al., Public Infrastructure in Canada, 1961-2002, 309, Table 4.
8
FIGURE 3 INFRASTRUCTURE CAPITAL STOCK OF PUBLIC ADMINISTRATION IN CANADA (BILLIONS OF 2015 DOLLARS)17
FIGURE 4 PER-CAPITA INFRASTRUCTURE CAPITAL STOCK OF PUBLIC ADMINISTRATIONS IN CANADA (2015 DOLLARS)18
17 Ibid: 308, Table 3.18 Ibid: 309, Table 4.
9
THE RESURGENCE OF INTERGOVERNMENTAL TRANSFERS19
Following the relative decline in infrastructure investment that dominated the 1980s and 90s (see Figure 4), the mid-2000s saw a resurgence in intergovernmental transfers (i.e., grants). This includes programs such as the federal Gas Tax Fund unveiled in Budget 2005 as A New Deal for Canada’s Communities, and recently entrenched in the New Building Canada Plan, which will provide $21.8 billion over the next 10 years to Canadian municipalities. As well as provincial programs such as Alberta’s Municipal Sustainability Initiative (MSI), which has allocated roughly $6.7 billion to local governments since 2007.
The principal economic rationale in favour of grants for capital purposes from the federal/provincial governments is that the benefits from local services may spill over to other jurisdictions and involve significant externalities. The senior level of government (usually the province) may also perceive that the fiscal capacity of a municipality may be too weak to provide a desirable level of service, such as meeting stricter wastewater standards, at reasonable tax or user rates compared to other local jurisdictions. In general, such needs can be best met through a conditional matching grant, with appropriate criteria being met by the recipient jurisdictions.20 This interest in local or regional infrastructure is fraught with issues.21 For example, if the transfers are overly generous or if services are mispriced, overbuilding may occur. Ultimately, grants are a flawed means of funding local infrastructure as they:
• Break the chain of political accountability;
• Alter the spending priorities of local governments;
• Lower the political costs for local governments; and
• Provide infrastructure at a discount to local governments but not their constituents, who ultimately pay through federal or provincial taxes.
Recent data show that while various transfer programs may have created an added incentive for municipal capital spending, municipalities have continued to use their own resources as needed. For example, in Ontario, federal capital grants were increased by $500 million from $402 million in 2009 to $964 million in 2010; they fell to $320 million in 2012 and increased to $507 million in 2013. During this period, total capital financing went from $7.9 billion in 2009 to $10.8 billion in 2010, increased to $11.2 billion in 2011 and fell to $10.6 billion and then $10.1 billion in 2012 and 2013 respectively.22
19 The topic of intergovernmental transfers is addressed in more detail in the companion papers by Bazel and Mintz and Dahlby and Jackson.
20 For an elaboration, see Richard M. Bird and Michael Smart, “Intergovernmental Transfers: International Lessons for Developing Countries,” World Development 30, no.6 (2002): 904-908.
21 For example see Robin Boadway and Harry Kitchen, “A Fiscal Federalism Framework for Financing Infrastructure” Prepared for Institute of Intergovernmental Relations State of the Federation Conference, June 2015, Queen’s University, Kingston, ON: Draft, 2015.
22 Ontario, “Multi-Year FIR Review - Provincial Summary” accessed September 15, 2015 from: http://csconramp.mah.gov.on.ca/fir/Provincial%20Multi%20Year.htm.
10
MEASURES OF THE “INFRASTRUCTURE DEFICIT”
Even with the rise of extensive federal and provincial intergovernmental transfer schemes in the mid-2000s, there are increasing concerns that an infrastructure deficit exists in municipalities across the country — the measure of which has not been without controversy. A series of studies by the Federation of Canadian Municipalities (FCM) has attempted to quantify the extent to which underinvestment has taken place. The FCM’s study in 2007 estimated a deficit of $123 billion, of which $31 billion was attributed to aging and deteriorated water supply, wastewater and storm drainage assets. The estimates attempted to identify the cost of bringing existing infrastructure up to then-current standards. It did not estimate the cost of new infrastructure.
More recently, FCM and others have collaborated to produce the Canadian Infrastructure Report Card. Based on surveying municipalities across the country, they estimated that the replacement value of all assets in 2009-2010, including municipal roads, drinking water, wastewater and storm water infrastructure, to be $538.1 billion. Of this, the replacement value of assets in very poor condition was valued at $50.7 billion and those in fair condition at $121.1 billion.23 While these studies have been subject to criticism —and the current estimates do not account for the cost implications of upgrading wastewater treatment plants to meet new federal regulations— there is little doubt that the net book value of municipal assets is generally below the cost of the acquisition of those assets, depending on age, depreciation and the fiscal capacity of the municipality making the investments.
An indication of the extent of underinvestment in municipal infrastructure can be gained from a comparison of the net book value of assets as a proportion of the costs of those assets. Table 3 looks at the state of infrastructure by comparing the net book value of capital assets as a percentage of the cost of the capital assets for some of the largest municipalities (upper and lower tier) in Ontario in 2013.24 Comparing the book value of assets (defined as the current value less depreciation) to the original cost provides information on the extent to which municipalities have been investing in capital assets. To preserve the value of capital assets, municipalities would have to invest at least the same amount of money as is represented by the amount of depreciation.25
In 2013, the 18 municipalities as a whole (upper and lower tiers) held assets valued at $111.8 billion. After accumulated depreciation, these assets are now estimated to be worth $73.8 billion (book value). The result is that municipal assets have lost $38.0 billion in value since acquisition. This $38 billion can be considered to be the minimum level of infrastructure deficit for all types of municipal infrastructure for these 18 municipalities. The cost to replace these assets would actually be much higher than the original cost because of price increases for the same asset over the last decade. Inflationary increases for municipal goods and services are generally higher than the consumer price index. For 2013, the total value of municipal tangible
23 Federation of Canadian Municipalities, “Canadian Infrastructure Report Card: Volume 1:2012 Municipal Roads and Water Systems,” Federation of Canadian Municipalities (2012).
24 This information is only available for the years since 2009, when PSAB rules resulted in a change in municipal reporting. 25 Eastern Ontario Wardens̀ Caucus, “Facing Our Fiscal Challenges: A Report on the Financing Sustainability of Local
Government in Eastern Ontario,” Eastern Ontario Financial Sustainability Update Project (2012): 56.
11
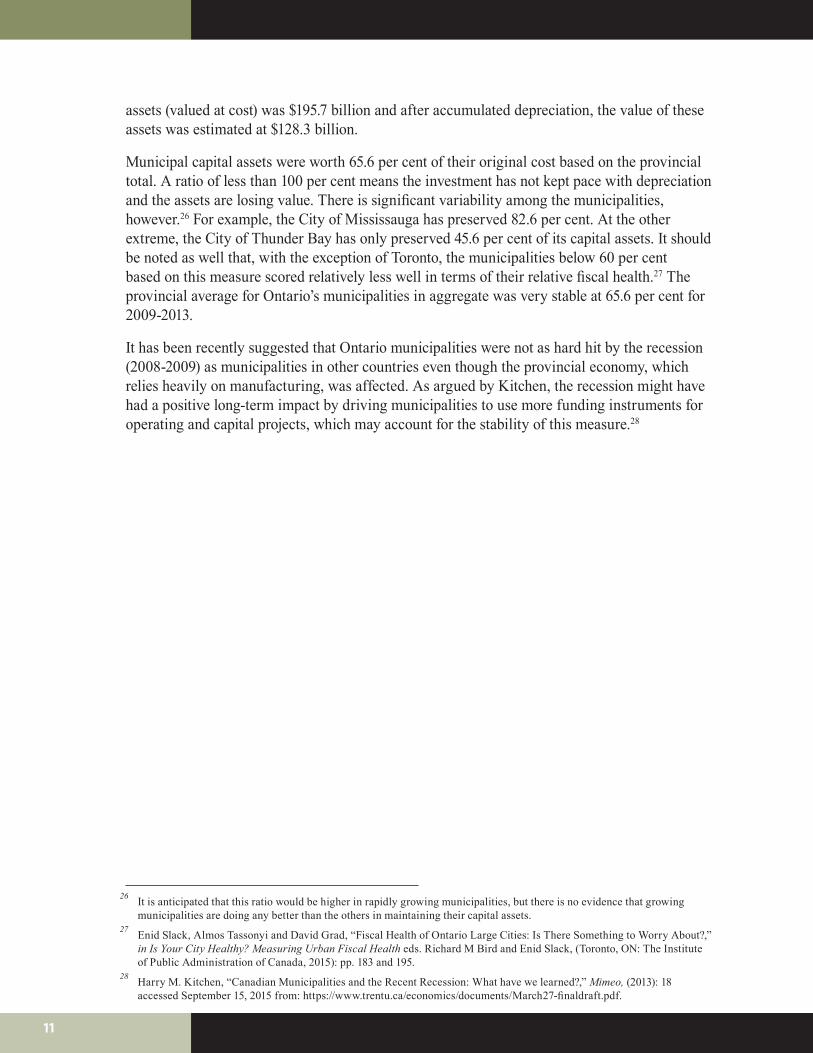
assets (valued at cost) was $195.7 billion and after accumulated depreciation, the value of these assets was estimated at $128.3 billion.
Municipal capital assets were worth 65.6 per cent of their original cost based on the provincial total. A ratio of less than 100 per cent means the investment has not kept pace with depreciation and the assets are losing value. There is significant variability among the municipalities, however.26 For example, the City of Mississauga has preserved 82.6 per cent. At the other extreme, the City of Thunder Bay has only preserved 45.6 per cent of its capital assets. It should be noted as well that, with the exception of Toronto, the municipalities below 60 per cent based on this measure scored relatively less well in terms of their relative fiscal health.27 The provincial average for Ontario’s municipalities in aggregate was very stable at 65.6 per cent for 2009-2013.
It has been recently suggested that Ontario municipalities were not as hard hit by the recession (2008-2009) as municipalities in other countries even though the provincial economy, which relies heavily on manufacturing, was affected. As argued by Kitchen, the recession might have had a positive long-term impact by driving municipalities to use more funding instruments for operating and capital projects, which may account for the stability of this measure.28
26 It is anticipated that this ratio would be higher in rapidly growing municipalities, but there is no evidence that growing municipalities are doing any better than the others in maintaining their capital assets.
27 Enid Slack, Almos Tassonyi and David Grad, “Fiscal Health of Ontario Large Cities: Is There Something to Worry About?,” in Is Your City Healthy? Measuring Urban Fiscal Health eds. Richard M Bird and Enid Slack, (Toronto, ON: The Institute of Public Administration of Canada, 2015): pp. 183 and 195.
28 Harry M. Kitchen, “Canadian Municipalities and the Recent Recession: What have we learned?,” Mimeo, (2013): 18 accessed September 15, 2015 from: https://www.trentu.ca/economics/documents/March27-finaldraft.pdf.
12
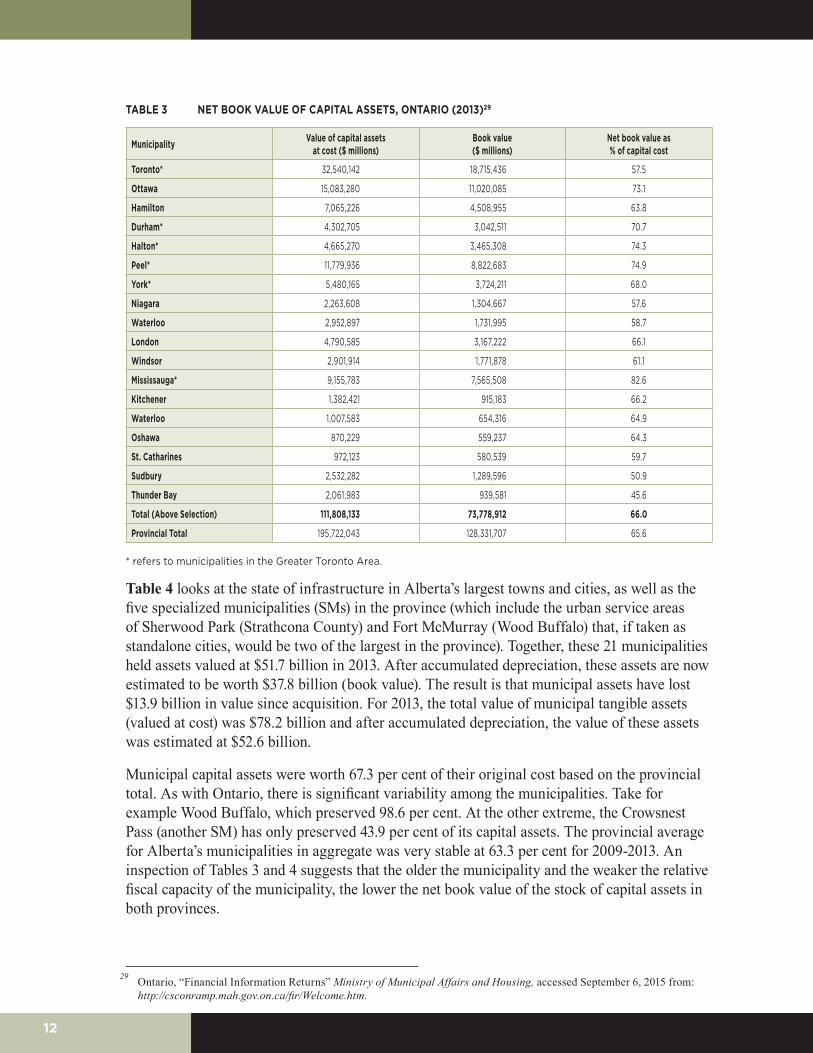
TABLE 3 NET BOOK VALUE OF CAPITAL ASSETS, ONTARIO (2013)29
Municipality Value of capital assets at cost ($ millions)
Book value ($ millions)
Net book value as % of capital cost
Toronto* 32,540,142 18,715,436 57.5
Ottawa 15,083,280 11,020,085 73.1
Hamilton 7,065,226 4,508,955 63.8
Durham* 4,302,705 3,042,511 70.7
Halton* 4,665,270 3,465,308 74.3
Peel* 11,779,936 8,822,683 74.9
York* 5,480,165 3,724,211 68.0
Niagara 2,263,608 1,304,667 57.6
Waterloo 2,952,897 1,731,995 58.7
London 4,790,585 3,167,222 66.1
Windsor 2,901,914 1,771,878 61.1
Mississauga* 9,155,783 7,565,508 82.6
Kitchener 1,382,421 915,183 66.2
Waterloo 1,007,583 654,316 64.9
Oshawa 870,229 559,237 64.3
St. Catharines 972,123 580,539 59.7
Sudbury 2,532,282 1,289,596 50.9
Thunder Bay 2,061,983 939,581 45.6
Total (Above Selection) 111,808,133 73,778,912 66.0
Provincial Total 195,722,043 128,331,707 65.6
* refers to municipalities in the Greater Toronto Area.
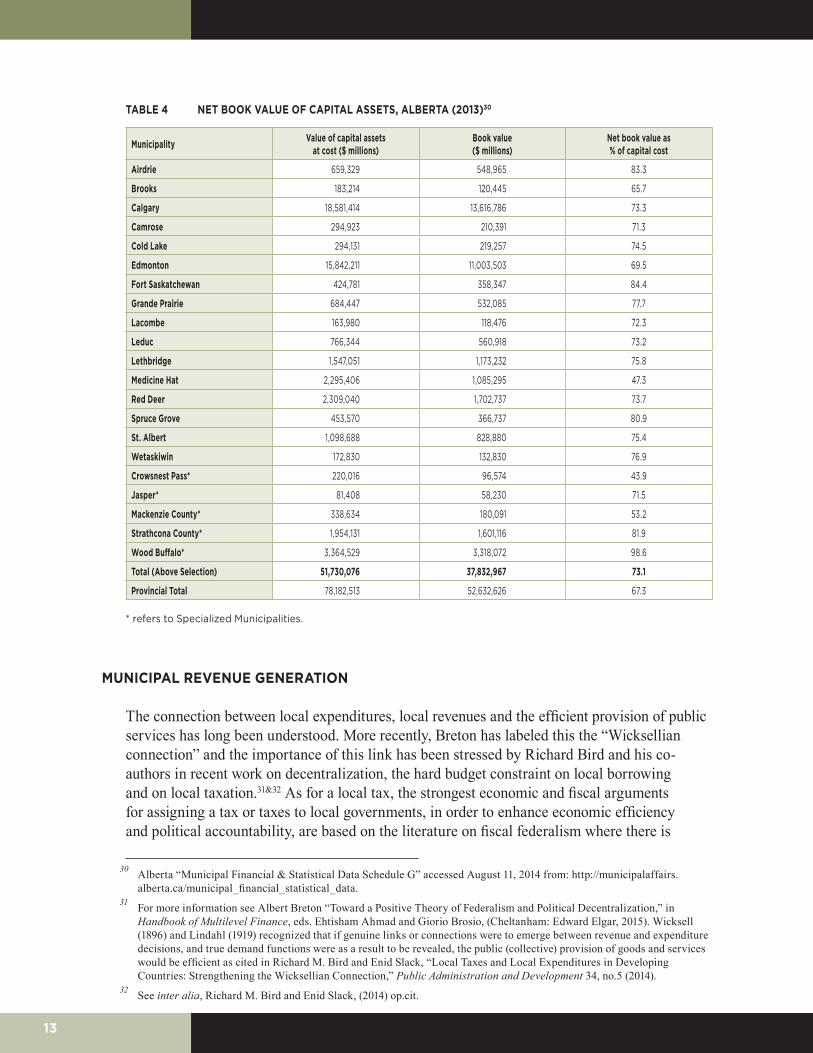
Table 4 looks at the state of infrastructure in Alberta’s largest towns and cities, as well as the five specialized municipalities (SMs) in the province (which include the urban service areas of Sherwood Park (Strathcona County) and Fort McMurray (Wood Buffalo) that, if taken as standalone cities, would be two of the largest in the province). Together, these 21 municipalities held assets valued at $51.7 billion in 2013. After accumulated depreciation, these assets are now estimated to be worth $37.8 billion (book value). The result is that municipal assets have lost $13.9 billion in value since acquisition. For 2013, the total value of municipal tangible assets (valued at cost) was $78.2 billion and after accumulated depreciation, the value of these assets was estimated at $52.6 billion.
Municipal capital assets were worth 67.3 per cent of their original cost based on the provincial total. As with Ontario, there is significant variability among the municipalities. Take for example Wood Buffalo, which preserved 98.6 per cent. At the other extreme, the Crowsnest Pass (another SM) has only preserved 43.9 per cent of its capital assets. The provincial average for Alberta’s municipalities in aggregate was very stable at 63.3 per cent for 2009-2013. An inspection of Tables 3 and 4 suggests that the older the municipality and the weaker the relative fiscal capacity of the municipality, the lower the net book value of the stock of capital assets in both provinces.
29 Ontario, “Financial Information Returns” Ministry of Municipal Affairs and Housing, accessed September 6, 2015 from: http://csconramp.mah.gov.on.ca/fir/Welcome.htm.
13
TABLE 4 NET BOOK VALUE OF CAPITAL ASSETS, ALBERTA (2013)30
Municipality Value of capital assets at cost ($ millions)
Book value ($ millions)
Net book value as % of capital cost
Airdrie 659,329 548,965 83.3
Brooks 183,214 120,445 65.7
Calgary 18,581,414 13,616,786 73.3
Camrose 294,923 210,391 71.3
Cold Lake 294,131 219,257 74.5
Edmonton 15,842,211 11,003,503 69.5
Fort Saskatchewan 424,781 358,347 84.4
Grande Prairie 684,447 532,085 77.7
Lacombe 163,980 118,476 72.3
Leduc 766,344 560,918 73.2
Lethbridge 1,547,051 1,173,232 75.8
Medicine Hat 2,295,406 1,085,295 47.3
Red Deer 2,309,040 1,702,737 73.7
Spruce Grove 453,570 366,737 80.9
St. Albert 1,098,688 828,880 75.4
Wetaskiwin 172,830 132,830 76.9
Crowsnest Pass* 220,016 96,574 43.9
Jasper* 81,408 58,230 71.5
Mackenzie County* 338,634 180,091 53.2
Strathcona County* 1,954,131 1,601,116 81.9
Wood Buffalo* 3,364,529 3,318,072 98.6
Total (Above Selection) 51,730,076 37,832,967 73.1
Provincial Total 78,182,513 52,632,626 67.3
* refers to Specialized Municipalities.
MUNICIPAL REVENUE GENERATION
The connection between local expenditures, local revenues and the efficient provision of public services has long been understood. More recently, Breton has labeled this the “Wicksellian connection” and the importance of this link has been stressed by Richard Bird and his co-authors in recent work on decentralization, the hard budget constraint on local borrowing and on local taxation.31&32 As for a local tax, the strongest economic and fiscal arguments for assigning a tax or taxes to local governments, in order to enhance economic efficiency and political accountability, are based on the literature on fiscal federalism where there is
30 Alberta “Municipal Financial & Statistical Data Schedule G” accessed August 11, 2014 from: http://municipalaffairs.alberta.ca/municipal_financial_statistical_data.
31 For more information see Albert Breton “Toward a Positive Theory of Federalism and Political Decentralization,” in Handbook of Multilevel Finance, eds. Ehtisham Ahmad and Giorio Brosio, (Cheltanham: Edward Elgar, 2015). Wicksell (1896) and Lindahl (1919) recognized that if genuine links or connections were to emerge between revenue and expenditure decisions, and true demand functions were as a result to be revealed, the public (collective) provision of goods and services would be efficient as cited in Richard M. Bird and Enid Slack, “Local Taxes and Local Expenditures in Developing Countries: Strengthening the Wicksellian Connection,” Public Administration and Development 34, no.5 (2014).
32 See inter alia, Richard M. Bird and Enid Slack, (2014) op.cit.
14
widespread agreement on general principles that should be followed. In short, this theory prescribes a limited tax base for local governments.
Generally speaking, the best municipal/local taxes are those that have the following characteristics:
• They are based on an immobile tax base and therefore, borne primarily by local residents (not exported);
• They do not create problems with harmonization or harmful competition between local governments or local governments and more senior levels of government;
• They generate sufficient, stable and predictable revenues;
• They are visible to ensure accountability and transparency;
• They are perceived to be fair; and
• They are easy to administer locally.33
Recently, Arnott has posed the question of how best to finance public infrastructure associated with suburban expansion from the perspective of an urban economist:
How should the public infrastructure of suburban expansion be financed? There are five general approaches. The first is financing out of general revenue; the second is bond-financing at the city level; the third is charging suburban developers development impact fees; the fourth is charging the current and future owners of new suburban areas a special assessment; and the fifth is charging user fees. These five approaches are differentiated along two dimensions, time and space. How should the cost be borne across generations? Should the cost be borne by those directly affected by new public infrastructure or by the community at large? The efficiency answer is to apply the benefit principle, since doing so provides the appropriate marginal incentives 34
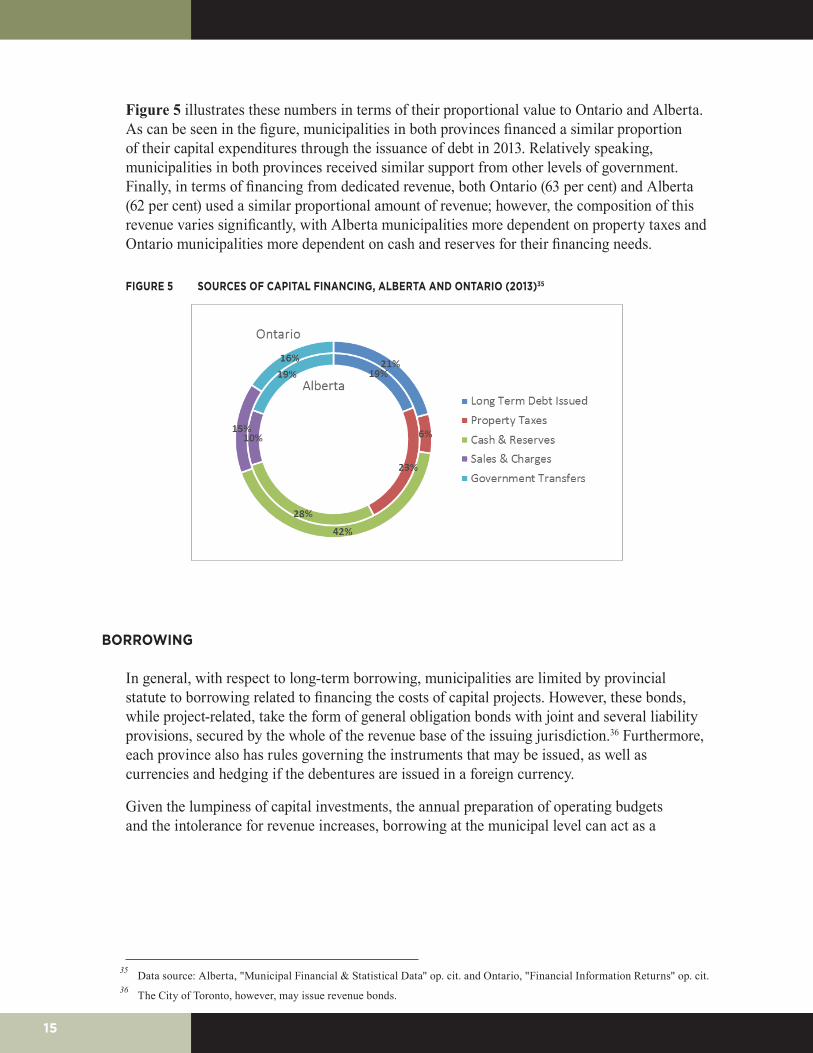
Looking at municipal revenue used to finance capital in Ontario and Alberta, there are three primary funding streams. The first is the issuing of debt, of which Ontario municipalities issued nearly $1.7 billion in 2013, while municipalities in Alberta issued roughly $416 million. The second is financing from dedicated revenue. This includes internal revenue sources such as property taxes and general operating reserves and reserve funds, as well as user fees, services charges and, in particular, development charges. In Ontario, $513 million in property taxes, nearly $3.4 billion from reserves (cash) and reserve funds, $1.1 billion from development charges and $150 million from asset sales and user charges were used to finance capital expenditures in 2013. In Alberta slightly more than $510 million was derived from property taxation, $611 million from reserves and $227 million from sales and charges (including development charges) respectively. The third and final primary funding stream are government transfers (i.e., grants) that accounted for $1.2 billion in transfers and $700 million in gas tax transfers in Ontario and $427 million in total transfers in Alberta in 2013.
33 Harry Kitchen and Almos Tassonyi “Municipal Taxes and User Fees” in Heather Kerr, Ken McKenzie and Jack Mintz, eds. Tax Policy in Canada (Toronto: Canadian Tax Foundation)” (2012): 3.
34 Richard Arnott, “Reflections on Calgary’s Spatial Structure: An Urban Economist’s Critique of Municipal Planning in Calgary” The School of Public Policy Research Papers 8, no.35 (2015): 8-9.
15
Figure 5 illustrates these numbers in terms of their proportional value to Ontario and Alberta. As can be seen in the figure, municipalities in both provinces financed a similar proportion of their capital expenditures through the issuance of debt in 2013. Relatively speaking, municipalities in both provinces received similar support from other levels of government. Finally, in terms of financing from dedicated revenue, both Ontario (63 per cent) and Alberta (62 per cent) used a similar proportional amount of revenue; however, the composition of this revenue varies significantly, with Alberta municipalities more dependent on property taxes and Ontario municipalities more dependent on cash and reserves for their financing needs.
FIGURE 5 SOURCES OF CAPITAL FINANCING, ALBERTA AND ONTARIO (2013)35
BORROWING
In general, with respect to long-term borrowing, municipalities are limited by provincial statute to borrowing related to financing the costs of capital projects. However, these bonds, while project-related, take the form of general obligation bonds with joint and several liability provisions, secured by the whole of the revenue base of the issuing jurisdiction.36 Furthermore, each province also has rules governing the instruments that may be issued, as well as currencies and hedging if the debentures are issued in a foreign currency.
Given the lumpiness of capital investments, the annual preparation of operating budgets and the intolerance for revenue increases, borrowing at the municipal level can act as a
35 Data source: Alberta, "Municipal Financial & Statistical Data" op. cit. and Ontario, "Financial Information Returns" op. cit.36 The City of Toronto, however, may issue revenue bonds.
16
smoothing device for the funding process.37 While the acquisition of capital assets that provide a collective benefit and beneficiaries are difficult to identify, local tax revenues can provide a revenue stream to service the debts.38 For assets that provide specific benefits and where the beneficiaries can be identified, user fees and development charges are appropriate sources to generate a revenue stream to service the debts, again assuming appropriate pricing methodology.39
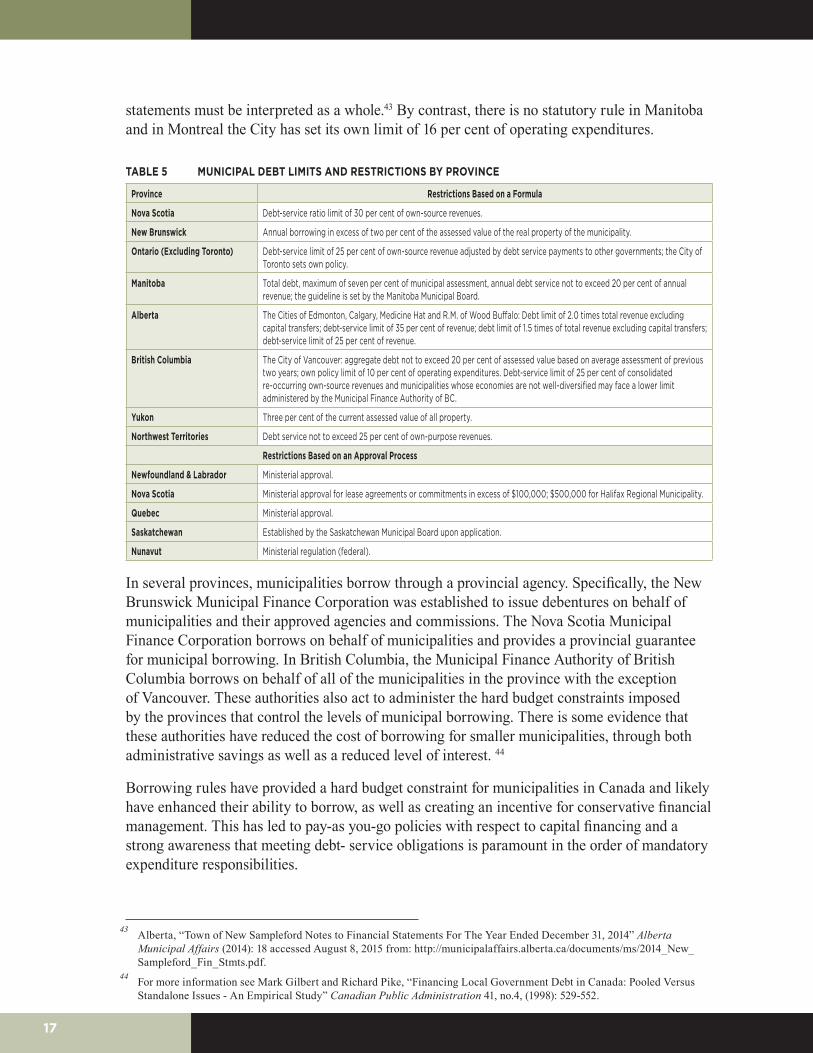
The borrowing rules imposed by provincial governments on municipalities are a further reflection of the hierarchical relationship between the two levels of government that characterizes policy with respect to municipal finance.40 The existing set of rules has its roots in the crisis created by the Great Depression.41 Most Canadian provinces use an ex ante regulatory system to control municipal borrowing as summarized in Table 5. In general, these constraints are set out in regulations; in some cases, the rules are a guideline used by a provincial approval authority.
For example, in Ontario a provincial regulation sets 25 per cent as the limit for debt charges as a percentage of own-source revenue without provincial permission. Because the actual calculation of the limit requires taking current carrying costs as well as future commitments beyond the term of council into account (and not simply debt service), there is a measure of forward-looking planning imposed on municipal debt management. This limit is applied to single-tier, upper-tier and lower-tier municipalities as being the relevant units responsible for the repayment of debt.42
Similarly, a provincial regulation sets the debt limits for Alberta municipalities. The cities of Edmonton, Calgary and Medicine Hat, as well as the SM of Wood Buffalo, have a greater limit than other municipalities. The debt limit is calculated at 1.5 times revenue of the municipality (as defined in Alberta Regulation 255/00) and the debt-service limit is calculated at 0.25 times such revenue. Incurring debt beyond these limitations requires approval by the Minister of Municipal Affairs. These thresholds are guidelines used by Alberta Municipal Affairs to identify municipalities that could be at financial risk if further debt is acquired. The calculation taken alone does not represent the financial stability of the municipality. Rather, the financial
37 Edward L. Glaeser notes that for borrowing, the “logic is that these investments will pay off in the future so it makes sense to charge future residents or homeowners. Moreover, the scale of the investment might overwhelm local budgets if paid for out of current taxes.” in “Urban Public Finance,” NBER Working Paper 18244 (2012): 44. Jack Mintz and Michael Smart note that ”based on sustainability and tax smoothing considerations, a strong case can be made for debt financing of capital projects that generate commercial or self-liquidating assets, or which will generate revenue from user fees or other taxes that will ultimately recoup initial outlays.” in Jack Mintz and Michael Smart “Incentives for Public Investment under Fiscal Rules,” World Bank Policy Research Paper (2006): 25-26.
38 Dahlby and Smart (2015): 11, op. cit. question the merits of the argument for the use of debt financing for projects that depend on the growth of the economy to generate the revenue streams for servicing debts related to such projects. It might be noted that municipalities in Ontario generally do not use borrowing to fund smaller capital projects providing collective benefits.
39 For an extended discussion of mispricing and its consequences, see Pamela Blais, Perverse Cities: Hidden Subsidies, Wonky Policy, and Urban Sprawl (Vancouver: UBC Press, 2010).
40 For more information see Richard M. Bird and Almos Tassonyi (2003), op. cit. for an exploration of these issues.41 Almos T. Tassonyi, “Ontario Municipal Finance, 1886-1940,” Unpublished Ph.D thesis, University of Calgary, (2011).42 Ontario, “O. Reg. 403/02: Debt and Financial Obligation Limits” Municipal Act, 2001 accessed September 15, 2015
from: http://www.ontario.ca/laws/regulation/020403. The exception is the City of Toronto, which does not face provincial borrowing restrictions.
17
statements must be interpreted as a whole.43 By contrast, there is no statutory rule in Manitoba and in Montreal the City has set its own limit of 16 per cent of operating expenditures.
TABLE 5 MUNICIPAL DEBT LIMITS AND RESTRICTIONS BY PROVINCE
Province Restrictions Based on a Formula
Nova Scotia Debt-service ratio limit of 30 per cent of own-source revenues.
New Brunswick Annual borrowing in excess of two per cent of the assessed value of the real property of the municipality.
Ontario (Excluding Toronto) Debt-service limit of 25 per cent of own-source revenue adjusted by debt service payments to other governments; the City of Toronto sets own policy.
Manitoba Total debt, maximum of seven per cent of municipal assessment, annual debt service not to exceed 20 per cent of annual revenue; the guideline is set by the Manitoba Municipal Board.
Alberta The Cities of Edmonton, Calgary, Medicine Hat and R.M. of Wood Buffalo: Debt limit of 2.0 times total revenue excluding capital transfers; debt-service limit of 35 per cent of revenue; debt limit of 1.5 times of total revenue excluding capital transfers; debt-service limit of 25 per cent of revenue.
British Columbia The City of Vancouver: aggregate debt not to exceed 20 per cent of assessed value based on average assessment of previous two years; own policy limit of 10 per cent of operating expenditures. Debt-service limit of 25 per cent of consolidated re-occurring own-source revenues and municipalities whose economies are not well-diversified may face a lower limit administered by the Municipal Finance Authority of BC.
Yukon Three per cent of the current assessed value of all property.
Northwest Territories Debt service not to exceed 25 per cent of own-purpose revenues.
Restrictions Based on an Approval Process
Newfoundland & Labrador Ministerial approval.
Nova Scotia Ministerial approval for lease agreements or commitments in excess of $100,000; $500,000 for Halifax Regional Municipality.
Quebec Ministerial approval.
Saskatchewan Established by the Saskatchewan Municipal Board upon application.
Nunavut Ministerial regulation (federal).
In several provinces, municipalities borrow through a provincial agency. Specifically, the New Brunswick Municipal Finance Corporation was established to issue debentures on behalf of municipalities and their approved agencies and commissions. The Nova Scotia Municipal Finance Corporation borrows on behalf of municipalities and provides a provincial guarantee for municipal borrowing. In British Columbia, the Municipal Finance Authority of British Columbia borrows on behalf of all of the municipalities in the province with the exception of Vancouver. These authorities also act to administer the hard budget constraints imposed by the provinces that control the levels of municipal borrowing. There is some evidence that these authorities have reduced the cost of borrowing for smaller municipalities, through both administrative savings as well as a reduced level of interest. 44
Borrowing rules have provided a hard budget constraint for municipalities in Canada and likely have enhanced their ability to borrow, as well as creating an incentive for conservative financial management. This has led to pay-as you-go policies with respect to capital financing and a strong awareness that meeting debt- service obligations is paramount in the order of mandatory expenditure responsibilities.
43 Alberta, “Town of New Sampleford Notes to Financial Statements For The Year Ended December 31, 2014” Alberta Municipal Affairs (2014): 18 accessed August 8, 2015 from: http://municipalaffairs.alberta.ca/documents/ms/2014_New_Sampleford_Fin_Stmts.pdf.
44 For more information see Mark Gilbert and Richard Pike, “Financing Local Government Debt in Canada: Pooled Versus Standalone Issues - An Empirical Study” Canadian Public Administration 41, no.4, (1998): 529-552.
18
BORROWING CAPACITY
Canadian municipalities have considerable unrealized borrowing capacity. While the municipal ability to borrow has been institutionally constrained within the hierarchical world of provincial-municipal relations, it seems unlikely that these constraints have been the most significant deterrent inhibiting municipalities from borrowing.45 One might note that there is a history of senior levels of government seeking to reduce fiscal pressure on themselves by promoting the use of “underutilized” local fiscal capacity. For example, the Ontario provincial budget in 1989 suggested that the pay-as-you-go policies of many municipalities had enhanced their borrowing capacity and it was suggested that “if municipalities adopted a financing strategy that recognized the extended useful life of capital projects, their ability to fund an increased proportion of capital requirements, over the next several years, would be significantly enhanced.”46 More recently, York Region has been allowed to add 80 per cent of its development charges over the last three years to its debt-servicing limit until 2021.
Looking first at Ontario, given the generally conservative behavior of Ontario municipalities, it is not surprising that Slack, Tassonyi and Grad found that the mean of the percentage of debt charges to own-source revenue of the sample of the largest municipalities in Ontario from 2000-2011 has generally been under five per cent throughout the period. However, York Region reached 17 per cent in 2008, Toronto, 14.4 per cent in 2010, and London was at 14.1 per cent in 2011.47 While the 25 per cent number is somewhat arbitrary, the gap between this benchmark and the municipal level data suggests that borrowing capacity does exist in most municipalities (at least from the regulatory perspective).
Similarly, it would seem that Alberta municipalities also have room to borrow. Given a debt-to-revenue ratio limit of 2.0 and a debt-service-to-revenue ratio of 0.30 for the larger cities and limits of 1.5 and 0.25 respectively for other municipalities, additional borrowing room has been available to finance infrastructure in Alberta since before 1988.48
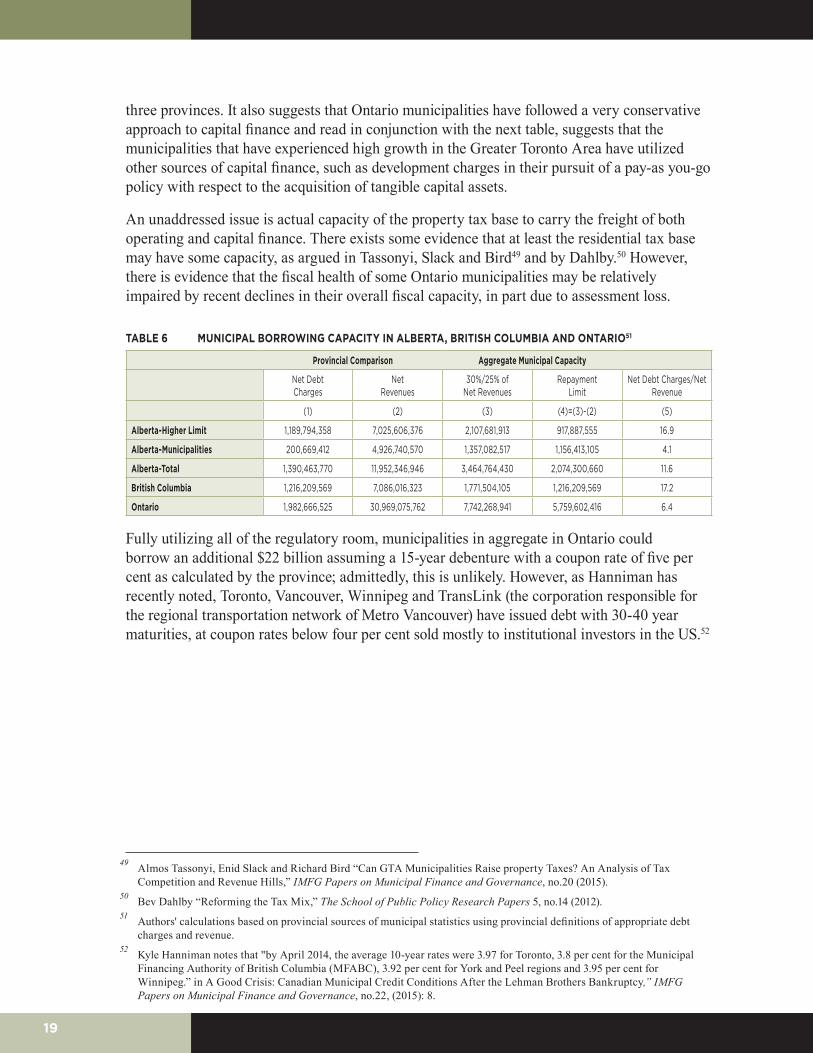
Using data for 2013, Table 6 summarizes an estimate of aggregate municipal borrowing capacity based on provincial methodology and revenue and debt-service definitions for Alberta, British Columbia and Ontario. Column 4 of the table shows the current maximum permissible debt service in each province for the municipal sector. It is calculated as a net number showing the difference between the regulated percentage of net revenues allowable for debt service and actual net debt charges. Column 5 shows that based on these criteria, the aggregate-based percentage share of net debt charges in net revenue for the cities in Alberta with more generous limits and the aggregate for municipalities in British Columbia are nearly three times that of Ontario’s aggregate municipal position, at around 17 percent compared to just over six percent. Again, this table suggests there is municipal capacity to increase levels of borrowing in these
45 For more information see Richard M. Bird and Almos Tassonyi (2003), op. cit. for further discussion of market versus hierarchical regulatory constraints.
46 Ontario, “Ontario Budget 1989,” Toronto: Queen’s Printer (1989): 96.47 Under the Municipal Act, debt charges cannot exceed 25 per cent of own-source revenues (property taxes, user fees, and
other own-source revenues) for municipalities in Ontario. As noted above, the exception is the City of Toronto, which is governed by the City of Toronto Act and which has no provincially imposed borrowing limits. Toronto, however, has set its own borrowing limit: debt charges cannot exceed 15 per cent of the property tax levy. In the last few years, debt charges have been less than 12 per cent of the property tax levy.
48 Bazel and Mintz, The Free Ride is Over: Why Cities, and Citizens, Must Start Paying for Much – Needed Infrastructure, 11.
19
three provinces. It also suggests that Ontario municipalities have followed a very conservative approach to capital finance and read in conjunction with the next table, suggests that the municipalities that have experienced high growth in the Greater Toronto Area have utilized other sources of capital finance, such as development charges in their pursuit of a pay-as you-go policy with respect to the acquisition of tangible capital assets.
An unaddressed issue is actual capacity of the property tax base to carry the freight of both operating and capital finance. There exists some evidence that at least the residential tax base may have some capacity, as argued in Tassonyi, Slack and Bird49 and by Dahlby.50 However, there is evidence that the fiscal health of some Ontario municipalities may be relatively impaired by recent declines in their overall fiscal capacity, in part due to assessment loss.
TABLE 6 MUNICIPAL BORROWING CAPACITY IN ALBERTA, BRITISH COLUMBIA AND ONTARIO51
Provincial Comparison Aggregate Municipal Capacity
Net DebtCharges
NetRevenues
30%/25% ofNet Revenues
RepaymentLimit
Net Debt Charges/Net Revenue
(1) (2) (3) (4)=(3)-(2) (5)
Alberta-Higher Limit 1,189,794,358 7,025,606,376 2,107,681,913 917,887,555 16.9
Alberta-Municipalities 200,669,412 4,926,740,570 1,357,082,517 1,156,413,105 4.1
Alberta-Total 1,390,463,770 11,952,346,946 3,464,764,430 2,074,300,660 11.6
British Columbia 1,216,209,569 7,086,016,323 1,771,504,105 1,216,209,569 17.2
Ontario 1,982,666,525 30,969,075,762 7,742,268,941 5,759,602,416 6.4
Fully utilizing all of the regulatory room, municipalities in aggregate in Ontario could borrow an additional $22 billion assuming a 15-year debenture with a coupon rate of five per cent as calculated by the province; admittedly, this is unlikely. However, as Hanniman has recently noted, Toronto, Vancouver, Winnipeg and TransLink (the corporation responsible for the regional transportation network of Metro Vancouver) have issued debt with 30-40 year maturities, at coupon rates below four per cent sold mostly to institutional investors in the US.52
49 Almos Tassonyi, Enid Slack and Richard Bird “Can GTA Municipalities Raise property Taxes? An Analysis of Tax Competition and Revenue Hills,” IMFG Papers on Municipal Finance and Governance, no.20 (2015).
50 Bev Dahlby “Reforming the Tax Mix,” The School of Public Policy Research Papers 5, no.14 (2012).51 Authors' calculations based on provincial sources of municipal statistics using provincial definitions of appropriate debt
charges and revenue.52 Kyle Hanniman notes that "by April 2014, the average 10-year rates were 3.97 for Toronto, 3.8 per cent for the Municipal
Financing Authority of British Columbia (MFABC), 3.92 per cent for York and Peel regions and 3.95 per cent for Winnipeg.” in A Good Crisis: Canadian Municipal Credit Conditions After the Lehman Brothers Bankruptcy,” IMFG Papers on Municipal Finance and Governance, no.22, (2015): 8.
20
THE UTILITY OF PRIVATE-PUBLIC PARTNERSHIPS
The use of public-private partnerships (PPP) has become a significant issue in the decisions surrounding municipal infrastructure finance. A PPP consists of a contractual agreement between a government and a private company to provide or manage a capital asset. The key factors in determining the structure of a PPP involve the definition of the services being provided, the extent of the risk being transferred from the public sector to the private sector and the financing mechanisms. Typically, these contracts may take the following forms:
• Traditional model: Design-Bid-Build;
• Private contract fee service (operate and maintain);
• Build-Operate-Transfer;
• Design-Build-Operate-Transfer;
• Design-Build-Finance-Operate-Maintain; and
• Build-Own-Operate (outright privatization).
There is consensus around the risks involved in these agreements. In general, contract design is critical to the appropriate allocation of returns and risks.53 Furthermore, the federal government’s use of its spending power through grant financing tied to the use of public-private partnerships is both controversial and questionable.54 Municipalities should be able to decide whether such means of financing infrastructure are appropriate in their particular circumstances.
Boardman, Siemiatycki and Vining caution that while PPPs represent an alternate form for structuring the financing of projects, they do not necessarily entail or provide financial resources to municipalities.55 The authors suggest that government should optimize and not necessarily maximize the use of private finance. Recently Siemiatycki56 noted that: “conservative partnership models and risk transfer arrangements” with an emphasis on “leveraging the relative strengths of each partner” have helped to reduce public skepticism and enhanced the prospect of success.
53 For more information see Matti Siemiatycki and Farooqi Naeem, “Infrastructure Public-Private Partnerships: Delivering Value for Money?” Journal of the American Planning Association 78, no.3 (2012): 283-299.
54 The federal government currently requires that all projects over $100 million must go through a screening process for suitability for public-private partnerships administered by P3 Canada (a federal agency). If eligible, the federal government will limit its contribution to 25 per cent.
55 Anthony E. Boardman, Aidan R. Vining and Matti Siemiatycki “The Theory and Evidence Concerning Public-Private Partnerships in Canada and Elsewhere” The School of Public Policy Working Paper (2015).
56 Matti Siemiatycki, “Public-Private Partnerships in Canada: Reflections on Twenty Years of Practice.” Canadian Public Administration, 58, no.3 (2015): 358-359.
21
CONCLUDING REMARKS ON THE STATE OF MUNICIPAL FINANCIAL CAPACITY IN CANADA
Threats to municipal fiscal capacity arrive on many fronts, from demands placed on the municipal fiscal system by competing expenditure pressures to fund redistributive services, to the inability of the existing political structure to cope with spillover effects among adjacent municipalities or simply to establish an adequate fiscal base. When municipal capacity is threatened, a policy response from the relevant province has generally been forthcoming, as for example, Ontario’s response to municipal fiscal crises in the 1930s and the 1990s, or the ongoing debate around Big City Charters in Alberta.
While the reality of an infrastructure deficit remains in dispute, a useful first response from the provinces and the federal government should be a more sustained effort to collect the relevant information for sensible policymaking. As it stands, there are significant weaknesses in the data available to judge the level of an infrastructure crisis. Financial data, for example, do not speak to the actual ability of the infrastructure to meet other standards such as environmental or safety measures. Further, there is inconsistency in the provincial reporting of municipal data that measure the levels of investment in tangible capital assets. Comparative assessments that tie indicators of fiscal health to indicators that reflect the levels of capital expenditures and depreciation of assets are as yet difficult to accomplish. Such assessments are impacted by the fact that municipalities throughout the country are still implementing asset management programs as accrual accounting (based on PSAB advice). Further comparative work that incorporates this new data into analyses of municipal fiscal capacity is needed.
With the assignment of expenditure responsibilities comes the need to assign revenue sources to the local level that can be related to the benefits derived from these services. Borrowing by municipalities is appropriate for financing capital projects benefiting future users and centralized borrowing agencies —where these exist, whether provincial or inter-municipal— produce cost savings, largely stemming from the reduction of risk reflected in reduced borrowing rates. A shift towards borrowing, away from a reliance on intergovernmental grants, would reinforce the linkage between local government spending and accountability and keep spending priorities in order. While the politics of decision-making seem to be characterized by short-term political gains in the face of making sensible long-run financial decisions, there is evidence of significant capacity to finance long-term debt at the individual municipal level. There may, however, be constraints or perceived weakness in the capacity of the local revenue base that accounts for conservative expenditure and borrowing policies being adopted by individual municipalities. However, debt and debt service do reduce the budgetary flexibility of individual jurisdictions (which is limited) and revenues must be found over time from provincially assigned revenue sources.57 Thus, municipalities are unlikely to fully exhaust their borrowing capacity — nor is borrowing the only solution to the pressure to finance additional and replacement local infrastructure.
57 Unlike provincial governments, municipalities do not have the option to roll over debt nor, unlike the federal government, to inflate themselves out of indebtedness.
22
The search for palatable additions and sensible reforms to the principal revenue sources should include property taxation, user fees and development charges (an overview of existing tools is included in Appendix A). Given the perennial dissatisfaction with the property tax, whether due to its salience or its administration, there is a continuing debate as to whether municipalities should be given access to other tax fields. Access could take the form of piggybacking or transfers of dedicated revenue for specific purposes. However, senior levels of government have been very reluctant to share their tax fields. While there has been some exploration of the implications of sharing tax bases at an aggregate level, there is little consensus on the merits of such arrangements. Nor is there a consensus on the question of whether the property tax system does in fact suffer from the inadequacies claimed for it. Again, relatively few studies have been done to assess the capacity of the existing tax base to carry more freight.
Legislative reinforcement of user-fee design and demand management and conservation-based pricing and taxation policies that adhere to the benefits principles for local tax design could be adopted. This would enhance the ability of local decision-makers to meet the challenge of capital budgeting and financing. Overall, there is a need for a more concerted effort to improve both data and legislation to enhance municipal capacity to meet the challenges involved in infrastructure finance.
23
APPENDIX A: OVERVIEW OF MUNICIPAL REVENUE GENERATION TOOLS
Internal Revenue Sources
General Operating Revenues & Reserves
From the perspective of capital financing, the use of general operating revenues is most appropriate for the acquisition of assets with a short life expectancy (police cars and fire engines) or recurrent expenditures (roads, sidewalks, street lighting and parks) usually for maintenance and repairs. The use of general operating revenues may be desirable when the benefits of capital projects accrue to current users. It is not desirable for non-recurrent expenditures for the acquisition of large fixed assets such as libraries, museums and buildings or assets with a long life expectancy such as water and sewer systems. The use of general operating revenues to finance capital also forms part of the accumulation of funds in reserve and reserve funds.
Property Taxation The real property tax is the only tax of any direct importance for municipalities in Canada. It is also used by provincial governments in most provinces and territories and by school boards in Saskatchewan and Manitoba. More generally, property-related taxes include revenue from the general property tax on real property, special assessments (benefiting area taxes), development charges or lot levies, payments in lieu of taxes and land transfer taxes. Not all of these forms of property taxation are used in every province. From the perspective of financing capital, the property tax does not work well as a rationing device, nor does it have a time dimension. 1
As the property tax may be viewed as reflecting collective rather than specific benefits and is not established as a price for consuming municipal services, such services are likely to be over-consumed and over-provided. Furthermore, given the relatively higher effective burdens faced by non-residential taxpayers, the probability of over-provision is enhanced, as is the probability of tax exporting.
User Fees The dictum “wherever possible, charge,” also known as the first rule of sensible local finance, has long formed the basis for a consensus view on enhancing economic efficiency by tying benefits to users through the use of user fees. Canadian municipalities are allowed to charge user fees and the courts have upheld the right to charge regulatory fees as well. Most recently, the determination of the legal difference between a tax and a user fee hinges on the existence of a nexus between the cost of the service and the fee and a reasonable connection between the cost of the service and the amount charged.2
User fees fund some or all of the costs of a range of municipal services in Canada. These include water, sewers, solid waste collection and disposal, public recreation, public transit and parking. The fees range from fixed charges that are unrelated to consumption to charges that vary directly with the quantity consumed, to mixes of fixed and variable charges. In addition, the pricing structure may cover all or only a portion of real production and delivery costs. Decisions about pricing structures and the proportion of costs recovered from user fees depend on a variety of considerations. Local tradition, the type of service, the tastes or preferences of residents, and the willingness (or lack of willingness) of local politicians and administrators to substitute prices for local taxes are all factors that affect the policy choices.
User fees should be designed to take into consideration cost differentials attributed to economies of scale, capacity constraints, differential demand in peak and non-peak periods, when second-best circumstances are prevalent and when externalities exist. Ultimately, the objective in setting fees should be to establish a clear link between services received and the charge for it. Failure to set prices efficiently has led to a demand for services and subsequently, a demand for physical infrastructure that is not allocatively efficient or optimal. All too often, inefficiently set user fees have led to overinvestment and larger facilities than would be justified if more efficient pricing practices were adopted.
Congestion charges and road tolls have been conspicuous by their absence in a Canadian context, as has a more focused charging policy with respect to parking charges.
1. Glaeser (2012): 46, op. cit. notes that the ”decision about funding infrastructure through user fees or tax revenues goes back to Adam Smith, who argued that user-fee based financing would eliminate unnecessary projects. The case against user fee financing is that the marginal social cost of using the infrastructure may be significantly below the average cost of delivering the infrastructure.” He notes further that if that is the case, then the standard argument is that general tax revenues should be used to pay for the infrastructure.
2. For a discussion of the relevant legal issues see Kelly I.E. Farish and Lindsay M Tedds, "User Fee Design by Canadian Municipalities." Canadian Tax Journal 62, no. 3 (2014): 635-670.
24
Charges Specific to Beneficiaries
Special Assessments A special assessment, most often in the form of a frontage charge or a local improvement charge, is a specific charge added to the existing property tax to pay for improved capital facilities that border these properties. The charge is based on a specific capital expenditure in a particular year, but may be spread over a number of years. Usually, the charge is levied on the basis of foot frontage or flankage, a zone assessment using property valuation data from the relevant assessment authority or lot size. Projects financed in this way are usually those that provide an improved level of services to existing development, including typically the construction or reconstruction of sidewalks, streets, water mains or storm sewers. The justification is that an owner of an abutting property will benefit from the local improvement and should, therefore, help fund it. In some jurisdictions, a local referendum of the benefiting owners must be carried out before the charges can be levied. While special assessments are only a small part of local budgets, they are an important means of financing smaller additions to the municipal stock of infrastructure.
Development Charges Development charges, also known as off-site levies, are used to finance the off-site capital costs of new development. Variations of these charges are used in Ontario, Alberta, British Columbia, Quebec, Nova Scotia and the Yukon. A specific dollar value per lot is imposed on developers. Developers in provinces where development charges are used are generally responsible for on-site services, such as local roads, sidewalks and street lighting as part of the conditions in subdivision and condominium agreements. Historically, development charges have been largely used to finance hard services, such as water supply, sewage treatment, trunk mains and roads. A development charge corresponds best to the benefits-received principle when the costs and benefits of the infrastructure for each property can be determined. An efficient development charge must cover the full cost of delivering the service: a capacity component which covers the capital cost of constructing the facility, plus a location or distance/density charge that reflects the capital cost of extending the service to properties or neighbourhoods. The use of development charges is often highly regulated in terms of the services that may be financed and the attribution of costs to new development.1
Like property taxes, development charges for growth-related infrastructure should also have variable rates so that properties (residential, commercial or industrial) that are more expensive to service pay proportionately more in taxes. Most Canadian municipalities, however, do not have variable development charges for the same type of property. Instead, they impose identical charges on all properties of a particular type, regardless of location. While administratively convenient, this means that the same charge is levied on residential dwellings in low-density neighbourhoods as on residential dwellings in high-density neighbourhoods. This occurs even though the marginal cost per property of infrastructure projects in low-density areas is higher, which can lead to urban sprawl. While it may be naive to expect municipal officials to calculate the infrastructure cost for each new property, costs could and should be calculated for each new development area or neighbourhood to discourage inefficient patterns of development.
Value Capture Levies Value capture levies are designed to recover the increase in land value arising from a public investment. Municipal spending on public infrastructure and subsequent zoning decisions can increase the commercial value of holdings of private landowners. Value capture levies are justified if the public investment creates windfall gains for the private developer. The levy permits the municipality to capture (some of) the economic rents accruing to the private sector that have been created by this local infrastructure spending.
The value may be captured in a variety of ways, including a requirement that the developer provide various facilities and infrastructure or cash, in return for being permitted to undertake the development that the new municipal infrastructure facilitates and makes profitable. Value may also be captured through a tax on commercial revenues generated by property abutting the infrastructure. Alternatively and more likely, a special annual tax on property could be levied on value added. This would be relatively easy to implement and administer, although care would be required in estimating the value added to the property as a result of the public infrastructure. Value capture levies are most suitable for mega-projects such as rapid transit expansion. As well, large developers could also negotiate to provide transit construction improvements.
25
Charges Specific to Beneficiaries
Community Benefits Levies
Community Benefit Agreements are a recent innovation in Canada. Ontario has recently adopted legislation to enshrine such agreements as part of large-scale contracts. The outcomes sought include local job creation, training and apprenticeship opportunities and other neighbourhood improvements. It has been suggested that approximately one to four per cent of the overall value of a large project could be secured in this way.
A narrower version that has a longer history is the existing density-for-benefit mechanism used in Ontario, Alberta and British Columbia. The principal rationales for this mechanism are to trade infrastructure for increased density, to take a share of the value created for the community and to compensate for negative externalities such as increased traffic or blocking views and light. In Toronto, the framework created by the municipalities focuses on ward-level amenities, whereas Vancouver has used a more city-wide approach.
Land Transfer Taxation A land transfer tax is levied at the time of sale of a property and usually is calculated as a percentage of the value of the property transferred. The tax, which must be paid before the transfer is registered, is like a sales tax payable by the purchaser and is calculated as a percentage of the purchase price. A number of variations on land transfer taxes exist. For example, the tax rate sometimes increases with the value of the property; in some cases, taxes are higher on non-residents. Land transfer taxes are only levied at the municipal level in Nova Scotia, Quebec, and the City of Toronto. Municipalities in Manitoba are permitted to levy a land transfer tax but do not currently do so. Halifax Regional Municipality levies a deed transfer tax at the maximum rate of 1.5 per cent but not all municipalities in Nova Scotia levy the tax.
This tax is not a good tax for local governments as it bears no relationship to the benefits received for local services. Furthermore, it imposes a burden on those who buy property, while placing no burden on those who remain in their existing property. Not only is this tax unfair in its distributional impact, it reduces house sales and house prices and impedes household mobility. The tax also provides an incentive for those who remain in their houses to demand municipal services, knowing that they will be disproportionately paid for by future purchasers.
Shared Tax Field Earmarking
Earmarking revenues from a shared tax field is typically administered through reserve funds. The advantage of such an approach is that it provides a close link between services provided by a capital asset and taxes to finance the asset — potentially providing a boost in public support. However, there are some issues in situations where funds are channeled into activities that do not have high public priorities, and that the earmarking may connect expenditures with revenue sources in illogical ways.
This approach presents similar shortcomings to conditional grants in that it may distort local preferences and provide wrong incentives for efficient behaviour. The principal advantage of earmarking revenues from a shared tax field is likely to be political acceptability. 2 However, there is little consensus that sharing a piggybacked tax is entirely an appropriate local tax.
Tax Increment Financing
In some provinces, variations on the U.S. experience with tax increment financing (TIF) are permitted. In general, the American model defines an area, usually in need of brownfield remediation and city center revitalization and infilling. The local tax revenue is divided into two categories, either derived from 1) pre-assessed development or 2) the increased assessed value. The revenues are then typically dedicated to the servicing of debt incurred to upgrade infrastructure. The critique of TIF is centered on US experience. Primarily, the evidence that development would not have taken place but for the assistance provided is weak. The targeting may be at the expense of overall development in the municipality and the revenues can impair the finances of other taxing bodies that share in the targeted areas’ tax base, depending on whether the grantor has an exclusive right to the incremental revenue.
1. For example, Ontario has provided authority to use development charges to finance a subway extension into York Region, adjusting the level of services rules used in the calculation of the rates. See http://www.ontario.ca/laws/regulation/070192 accessed September 19, 2015.
2. For example, Kitchen suggests ranging the provincial gasoline tax and provincial diesel fuel tax by the rate of CPI increase since 1992, when the current excise tax rates were set at 14.7 cents per litre and 14.3 cents per litre respectively and continue as an indexed excise tax, earmarked for transportation infrastructure in Harry Kitchen, “A Case for Increasing Provincial Fuel Taxes (on a Temporary Basis),” Research Study, Toronto: Residential and Civil Construction Alliance of Ontario (RCCAO) (2015)page 11.
26
APPENDIX B: SOURCES FOR MUNICIPAL BORROWING RULES
British Columbia (accessed on 24/07/2015):http://www.bclaws.ca/civix/document/id/complete/statreg/254_2004/search/CIVIX_DOCUMENT_ROOT_STEM:(community%20charter)%20AND(community%20OR%20charter%20OR%20debt%20OR%20limit)%20AND%20CIVIX_DOCUMENT_ANCESTORS:statreg?30#hit1 and
http://www.bclaws.ca/civix/document/id/complete/statreg/vanch_06/search/CIVIX_DOCUMENT_ROOT_STEM:(Vancouver%20debt%20limits)%20AND%20CIVIX_DOCUMENT_ANCESTORS:statreg?4#hit1
Alberta (accessed 22/07/2015): http://www.acfa.gov.ab.ca/loan-form-script/dlw_index.html and
http://www.qp.alberta.ca/documents/Regs/2000_255.pdf
Saskatchewan (accessed on 24/07/2015):http://www.smb.gov.sk.ca/local_government.htm
Manitoba (accessed on 23/07/2015):http://www.winnipeg.ca/finance/files/debtstrategy2011.pdf and
http://brandon.ca/images/pdf/governancePolicies/capitalAcquisition_DebtMgt.pdf
Ontario (accessed 22/07/2015):http://www.ontario.ca/laws/regulation/020403?search=municipal+act and
http://www1.toronto.ca/City%20Of%20Toronto/Corporate%20Finance/Debt/Files/pdf/C/capitalworksfinancing.pdf
Quebec (accessed (17/09/2015)https://www.canlii.org/en/qc/laws/stat/cqlr-c-d-7/latest/cqlr-c-d-7.html
New Brunswick (accessed 22/07/2015):https://www.canlii.org/en/nb/laws/stat/rsnb-1973-c-m-22/latest/rsnb-1973-c-m-22.html
Nova Scotia (accessed 22/07/2015): http://www.novascotia.ca/dma/pdf/mun-local-government-resource-handbook-3-4.pdf
Newfoundland and Labrador (22/07/2015): http://www.assembly.nl.ca/legislation/sr/statutes/m24.htm#94_
North-West Territories (22/07/2015): https://www.justice.gov.nt.ca/en/files/legislation/cities-towns-and-villages/cities-towns-and-villages.r11.pdf
Yukon (22/07/2015): http://www.gov.yk.ca/legislation/acts/municipal_c.pdf

27
About the Authors
Almos T. Tassonyi is the Executive Fellow and Director of the Urban Policy Program at The School of Public Policy, University of Calgary and an Adjunct Professor of Economics, Ryerson University. He is an Adjunct Lecturer, Department of Geography and Planning, University of Toronto, and a Research Associate at the International Property Tax Institute. He has co-authored a book on property tax reform and authored journal articles and chapters in several books on municipal budgeting, property taxation and fiscal decentralization. He has lectured on local government finance and tax reform in China, India and Hungary working with the World Bank, the Asian Development Bank, the Forum of Federations and the Canadian Urban Institute. Dr. Tassonyi holds a PhD in economics from the University of Calgary, an MSc in Economic History from the London School of Economics and a bachelor’s and master’s degree in Economics and Economic History from the University of Toronto.
Brian W. Conger, MPP, is a Research Associate with the Urban Policy Program at the University of Calgary’s School of Public Policy. A practising community planner, Brian has over six years of comprehensive statutory planning and land development experience across Western Canada. His academic interests centre on intergovernmental equity, intermunicipal competition and the scale of governance in urban and regional systems. Brian received his Master of Public Policy from The School of Public Policy in 2013.
28
ABOUT THE SCHOOL OF PUBLIC POLICY
The School of Public Policy will become the flagship school of its kind in Canada by providing a practical, global and focused perspective on public policy analysis and practice in areas of energy and environmental policy, international policy and economic and social policy that is unique in Canada.
The mission of The School of Public Policy is to strengthen Canada’s public service, institutions and economic performance for the betterment of our families, communities and country. We do this by:
• Building capacity in Government through the formal training of public servants in degree and non-degree programs, giving the people charged with making public policy work for Canada the hands-on expertise to represent our vital interests both here and abroad;
• Improving Public Policy Discourse outside Government through executive and strategic assessment programs, building a stronger understanding of what makes public policy work for those outside of the public sector and helps everyday Canadians make informed decisions on the politics that will shape their futures;
• Providing a Global Perspective on Public Policy Research through international collaborations, education, and community outreach programs, bringing global best practices to bear on Canadian public policy, resulting in decisions that benefit all people for the long term, not a few people for the short term.
Our research is conducted to the highest standards of scholarship and objectivity. The decision to pursue research is made by a Research Committee chaired by the Research Director and made up of Area and Program Directors. All research is subject to blind peer-review and the final decision whether or not to publish is made by an independent Director.
The School of Public PolicyUniversity of Calgary, Downtown Campus906 8th Avenue S.W., 5th FloorCalgary, Alberta T2P 1H9Phone: 403 210 3802
DISTRIBUTIONOur publications are available online at www.policyschool.ca.
DISCLAIMERThe opinions expressed in these publications are the authors' alone and therefore do not necessarily reflect the opinions of the supporters, staff, or boards of The School of Public Policy.
COPYRIGHTCopyright © 2015 by The School of Public Policy. All rights reserved. No part of this publication may be reproduced in any manner whatsoever without written permission except in the case of brief passages quoted in critical articles and reviews.
ISSN1919-112x SPP Research Papers (Print) 1919-1138 SPP Research Papers (Online)
DATE OF ISSUENovember 2015
MEDIA INQUIRIES AND INFORMATIONFor media inquiries, please contact Morten Paulsen at 403-220-2540. Our web site, www.policyschool.ca, contains more information about The School's events, publications, and staff.
DEVELOPMENTFor information about contributing to The School of Public Policy, please contact Rachael Lehr by telephone at 403-210-7183 or by e-mail at [email protected].
29
RECENT PUBLICATIONS BY THE SCHOOL OF PUBLIC POLICY
REFLECTIONS ON CALGARY'S SPATIAL STRUCTURE: AN URBAN ECONOMIST’S CRITIQUE OF MUNICIPAL PLANNING IN CALGARYhttp://policyschool.ucalgary.ca/?q=content/reflections-calgarys-spatial-structure-urban-economist%E2%80%99s-critique-municipal-planning-calgaryRichard Arnott | October 2015
MACROPRUDENTIAL POLICY: A REVIEWhttp://policyschool.ucalgary.ca/?q=content/macroprudential-policy-reviewAlfred Lehar and Mahdi Ebrahimi Kahou | October 2015
AN ENERGY STRATEGY FOR CANADAhttp://policyschool.ucalgary.ca/?q=content/energy-strategy-canadaMichal Moore | October 2015
TAXING STOCK OPTIONS: EFFICIENCY, FAIRNESS AND REVENUE IMPLICATIONShttp://policyschool.ucalgary.ca/?q=content/taxing-stock-options-efficiency-fairness-and-revenue-implicationsJack Mintz and Balaji Venkatachalam | October 2015
WHAT DO WE KNOW ABOUT IMPROVING EMPLOYMENT OUTCOMES FOR INDIVIDUALS WITH AUTISM SPECTRUM DISORDER?http://policyschool.ucalgary.ca/?q=content/what-do-we-know-about-improving-employment-outcomes-individuals-autism-spectrum-disorderCarolyn Dudley, David Nicholas and Jennifer Zwicker | September 2015
CANADA, THE LAW OF THE SEA TREATY AND INTERNATIONAL PAYMENTS: WHERE WILL THE MONEY COME FROM?http://policyschool.ucalgary.ca/?q=content/canada-law-sea-treaty-and-international-payments-where-will-money-comeWylie Spicer | September 2015
THE IMPACT OF CONVERTING FEDERAL NON-REFUNDABLE TAX CREDITS INTO REFUNDABLE CREDITShttp://policyschool.ucalgary.ca/?q=content/impact-converting-federal-non-refundable-tax-credits-refundable-creditsWayne Simpson and Harvey Stevens | August 2015
HOW IS FUNDING MEDICAL RESEARCH BETTER FOR PATIENTS?http://policyschool.ucalgary.ca/?q=content/how-funding-medical-research-better-patientsJ.C. Herbert Emery and Jennifer Zwicker | August 2015
SYMPOSIUM ON THE TRANS-PACIFIC PARTNERSHIP AND BEYOND: ADVANCING CANADIAN TRADE AND INVESTMENT IN ASIAhttp://policyschool.ucalgary.ca/?q=content/symposium-trans-pacific-partnership-and-beyond-advancing-canadian-trade-and-investment-asiaRandolph Mank | August 2015
EXTRACTIVE RESOURCE GOVERNANCE: CREATING MAXIMUM BENEFIT FOR COUNTRIEShttp://policyschool.ucalgary.ca/?q=content/extractive-resource-governance-creating-maximum-benefit-countriesShantel Jordison | July 2015
THE RECESSION'S IMPACT ON CANADA'S LABOUR MARKEThttp://policyschool.ucalgary.ca/?q=content/recessions-impact-canadas-labour-marketPhilip Cross | July 2015
ALTERNATIVES TO CRIMINALIZING PUBLIC INTOXICATION: CASE STUDY OF A SOBERING CENTRE IN CALGARY, ABhttp://policyschool.ucalgary.ca/?q=content/alternatives-criminalizing-public-intoxication-case-study-sobering-centre-calgary-abAlina Turner | June 2015
CANADA-MEXICO TRADE: AN ARRANGED MARRIAGE COMES OF AGEhttp://policyschool.ucalgary.ca/?q=content/canada-mexico-trade-arranged-marriage-comes-ageLaura Dawson | June 2015