Embed Size (px)
Citation preview

Int J Environ Sci Nat Res 25(3): IJESNR.MS.ID.556164 (2020) 00104
Abstract
This study assessed current and historic land use, land cover (LULC) dynamics and the level of urbanization in Wolaita Sodo and its peripheries since 1985 up to 2016. Thus, it’s aimed to offer an increased understanding of the growing dynamics of land use changes in relation to the level of urbanization. The study primarily employed advanced technologies like GIS and RS to collect and analyze accurate and reliable information. In addition, survey questionnaire was used to gather quantitative and qualitative data from 200 respondents and then linear regression model and descriptive analysis was done by using SPSS v.21 software. The study showed that the area under forestland, bare land, grassland and cropland were declined while the area under built-up area was increased. The spatial coverage of built-up area (Wolaita Sodo) increased from 8.9% in 1985 to 32% in 2016 and increased by 216.8% (8.4ha yr-1) between 1985 and 2016. In addition, linear regression analysis also showed that changes in land use were strongly correlated with population growth, except rural settlement. Particularly, the strong positive relationship between urbanization and population growth suggested that demographic and economic factors are the primary drivers of urbanization. The findings of this study possibly indicated that appropriate planning policy should be devised to manage the expansion of the urbanized area so that land is used efficiently as population grows and ensure that urban development also benefits local communities.
Keywords: Land use; Land cover dynamics; Urbanizations; Peri-urbanizations
An Exploration into LULC Dynamics and Level of Urbanization: The Case of Wolaita Sodo
City and its Peripheries
Research ArticleVolume 25 Issue 3 - August 2020DOI: 10.19080/IJESNR.2020.25.556164
Int J Environ Sci Nat ResCopyright © All rights are reserved by Barana Babiso Badesso
Barana Babiso Badesso*Department of Geography & Environmental Studies, Wolaita Sodo University, Ethiopia
Submission: July 24, 2020; Published: August 10, 2020
*Corresponding author: Barana Babiso Badesso, Department of Geography & Environmental Studies, Wolaita Sodo University, Ethiopia
Introduction
Land use land cover (LULC) is perhaps the most prominent form of global environmental change phenomenon occurring at spatial and temporal scales. The process of urbanization often leads to haphazard growth in metropolitan cities, deterioration in living conditions and worsening of environmental scenario having detrimental impacts on human health [1]. It is also expected that million hectares of productive agriculture land in the urban peripheral regions are lost due to urbanization and urban sprawl. It is, therefore, desirable to plan for the city and its peripheral areas in an integrated manner [2].
Cities started to grow quite rapidly in Europe and North America following the industrial revolution. After the Second World War and a following liberalization of global trade, cities developed from having mainly local and regional impact to becoming global drivers of environmental change through land use change [3]. The massive growth of cities in Africa, Asia and Latin America in the late twentieth century, often without any bulk infrastructure for sewerage or systems of urban regulation to protect the environment resulted in considerable urban environmental degradation [1,3]. The level of urbanization in
Africa is low (37.1%) when compared with developed countries like Europe (72.7%) and North America (79.1%). However, urbanization in the developing world in general is progressing much faster than in developed countries, which may reach 3% or even 4% a year [4]. Ethiopia is one of the least urbanized countries in the world. It has only 16% of its population living in urban centers (PCC, 2008). However, given the 2.73% total annual population growth rate, high rate of in-migration to towns, and increase in the number of urban centers, the rate of urbanization is increasing at a rate of 4.4% [5]. Furthermore, the country’s urban population is expected to grow on average by 3.98% and by 2050; about 42.1% of the total population is expected to be inhabited in urban centers [6].
In Ethiopia, previous studies on urbanization for instance study by Abdissa & Degeffa [7] indicated that the Addis Ababa city’s expansion programmes implemented in different period of time were not participatory and negatively influence the livelihood of farmers on peri-urban area. Moreover, study by Tadesse & Imana [8] on ‘prospect and challenges of urbanization on livelihood of rural communities: further found that an

How to cite this article: Barana B B. An Exploration into LULC Dynamics and Level of Urbanization: The Case of Wolaita Sodo City and its Peripheries. Int J Environ Sci Nat Res. 2020; 25(3): 556164. DOI: 10.19080/IJESNR.2020.25.5561640105
International Journal of Environmental Sciences & Natural Resources
establishment of the real estate on the area affected the livelihood of farmers by reduction of farm size holding and the community participation in planning and implementation in the programme was also negligible. Hence, unguided urbanization, like in most developing countries, negatively affects the natural environment and livelihoods in peri-urban areas [6]. This could be attributed to changes occurring in land use, water resources management, waste dumping, and increasing competition between agricultural and residential use of natural resources. As a result, urbanization could bring a dramatic increase in the concentration of poverty and environmental degradation in peri-urban zones [9]. Urban expansion in the case of Wolaita Sodo is not an exception to other Ethiopian cities but exhibits a peculiar pattern and complexity owing to its geographical setting. Therefore, the need for monitoring urban development is imperative to help curb the problems of urban sprawl and LULC dynamics.
For doing so, employing advanced technologies like Geographic Information System and Remote Sensing plays vital in providing timely, accurate and reliable information. That is why; this study applies those technologies to map the patterns of urbanization and related LULC dynamics in the study area thereby assessing its influences on natural environment and livelihoods in peri-urban areas.
Materials and Methods
Description of the study area
Geographically, the Wolaita Sodo is located between 6045’00’’N and 700’00’’N and 37035’00’’E and 37053’00’’E (Figure 1). Sodo which is established at the foot of mount Damota, currently serves as a capital of Wolaita Zone and Sodo Zuria Woreda of Wolaita Zone. The total land coverage of the Zuria Woreda (which is the third-level administrative divisions of Ethiopia) is 40805 hectares, of which 12269 ha (35.75%) is allocated for crop Production, 9067 ha (19%) for fallow land while 12019ha (30.61%) for
grazing land and 7450ha (15.025) for forest land [10]. The Sodo city covers about 82.1km2. The agro-ecology of the Woreda is dominated by midland that covers about 87% of the total area, and the remaining 13% is highland with rugged mountains and slopes [10]. The altitude of the woreda falls in the range of 1500 to 3200m.a.s.l. The climatic condition of the woreda is similar to most of the southern parts of the country. The maximum (summer) rain fall comes between June-August and the minimum (spring) rainfall is very important for agricultural activities in the woreda comes between March to May. According to the woreda agriculture office, the maximum rainfall ranges between 1200mm and 1300mm per annum. Maximum temperature also ranges between 20-250C with average minimum temperature of 10-150C. The soils throughout the area are of volcanic origin, and over a sedimentary base. Though inherently well-drained and fertile, the soils are also acidic and highly erosion-prone and as a result the agricultural areas are often highly degraded. Based on 1994 & 2007 census population size data of the city, the growth rate is computed using exponential growth rate method by using the excel sheet and resulted the population growth rate of the town to be 5.86%. This rate is greater than urban population growth rate of the region, which is 4.8%. Agriculture is the major economic activity of the Sodo and its peripheries. Potato (Solanum tuberosum L.), sweet potato (Ipomoea batatas), cassava (Manihot esculenta), yam (Dioscorea alata), banana (Musa acuminate), enset (Enset ventricosum), maize (Zea mays L.), haricot bean (Phaseolus vulgaris), teff (Eragrostis tef (Zucc.), Sorghum (Sorghumbicolor L. Moench), Pumpkin (Cucurbita pepo), broad Bean (Viciafaba L., major), Peas (Pisum sativum), Kidney Bean (Vicia faba) and Chick-pea (Cicer arietinum) are main food crops growing in the area. According to the ever existing mutual inter relation, there is a strong economic linkage between Sodo city & it’s surrounding rural Woredas. In this context Sodo is strongly interconnected with neighboring zones by the seven inlets and outlets.
Figure 1: General workflow diagram.
How to cite this article: Barana B B. An Exploration into LULC Dynamics and Level of Urbanization: The Case of Wolaita Sodo City and its Peripheries. Int J Environ Sci Nat Res. 2020; 25(3): 556164. DOI: 10.19080/IJESNR.2020.25.5561640106
International Journal of Environmental Sciences & Natural Resources
Research design, instruments and data analysis
Mixed design that supports both qualitative and quantitative approaches was applied for this research. Thus, it’s aimed to minimize the weaknesses of one method by compensating with the strengths of another due to their supplementary nature. The sampling procedure employed was a combination of purposive and random sampling techniques. The first step was purposive selection of Kebeles that are located in study areas. After identifying peri-urban zones under most pressure of urbanization, Kokate Marachare (North), Humbo Larena (East) and Wareza Kero (South West) selected purposely for field survey. The second stage was selecting households from the list of kebeles joined to the Wolaita Sodo through simple random sampling. To facilitate this final stage, a list of names of households in each selected kebele was obtained and a total of 200 households were selected proportionally from each kebeles based on the size determined.
Socio-economic data collection and analysis
In order to acquire supplementary data related to LULC change in the study area, questionnaire was designed. Then, the study area was stratified according to the existing LULC classes then ground truth data was collected from each LULC classes using the Garmin GPS 60. At least 13 well informed and experienced key informants were purposely selected with the help of development agents from the community to acquire additional information, to be used as a means of cross checking the data obtained already from the satellite images. The questions were prepared in semi structured format to get comprehensive information about the problem. To obtain secondary information different types of documents were reviewed including articles, books, journals, census data, research works (of both published and unpublished ones). Hence, to attain the objectives of the study, linear regression model and descriptive analysis was done by using SPSS software. Moreover, relevant issues collected through focus group discussion, interviews and observation methods were summarized and presented to supplement satellite image analysis of land use and land cover dynamics in the study area. In Ethiopia, the first national population census was undertaken in 1984 and since then, a census has been conducted every ten years (in 1994 and 2007). Pre-and inter-censuses periods of population of the study area were estimated using Equation 3:
(1 ).............................(1)o o rP t P G t± = + × Where:
( ) ( ).............................(2)r b d m mG R R l O= − × −
where: Po ± t is total population estimated from the previous census year to the ‘t’ next year, Po is the total population at the census year, Gr is growth rate, Rb is the birth rate at the census date, Rd is death rate at the census date, Im is inward migration rate, Om
is outward migration rate and t is the number of years after the census date.
Linear regression model
This study used linear regression analysis in which the dependent variable, namely land use types, is estimated based on the value of the independent variable, population growth. The regression model is shown in Equation 4:
.............................(3)i o j ij p ip jX X eγ β β β= + + +
where: βo is the intercept, Yi is the value of the ith case of the dependent scale variable, p is the number of the predictor, βj is the value of the ith coefficient, j=0,…p, Xij is the value of the ith case of the jth predictor, and ej is the error in the observed value.
Spatial data collection, pre-processing and analysis
The study was carried out in three phases. In the first phase satellite and collateral data were collected and processed, while during the second phase, field survey was conducted for ground truthing to perform supervised classification. The third phase included database creation and geospatial evaluation of landscape changes. ERDAS IMAGINE and ArcView computer software were used for data processing and GIS analysis. The satellite imageries with acquisition period of 1985-01-21, 2000-12-05 and 2016--respectively were downloaded from Global Land Cover Facility of the University of Maryland. The satellite data used are landsat TM and ETM+ acquired in 1985, 2000 and 2016 respectively. The TM and ETM+ satellite data are usually used for their multispectral and environmental value, because one of the intended uses was to observe land cover character as an environmental backdrop to the urban growth pattern. Pre-processing of satellite images prior to image classification and change detection is essential. Due to spatial, spectral, temporal and radiometric resolution constraints, the complexity of physical environment cannot be accurately recorded by normal remote sensing sensors. Radiometric corrections were performed for correcting the data for sensor irregularities and compensating the effects of atmosphere through histogram equalization, haze and noise reduction.
In order to substantiate the findings and detect the changes on the surface, it is necessary to use additional data including topographic maps, socio economic and environmental data, physiographic and climate data. For this study, as an ancillary data, existing land cover maps of the area, Google maps and Google Earth, and population data were integrated. Then, land sat images of each study year was independently classified with supervised classification technique. Maximum Likelihood Algorithm was applied to classify the land use and land cover types in ERDAS Imagine v.10 software. Then, the accuracy of the classification results was tested using data for accuracy assessment. Therefore, the error matrices and other statistics, which includes producers and user’s accuracy and kappa statistic, were employed to determine the accuracy of classes obtained from the image
How to cite this article: Barana B B. An Exploration into LULC Dynamics and Level of Urbanization: The Case of Wolaita Sodo City and its Peripheries. Int J Environ Sci Nat Res. 2020; 25(3): 556164. DOI: 10.19080/IJESNR.2020.25.5561640107
International Journal of Environmental Sciences & Natural Resources
classification process. Finally, post classification comparison was employed using separately classified land sat images and then a comparison was made for the LULC maps.
The areas of each land use for 1985, 2000 and 2016 were computed from Landsat images. The rate of change (r) was computed using equation 1.
2 1 100.............................(4)1
L LrL−
= ×
The flow diagram (Figure 1) summarizes the overall methods, techniques, approaches and materials used to carried out this study, so as to figure out the urban land cover changes and describe the urban spatial patterns changes in the study areas.
Results and Discussion
Characteristics and dynamics of the land-use units
Six major land-use types were identified from the satellite images (1985-2016) are forestland, grassland, bare land, cropland, settlement and built up area as indicated in Table 1 and Figure 2. The base year for the empirical analysis in the study area is 1985. This year was a period for which the first official urban-rural census has been conducted in Ethiopia. Administrative boundaries also changed since 1984. Thus, selecting 1985 as the base year could enable us to maintain the consistence of land cover changes across the years.
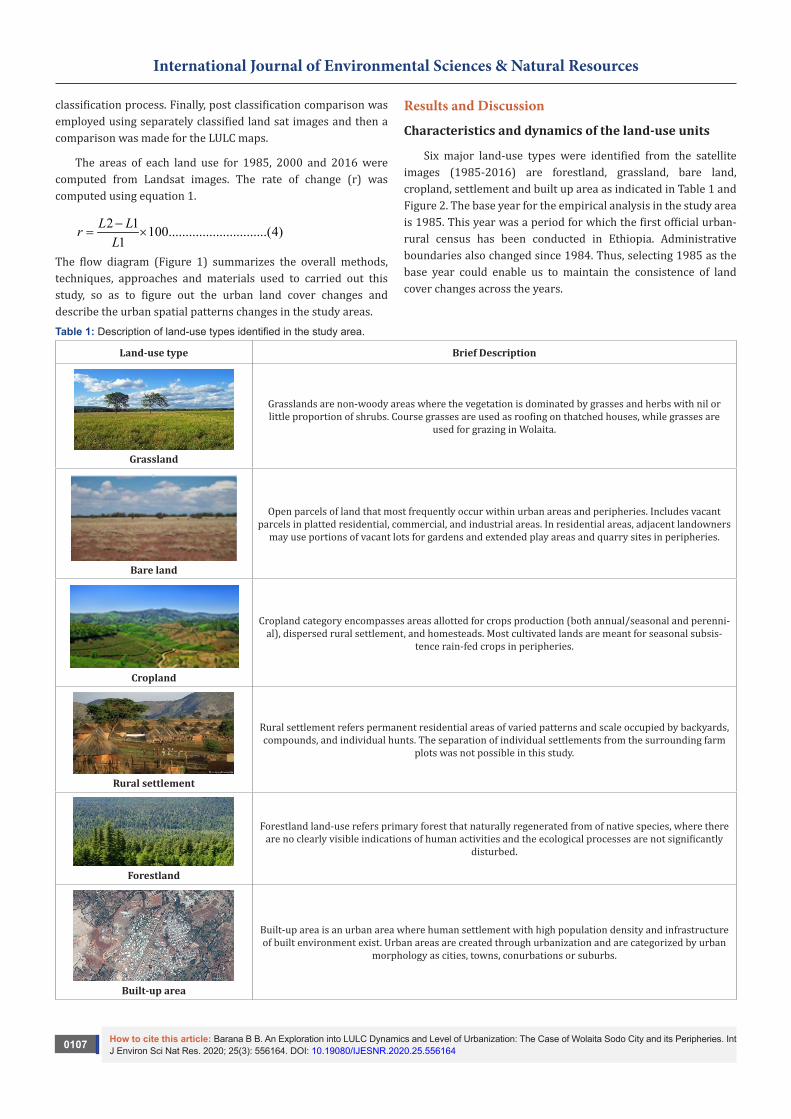
Table 1: Description of land-use types identified in the study area.
Land-use type Brief Description
Grassland
Grasslands are non-woody areas where the vegetation is dominated by grasses and herbs with nil or little proportion of shrubs. Course grasses are used as roofing on thatched houses, while grasses are
used for grazing in Wolaita.
Bare land
Open parcels of land that most frequently occur within urban areas and peripheries. Includes vacant parcels in platted residential, commercial, and industrial areas. In residential areas, adjacent landowners
may use portions of vacant lots for gardens and extended play areas and quarry sites in peripheries.
Cropland
Cropland category encompasses areas allotted for crops production (both annual/seasonal and perenni-al), dispersed rural settlement, and homesteads. Most cultivated lands are meant for seasonal subsis-
tence rain-fed crops in peripheries.
Rural settlement
Rural settlement refers permanent residential areas of varied patterns and scale occupied by backyards, compounds, and individual hunts. The separation of individual settlements from the surrounding farm
plots was not possible in this study.
Forestland
Forestland land-use refers primary forest that naturally regenerated from of native species, where there are no clearly visible indications of human activities and the ecological processes are not significantly
disturbed.
Built-up area
Built-up area is an urban area where human settlement with high population density and infrastructure of built environment exist. Urban areas are created through urbanization and are categorized by urban
morphology as cities, towns, conurbations or suburbs.

How to cite this article: Barana B B. An Exploration into LULC Dynamics and Level of Urbanization: The Case of Wolaita Sodo City and its Peripheries. Int J Environ Sci Nat Res. 2020; 25(3): 556164. DOI: 10.19080/IJESNR.2020.25.5561640108
International Journal of Environmental Sciences & Natural Resources
Figure 2: Land use type in the study area (1985-2016).
Cropland
Cropland is the predominant type of land-use in the study period (1985-2016) (Figure 2). It covered an enormous part of the area in its Central, Southern, Southeastern and Southwestern parts in the first period (1985 and 2000). However, it expanded into the Northern and Northeastern parts of the area in the second period (2000-2016). In these areas, marginal and grazing
land had turned into farmland. The area under cropland showed persistent decrease over the period under study (Figure 3 & 4). The area under cropland decreased by about 3.7% between 1985 and 2000 (2.9ha yr-1) and by 24% (17.3ha yr-1) between 2000 and 2016. During the entire period (1985-2016), the decrease was 26.9% (10.4ha yr-1). This decrease was attributed to population growth, urban expansion and land degradation.
Figure3: Land use change in the study area (1985-2016).
With regard to spatial coverage, crop cultivation is practiced on land ranging from gentle to very steep hillsides. Although different types of crops are cultivated, the most predominant one is Enset farming. Enset cultivation requires less land than cereal agriculture to cover families’ food demand. An Enset
system is a resilient system and tolerates a considerable degree of moisture loss. Maize is also widely cultivated because of its high potential photosynthetic rates, fast growing, efficient water use, and its capacity to withstand the dry condition. Another reason for the much wider cultivation of this crop is its lesser

How to cite this article: Barana B B. An Exploration into LULC Dynamics and Level of Urbanization: The Case of Wolaita Sodo City and its Peripheries. Int J Environ Sci Nat Res. 2020; 25(3): 556164. DOI: 10.19080/IJESNR.2020.25.5561640109
International Journal of Environmental Sciences & Natural Resources
labour requirement. Farmers prefer to cultivate crops that have lesser labour requirement in areas where the risk of drought is higher. In almost all cases maize is cultivated mixed with crops such as enset, haricot beans (Phaseolus vulgare), and root crops (Zea mays). The primary objective of mixed cropping is to increase the variety and quantity of food produced in the short growing season. Mixing crops also aimed at improving the soil fertility, reducing the risk of total crop failure and increasing their income. These are planted on a very small portion of the arable land. Most of cultivated lands are treated with indigenous soil conservation measures, comprising agronomic, structural and biological measures. Agroforestry is also another important component of the farming system. The conservation measures were developed with the intention of controlling erosion and conserving moisture.
Forestland
This category includes natural forest and plantations (Table 1). These two land use types were combined into one category because it was too difficult to identify plantations from natural forests. Hence for practical reasons the two land use types were merged into one category. Forestland was the second largest land-use in 1985 (22.9%) and 2000 (22.8%) next to cropland (Figure 2). However, foreland was replaced by built-up area in 2016 as a second largest land use (32.3%). During the 31-years period, forestland decreased by 26.3% (5ha yr-1) (Figure 3 & 4). Nevertheless, the loss in areas of forestland has showed variation among the study periods. For instance, between 1985 and 2000
the area of cropland decreased by 0.6% (0.24ha yr-1), while it decreased by 25.8% between 2000 and 2016 (9.4ha yr-1). The loss in forestland was attributed to rapid population growth, which resulted in extensive forest clearing for agricultural use, overgrazing and exploitation of existing forests for fuel wood, fodder and construction materials. The prevalence of deforestation also linked rapid urban expansion. This in turn resulted in massive environmental degradation and posed serious threat to sustainable agriculture and forestry. To reduce these problems, rural afforestation and conservation programs on crop and bare lands have been practiced in the area for the past three decades. Woreda administration in collaboration with Wolaita Sodo University and other governmental and non-governmental organizations have made efforts to implement agroforestry and community tree planting programs. Tree planting and soil conservation programs on the highlands (Damota Mountian) were particularly promoted. The objective of these programs was
a) to meet the needs of fuel wood, construction materials and fodder from trees planted on bare lands and hill sides;
b) to minimize degradation of soil resources and enhance productivity of agricultural lands and
c) to minimize the burden from the remaining natural forests and to protect biodiversity. Despite such large commitments, success in tree planting and conservation has been limited in the study area.
Figure 4: Land-use classification of the study area since 1985, 2000 & 2016 from right to left.
Built-up area
Built-up area in the study refers Wolaita Sodo (Table 1). The spatial coverage of built-up area (Wolaita Sodo) increased
to from 8.9% in 1985 to 32% in 2016 (Figure 2). As a result, built-up area constitutes the second largest land use type in the study area next to cropland. The areal extent of Wolaita Sodo has increased by 216.8% (8.4ha yr-1) between 1985 and 2016.

How to cite this article: Barana B B. An Exploration into LULC Dynamics and Level of Urbanization: The Case of Wolaita Sodo City and its Peripheries. Int J Environ Sci Nat Res. 2020; 25(3): 556164. DOI: 10.19080/IJESNR.2020.25.5561640110
International Journal of Environmental Sciences & Natural Resources
The rate of urban expansion varied from time to time. Between 1985 and 2000, the town was expanded by 54% (8.3ha yr-1) and 134.6% (29.7ha yr-1) between 2000 and 2016 (Figure 3 & 4). This makes Wolaita Sodo the fastest expanding land-use in Sodo and its peripheries, especially in the past two decades. Perhaps Sodo was the only urban area in Wolaita until 1970s. The town has been expanding mainly towards the southern direction, while its expansion to other directions is restricted by hills and mountain (Damota Mountain). The mountain is known to be the source of streams, springs and other water sources for the surrounding area. Despite threatening environmental resources, Wolaita Sodo will continue to rapidly urbanize the surrounding rural Kebeles (the smallest administrative unit in Ethiopia) with different spatial patterns and development dynamics from north to south directions. Future urban land expansion will continue to take place on prime agricultural lands, which are mainly concentrated in East, Northeast and West of Wolaita Sodo. We observed total cropland losses of 27% due to urban expansion with in three decades. As urban areas expand, farmers at the peri-urban area could experience greater competition for water and increased vulnerability to climate hazards.
Grassland, bare land and rural settlement
The area under grassland was decreased by 20% (3.56ha yr-
1) between 1985 and 2000, and 11% (1.48ha yr-1) between 2000 and 2016 (Figure 3 & 4). Overall, during the study period (1985-2016), the area of grassland was decreased by 28.8% (2.48ha yr-
1). Afforestation, agriculture, urban expansion and stock farming are the causes of degradation of grassland biodiversity. The areal coverage of bare land showed persistent decline during the study period. It was decreased by 11.7% (0.78ha yr-1) between 1985 and 2000, and by 27.5% (1.59ha yr-1) between 2000 and 2016. The overall decrease of bare land accounted for 36% (1.22ha yr-1). The diminishing of those land-uses was ascribed to the removal of plants and bare lands for farmland preparation, fuel wood, construction, urban expansion, charcoal preparation, and tradition farm equipment. Rural settlement was decreased by 6% (0.73ha yr-1) between 1985 and 2000, whereas it was increased by 0.7% (0.08ha yr-1) between 2000 and 2016. Overall, the areal coverage of rural settlement showed decreasing trend and decreased by 5.4% (0.31ha yr-1) between 1985 and 2016.
Analysis of socio-economic data
The demographic characteristics of the sampled households revealed that a proportion of 71.5% of were males while 28.5% of them were females. The age category of respondents was identified as between 22-35 years as the lowest and 66 years or more as the highest age cohorts, at 10 years interval respectively. Most of the respondents however emanated from the 36-45 age cohort; the category that can best be described as the working and middle-aged group. The highest level of educational attainments of the respondents was Vocational and senior-secondary education. However, the majority of respondents with 50.4% were those
without any formal education. Most of the households 43.7% had household sizes of between 1-5 people, sharing common dwelling and make common provision for food or other essentials for living [11]. The major occupation in the communities was farming with 70.8%. The next most important vocation was trading, including food vending at 20% each of the respondents. Only 9% were employees of the public and civil service as per the samples from the various communities. This can be generalized for the entire district. Some of these socio-demographic data are the respondents’ disposition and bearing on the peri-urban land use change patterns.
The main causes of peri-urbanization in the Sodo district were identified among the respondents from the entire 3 representative Kebeles’ as follows; those that are driven by population and infrastructure expansion; ostensibly for residential purposes; and the perceived availability of social amenities that attract people for settlement into the area. The majority of the respondent (50%) indicated that the increasing physical infrastructure in the area, which has occurred as a result of population influx from the main urban areas of Wolaita Sodoships are the main drivers. Others were of the view that easy access to land through poor land administration practices constitutes the main driver of a pull factor attracting potential residential developers into the district to acquire land for building purposes. This was delivered with a response rate of 31%. Some respondents (19%) also indicated that the rate of peri-urbanization is caused by the presence of social amenities such as schools, clinics and potable water, among others, as the attracting medium for people to settle in the area.
The main causes of urban growth are population growth, economic growth, industrialization, land hunger attitude, living and property cost, lack of affordable housing, demand of more living space, government development policies, lack of proper planning policies and housing investment. According to Seto et al. [12] the magnitude and rate of urban land expansion are influenced by macro and micro factors. The macro factors include income, economic development, and population growth, while micro and regional factors include land use policies, the informal economy, capital flows, and transportation costs. Other studies also highlighted that there is potential competition for land between agriculture and urban uses [13-15]. As a result, high rates of urban expansion over the last three decades have resulted in the loss of cropland all around the world. However, agriculture remains a crucial economic sector in terms of income generation, percentage of total national gross domestic product (GDP), and employment source in many developing countries.
Population and demographic dynamics in study area
Wolaita has been always associated with high population pressures, dense settlement and crowded market [16]. Figure 5 showed number of populations, which was increased by 28% within a decade (between 2002 and 2016). This means population of the study area increased by 2.8% per year. This suggested the

How to cite this article: Barana B B. An Exploration into LULC Dynamics and Level of Urbanization: The Case of Wolaita Sodo City and its Peripheries. Int J Environ Sci Nat Res. 2020; 25(3): 556164. DOI: 10.19080/IJESNR.2020.25.5561640111
International Journal of Environmental Sciences & Natural Resources
growth rate has been very high in comparison with national figure (2.4%). This may be attributed to natural growth, migration from the surrounding rural areas and other parts of the country. People migrate to Sodo derived by better economic opportunities in urban areas or lack of prospects in their home farms or village. This type of migration is common in different areas of the country and chose to dwell in peripheries. Migration from the other parts
of the country may also be attributed to the launching of Wolaita Sodo University, which has been functional since 2007. The university has been served as the main source of employment for population from different parts of the country. Similarly, number of household head increased by 25% (2.5% per year) in the past decade (Figure 5).
Figure 5: Population and demographic dynamics in study area.
Relationship between land use change and population growth
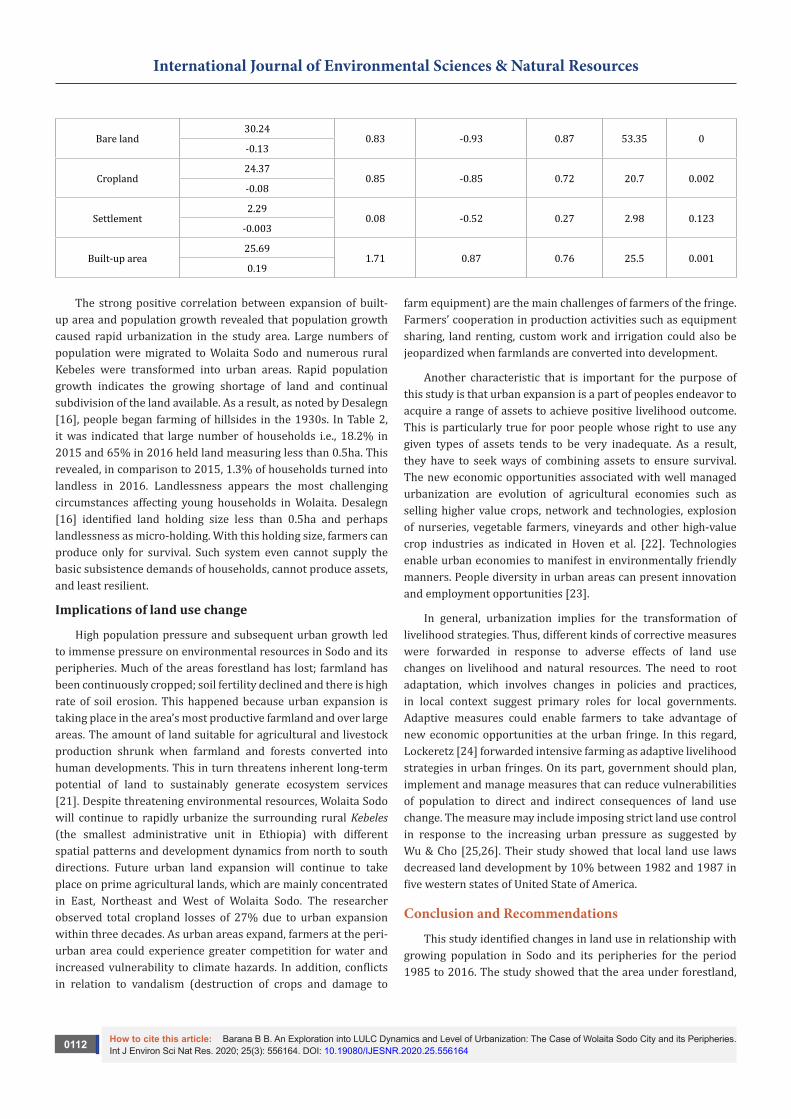
High population pressure may be resulted into immense pressure on natural resources. Results derived from regression analysis indicated that changes in land use are correlated with population growth (Table 2). There were strong relationship between population growth and land use changes in forestland (R2=0.80; P<0.05), grassland (R2=0.72; P<0.05), bare land (R2=0.87; P<0.005), cropland (R2=0.72; P<0.005) and built-up area (R2=0.76; P<0.005). However, population growth and change in area of rural settlement were not correlated (R2=0.17; P<0.005). This is due to the fact that rural settlements located in the urban fringe were encroached by urban expansion. A significant relationship between population growth and change of natural resources such as forestland, grassland and bare lands
showed that demographic pressure forced farm households to shift to permanent cultivation. This has led to the expansion of cultivated land through conversion of natural resources with damaging environmental and economic consequences. The dominant sources of livelihood of local community are cropping and livestock rearing. This is explained by strong correlation between decline cropland and population growth. As a result, there are large dependencies of farmers on farming. This circumstance is in agreement with studies conducted in other regions [17-20]. In addition, interviewed government officials and residents responded that high population has led to shortage of land resources and subsequent continuous cropping of farmland. As a result, all lands (including grazing land and bare land) were turned into farmland, which in turn contributed to land degradation, increasing poverty and food insecurity.
Table 2: Results of regression model, where population growth is independent variable and land uses are dependent variables.
Land useUnstandardized Coefficients
Standardized Beta R2 F Sig.B S.E
Forestland 14.16
0.43 -0.89 0.8 33 0-0.05
Grassland 5.47
0.19 -0.86 0.74 22.72 0.001-0.02
How to cite this article: Barana B B. An Exploration into LULC Dynamics and Level of Urbanization: The Case of Wolaita Sodo City and its Peripheries. Int J Environ Sci Nat Res. 2020; 25(3): 556164. DOI: 10.19080/IJESNR.2020.25.5561640112
International Journal of Environmental Sciences & Natural Resources
Bare land 30.24
0.83 -0.93 0.87 53.35 0-0.13
Cropland 24.37
0.85 -0.85 0.72 20.7 0.002-0.08
Settlement 2.29
0.08 -0.52 0.27 2.98 0.123-0.003
Built-up area25.69
1.71 0.87 0.76 25.5 0.0010.19
The strong positive correlation between expansion of built-up area and population growth revealed that population growth caused rapid urbanization in the study area. Large numbers of population were migrated to Wolaita Sodo and numerous rural Kebeles were transformed into urban areas. Rapid population growth indicates the growing shortage of land and continual subdivision of the land available. As a result, as noted by Desalegn [16], people began farming of hillsides in the 1930s. In Table 2, it was indicated that large number of households i.e., 18.2% in 2015 and 65% in 2016 held land measuring less than 0.5ha. This revealed, in comparison to 2015, 1.3% of households turned into landless in 2016. Landlessness appears the most challenging circumstances affecting young households in Wolaita. Desalegn [16] identified land holding size less than 0.5ha and perhaps landlessness as micro-holding. With this holding size, farmers can produce only for survival. Such system even cannot supply the basic subsistence demands of households, cannot produce assets, and least resilient.
Implications of land use change
High population pressure and subsequent urban growth led to immense pressure on environmental resources in Sodo and its peripheries. Much of the areas forestland has lost; farmland has been continuously cropped; soil fertility declined and there is high rate of soil erosion. This happened because urban expansion is taking place in the area’s most productive farmland and over large areas. The amount of land suitable for agricultural and livestock production shrunk when farmland and forests converted into human developments. This in turn threatens inherent long-term potential of land to sustainably generate ecosystem services [21]. Despite threatening environmental resources, Wolaita Sodo will continue to rapidly urbanize the surrounding rural Kebeles (the smallest administrative unit in Ethiopia) with different spatial patterns and development dynamics from north to south directions. Future urban land expansion will continue to take place on prime agricultural lands, which are mainly concentrated in East, Northeast and West of Wolaita Sodo. The researcher observed total cropland losses of 27% due to urban expansion within three decades. As urban areas expand, farmers at the peri-urban area could experience greater competition for water and increased vulnerability to climate hazards. In addition, conflicts in relation to vandalism (destruction of crops and damage to
farm equipment) are the main challenges of farmers of the fringe. Farmers’ cooperation in production activities such as equipment sharing, land renting, custom work and irrigation could also be jeopardized when farmlands are converted into development.
Another characteristic that is important for the purpose of this study is that urban expansion is a part of peoples endeavor to acquire a range of assets to achieve positive livelihood outcome. This is particularly true for poor people whose right to use any given types of assets tends to be very inadequate. As a result, they have to seek ways of combining assets to ensure survival. The new economic opportunities associated with well managed urbanization are evolution of agricultural economies such as selling higher value crops, network and technologies, explosion of nurseries, vegetable farmers, vineyards and other high-value crop industries as indicated in Hoven et al. [22]. Technologies enable urban economies to manifest in environmentally friendly manners. People diversity in urban areas can present innovation and employment opportunities [23].
In general, urbanization implies for the transformation of livelihood strategies. Thus, different kinds of corrective measures were forwarded in response to adverse effects of land use changes on livelihood and natural resources. The need to root adaptation, which involves changes in policies and practices, in local context suggest primary roles for local governments. Adaptive measures could enable farmers to take advantage of new economic opportunities at the urban fringe. In this regard, Lockeretz [24] forwarded intensive farming as adaptive livelihood strategies in urban fringes. On its part, government should plan, implement and manage measures that can reduce vulnerabilities of population to direct and indirect consequences of land use change. The measure may include imposing strict land use control in response to the increasing urban pressure as suggested by Wu & Cho [25,26]. Their study showed that local land use laws decreased land development by 10% between 1982 and 1987 in five western states of United State of America.
Conclusion and Recommendations
This study identified changes in land use in relationship with growing population in Sodo and its peripheries for the period 1985 to 2016. The study showed that the area under forestland,

How to cite this article: Barana B B. An Exploration into LULC Dynamics and Level of Urbanization: The Case of Wolaita Sodo City and its Peripheries. Int J Environ Sci Nat Res. 2020; 25(3): 556164. DOI: 10.19080/IJESNR.2020.25.5561640113
International Journal of Environmental Sciences & Natural Resources
bare land, grassland and cropland were declined while the area under built-up area was increased. Urbanization is the most irreversible and human dominated form of land use in the area. Some of the socio-demographic data are of relevance to the respondents’ disposition and bearing on the peri-urban land use change patterns. Thus, linear regression analysis showed that changes in land use were strongly correlated with population growth. Particularly, the strong positive relationship between urbanization and population growth suggested that demographic and economic factors are the primary drivers of urbanization. Urban expansion is taking place on key agricultural land. Based on data reported in this work and that available in literature, urban expansion is inevitable in the future. Therefore, urban planning should be prepared in such a way that incorporates the land less farmers living in the urban fringe. In addition, to curtail the continuous degradation of land that appears to be underway, the study suggests restricting zoning regulations contribute to sprawl by limiting population densities and separating land uses.
Acknowledgment
The authors gratefully acknowledge support from Wolaita Sodo university. We are also immensely grateful to communities and field assistants to access and collect field data. We hereby declare that all the information and statements made in this research are true and accept that any misinterpretation contained in it may be our obstructions.
References1. Pieterse E (2008) City Futures: Confronting the Crisis of Urban
Development. Zed: London.
2. Pathan SK, Shukla VK, Patel RG, Mehta KS (1991) Urban Land use Mapping- A case study of Ahmadabad city and its Environs. Journal of Indian Society of Remote Sensing 19(2): 95-112.
3. Marcotullio PJ, McGranahan G (2007) Scaling Urban Environmental Challenges: From Local to Global and Back. Earthscan, London, UK.
4. Soubbotina PT (2004) Beyond Economic Growth: An Introduction to Sustainable Development. World Bank. p. 205.
5. Ministry of Finance and Economic Development (2006) Ethiopia: Building on Progress. A Plan for Accelerated and Sustained Development to End Poverty (PASDEP) (2005/06-2009/10). Volume I: Addis Abeba, Ethiopia.
6. UN-Habitat (2010) State of the World Cities 2010/2011: Bridging the Urban Divide. United Nations Human Settlements Programme, Nairobi, Kenya.
7. Abdissa F, Degefa T (2011) Urbanization and Changing Livelihoods: The Case of Farmers’ Displacement in the Expansion of Addis Ababa. In: Teller C, Assefa Hailemariam (Eds.), The Demographic Transition and Development in Africa. Springer, Dordrecht.
8. Tadesse E, Imana G (2017) Prospects and Challenges of Urbanization on the Livelihood of Farming Community Surrounding Finfinne. ARJHSS 3(1): 1-15.
9. Marshall F, Waldman L, MacGregor H, Mehta L, Randhawa P (2009) On the Edge of Sustainability: Perspectives on Peri-urban Dynamics, STEPS Working Paper 35, Brighton: STEPS Centre.
10. Wolaita Zone Finance and Economic Development Office Report (2015).
11. United Nations Demographic Yearbook (2004) Annual mid-year population, United Nations estimates.
12. Seto KC, Sánchez-Rodríguez R, Fragkias M (2010) The new geography of contemporary urbanization and the environment. Annu Rev Environ Resour 35(1): 167-194.
13. Chen J (2007) Rapid urbanization in China: A real challenge to soil protection and food security. Catena 69(1): 1-15.
14. Bagan H, Yamagata Y (2014) Land-cover change analysis in 50 global cities by using a combination of Landsat data and analysis of grid cells. Environ Res Lett 9(6): 64015.
15. Thebo AL, Drechsel P, Lambin EF (2014) Global assessment of urban and peri-urban agriculture: Irrigated and rainfed croplands. Environ Res Lett 9(11): 114002.
16. Desalegn R (2007) Development Interventions in Wolaita, 1960s-2000s: A critical Review. FSS Monograph No.4, Addis Ababa, Ethiopia.
17. Adugna A, Abegaz A, Legass AD, Antille L (2017) Random and systematic land-cover transitions in north-eastern Wollega, Ethiopia. Bois et forêts d es tropiques 332(2): 113
18. Babiso B, Toma S, Bajigo A (2016) Land use/Land Cover Dynamics and its Implication on SLM in Wallecha Watershed, Southern Ethiopia. Global Journal of Science Frontier Research 16(4): 49-63.
19. Aklile Y, Beyene F (2014) Examining drivers of land use change among pastoralists in eastern Ethiopia. Journal of Land Use Science 9(4): 402-413.
20. Ningal N, Harteminka AE, Bregt AK (2008) Land use change and population growth in the Morobe Province of Papua New Guinea between 1975 and 2000. Journal of Environmental Management 87(1): 117-124.
21. Liebig A, Herrick E, Archer W, Dobrowolski J, Duiker W, et al. (2017) Aligning Land Use with Land Potential: The Role of Integrated Agriculture. Agric Environ Lett 2(1): 1-5.
22. Hove M, Ngwerume ET, Muchemwa C (2013) The Urban Crisis in Sub-Saharan Africa: A Threat to Human Security and Sustainable Development. Stability 2(1): 1-14
23. Bren d’Amoura C, Reitsma F, Baiocchi G, Barthel S, Güneralp B, et al. (2016) Future urban land expansion and implications for global croplands. PNAS. Special Feature 114(34): 8939-8944.
24. Lockeretz, W (1988) Urban influences on the amount and structure of agriculture in the North–Eastern United States. Landscape and Urban Planning 16(3): 229-244.
25. Wu J, Cho SH (2007) The effect of local land use regulations on urban development in the western United States. Regional Science and Urban Economics 37(1): 69-86.
26. Wu J (2008) Land Use Changes: Economic, Social and Environmental Impacts. Choices 23(4): 6-10.

How to cite this article: Barana B B. An Exploration into LULC Dynamics and Level of Urbanization: The Case of Wolaita Sodo City and its Peripheries. Int J Environ Sci Nat Res. 2020; 25(3): 556164. DOI: 10.19080/IJESNR.2020.25.5561640114
International Journal of Environmental Sciences & Natural Resources
Your next submission with Juniper Publishers will reach you the below assets
• Quality Editorial service• Swift Peer Review• Reprints availability• E-prints Service• Manuscript Podcast for convenient understanding• Global attainment for your research• Manuscript accessibility in different formats
( Pdf, E-pub, Full Text, Audio) • Unceasing customer service
Track the below URL for one-step submission https://juniperpublishers.com/online-submission.php
This work is licensed under CreativeCommons Attribution 4.0 LicenseDOI:10.19080/IJESNR.2020.25.556164