Embed Size (px)
Citation preview
An Experimental Study of the Nose Landing Gear Noise
with Emphasis on the Steering Actuators, Torque Link and
Tow Hook
by
Ozan Coskun
A thesis submitted in conformity with the requirements
for the degree of Master of Applied Science
Graduate Department of Institute for Aerospace Studies
University of Toronto
© Copyright 2019 by Ozan Coskun
ii
Abstract
An Experimental Study of the Nose Landing Gear Noise with Emphasis on the Steering
Actuators, Torque Link and Tow Hook
Ozan Coskun
Master of Applied Science
Graduate Department of Institute for Aerospace Studies
University of Toronto
2019
Aeroacoustic and Particle Image Velocimetry (PIV) tests were conducted on the simplified model
of a nose landing gear that permitted independent additions of the tow hook, torque link and
steering systems. Tow hook was found to suppress low-frequency overhead noise originating from
the axle-strut region. Tests involving torque links mounted upstream and downstream of the strut
with varying arm separation distances showed that upstream mounting induces: i) prominent low-
frequency noise in the sideline direction, and ii) higher broadband noise in the overhead and
sideline directions when the torque link arms are close. Increasing the separation between the
torque link arms decreased the broadband noise contribution of the upstream mounted torque links
to levels of those mounted downstream. The steering actuator orientation is shown to be crucial
for the acoustic response of the gear. Steering actuators placed nearly perpendicular to the
freestream flow were found to generate the quietest responses.
iii
Acknowledgments
I wish to thank my supervisor Professor Alis Ekmekci for her leadership and support. I am
thankful to her for believing in me, in my research and mentoring me with her knowledge.
I would like to express my deepest appreciation to Philip McCarthy for his selfless dedication to
teach and support me whenever I needed. His extensive knowledge and experience in the field
was vital to the timely completion of my research. I cannot thank him enough.
I would like to extend my gratitude to Ehsan Vaziri, who spent hours on teaching me how to
conduct Particle Image Velocimetry experiments and staying with me while operating the laser. I
also wish to thank Alec Xu for providing me with laughter and an extra set of hands during some
of my experiments. I would also like to thank Bronwyn for her emotional support in this journey.
Last, but certainly not the least, I would like to thank my dad for being my inspiration to pursue
aerospace engineering, my mom for being the inspiration to pursue research, and my sister for
being the fourth member of our family.
iv
Table of Contents
1. Introduction and Literature Review ........................................................................... 1
1.1. Motivation and Background ..................................................................................... 1
1.2. Objectives ................................................................................................................. 3
2. Experimental Setup ...................................................................................................... 4
2.1. Test Facility .............................................................................................................. 4
2.2. Test Model ................................................................................................................ 5
2.3. Instrumentation, Data Acquisition and Data Analysis ............................................. 8
2.3.1. Acoustic Measurements ................................................................................. 8
2.3.2. Flow Visualization Measurements ................................................................. 11
3. Aeroacoustic Analyis and Discussion .......................................................................... 13
3.1. Empty Anechoic Wind Tunnel ................................................................................. 13
3.2. Baseline Nose Landing Gear .................................................................................... 14
3.3. Tow Hook ................................................................................................................. 18
3.4. Torque Link .............................................................................................................. 19
3.5. Steering System ........................................................................................................ 29
3.5.1. Flat-Tipped Steering Actuators ...................................................................... 30
3.5.2. Round-Tipped Steering Actuators ................................................................. 36
3.6. Fully Dressed Landing Gear with Downstream Torque Link .................................. 41
3.7. Mach Scaling ............................................................................................................ 45
4. Flow Visualization Results and Discussion ................................................................ 48
4.1. Flat-Tipped Steering Actuators ................................................................................ 48
4.2. Round-Tipped Steering Actuators ............................................................................ 52
4.3. Effect of the Flow Field on Acoustics ...................................................................... 55
5. Conclusion and Future Work ...................................................................................... 57
5.1. Conclusion ................................................................................................................ 57
5.2. Future Work.............................................................................................................. 59
Bibliography ......................................................................................................................... 61
Appendix A ........................................................................................................................... 64
A.1 Reynolds Number ..................................................................................................... 64
A.2 Spectral Analyses ...................................................................................................... 65
v
List of Figures
1.1 Commercial aircraft noise over years. Image taken from [2]. ..................................... 1
2.1 Panoramic view of the anechoic wind tunnel with the model of a generic nose
landing gear installed in the test section. Flow is from left to right. ............................ 4
2.2 Components of the fully-dressed landing gear model as seen from upstream and
downstream. ................................................................................................................. 6
2.3 Sketches of the inter-wheel region showing the axle, strut, torque link and tow
hook components attached to one of the wheels. The other wheel is removed for
demonstration purposes in the drawings. ..................................................................... 6
2.4 Drawings of the landing gear components and the assembly. All dimensions are
given in mm. ................................................................................................................. 7
2.5 Cartesian coordinate system used in this study is shown on the landing gear model
mounted in the anechoic wind tunnel. .......................................................................... 8
2.6 The layout of the microphones in the linear arrays. ..................................................... 8
2.7 Microphone locations of the phased array system. ...................................................... 9
2.8 View facing the wind tunnel inlet with the landing gear and pitot-static system. ....... 10
2.9 Microphone attached to the pistonphone for sensitivity calibration. ........................... 10
2.10 Particle Image Velocimetry Setup................................................................................ 12
3.1 Narrowband noise level spectra of the AWT at U∞ = 60 m/s with the empty testbed
(background noise), baseline landing gear, and baseline landing gear with the
background noise deleted. ............................................................................................ 14
3.2 View of the baseline noise landing gear from downstream. ........................................ 15
3.3 Sound pressure levels (SPLs) as a function of frequency for the baseline landing
gear configuration from the (a) overhead (θ = 0°) and (b) sideline (φ = -90°)
microphone positions. Black arrows indicate frequencies at which the
beamforming maps are generated. ............................................................................... 15
3.4 Noise source maps for the baseline nose landing gear at low to high frequencies.
Flow is from left to right. ............................................................................................. 17
3.5 Comparison of the narrowband noise spectra between landing gear configurations
with and without tow hook for the (a) overhead (θ = 0°) and (b) sideline (φ = -90°)
microphone positions. .................................................................................................. 19
vi
3.6 The definition of the distance L, which is measured from the bottom of the axle to
the bottom of the oleo................................................................................................... 19
3.7 Overhead and sideline spectra for landing gear models with the torque link
installed downstream of the strut, the torque link installed upstream of the strut
and baseline gear. Arrows indicate frequencies at which beamforming maps are
generated. ..................................................................................................................... 21
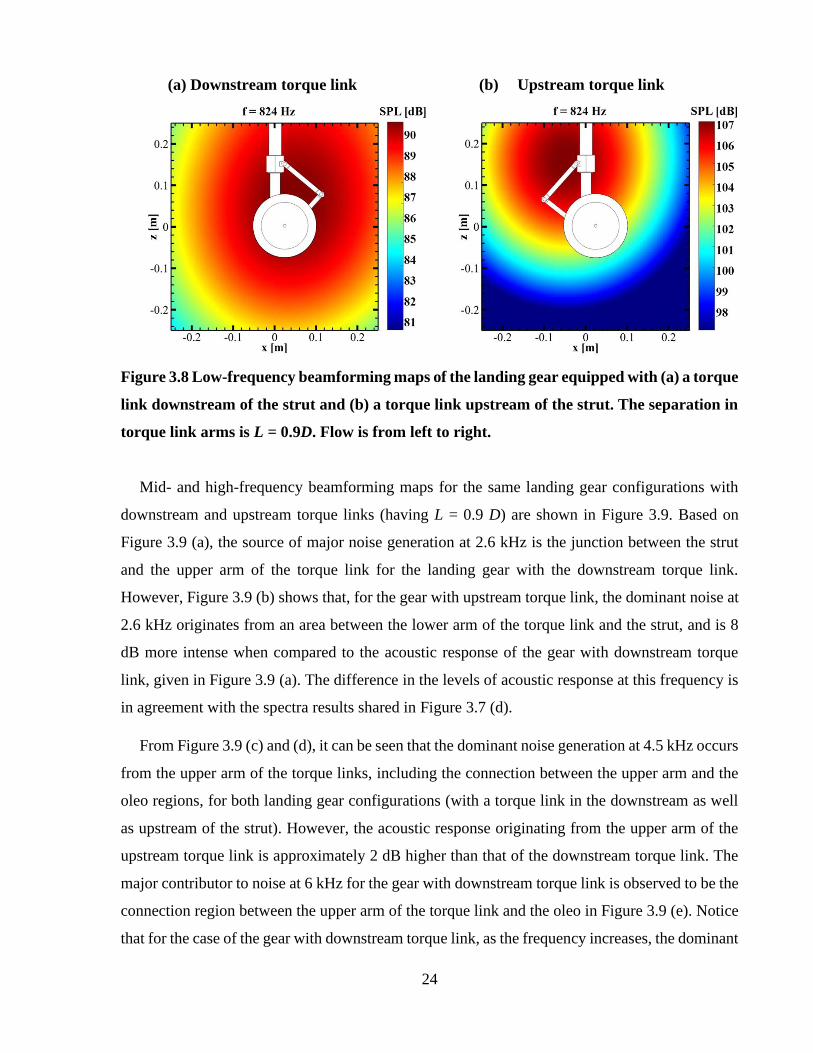
3.8 Low-frequency beamforming maps of the landing gear equipped with (a) a torque
link downstream of the strut and (b) a torque link upstream of the strut. The
separation in torque link arms is L = 0.9D. Flow is from left to right. ........................ 24
3.9 Mid- and high-frequency beamforming maps of the landing gear with downstream
and upstream torque links with an arm separation length of L = 0.9D. Flow is from
left to right. ................................................................................................................... 25
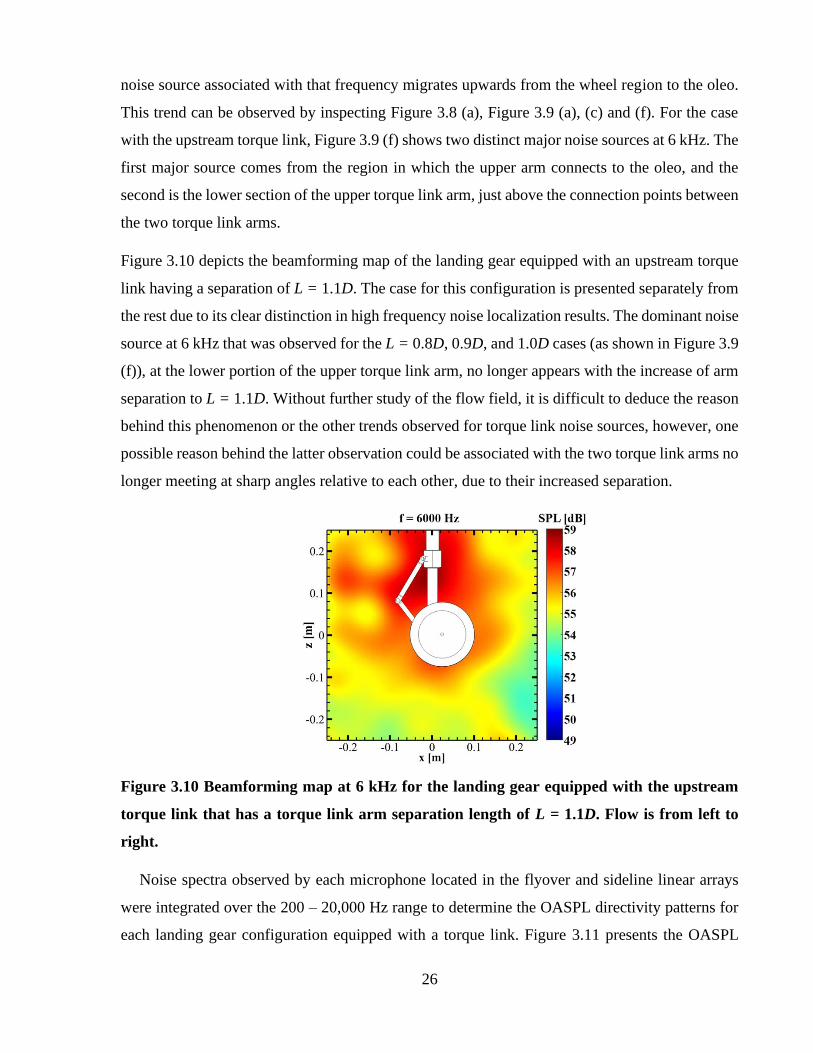
3.10 Beamforming map at 6 kHz for the landing gear equipped with the upstream
torque link that has a torque link arm separation length of L = 1.1D. Flow is from
left to right. ................................................................................................................... 26
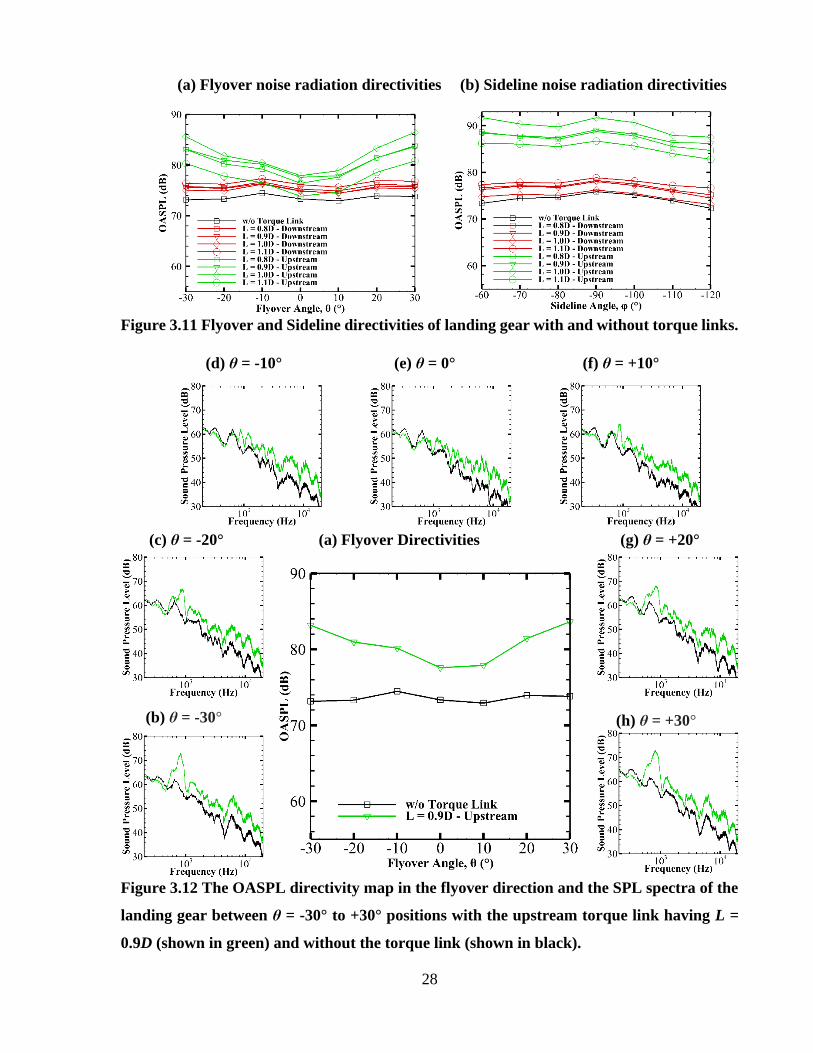
3.11 Flyover and Sideline directivities of landing gear with and without torque links. ...... 28
3.12 The OASPL directivity map in the flyover direction and the SPL spectra of the
landing gear between θ = -30° to +30° positions with the upstream torque link
having L = 0.9D (shown in green) and without the torque link (shown in black). ...... 28
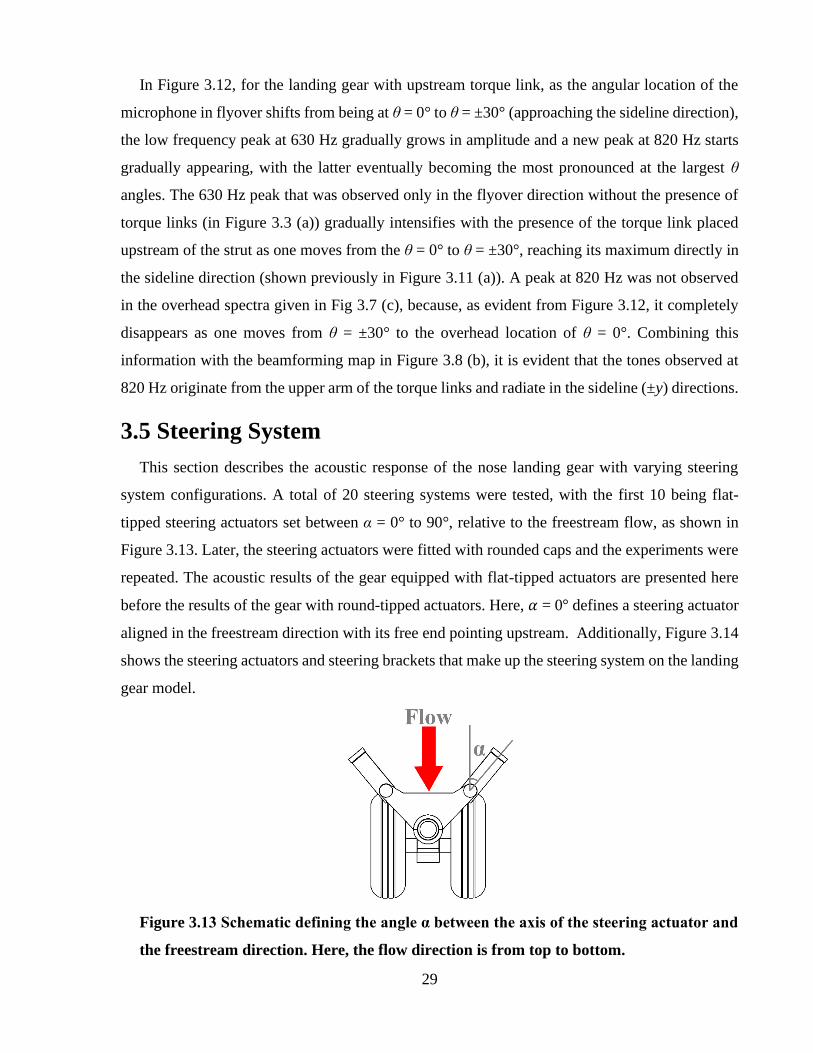
3.13 Schematic defining the angle α between the axis of the steering actuator and the
freestream direction. Here, the flow direction is from top to bottom........................... 29
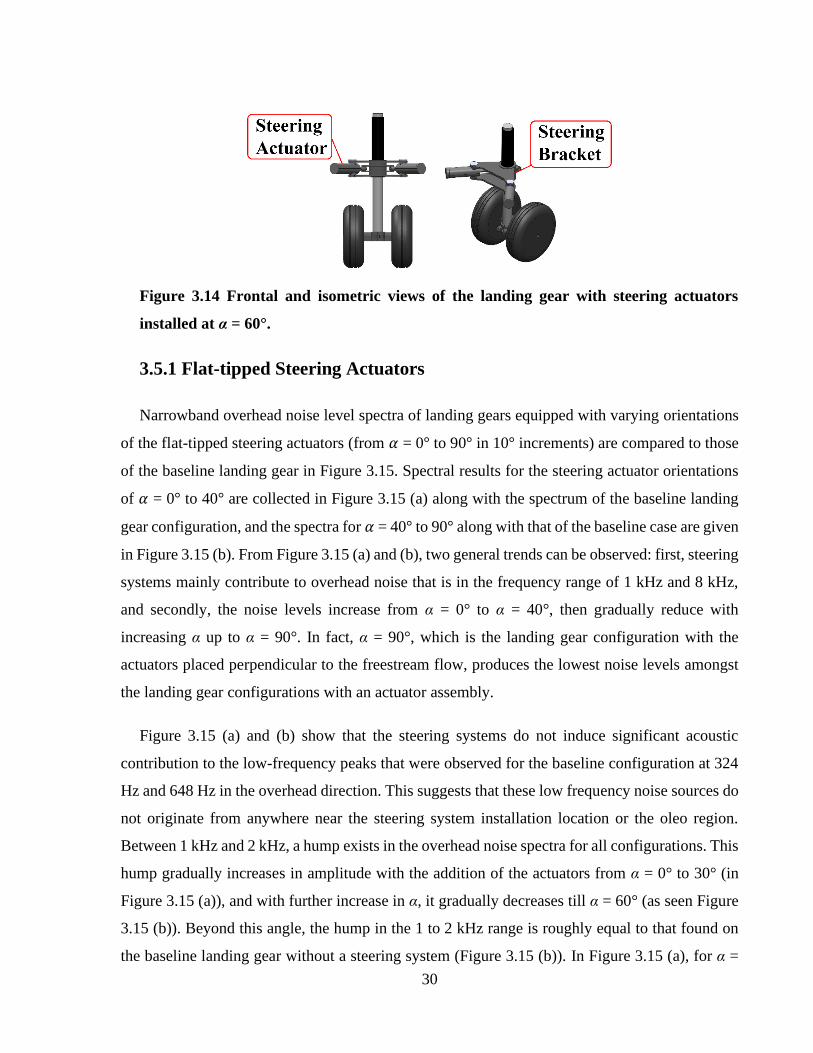
3.14 Frontal and isometric views of the landing gear with steering actuators installed at
α = 60°. ......................................................................................................................... 30
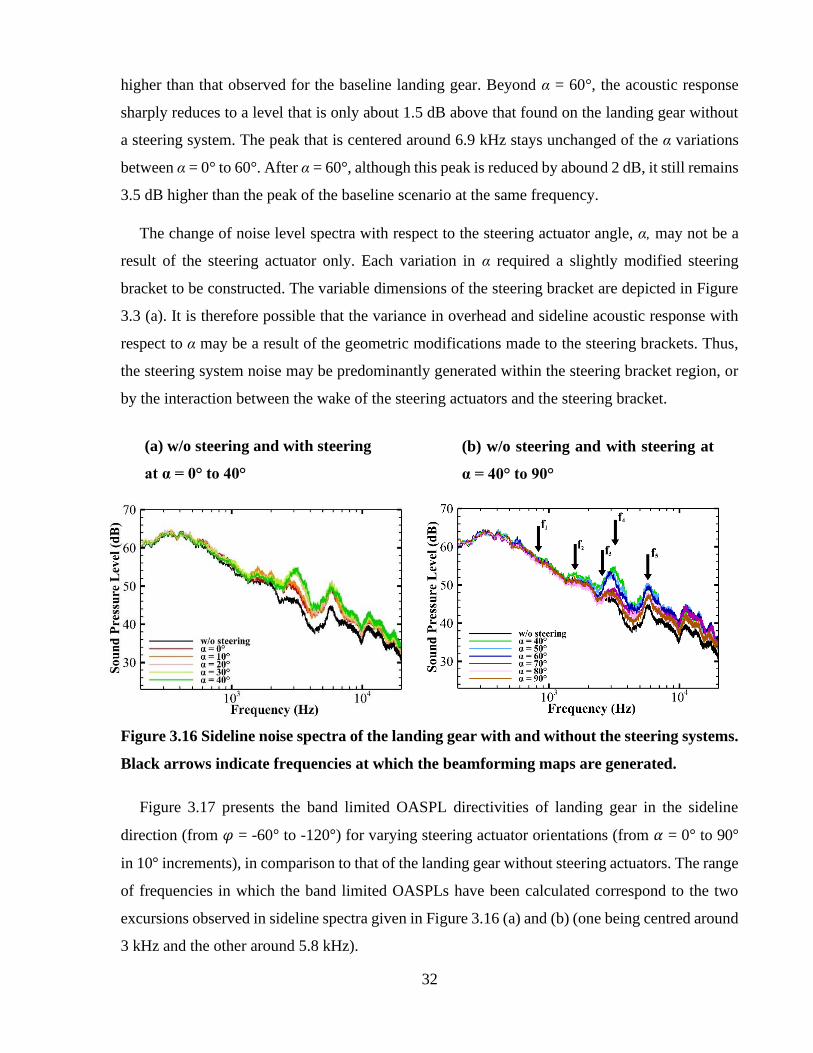
3.15 Overhead noise spectra of the landing gear with and without steering systems.
Black arrows indicate frequencies at which the beamforming maps are generated. ............. 31
3.16 Sideline noise spectra of the landing gear with and without the steering systems.
Black arrows indicate frequencies at which the beamforming maps are generated. ............. 32
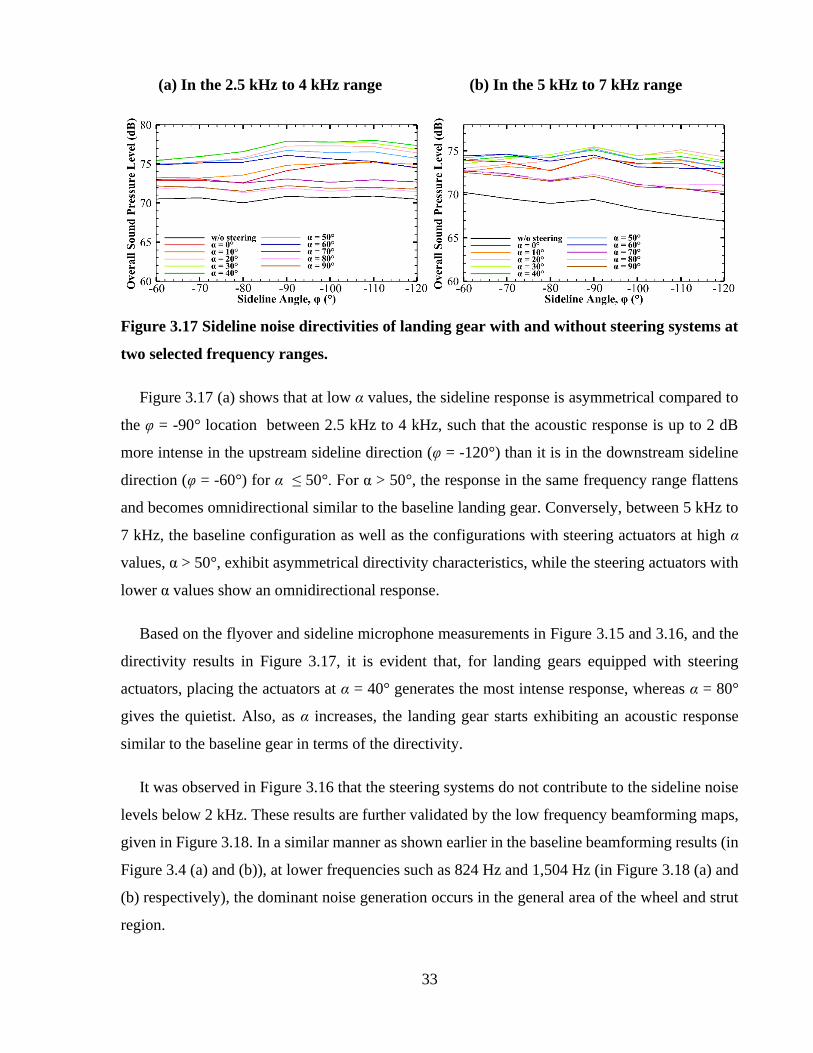
3.17 Sideline noise directivities of landing gear with and without steering systems at
two selected frequency ranges...................................................................................... 33
3.18 Low frequency beamforming maps of the landing gear installed with steering
actuator having α = 40°. Flow is from left to right. ..................................................... 34
vii
3.19 Mid-frequency beamforming maps of the landing gear installed with steering
actuator having α = 40°. Flow is from left to right. ..................................................... 35
3.20 High frequency beamforming map of the landing gear installed with steering
actuator having α = 40°. Flow is from left to right. ..................................................... 35
3.21 Steering actuators equipped with rounded caps viewed from downstream. ................ 36
3.22 Overhead noise level spectra of landing gear equipped with rounded and flat
steering actuators compared to the spectrum of the baseline gear. .............................. 37
3.23 Sideline noise level spectra of landing gear equipped with rounded and flat
steering actuators compared to the spectrum of the baseline gear. .............................. 39
3.24 Overhead calculated (black) and measured (red) noise level spectra of the fully
dressed landing gear. .................................................................................................... 43
3.25 Sideline calculated (black) and measured (red) noise level spectra of the fully
dressed landing gear. .................................................................................................... 44
3.26 Beamforming maps of landing gear equipped with steering system, torque link,
and fully dressed landing gear. ..................................................................................... 45
3.27 Overhead spectra of the fully dressed landing gear model with steering actuators
at α = 10° and a torque link separation of L = 0.9D scaled up to the various powers
of the Mach number with a reference freestream velocity of U∞ = 68 m/s. ................. 46
3.28 Sideline spectra of the fully dressed lading gear model with steering actuators at
α = 10° and a torque link separation of L = 0.9D scaled up to the various powers
of the Mach number with a reference freestream velocity of U∞ = 68 m/s. ................. 47
4.1 Field of View of the PIV setup..................................................................................... 48
4.2 Instantaneous skipped velocity field superimposed on the instantaneous vorticity
contour for the flat-tipped steering actuator. Flow from left to right. .......................... 50
4.3 Time averaged skipped velocity field superimposed on the time averaged vorticity
contour for the flat-tipped steering actuator. Flow from left to right. .......................... 51
4.4 Instantaneous skipped velocity field superimposed on the instantaneous vorticity
contour for the round-tipped steering actuator. Flow from left to right. ...................... 53
4.5 Time averaged skipped velocity field superimposed on the time averaged vorticity
contour for the round-tipped steering actuator. Flow from left to right. ...................... 54
4.6 OASPLs of the gear with steering actuators in the 200 – 20,000 Hz range ................. 55
viii
Nomenclature D = Wheel diameter
f = Frequency
L = The separation of the torque link arms measured by the distance from the bottom of
the axle to the bottom of the oleo.
M = Mach number
Re = Reynolds number
x = Coordinate in streamwise direction (positive points downstream)
y = Coordinate in transverse direction in line with the centerline of the axle (positive
defined according to the right hand rule)
z = Coordinate in spanwise direction, in line with the strut centerline (positive points away
from the flat plate)
α = Angle of incidence for the steering actuator angle (with respect to the freestream flow)
Δt = user-defined time interval between two consecutive images
θ = Polar angle of the flyover microphones (with respect to the positive z axis)
φ = Azimuthal angle of the sideline microphones (with respect to the positive x axis)
1
Chapter 1
Introduction and Literature Review
1.1 Motivation and Background
The accelerating worldwide expansion in air transportation over the years has come with noise
pollution as a major negative side effect. A series of increasingly stringent noise standards
introduced by aviation authorities around the globe has ultimately provided a huge impetus for
research efforts that aimed to mitigate aircraft-induced noise. Over the past several decades,
efforts in aircraft noise reduction have primarily focused on minimizing engine noise because
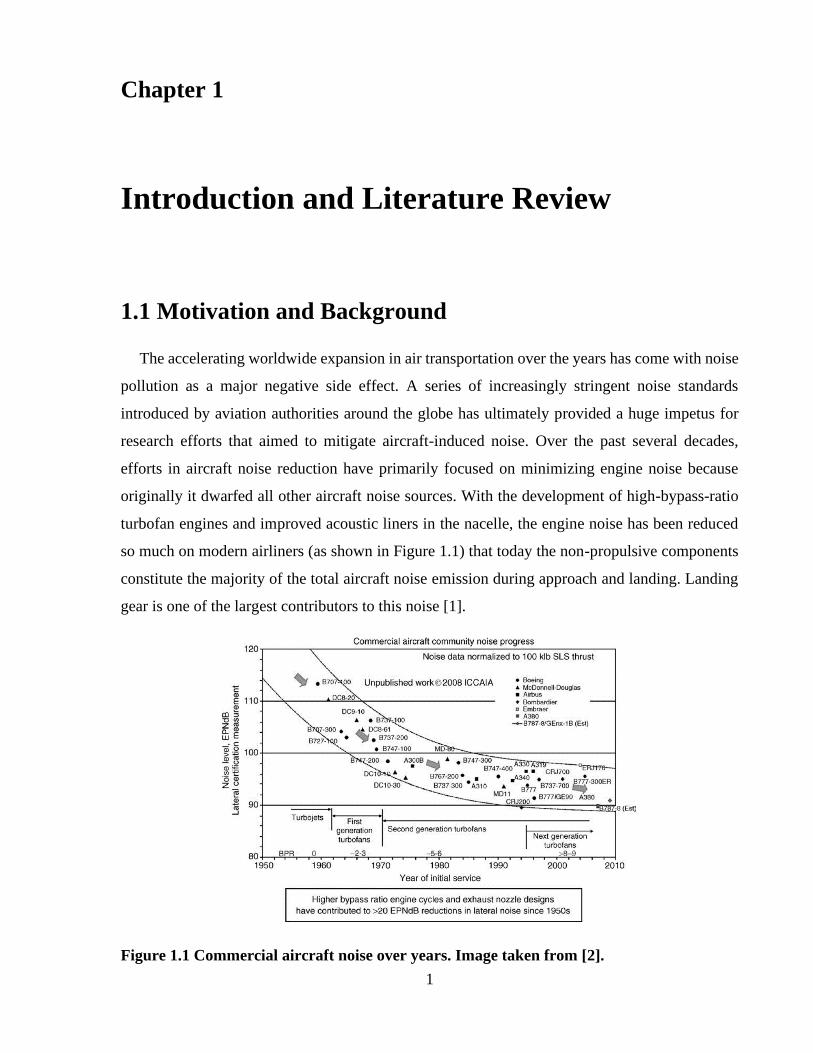
originally it dwarfed all other aircraft noise sources. With the development of high-bypass-ratio
turbofan engines and improved acoustic liners in the nacelle, the engine noise has been reduced
so much on modern airliners (as shown in Figure 1.1) that today the non-propulsive components
constitute the majority of the total aircraft noise emission during approach and landing. Landing
gear is one of the largest contributors to this noise [1].
Figure 1.1 Commercial aircraft noise over years. Image taken from [2].
2
Landing gear noise is essentially broadband in nature [3]. Additional prominent tones are
occasionally observed due to the excitation of cavity modes in the landing gear wheel wells [4, 5]
and the hollow pins that connect different subcomponents of the gear structure [3]. When detected,
the pin-hole-related tonal noise can easily be eliminated by adopting pin-hole caps [6]. Turbulent
flow separating from the bluff components of landing gears and the interaction of the resulting
turbulent wakes with the downstream gear components are the two mechanisms generally
attributed to broadband noise production of landing gears [3]. Current generation landing gears
have very complex designs, consisting of a multitude of small- and large-size components. The
local turbulent and mean flow characteristics differ for each one of these gear elements due to the
occurrence of complex flow interactions between them. Moreover, the noise radiation directivities
vary for each component due to their dissimilar shape and orientation. As a result, the overall
noise characteristics for landing gears are very complex, spanning a wide range of frequencies
including the frequencies for which human hearing is most sensitive [3]. Generally, small landing
gear components are found to be responsible for high-frequency broadband noise levels, whereas
bulky gear components, such as tires and large struts are related to low-frequency noise [3].
Computational methods often cannot predict the acoustic response accurately, especially the
high-frequency response that is caused by small-scale parts on the landing gear. On the contrary,
the lower frequency acoustic response resulting from the large-scale vortex shedding behind the
wheels, strut, oleo and torque links as well as the tonal response from bay cavities can be predicted
computationally, however, experimental validations are still needed. This need for experimental
validation has spurred a number of high-profile test campaigns around the world involving
independent collaborations of NASA, DLR and NRC with aircraft companies Gulfstream, Airbus
and Bombardier respectively as well as several universities [7-12]. Vast majority of the existing
studies often omitted several geometric details in their test model, missing many of the
complicated interactions present within real-life landing gears. However, a component-by-
component assessment of landing gear noise is necessary to understand the causes of broadband
and tonal noises, as well as the interaction noise between landing gear components.
Noise source localization maps obtained by Ref. [11] via beamforming on different models of
nose landing gear comprised of a torque link placed downstream of the main strut highlighted the
torque arm as a dominant noise contributor. Other studies, such as the computational results of
Ref. [13] and the experimental results of Ref. [14], supported this observation. This is believed to
be due to the interaction effects between the torque link and the strut assembly [11]. Interestingly,
3
Long et al. showed that having the torque link assembly downstream of the main strut is less noisy
than having it at the upstream [15]. Windiate et al. also showed that if the angle between the two
torque link arms reaches 130°, then the torque link and the strut act as one bluff body, and suppress
the vortex shedding from the torque link-strut pair [16]. Bennett et al. conducted a component
removal assessment on a full-scale nose landing gear, where the influence of removing one
component at a time on noise output was characterized [17]. Although in that test campaign, only
the steering actuators installed perpendicular to the freestream flow direction were considered,
results suggested that the landing gear wheels suppress vortex shedding from steering actuators
perpendicular to the flow.
1.2 Objectives
Redesigning the shape and/or position of a gear component can change the local flow
conditions for adjacent landing gear components, and thereby, alter their noise contributions. This
makes the development of noise reduction concepts associated with landing gears a remarkably
challenging problem. It is not uncommon to see low-noise concepts developed with a purely
heuristic intuition to lead to even much noisier designs. Development of effective noise reduction
strategies requires a thorough understanding of the underlying noise generation mechanisms and
how these are affected by the design variations. To this end, this thesis aims to identify the far-
field noise contributions of landing gear components, focusing specifically on torque links, tow
hooks and steering system components and their variations. The model used is a simplified version
of a generic nose landing gear, but has a modular design that permits independent addition,
subtraction as well as variation of the landing gear components for full appreciation of their
acoustic impacts.
4
Chapter 2
Experimental Setup
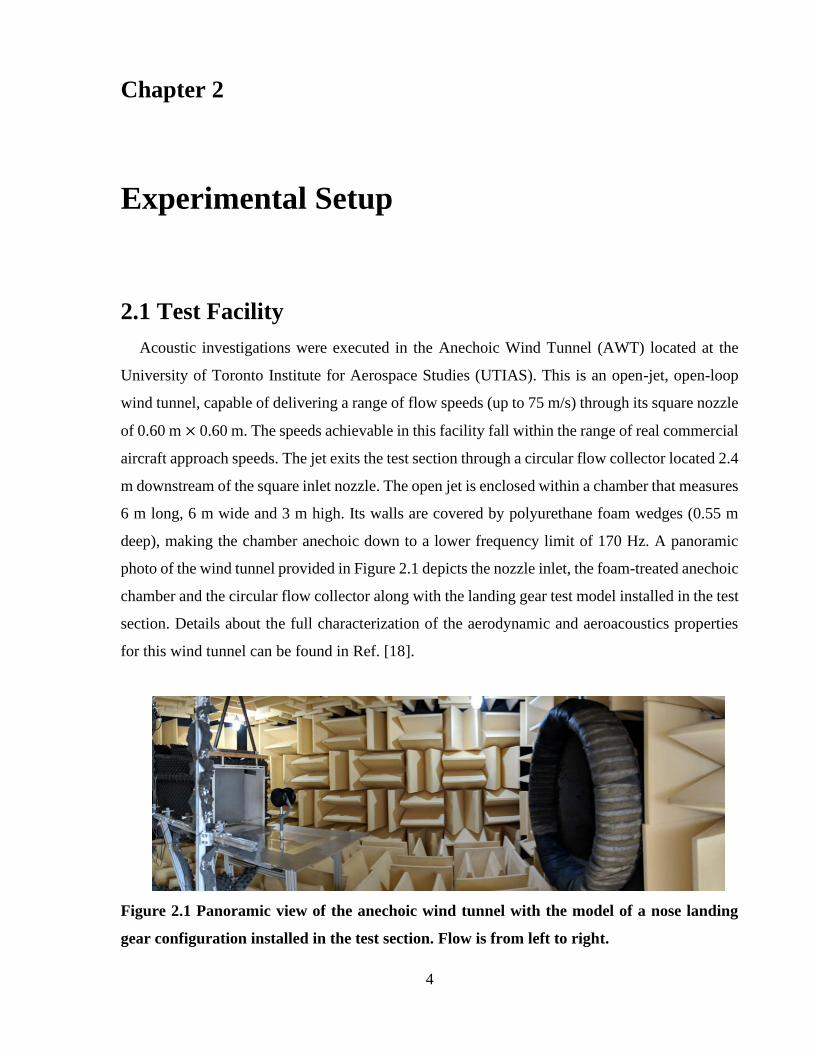
2.1 Test Facility
Acoustic investigations were executed in the Anechoic Wind Tunnel (AWT) located at the
University of Toronto Institute for Aerospace Studies (UTIAS). This is an open-jet, open-loop
wind tunnel, capable of delivering a range of flow speeds (up to 75 m/s) through its square nozzle
of 0.60 m × 0.60 m. The speeds achievable in this facility fall within the range of real commercial
aircraft approach speeds. The jet exits the test section through a circular flow collector located 2.4
m downstream of the square inlet nozzle. The open jet is enclosed within a chamber that measures
6 m long, 6 m wide and 3 m high. Its walls are covered by polyurethane foam wedges (0.55 m
deep), making the chamber anechoic down to a lower frequency limit of 170 Hz. A panoramic
photo of the wind tunnel provided in Figure 2.1 depicts the nozzle inlet, the foam-treated anechoic
chamber and the circular flow collector along with the landing gear test model installed in the test
section. Details about the full characterization of the aerodynamic and aeroacoustics properties
for this wind tunnel can be found in Ref. [18].
Figure 2.1 Panoramic view of the anechoic wind tunnel with the model of a nose landing
gear configuration installed in the test section. Flow is from left to right.
5
2.2 Test Model
For the present test campaign, a 30%-scale, simplified model of a generic nose landing gear
was constructed and attached upside down on a rigid flat plate, which can be considered to
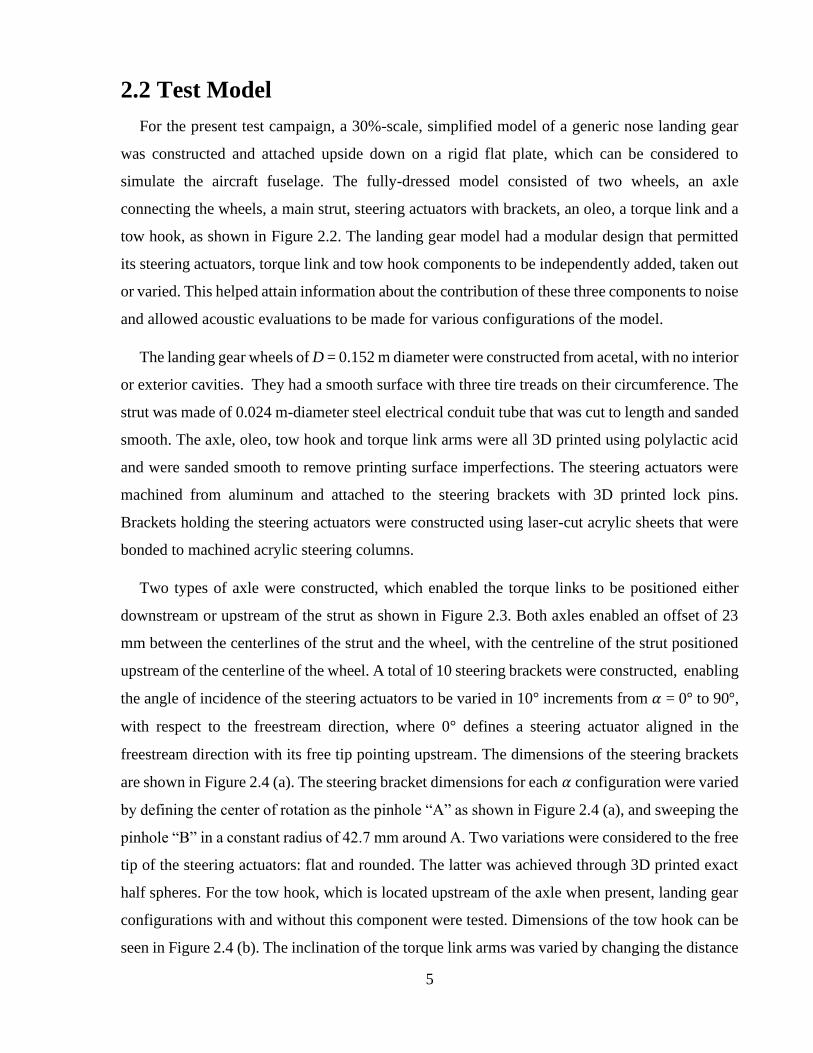
simulate the aircraft fuselage. The fully-dressed model consisted of two wheels, an axle
connecting the wheels, a main strut, steering actuators with brackets, an oleo, a torque link and a
tow hook, as shown in Figure 2.2. The landing gear model had a modular design that permitted
its steering actuators, torque link and tow hook components to be independently added, taken out
or varied. This helped attain information about the contribution of these three components to noise
and allowed acoustic evaluations to be made for various configurations of the model.
The landing gear wheels of D = 0.152 m diameter were constructed from acetal, with no interior
or exterior cavities. They had a smooth surface with three tire treads on their circumference. The
strut was made of 0.024 m-diameter steel electrical conduit tube that was cut to length and sanded
smooth. The axle, oleo, tow hook and torque link arms were all 3D printed using polylactic acid
and were sanded smooth to remove printing surface imperfections. The steering actuators were
machined from aluminum and attached to the steering brackets with 3D printed lock pins.
Brackets holding the steering actuators were constructed using laser-cut acrylic sheets that were
bonded to machined acrylic steering columns.
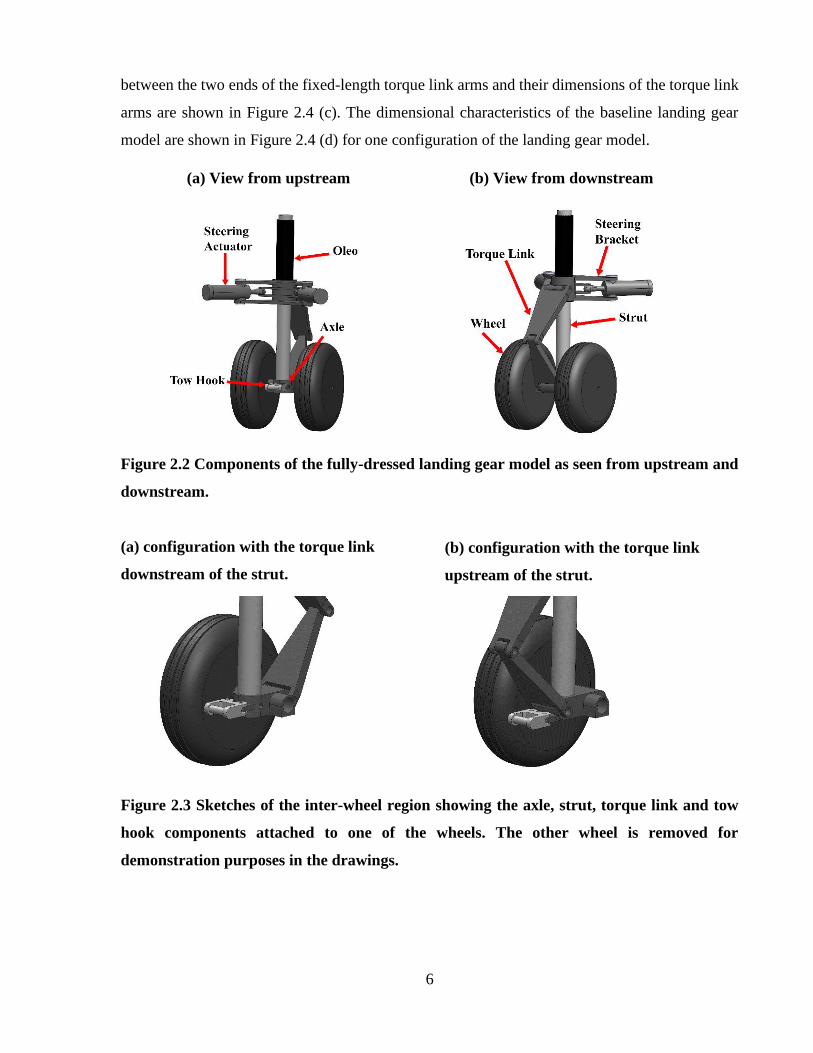
Two types of axle were constructed, which enabled the torque links to be positioned either
downstream or upstream of the strut as shown in Figure 2.3. Both axles enabled an offset of 23
mm between the centerlines of the strut and the wheel, with the centreline of the strut positioned
upstream of the centerline of the wheel. A total of 10 steering brackets were constructed, enabling
the angle of incidence of the steering actuators to be varied in 10° increments from 𝛼 = 0° to 90°,
with respect to the freestream direction, where 0° defines a steering actuator aligned in the
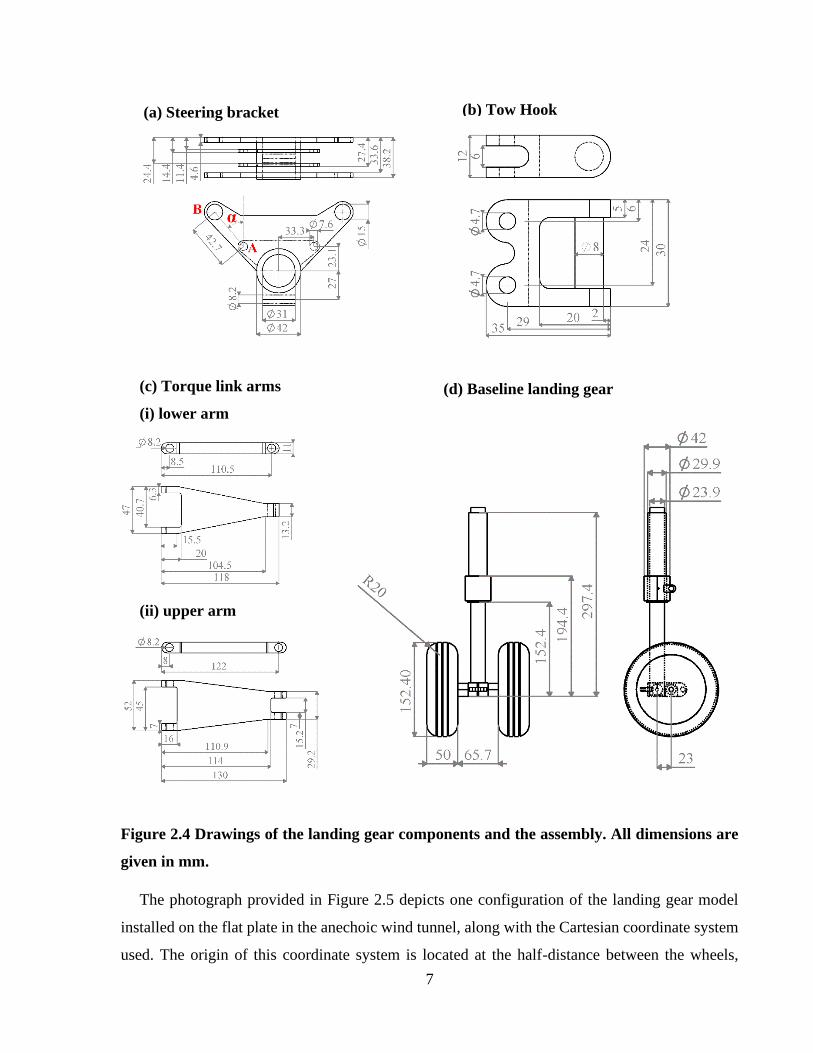
freestream direction with its free tip pointing upstream. The dimensions of the steering brackets
are shown in Figure 2.4 (a). The steering bracket dimensions for each 𝛼 configuration were varied
by defining the center of rotation as the pinhole “A” as shown in Figure 2.4 (a), and sweeping the
pinhole “B” in a constant radius of 42.7 mm around A. Two variations were considered to the free
tip of the steering actuators: flat and rounded. The latter was achieved through 3D printed exact
half spheres. For the tow hook, which is located upstream of the axle when present, landing gear
configurations with and without this component were tested. Dimensions of the tow hook can be
seen in Figure 2.4 (b). The inclination of the torque link arms was varied by changing the distance
6
between the two ends of the fixed-length torque link arms and their dimensions of the torque link
arms are shown in Figure 2.4 (c). The dimensional characteristics of the baseline landing gear
model are shown in Figure 2.4 (d) for one configuration of the landing gear model.
(a) View from upstream (b) View from downstream
Figure 2.2 Components of the fully-dressed landing gear model as seen from upstream and
downstream.
(a) configuration with the torque link
downstream of the strut.
Figure 2.3 Sketches of the inter-wheel region showing the axle, strut, torque link and tow
hook components attached to one of the wheels. The other wheel is removed for
demonstration purposes in the drawings.
(b) configuration with the torque link
upstream of the strut.
7
(a) Steering bracket
(c) Torque link arms
(i) lower arm
(ii) upper arm
Figure 2.4 Drawings of the landing gear components and the assembly. All dimensions are
given in mm.
The photograph provided in Figure 2.5 depicts one configuration of the landing gear model
installed on the flat plate in the anechoic wind tunnel, along with the Cartesian coordinate system
used. The origin of this coordinate system is located at the half-distance between the wheels,
(b) Tow Hook
(d) Baseline landing gear
8
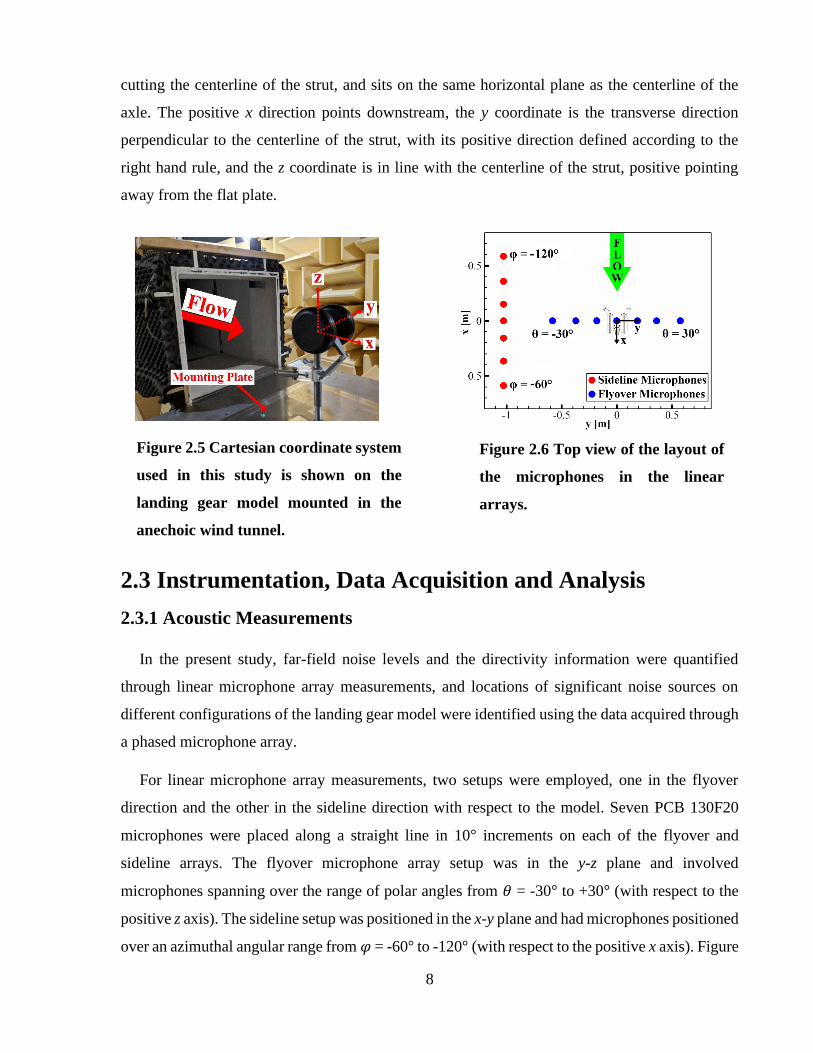
cutting the centerline of the strut, and sits on the same horizontal plane as the centerline of the
axle. The positive x direction points downstream, the y coordinate is the transverse direction
perpendicular to the centerline of the strut, with its positive direction defined according to the
right hand rule, and the z coordinate is in line with the centerline of the strut, positive pointing
away from the flat plate.
2.3 Instrumentation, Data Acquisition and Analysis
2.3.1 Acoustic Measurements
In the present study, far-field noise levels and the directivity information were quantified
through linear microphone array measurements, and locations of significant noise sources on
different configurations of the landing gear model were identified using the data acquired through
a phased microphone array.
For linear microphone array measurements, two setups were employed, one in the flyover
direction and the other in the sideline direction with respect to the model. Seven PCB 130F20
microphones were placed along a straight line in 10° increments on each of the flyover and
sideline arrays. The flyover microphone array setup was in the y-z plane and involved
microphones spanning over the range of polar angles from 𝜃 = -30° to +30° (with respect to the
positive z axis). The sideline setup was positioned in the x-y plane and had microphones positioned
over an azimuthal angular range from 𝜑 = -60° to -120° (with respect to the positive x axis). Figure
Figure 2.5 Cartesian coordinate system
used in this study is shown on the
landing gear model mounted in the
anechoic wind tunnel.
Figure 2.6 Top view of the layout of
the microphones in the linear
arrays.
9
2.6 illustrates the location of the linear array microphones used in the flyover and sideline
directions relative to the coordinate system. The closest microphone to the model in both arrays
was at approximately 1 m distance from the origin of the coordinate system. The exact distance
of each microphone was measured with a laser distance measurer with an accuracy of ±1 mm and
the sound pressure level amplitudes for each microphone were corrected to an equivalent radial
distance of 1 m from the origin.
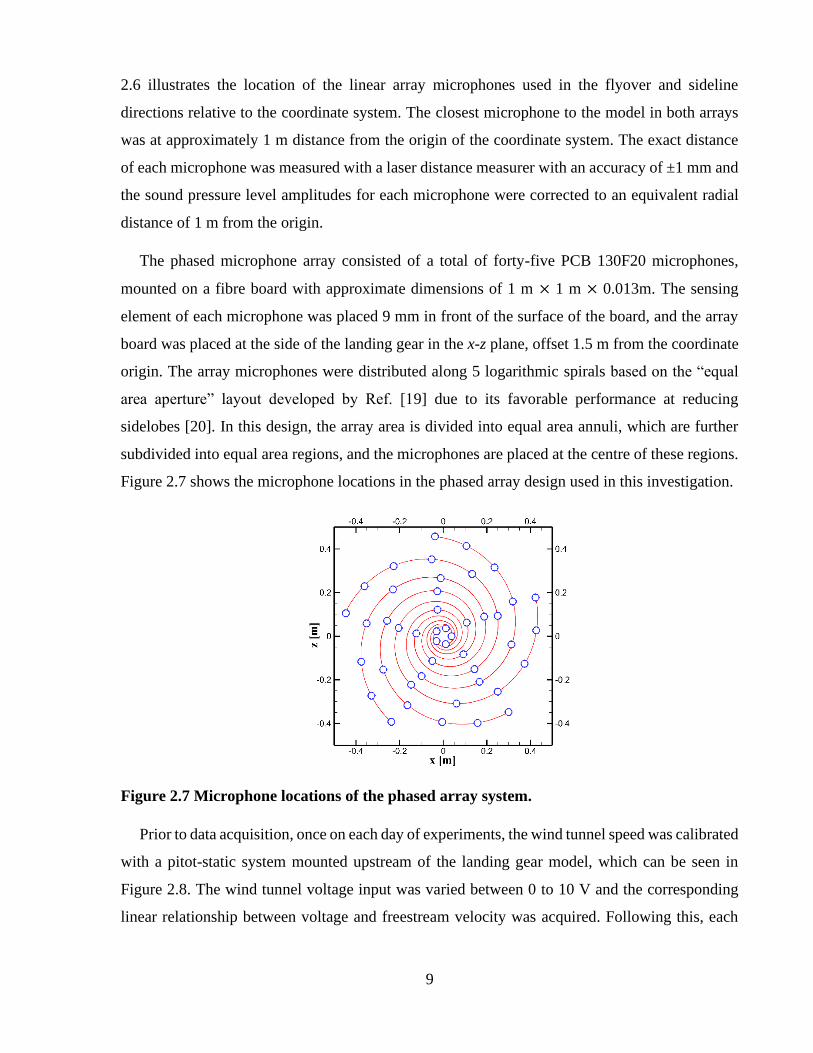
The phased microphone array consisted of a total of forty-five PCB 130F20 microphones,
mounted on a fibre board with approximate dimensions of 1 m × 1 m × 0.013m. The sensing
element of each microphone was placed 9 mm in front of the surface of the board, and the array
board was placed at the side of the landing gear in the x-z plane, offset 1.5 m from the coordinate
origin. The array microphones were distributed along 5 logarithmic spirals based on the “equal
area aperture” layout developed by Ref. [19] due to its favorable performance at reducing
sidelobes [20]. In this design, the array area is divided into equal area annuli, which are further
subdivided into equal area regions, and the microphones are placed at the centre of these regions.
Figure 2.7 shows the microphone locations in the phased array design used in this investigation.
Figure 2.7 Microphone locations of the phased array system.
Prior to data acquisition, once on each day of experiments, the wind tunnel speed was calibrated
with a pitot-static system mounted upstream of the landing gear model, which can be seen in
Figure 2.8. The wind tunnel voltage input was varied between 0 to 10 V and the corresponding
linear relationship between voltage and freestream velocity was acquired. Following this, each
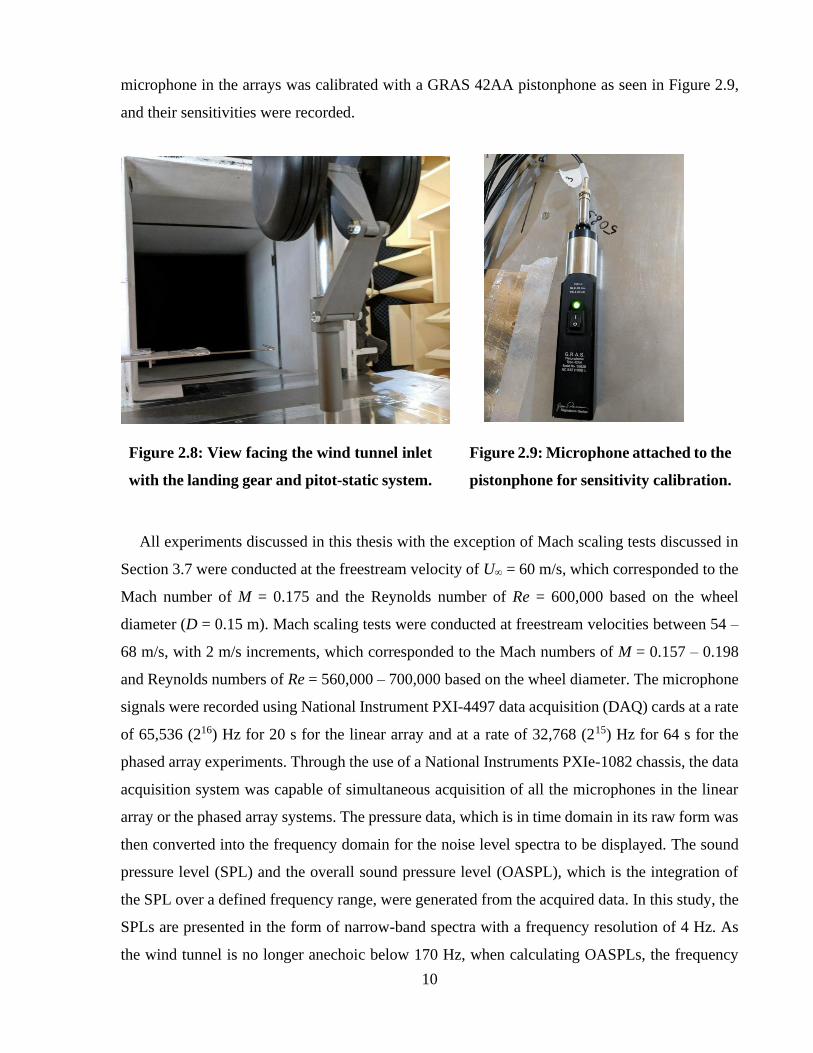
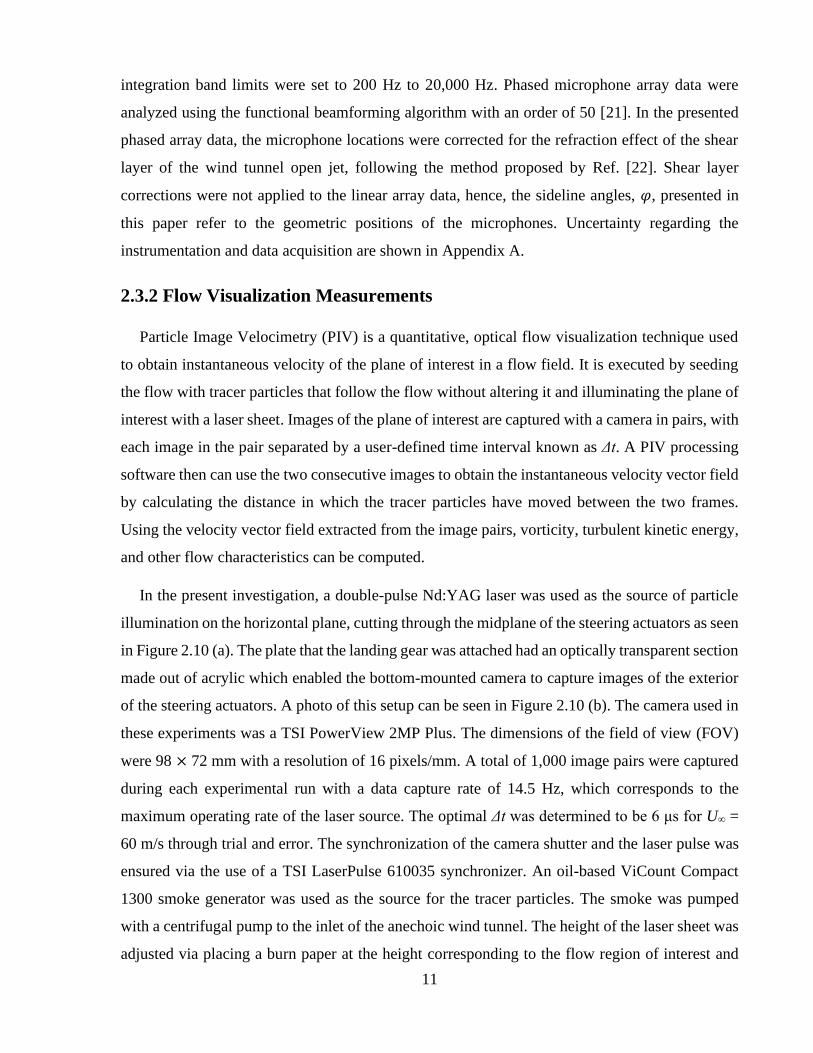
10
microphone in the arrays was calibrated with a GRAS 42AA pistonphone as seen in Figure 2.9,
and their sensitivities were recorded.
All experiments discussed in this thesis with the exception of Mach scaling tests discussed in
Section 3.7 were conducted at the freestream velocity of U∞ = 60 m/s, which corresponded to the
Mach number of M = 0.175 and the Reynolds number of Re = 600,000 based on the wheel
diameter (D = 0.15 m). Mach scaling tests were conducted at freestream velocities between 54 –
68 m/s, with 2 m/s increments, which corresponded to the Mach numbers of M = 0.157 – 0.198
and Reynolds numbers of Re = 560,000 – 700,000 based on the wheel diameter. The microphone
signals were recorded using National Instrument PXI-4497 data acquisition (DAQ) cards at a rate
of 65,536 (216) Hz for 20 s for the linear array and at a rate of 32,768 (215) Hz for 64 s for the
phased array experiments. Through the use of a National Instruments PXIe-1082 chassis, the data
acquisition system was capable of simultaneous acquisition of all the microphones in the linear
array or the phased array systems. The pressure data, which is in time domain in its raw form was
then converted into the frequency domain for the noise level spectra to be displayed. The sound
pressure level (SPL) and the overall sound pressure level (OASPL), which is the integration of
the SPL over a defined frequency range, were generated from the acquired data. In this study, the
SPLs are presented in the form of narrow-band spectra with a frequency resolution of 4 Hz. As
the wind tunnel is no longer anechoic below 170 Hz, when calculating OASPLs, the frequency
Figure 2.8: View facing the wind tunnel inlet
with the landing gear and pitot-static system.
Figure 2.9: Microphone attached to the
pistonphone for sensitivity calibration.
11
integration band limits were set to 200 Hz to 20,000 Hz. Phased microphone array data were
analyzed using the functional beamforming algorithm with an order of 50 [21]. In the presented
phased array data, the microphone locations were corrected for the refraction effect of the shear
layer of the wind tunnel open jet, following the method proposed by Ref. [22]. Shear layer
corrections were not applied to the linear array data, hence, the sideline angles, 𝜑, presented in
this paper refer to the geometric positions of the microphones. Uncertainty regarding the
instrumentation and data acquisition are shown in Appendix A.
2.3.2 Flow Visualization Measurements
Particle Image Velocimetry (PIV) is a quantitative, optical flow visualization technique used
to obtain instantaneous velocity of the plane of interest in a flow field. It is executed by seeding
the flow with tracer particles that follow the flow without altering it and illuminating the plane of
interest with a laser sheet. Images of the plane of interest are captured with a camera in pairs, with
each image in the pair separated by a user-defined time interval known as Δt. A PIV processing
software then can use the two consecutive images to obtain the instantaneous velocity vector field
by calculating the distance in which the tracer particles have moved between the two frames.
Using the velocity vector field extracted from the image pairs, vorticity, turbulent kinetic energy,
and other flow characteristics can be computed.
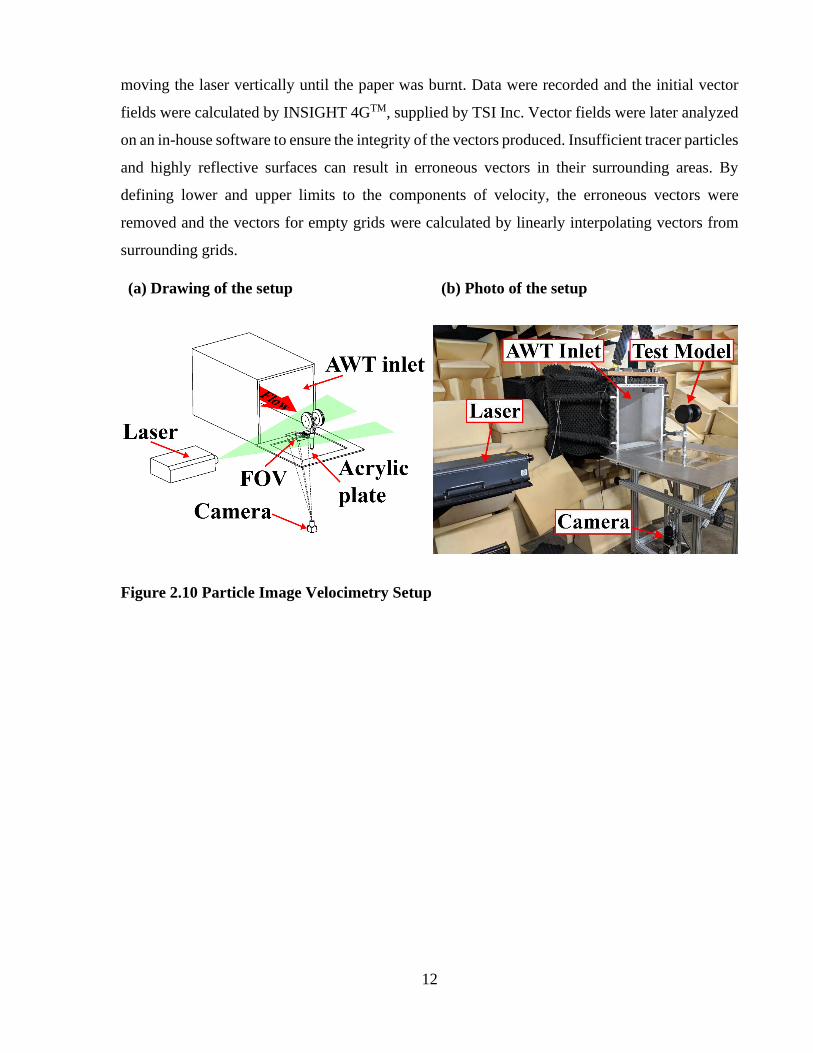
In the present investigation, a double-pulse Nd:YAG laser was used as the source of particle
illumination on the horizontal plane, cutting through the midplane of the steering actuators as seen
in Figure 2.10 (a). The plate that the landing gear was attached had an optically transparent section
made out of acrylic which enabled the bottom-mounted camera to capture images of the exterior
of the steering actuators. A photo of this setup can be seen in Figure 2.10 (b). The camera used in
these experiments was a TSI PowerView 2MP Plus. The dimensions of the field of view (FOV)
were 98 × 72 mm with a resolution of 16 pixels/mm. A total of 1,000 image pairs were captured
during each experimental run with a data capture rate of 14.5 Hz, which corresponds to the
maximum operating rate of the laser source. The optimal Δt was determined to be 6 μs for U∞ =
60 m/s through trial and error. The synchronization of the camera shutter and the laser pulse was
ensured via the use of a TSI LaserPulse 610035 synchronizer. An oil-based ViCount Compact
1300 smoke generator was used as the source for the tracer particles. The smoke was pumped
with a centrifugal pump to the inlet of the anechoic wind tunnel. The height of the laser sheet was
adjusted via placing a burn paper at the height corresponding to the flow region of interest and
12
moving the laser vertically until the paper was burnt. Data were recorded and the initial vector
fields were calculated by INSIGHT 4GTM, supplied by TSI Inc. Vector fields were later analyzed
on an in-house software to ensure the integrity of the vectors produced. Insufficient tracer particles
and highly reflective surfaces can result in erroneous vectors in their surrounding areas. By
defining lower and upper limits to the components of velocity, the erroneous vectors were
removed and the vectors for empty grids were calculated by linearly interpolating vectors from
surrounding grids.
(a) Drawing of the setup (b) Photo of the setup
Figure 2.10 Particle Image Velocimetry Setup
13
Chapter 3
Aeroacoustic Analysis and Discussion
This chapter compares far-field acoustic results of different landing gear model configurations,
which involve individual addition and/or variation of the torque link, tow hook and steering
actuator components. Far-field noise spectra, noise radiation directivity and noise source maps
are discussed. Far-field noise spectra are assessed at two microphone positions: directly overhead
of the model (at a flyover angle of θ = 0°) and to the side of the model (at a sideline angle of φ =
-90°). Based on these results, the noise source maps are computed for frequencies where important
spectral features are observed in the noise spectra. The OASPL mapping of the noise directivity
is constructed from noise records of both the flyover and sideline linear microphone arrays.
3.1 Empty Anechoic Wind Tunnel
Overhead and sideline microphone measurements were conducted in the AWT with the test
fixtures, cables and the empty test bed at freestream velocity of U∞ = 60 m/s and the noise level
spectra of this configuration can be found in Figure 3.1. The objective was to assess the
background noise levels of the AWT beyond its anechoic cut-off frequency of 170 Hz and to
determine the significance of the background noise to the test configurations discussed later in
this Chapter. In Figure 3.1, three spectra can be seen: AWT background noise, baseline landing
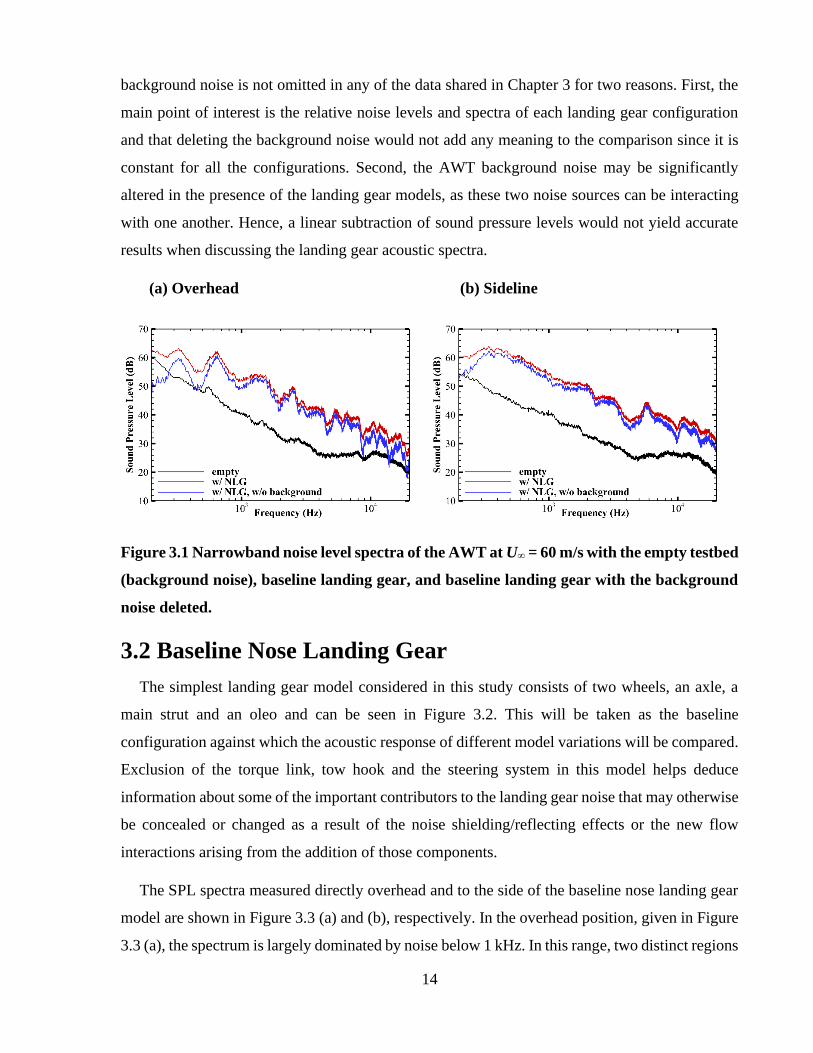
gear, and baseline landing gear with the AWT background noise deleted. Focusing on (a) for the
overhead spectra, omission of the background noise induces a 2 dB noise reduction at frequencies
above 600 Hz. However, the background noise becomes more prominent in the lower frequencies,
contributing up to 12 dB of noise at 200 Hz to the measured acoustic response of the landing gear.
Sideline contribution of the AWT background noise is similar, as seen in (b), however less intense.
Deleting the background noise decreases the measured noise levels by 2 dB at frequencies above
350 Hz, and up to 6 dB at lower frequencies. Despite the significant contribution of the AWT
background noise to the overall measured noise of the landing gear at low frequencies, the
14
background noise is not omitted in any of the data shared in Chapter 3 for two reasons. First, the
main point of interest is the relative noise levels and spectra of each landing gear configuration
and that deleting the background noise would not add any meaning to the comparison since it is
constant for all the configurations. Second, the AWT background noise may be significantly
altered in the presence of the landing gear models, as these two noise sources can be interacting
with one another. Hence, a linear subtraction of sound pressure levels would not yield accurate
results when discussing the landing gear acoustic spectra.
(a) Overhead (b) Sideline
Figure 3.1 Narrowband noise level spectra of the AWT at U∞ = 60 m/s with the empty testbed
(background noise), baseline landing gear, and baseline landing gear with the background
noise deleted.
3.2 Baseline Nose Landing Gear
The simplest landing gear model considered in this study consists of two wheels, an axle, a
main strut and an oleo and can be seen in Figure 3.2. This will be taken as the baseline
configuration against which the acoustic response of different model variations will be compared.
Exclusion of the torque link, tow hook and the steering system in this model helps deduce
information about some of the important contributors to the landing gear noise that may otherwise
be concealed or changed as a result of the noise shielding/reflecting effects or the new flow
interactions arising from the addition of those components.
The SPL spectra measured directly overhead and to the side of the baseline nose landing gear
model are shown in Figure 3.3 (a) and (b), respectively. In the overhead position, given in Figure
3.3 (a), the spectrum is largely dominated by noise below 1 kHz. In this range, two distinct regions
15
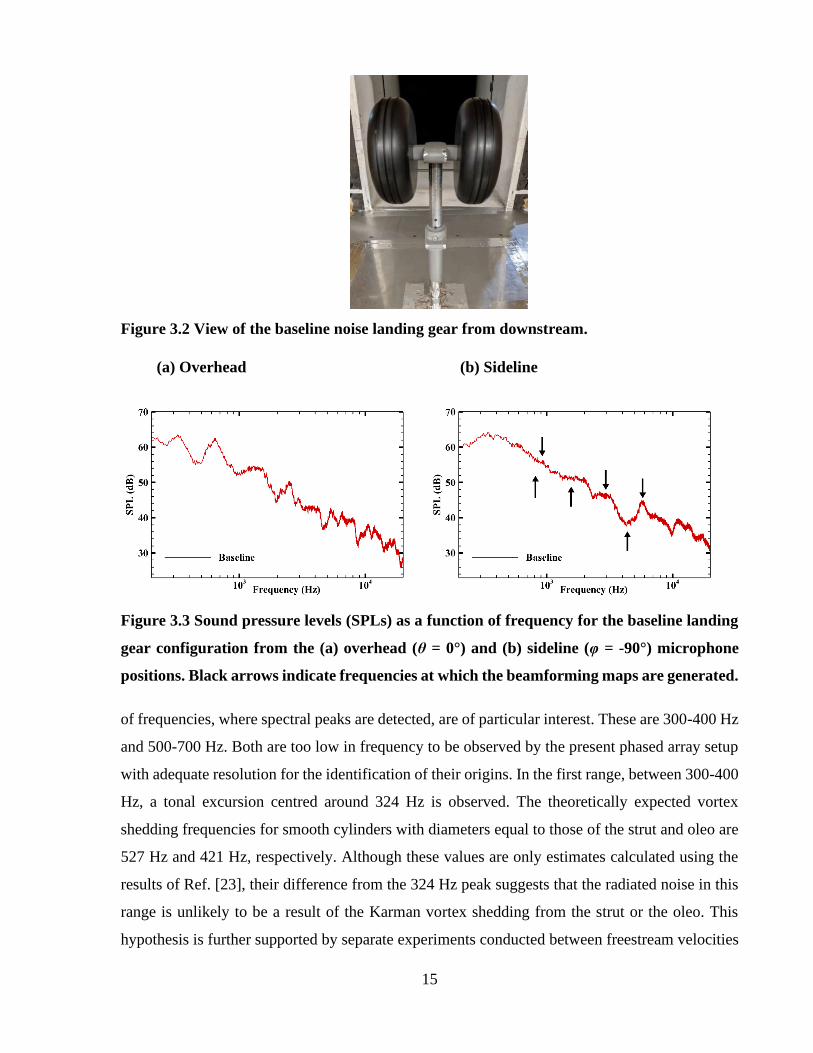
Figure 3.2 View of the baseline noise landing gear from downstream.
(a) Overhead (b) Sideline
Figure 3.3 Sound pressure levels (SPLs) as a function of frequency for the baseline landing
gear configuration from the (a) overhead (θ = 0°) and (b) sideline (φ = -90°) microphone
positions. Black arrows indicate frequencies at which the beamforming maps are generated.
of frequencies, where spectral peaks are detected, are of particular interest. These are 300-400 Hz
and 500-700 Hz. Both are too low in frequency to be observed by the present phased array setup
with adequate resolution for the identification of their origins. In the first range, between 300-400
Hz, a tonal excursion centred around 324 Hz is observed. The theoretically expected vortex
shedding frequencies for smooth cylinders with diameters equal to those of the strut and oleo are
527 Hz and 421 Hz, respectively. Although these values are only estimates calculated using the
results of Ref. [23], their difference from the 324 Hz peak suggests that the radiated noise in this
range is unlikely to be a result of the Karman vortex shedding from the strut or the oleo. This
hypothesis is further supported by separate experiments conducted between freestream velocities
16
of 54 – 68 m/s (results not shared here), where the spectral peak at around 324 Hz was observed
to be independent of both the variations in the freestream velocity as well as the absence or
presence of the oleo. Furthermore, in the sideline spectrum shown in Figure 3.3 (b), a frequency
hump that is broader but peaks at around the same frequency value is also present, which may be
related to the peak centred around the 324 Hz in the flyover direction. Although the origins of this
noise are not possible to isolate based on the present results, in the upcoming sections, further
discussions will be presented related to this tone based on how the SPL varies with the model
configuration variations. The second low frequency range where the noise spectrum of the
overhead microphone, given in Figure 3.3 (a), shows a further tonal peak is between 500-700 Hz.
In this range, the tonal peak is centered at around 648 Hz. The acoustic response in this frequency
excursion is highly directional as it is not present in the sideline spectrum given in Figure 3.3 (b).
Given that it is detected in the overhead direction but not in the sideline position, this peak may
potentially be generated in the inter-wheel region and radiated only in the flyover direction, while
being shielded by the wheels against sideline radiation. Although the source of this tone is not
conclusively apparent from the results presented so far and cannot be deduced from the phased
array data due to the limited resolution of the measurements at such low frequencies, the possible
origins of this noise source will also be discussed in the upcoming sections based on the relation
of this peak to the variations of the landing gear configuration. It is noted that the blade passing
frequency of the anechoic wind tunnel for the freestream velocity of 60 m/s, which is the speed
used in the results presented, is 210 Hz, and hence, unrelated to the two peaks discussed in
association with Figure 3.3.
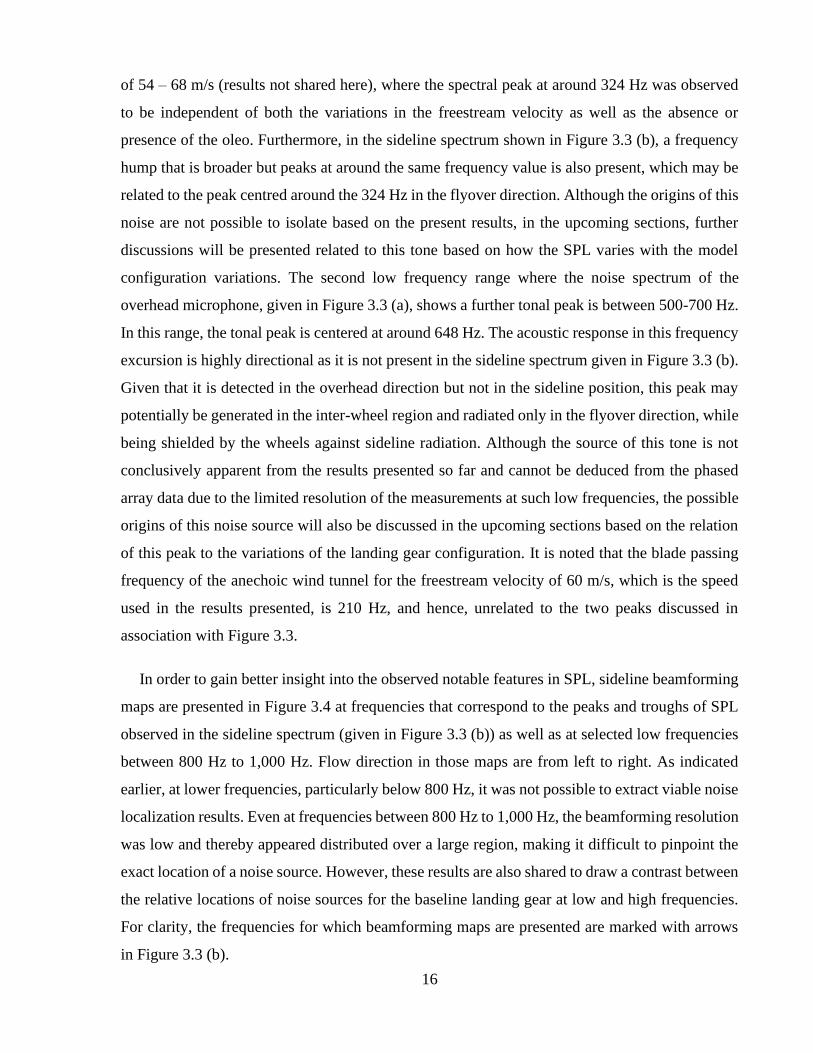
In order to gain better insight into the observed notable features in SPL, sideline beamforming
maps are presented in Figure 3.4 at frequencies that correspond to the peaks and troughs of SPL
observed in the sideline spectrum (given in Figure 3.3 (b)) as well as at selected low frequencies
between 800 Hz to 1,000 Hz. Flow direction in those maps are from left to right. As indicated
earlier, at lower frequencies, particularly below 800 Hz, it was not possible to extract viable noise
localization results. Even at frequencies between 800 Hz to 1,000 Hz, the beamforming resolution
was low and thereby appeared distributed over a large region, making it difficult to pinpoint the
exact location of a noise source. However, these results are also shared to draw a contrast between
the relative locations of noise sources for the baseline landing gear at low and high frequencies.
For clarity, the frequencies for which beamforming maps are presented are marked with arrows
in Figure 3.3 (b).
17
(a) (b)
(c) (d)
(e) (f)
Figure 3.4 Noise source maps for the baseline nose landing gear at low to high frequencies.
Flow is from left to right.
18
The noise localization maps in Figure 3.4 (a) and (b) indicate that the dominant noise at 800
Hz and 904 Hz originate from a region covering the lower portion of the strut and the whole
wheel. At a frequency of 1,504 Hz, the dominant noise source migrates upward, towards the
downstream of the intersection of the strut and oleo, as seen in Figure 3.4 (c). At 3,000 Hz, the
beamforming map in Figure 3.4 (d) identifies the region covering the downstream of the strut,
oleo and upper half of the wheels as significant noise sources. For both the frequencies of 4,504
and 6,000 Hz, two distinct noise sources appear dominant in Figure 3.4 (e) and (f). These sources
are concentrated near the upper oleo region as well as the downstream of the wheels, with 4,504
Hz being prominent downstream of the upper half of the wheel and 6,000 Hz being concentrated
around the downstream of the near-central region of the wheel. It is important to note that the
noise shown to be propagating from around the wheels can possibly be generated in the inter-
wheel region where axle-strut and axle-wheel junctions are also present. However, since these
regions are shielded by the wheels, it is not possible to determine the exact location of the noise
source based on the phased array measurements made from a sideline position.
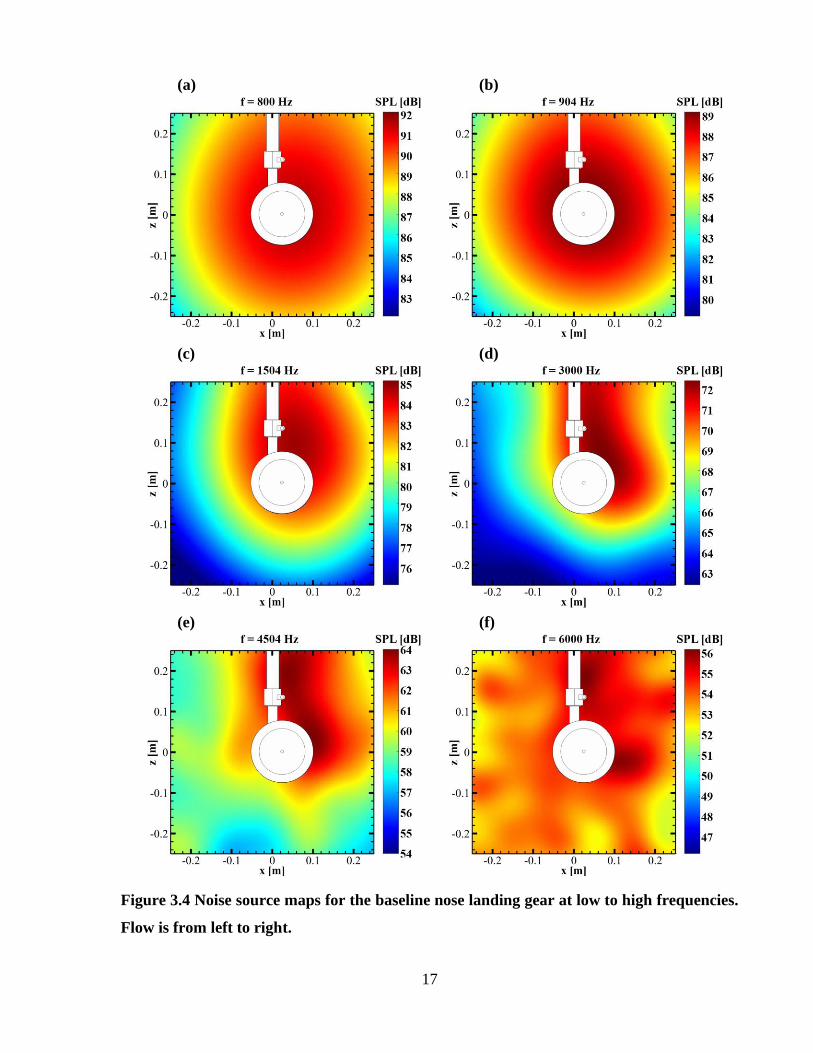
3.3 Tow Hook
Figure 3.5 compares the overhead and sideline SPL spectra of the landing gear model that has
the tow hook attachment against those of the baseline landing gear configuration (without tow
hook). Here, the landing gear model with tow hook is identical to the baseline configuration, with
the only difference being the tow hook attachment to the upstream of the axle. Initially focusing
on the overhead position, shown in Figure 3.5 (a), it can be seen that the overhead tonal peak that
was observed at around 324 Hz in the baseline configuration (in Figure 3.3 (a)) is not affected by
the addition of the tow hook upstream of the axle, suggesting that this noise does not originate
from the axle or the axle-strut junction. Furthermore, the sideline noise spectra, given in Figure
3.5 (b), are almost identical for the configurations with and without tow hook (the latter being the
baseline case). This is expected, since the majority of the tow hook is shielded by the wheels in
the sideline direction. Regarding the second spectral peak centred at around 648 Hz in the
overhead direction, Figure 3.5 (a) shows a decrease of up to 4 dB with the addition of the tow
hook upstream of the axle. Considering this, and the highly directional attributes of the peak at
648 Hz in the flyover direction for both configurations with and without the tow hook, it becomes
highly possible that this peak is generated in the axle and/or the axle-strut interaction region, and
is shielded by the wheels and directed only between the wheels in the overhead direction.
19
(a) Overhead (b) Sideline
Figure 3.5 Comparison of the narrowband noise spectra between landing gear
configurations with and without tow hook for the (a) overhead (θ = 0°) and (b) sideline (φ =
-90°) microphone positions.
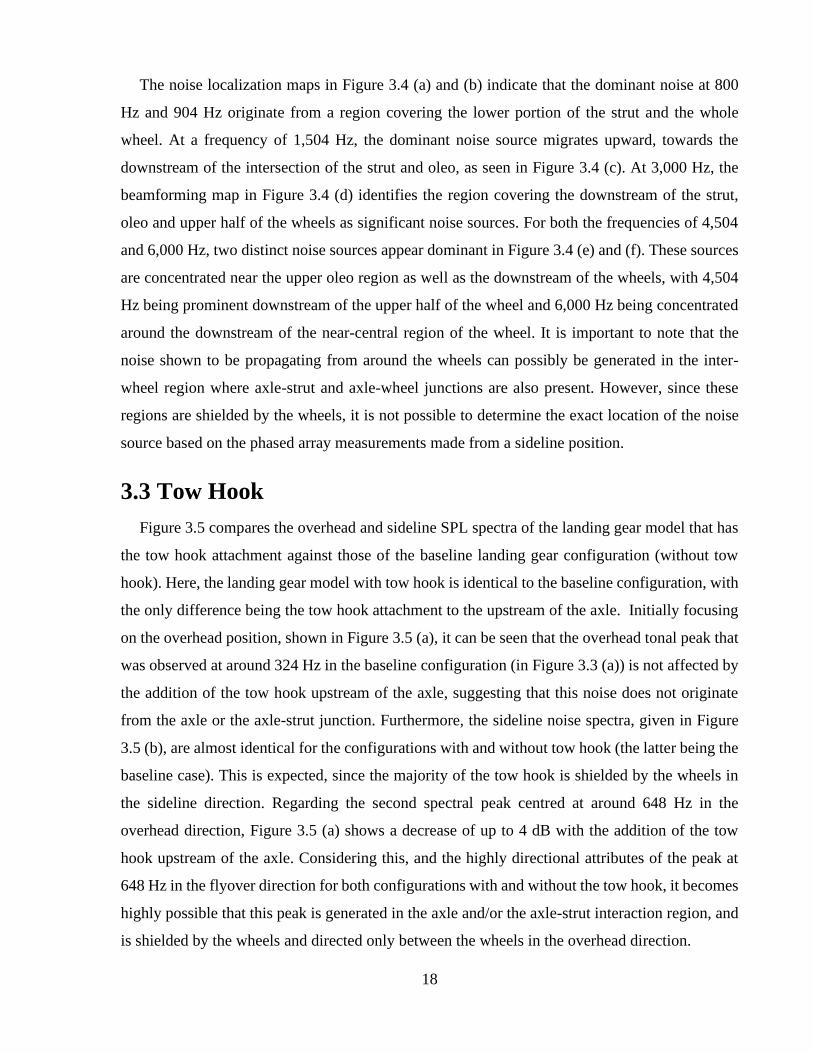
3.4 Torque Link
A total of eight different torque link configurations were tested. Four of these configurations
were mounted downstream of the strut, with the distance between the bottom of the axle and the
bottom of the oleo (which is denoted as L in Figure 3.6) varying from 0.8D to 1.1D in increments
of 0.1D. Varying the L distance altered the inclination of the fixed-length torque link arms with
respect to the strut. The remaining four configurations involved the same L variations with torque
links mounted upstream of the strut.
Figure 3.6 The definition of the distance L, which is measured from the bottom of the axle
to the bottom of the oleo.
20
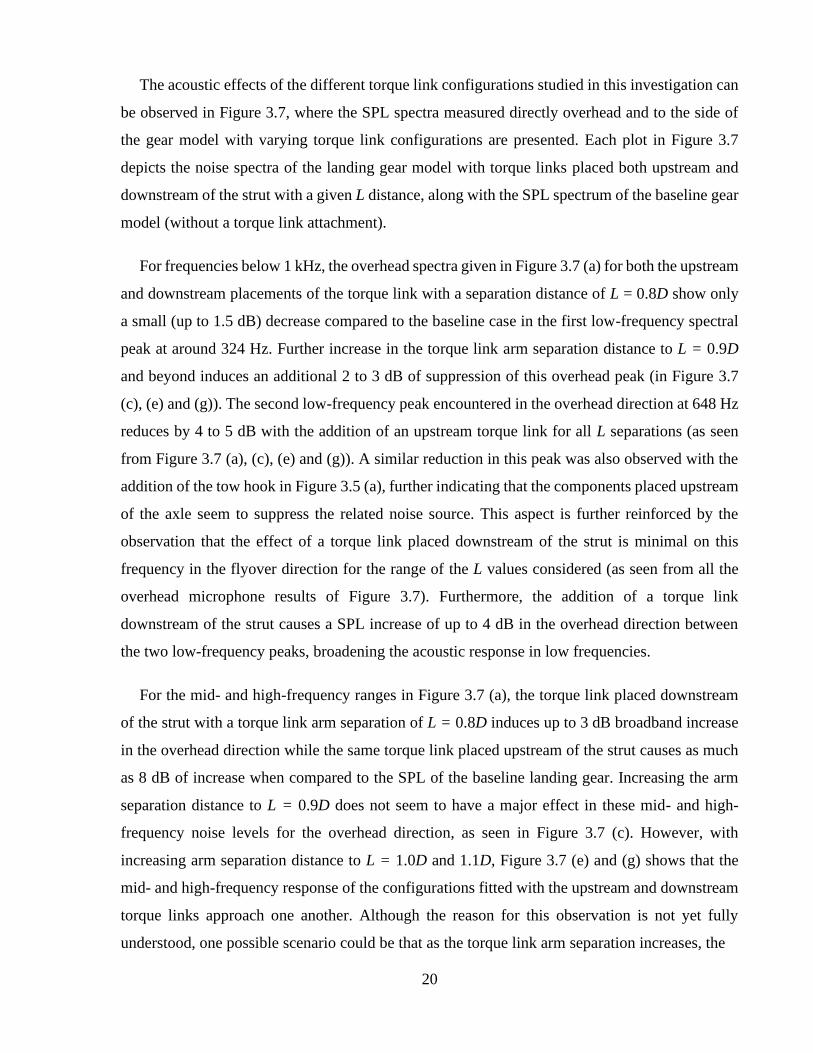
The acoustic effects of the different torque link configurations studied in this investigation can
be observed in Figure 3.7, where the SPL spectra measured directly overhead and to the side of
the gear model with varying torque link configurations are presented. Each plot in Figure 3.7
depicts the noise spectra of the landing gear model with torque links placed both upstream and
downstream of the strut with a given L distance, along with the SPL spectrum of the baseline gear
model (without a torque link attachment).
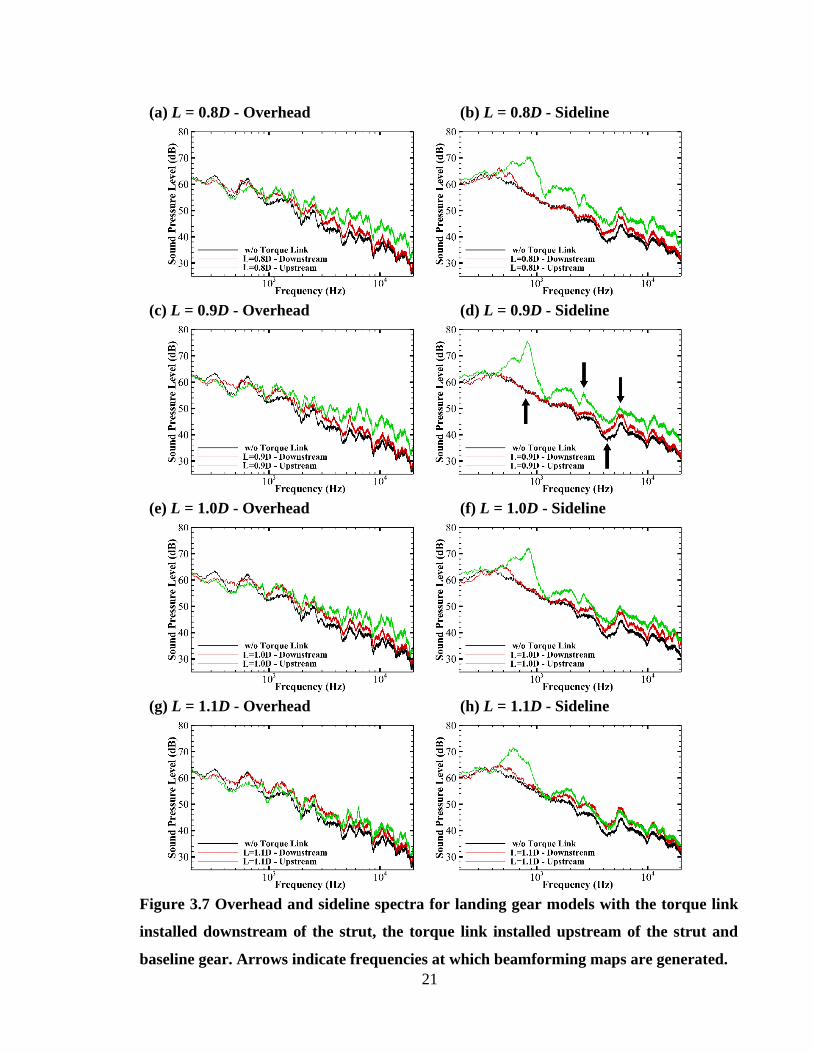
For frequencies below 1 kHz, the overhead spectra given in Figure 3.7 (a) for both the upstream
and downstream placements of the torque link with a separation distance of L = 0.8D show only
a small (up to 1.5 dB) decrease compared to the baseline case in the first low-frequency spectral
peak at around 324 Hz. Further increase in the torque link arm separation distance to L = 0.9D
and beyond induces an additional 2 to 3 dB of suppression of this overhead peak (in Figure 3.7
(c), (e) and (g)). The second low-frequency peak encountered in the overhead direction at 648 Hz
reduces by 4 to 5 dB with the addition of an upstream torque link for all L separations (as seen
from Figure 3.7 (a), (c), (e) and (g)). A similar reduction in this peak was also observed with the
addition of the tow hook in Figure 3.5 (a), further indicating that the components placed upstream
of the axle seem to suppress the related noise source. This aspect is further reinforced by the
observation that the effect of a torque link placed downstream of the strut is minimal on this
frequency in the flyover direction for the range of the L values considered (as seen from all the
overhead microphone results of Figure 3.7). Furthermore, the addition of a torque link
downstream of the strut causes a SPL increase of up to 4 dB in the overhead direction between
the two low-frequency peaks, broadening the acoustic response in low frequencies.
For the mid- and high-frequency ranges in Figure 3.7 (a), the torque link placed downstream
of the strut with a torque link arm separation of L = 0.8D induces up to 3 dB broadband increase
in the overhead direction while the same torque link placed upstream of the strut causes as much
as 8 dB of increase when compared to the SPL of the baseline landing gear. Increasing the arm
separation distance to L = 0.9D does not seem to have a major effect in these mid- and high-
frequency noise levels for the overhead direction, as seen in Figure 3.7 (c). However, with
increasing arm separation distance to L = 1.0D and 1.1D, Figure 3.7 (e) and (g) shows that the
mid- and high-frequency response of the configurations fitted with the upstream and downstream
torque links approach one another. Although the reason for this observation is not yet fully
understood, one possible scenario could be that as the torque link arm separation increases, the
21
(a) L = 0.8D - Overhead (b) L = 0.8D - Sideline
(c) L = 0.9D - Overhead (d) L = 0.9D - Sideline
(e) L = 1.0D - Overhead (f) L = 1.0D - Sideline
(g) L = 1.1D - Overhead (h) L = 1.1D - Sideline
Figure 3.7 Overhead and sideline spectra for landing gear models with the torque link
installed downstream of the strut, the torque link installed upstream of the strut and
baseline gear. Arrows indicate frequencies at which beamforming maps are generated.
22
torque link arms get closer to the strut, and as a result the torque link-strut pair may start acting
like a single bluff body over a larger length of the strut. Flow visualization experiments are
required to shed further light into these acoustic observations.
Focusing on the sideline direction, Figure 3.7 (b) shows that the noise spectrum corresponding
to the landing gear equipped with the upstream torque link, having a separation distance of L =
0.8D, features two prominent low-frequency peaks at 630 Hz and 820 Hz. The same torque link
was observed to suppress the overhead noise by 4 to 5 dB at around 630 Hz in Figure 3.7 (a).
Hence, while reducing the noise radiated in the overhead direction, the upstream torque link
increases the sideline noise levels at 630 Hz by up to 10 dB when compared to the baseline gear,
indicating that the direction of the radiated noise at this frequency is shifted from the overhead
direction to the sideline direction with the presence of the upstream torque link. Inspecting the
sideline spectra for all configurations fitted with an upstream torque link at varying torque link
separations (given in Figure 3.7 (b), (d), (f) and (h)) reveals that the SPL at the low-frequency
peak of 630 Hz stays relatively constant (at around 70 dB) for all torque link arm separation
distances. However, the peak seen at 820 Hz rises to 76 dB at a separation of L = 0.9D (in Figure
3.7 (d)), and decreases to 73 dB and 66 dB with torque link separations of L = 1.0D and L = 1.1D,
respectively (as shown in Figure 3.7 (f) and (h)). Hence, the dependence of this peak to the
upstream torque link separation suggests that the peak at 820 Hz may be a result of the interaction
between the upstream torque link and the strut.
Focusing the attention to the mid- and high- frequency range of the sideline spectra for a torque
link arm separation of L = 0.8D (shown in Figure 3.7 (b)), addition of the downstream torque link
induces an increase of up to 1 dB in the 2 to 3 kHz range and 3 dB in the 3 to 6 kHz range.
Increasing the separation to L = 0.9D does not seem to cause a significant change in this acoustic
character (as seen in Figure 3.7 (d)). Further increasing the separation to L = 1.0D and L = 1.1D
induces a small increase of 2 dB in SPL in the 1 to 2 kHz range, and up to 3 dB at frequencies
beyond 2 kHz when compared against the response of the baseline gear in Figure 3.4 (f) and (h).
Therefore, in general, the downstream torque link appears to increase the mid- to high-frequency
range only slightly. On the other hand, the addition of a torque link upstream of the strut with an
arm separation distance of L = 0.8D (in Figure 3.7 (b)) induces a much more significant increase
in noise. The broadband noise rises by 6 dB at frequencies of 3 kHz and higher. An additional
increase can be seen around 2.65 kHz that induces a 9 dB increase of noise when compared to the
23
response of the baseline landing gear at that same frequency. Furthermore, a broadband noise
level rise of 8 dB can be seen between 1.1 to 2 kHz. Increasing the torque link arm separation to
L = 0.9D (Figure 3.7 (d)) does not seem to cause any significant changes in the mid- and high-
frequency spectra for the gear equipped with the upstream torque link when compared to the L =
0.8D counterpart. However, with a further increase in arm separation, to L = 1.0D, the increases
in noise levels in the mid- and high- frequencies become lesser, and eventually for L = 1.1D, the
noise levels of the gear with the upstream and downstream torque links in the mid- and high-
frequencies collapse under a similar spectrum. A comparable trend was also observed earlier in
the overhead SPL in Figure 3.7 (g). As indicated earlier, this similarity in noise spectra for the
upstream and downstream placements of a torque link at large torque link arm separation distances
may be linked to the coupling of the torque link and strut as a single bluff body due to their close
proximity.
Beamforming results for landing gears with torque link arm separation distances of L = 0.8D,
0.9D, and 1.0D are found to depict similar locations for the noise sources, despite slight variations
in sound pressure levels. Therefore, the beamforming results that will be displayed in this section
for the landing gear with a torque link separation of L = 0.9D can be taken as representative of all
three L distances. Beamforming maps that will be discussed here are constructed at selected
frequencies that correspond to significant noise level contributions in the presence of the torque
links. Arrows in Figure 3.7 (d) mark these frequencies.
For the upstream and downstream placement of the torque link with L = 0.9D, Figure 3.8 shows
the beamforming maps at 824 Hz, which corresponds to the second prominent low-frequency
peak recorded by the sideline microphone in presence of the upstream torque link in Figure 3.7
(d). Due to the poor resolution of the beamforming array at low frequencies, it is not possible to
distinctively identify the individual noise sources within the landing gear, and therefore, Figure
3.8 (a) shows the source of this low frequency noise as one large region covering the entire wheel,
axle and the torque link for the landing gear with downstream torque link. In the case of the gear
with upstream torque link, Figure 3.8 (b) shows the upper torque link arm and the oleo intersection
region as the major contributor to noise at 824 Hz. In fact, the presence of such a sharp main lobe
at such a low frequency in Figure 3.8 (b) is in accord with the high level of the tonal response
seen at around 820 Hz in Figure 3.7 (d).
24
(a) Downstream torque link (b) Upstream torque link
Figure 3.8 Low-frequency beamforming maps of the landing gear equipped with (a) a torque
link downstream of the strut and (b) a torque link upstream of the strut. The separation in
torque link arms is L = 0.9D. Flow is from left to right.
Mid- and high-frequency beamforming maps for the same landing gear configurations with
downstream and upstream torque links (having L = 0.9 D) are shown in Figure 3.9. Based on
Figure 3.9 (a), the source of major noise generation at 2.6 kHz is the junction between the strut
and the upper arm of the torque link for the landing gear with the downstream torque link.
However, Figure 3.9 (b) shows that, for the gear with upstream torque link, the dominant noise at
2.6 kHz originates from an area between the lower arm of the torque link and the strut, and is 8
dB more intense when compared to the acoustic response of the gear with downstream torque
link, given in Figure 3.9 (a). The difference in the levels of acoustic response at this frequency is
in agreement with the spectra results shared in Figure 3.7 (d).
From Figure 3.9 (c) and (d), it can be seen that the dominant noise generation at 4.5 kHz occurs
from the upper arm of the torque links, including the connection between the upper arm and the
oleo regions, for both landing gear configurations (with a torque link in the downstream as well
as upstream of the strut). However, the acoustic response originating from the upper arm of the
upstream torque link is approximately 2 dB higher than that of the downstream torque link. The
major contributor to noise at 6 kHz for the gear with downstream torque link is observed to be the
connection region between the upper arm of the torque link and the oleo in Figure 3.9 (e). Notice
that for the case of the gear with downstream torque link, as the frequency increases, the dominant
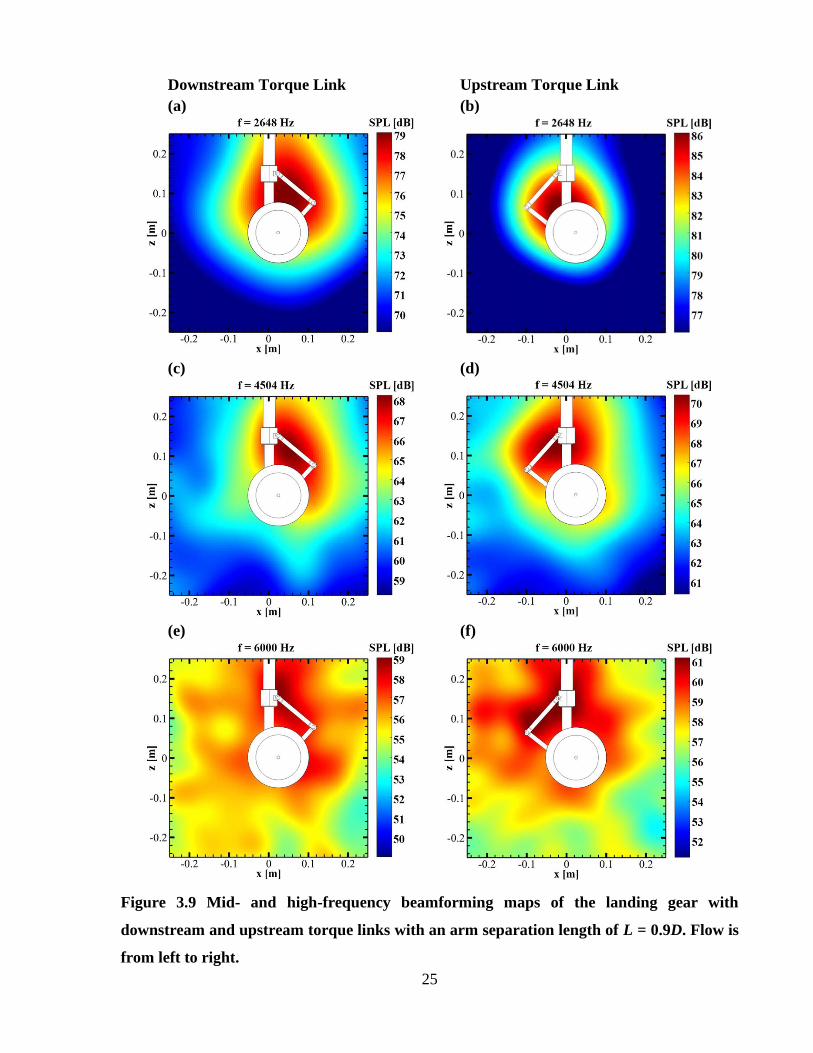
25
Downstream Torque Link Upstream Torque Link
(a) (b)
(c) (d)
(e) (f)
Figure 3.9 Mid- and high-frequency beamforming maps of the landing gear with
downstream and upstream torque links with an arm separation length of L = 0.9D. Flow is
from left to right.
26
noise source associated with that frequency migrates upwards from the wheel region to the oleo.
This trend can be observed by inspecting Figure 3.8 (a), Figure 3.9 (a), (c) and (f). For the case
with the upstream torque link, Figure 3.9 (f) shows two distinct major noise sources at 6 kHz. The
first major source comes from the region in which the upper arm connects to the oleo, and the
second is the lower section of the upper torque link arm, just above the connection points between
the two torque link arms.
Figure 3.10 depicts the beamforming map of the landing gear equipped with an upstream torque
link having a separation of L = 1.1D. The case for this configuration is presented separately from
the rest due to its clear distinction in high frequency noise localization results. The dominant noise
source at 6 kHz that was observed for the L = 0.8D, 0.9D, and 1.0D cases (as shown in Figure 3.9
(f)), at the lower portion of the upper torque link arm, no longer appears with the increase of arm
separation to L = 1.1D. Without further study of the flow field, it is difficult to deduce the reason
behind this phenomenon or the other trends observed for torque link noise sources, however, one
possible reason behind the latter observation could be associated with the two torque link arms no
longer meeting at sharp angles relative to each other, due to their increased separation.
Figure 3.10 Beamforming map at 6 kHz for the landing gear equipped with the upstream
torque link that has a torque link arm separation length of L = 1.1D. Flow is from left to
right.
Noise spectra observed by each microphone located in the flyover and sideline linear arrays
were integrated over the 200 – 20,000 Hz range to determine the OASPL directivity patterns for
each landing gear configuration equipped with a torque link. Figure 3.11 presents the OASPL
27
directivities for all torque-link-fitted landing gear configurations considered in this study and for
the baseline landing gear.
Figure 3.11 (a) shows that, in the flyover direction, the noise directivities of landing gears
equipped with a downstream torque link (with any of the L values) are roughly omnidirectional
in the measured flyover angular range of θ = +30° to -30°, as is the case for the baseline gear,
despite the gear with torque links having 3 to 5 dB of higher OASPLs. On the other hand, OASPL
directivity patterns for gears equipped with an upstream torque link (for all L) have their minimum
levels at the overhead location of θ = 0° and their response intensifies by up to 6 dB with the
increase in the flyover angle, θ, in either direction. This indicates a highly directional radiation of
noise in the flyover direction for the landing gear equipped with any of the upstream torque links.
It was also seen in Figure 3.7 that the low-frequency prominent noise emitted by the gear with
upstream torque links was highly directional.
Focusing on Figure 3.11 (b), where the sideline OASPL directivities are presented, the overall
shapes of the directivities between the landing gear with upstream and downstream torque links
look roughly similar, despite greatly varying in OASPLs. After the baseline landing gear, the
quietest configuration is observed to be the model equipped with the downstream torque link
having a separation of L = 1.0D. Its OASPLs are close to those of the baseline landing gear
without torque links. Although, as the sideline angle, φ, moves away from -90°, the OASPL
difference between this configuration and the baseline increases slightly. On the other hand, the
gears equipped with the upstream counterparts of the torque links generate approximately 15 dB
higher acoustic response. It is important to note that with the increase of separation to L =1.1D,
the OASPLs of the two configurations start gradually getting closer to one another. In other words,
the quietest upstream torque link is the one with a separation of L =1.1D while the loudest
downstream configuration is the one with the same separation, as seen in Figure 3.11 (b).
Flyover noise emissions for the landing gears equipped with an upstream torque link were seen
to be highly directional in Figure 3.11 (a). Hence, a further spectral analysis throughout the entire
θ = ±30° range is necessary to understand the origins of this directionality. Figure 3.12 (a) depicts
the OASPL directivity pattern in the flyover direction for the landing gear model equipped with
the upstream torque link having a separation of L = 0.9D, and Figure 3.12 (b) to (h) compares the
noise level spectra of the same landing gear configuration recorded by each microphone in the
flyover linear array along with those of the baseline landing gear.
28
(a) Flyover noise radiation directivities (b) Sideline noise radiation directivities
Figure 3.11 Flyover and Sideline directivities of landing gear with and without torque links.
(d) θ = -10° (e) θ = 0° (f) θ = +10°
(c) θ = -20° (a) Flyover Directivities (g) θ = +20°
Figure 3.12 The OASPL directivity map in the flyover direction and the SPL spectra of the
landing gear between θ = -30° to +30° positions with the upstream torque link having L =
0.9D (shown in green) and without the torque link (shown in black).
(b) θ = -30° (h) θ = +30°
29
In Figure 3.12, for the landing gear with upstream torque link, as the angular location of the
microphone in flyover shifts from being at θ = 0° to θ = ±30° (approaching the sideline direction),
the low frequency peak at 630 Hz gradually grows in amplitude and a new peak at 820 Hz starts
gradually appearing, with the latter eventually becoming the most pronounced at the largest θ
angles. The 630 Hz peak that was observed only in the flyover direction without the presence of
torque links (in Figure 3.3 (a)) gradually intensifies with the presence of the torque link placed
upstream of the strut as one moves from the θ = 0° to θ = ±30°, reaching its maximum directly in
the sideline direction (shown previously in Figure 3.11 (a)). A peak at 820 Hz was not observed
in the overhead spectra given in Fig 3.7 (c), because, as evident from Figure 3.12, it completely
disappears as one moves from θ = ±30° to the overhead location of θ = 0°. Combining this
information with the beamforming map in Figure 3.8 (b), it is evident that the tones observed at
820 Hz originate from the upper arm of the torque links and radiate in the sideline (±y) directions.
3.5 Steering System
This section describes the acoustic response of the nose landing gear with varying steering
system configurations. A total of 20 steering systems were tested, with the first 10 being flat-
tipped steering actuators set between α = 0° to 90°, relative to the freestream flow, as shown in
Figure 3.13. Later, the steering actuators were fitted with rounded caps and the experiments were
repeated. The acoustic results of the gear equipped with flat-tipped actuators are presented here
before the results of the gear with round-tipped actuators. Here, 𝛼 = 0° defines a steering actuator
aligned in the freestream direction with its free end pointing upstream. Additionally, Figure 3.14
shows the steering actuators and steering brackets that make up the steering system on the landing
gear model.
Figure 3.13 Schematic defining the angle α between the axis of the steering actuator and
the freestream direction. Here, the flow direction is from top to bottom.
30
Figure 3.14 Frontal and isometric views of the landing gear with steering actuators
installed at α = 60°.
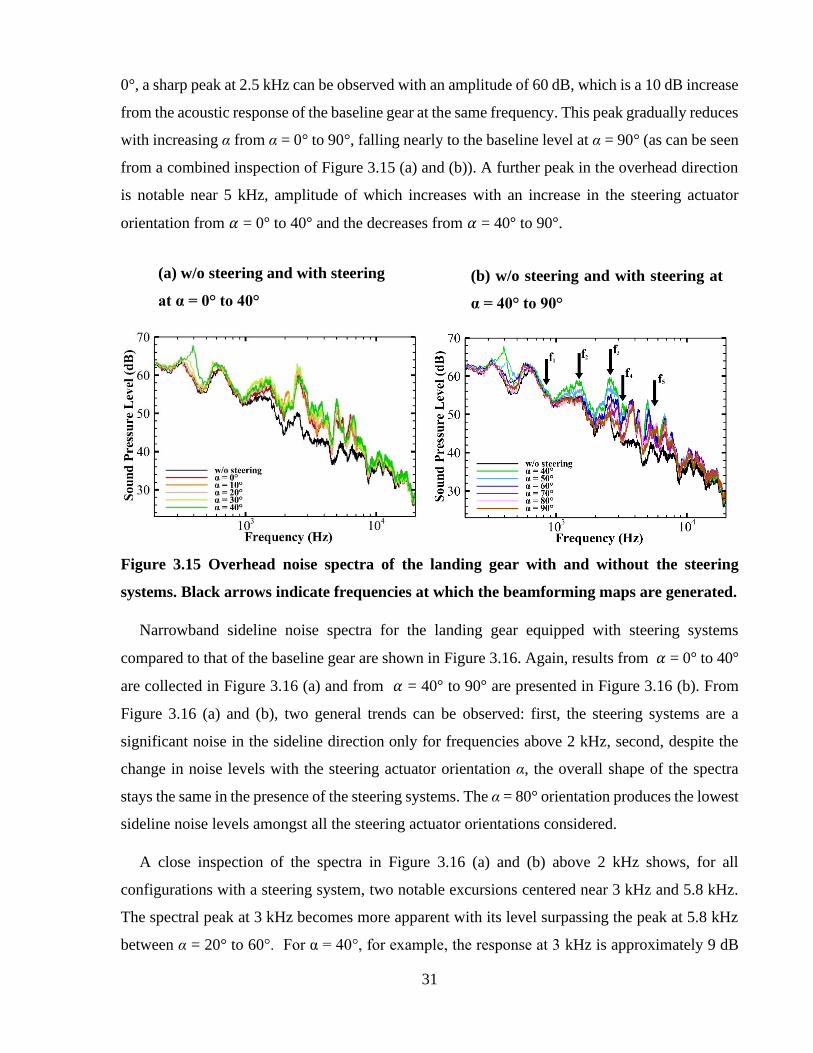
3.5.1 Flat-tipped Steering Actuators
Narrowband overhead noise level spectra of landing gears equipped with varying orientations
of the flat-tipped steering actuators (from 𝛼 = 0° to 90° in 10° increments) are compared to those
of the baseline landing gear in Figure 3.15. Spectral results for the steering actuator orientations
of 𝛼 = 0° to 40° are collected in Figure 3.15 (a) along with the spectrum of the baseline landing
gear configuration, and the spectra for 𝛼 = 40° to 90° along with that of the baseline case are given
in Figure 3.15 (b). From Figure 3.15 (a) and (b), two general trends can be observed: first, steering
systems mainly contribute to overhead noise that is in the frequency range of 1 kHz and 8 kHz,
and secondly, the noise levels increase from α = 0° to α = 40°, then gradually reduce with
increasing α up to α = 90°. In fact, α = 90°, which is the landing gear configuration with the
actuators placed perpendicular to the freestream flow, produces the lowest noise levels amongst
the landing gear configurations with an actuator assembly.
Figure 3.15 (a) and (b) show that the steering systems do not induce significant acoustic
contribution to the low-frequency peaks that were observed for the baseline configuration at 324
Hz and 648 Hz in the overhead direction. This suggests that these low frequency noise sources do
not originate from anywhere near the steering system installation location or the oleo region.
Between 1 kHz and 2 kHz, a hump exists in the overhead noise spectra for all configurations. This
hump gradually increases in amplitude with the addition of the actuators from α = 0° to 30° (in
Figure 3.15 (a)), and with further increase in α, it gradually decreases till α = 60° (as seen Figure
3.15 (b)). Beyond this angle, the hump in the 1 to 2 kHz range is roughly equal to that found on
the baseline landing gear without a steering system (Figure 3.15 (b)). In Figure 3.15 (a), for α =
31
0°, a sharp peak at 2.5 kHz can be observed with an amplitude of 60 dB, which is a 10 dB increase
from the acoustic response of the baseline gear at the same frequency. This peak gradually reduces
with increasing α from α = 0° to 90°, falling nearly to the baseline level at α = 90° (as can be seen
from a combined inspection of Figure 3.15 (a) and (b)). A further peak in the overhead direction
is notable near 5 kHz, amplitude of which increases with an increase in the steering actuator
orientation from 𝛼 = 0° to 40° and the decreases from 𝛼 = 40° to 90°.
Figure 3.15 Overhead noise spectra of the landing gear with and without the steering
systems. Black arrows indicate frequencies at which the beamforming maps are generated.
Narrowband sideline noise spectra for the landing gear equipped with steering systems
compared to that of the baseline gear are shown in Figure 3.16. Again, results from 𝛼 = 0° to 40°
are collected in Figure 3.16 (a) and from 𝛼 = 40° to 90° are presented in Figure 3.16 (b). From
Figure 3.16 (a) and (b), two general trends can be observed: first, the steering systems are a
significant noise in the sideline direction only for frequencies above 2 kHz, second, despite the
change in noise levels with the steering actuator orientation α, the overall shape of the spectra
stays the same in the presence of the steering systems. The α = 80° orientation produces the lowest
sideline noise levels amongst all the steering actuator orientations considered.
A close inspection of the spectra in Figure 3.16 (a) and (b) above 2 kHz shows, for all
configurations with a steering system, two notable excursions centered near 3 kHz and 5.8 kHz.
The spectral peak at 3 kHz becomes more apparent with its level surpassing the peak at 5.8 kHz
between α = 20° to 60°. For α = 40°, for example, the response at 3 kHz is approximately 9 dB
(a) w/o steering and with steering
at α = 0° to 40°
(b) w/o steering and with steering at
α = 40° to 90°
32
higher than that observed for the baseline landing gear. Beyond α = 60°, the acoustic response
sharply reduces to a level that is only about 1.5 dB above that found on the landing gear without
a steering system. The peak that is centered around 6.9 kHz stays unchanged of the α variations
between α = 0° to 60°. After α = 60°, although this peak is reduced by abound 2 dB, it still remains
3.5 dB higher than the peak of the baseline scenario at the same frequency.
The change of noise level spectra with respect to the steering actuator angle, α, may not be a
result of the steering actuator only. Each variation in α required a slightly modified steering
bracket to be constructed. The variable dimensions of the steering bracket are depicted in Figure
3.3 (a). It is therefore possible that the variance in overhead and sideline acoustic response with
respect to α may be a result of the geometric modifications made to the steering brackets. Thus,
the steering system noise may be predominantly generated within the steering bracket region, or
by the interaction between the wake of the steering actuators and the steering bracket.
Figure 3.16 Sideline noise spectra of the landing gear with and without the steering systems.
Black arrows indicate frequencies at which the beamforming maps are generated.
Figure 3.17 presents the band limited OASPL directivities of landing gear in the sideline
direction (from 𝜑 = -60° to -120°) for varying steering actuator orientations (from 𝛼 = 0° to 90°
in 10° increments), in comparison to that of the landing gear without steering actuators. The range
of frequencies in which the band limited OASPLs have been calculated correspond to the two
excursions observed in sideline spectra given in Figure 3.16 (a) and (b) (one being centred around
3 kHz and the other around 5.8 kHz).
(a) w/o steering and with steering
at α = 0° to 40°
(b) w/o steering and with steering at
α = 40° to 90°
33
(a) In the 2.5 kHz to 4 kHz range (b) In the 5 kHz to 7 kHz range
Figure 3.17 Sideline noise directivities of landing gear with and without steering systems at
two selected frequency ranges.
Figure 3.17 (a) shows that at low α values, the sideline response is asymmetrical compared to
the φ = -90° location between 2.5 kHz to 4 kHz, such that the acoustic response is up to 2 dB
more intense in the upstream sideline direction (φ = -120°) than it is in the downstream sideline
direction (φ = -60°) for α ≤ 50°. For α > 50°, the response in the same frequency range flattens
and becomes omnidirectional similar to the baseline landing gear. Conversely, between 5 kHz to
7 kHz, the baseline configuration as well as the configurations with steering actuators at high α
values, α > 50°, exhibit asymmetrical directivity characteristics, while the steering actuators with
lower α values show an omnidirectional response.
Based on the flyover and sideline microphone measurements in Figure 3.15 and 3.16, and the
directivity results in Figure 3.17, it is evident that, for landing gears equipped with steering
actuators, placing the actuators at α = 40° generates the most intense response, whereas α = 80°
gives the quietist. Also, as α increases, the landing gear starts exhibiting an acoustic response
similar to the baseline gear in terms of the directivity.
It was observed in Figure 3.16 that the steering systems do not contribute to the sideline noise
levels below 2 kHz. These results are further validated by the low frequency beamforming maps,
given in Figure 3.18. In a similar manner as shown earlier in the baseline beamforming results (in
Figure 3.4 (a) and (b)), at lower frequencies such as 824 Hz and 1,504 Hz (in Figure 3.18 (a) and
(b) respectively), the dominant noise generation occurs in the general area of the wheel and strut
region.
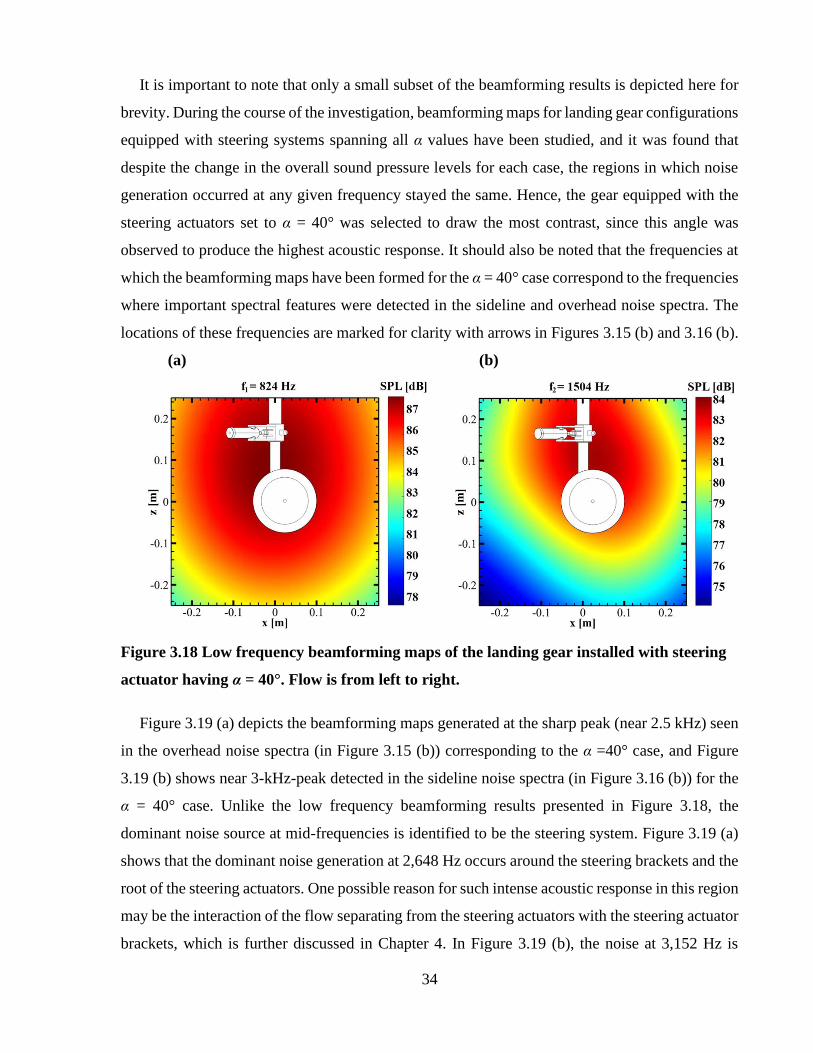
34
It is important to note that only a small subset of the beamforming results is depicted here for
brevity. During the course of the investigation, beamforming maps for landing gear configurations
equipped with steering systems spanning all α values have been studied, and it was found that
despite the change in the overall sound pressure levels for each case, the regions in which noise
generation occurred at any given frequency stayed the same. Hence, the gear equipped with the
steering actuators set to α = 40° was selected to draw the most contrast, since this angle was
observed to produce the highest acoustic response. It should also be noted that the frequencies at
which the beamforming maps have been formed for the α = 40° case correspond to the frequencies
where important spectral features were detected in the sideline and overhead noise spectra. The
locations of these frequencies are marked for clarity with arrows in Figures 3.15 (b) and 3.16 (b).
(a) (b)
Figure 3.18 Low frequency beamforming maps of the landing gear installed with steering
actuator having α = 40°. Flow is from left to right.
Figure 3.19 (a) depicts the beamforming maps generated at the sharp peak (near 2.5 kHz) seen
in the overhead noise spectra (in Figure 3.15 (b)) corresponding to the α =40° case, and Figure
3.19 (b) shows near 3-kHz-peak detected in the sideline noise spectra (in Figure 3.16 (b)) for the
α = 40° case. Unlike the low frequency beamforming results presented in Figure 3.18, the
dominant noise source at mid-frequencies is identified to be the steering system. Figure 3.19 (a)
shows that the dominant noise generation at 2,648 Hz occurs around the steering brackets and the
root of the steering actuators. One possible reason for such intense acoustic response in this region
may be the interaction of the flow separating from the steering actuators with the steering actuator
brackets, which is further discussed in Chapter 4. In Figure 3.19 (b), the noise at 3,152 Hz is
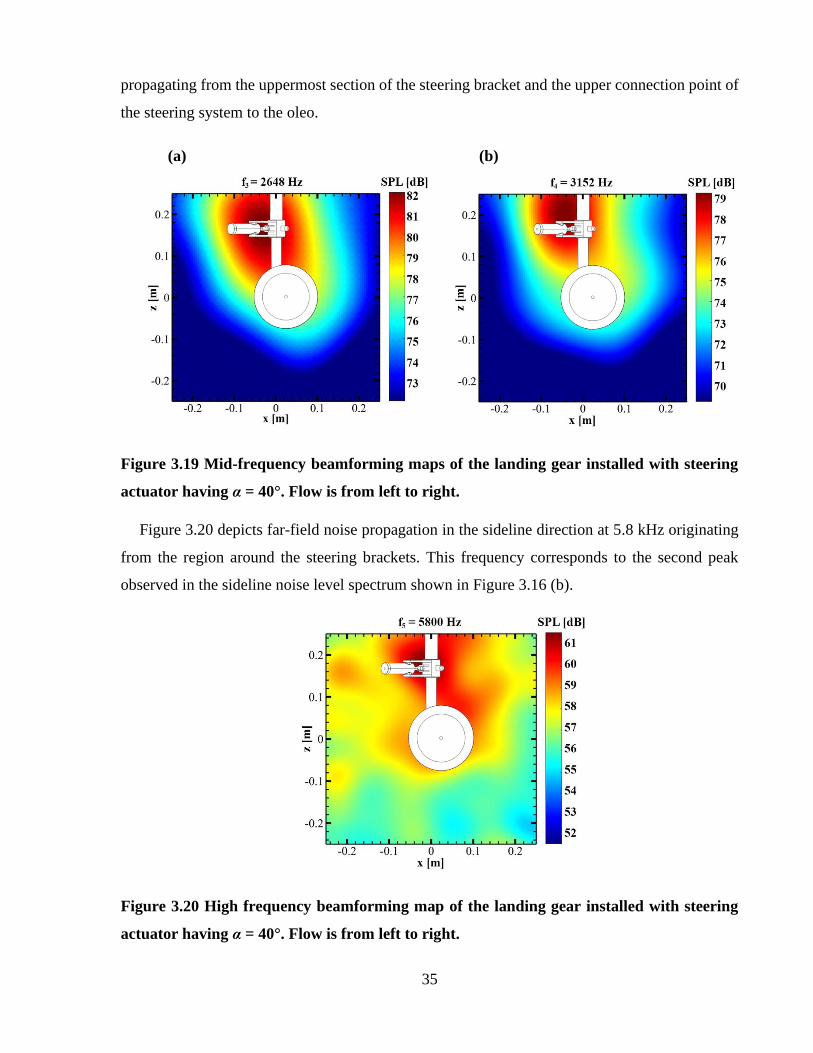
35
propagating from the uppermost section of the steering bracket and the upper connection point of
the steering system to the oleo.
(a) (b)
Figure 3.19 Mid-frequency beamforming maps of the landing gear installed with steering
actuator having α = 40°. Flow is from left to right.
Figure 3.20 depicts far-field noise propagation in the sideline direction at 5.8 kHz originating
from the region around the steering brackets. This frequency corresponds to the second peak
observed in the sideline noise level spectrum shown in Figure 3.16 (b).
Figure 3.20 High frequency beamforming map of the landing gear installed with steering
actuator having α = 40°. Flow is from left to right.
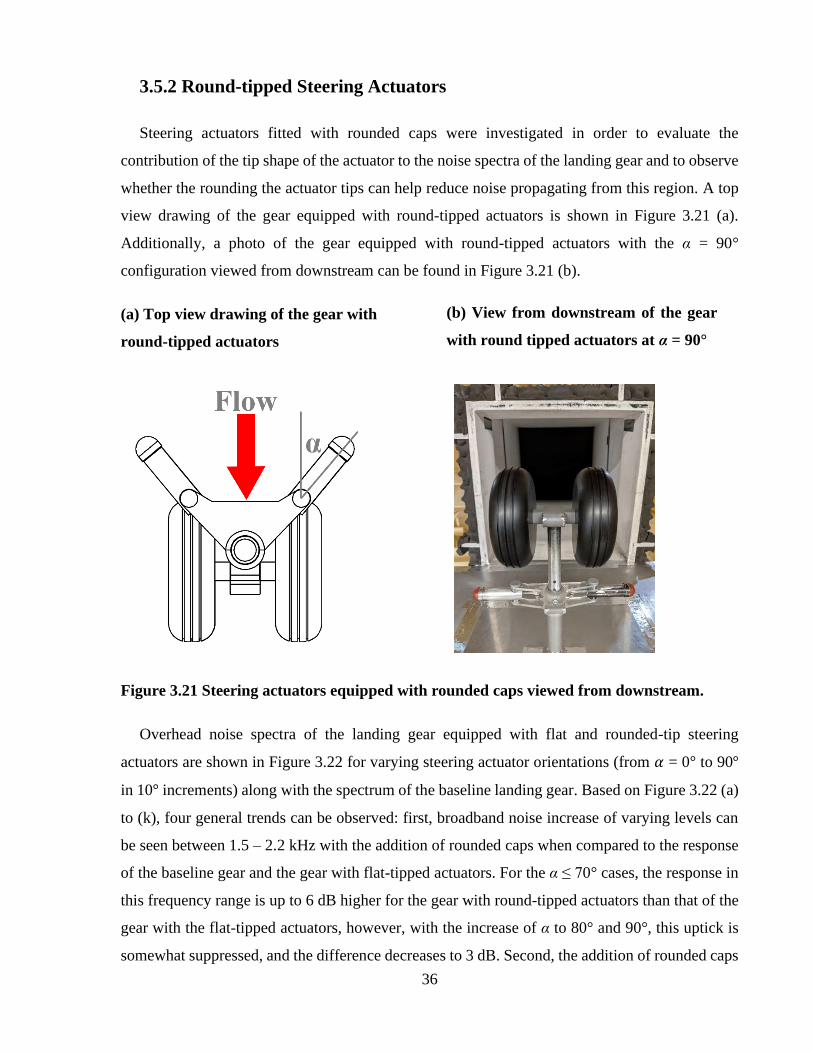
36
3.5.2 Round-tipped Steering Actuators
Steering actuators fitted with rounded caps were investigated in order to evaluate the
contribution of the tip shape of the actuator to the noise spectra of the landing gear and to observe
whether the rounding the actuator tips can help reduce noise propagating from this region. A top
view drawing of the gear equipped with round-tipped actuators is shown in Figure 3.21 (a).
Additionally, a photo of the gear equipped with round-tipped actuators with the α = 90°
configuration viewed from downstream can be found in Figure 3.21 (b).
(a) Top view drawing of the gear with
round-tipped actuators
Figure 3.21 Steering actuators equipped with rounded caps viewed from downstream.
Overhead noise spectra of the landing gear equipped with flat and rounded-tip steering
actuators are shown in Figure 3.22 for varying steering actuator orientations (from 𝛼 = 0° to 90°
in 10° increments) along with the spectrum of the baseline landing gear. Based on Figure 3.22 (a)
to (k), four general trends can be observed: first, broadband noise increase of varying levels can
be seen between 1.5 – 2.2 kHz with the addition of rounded caps when compared to the response
of the baseline gear and the gear with flat-tipped actuators. For the α ≤ 70° cases, the response in
this frequency range is up to 6 dB higher for the gear with round-tipped actuators than that of the
gear with the flat-tipped actuators, however, with the increase of α to 80° and 90°, this uptick is
somewhat suppressed, and the difference decreases to 3 dB. Second, the addition of rounded caps
(b) View from downstream of the gear
with round tipped actuators at α = 90°
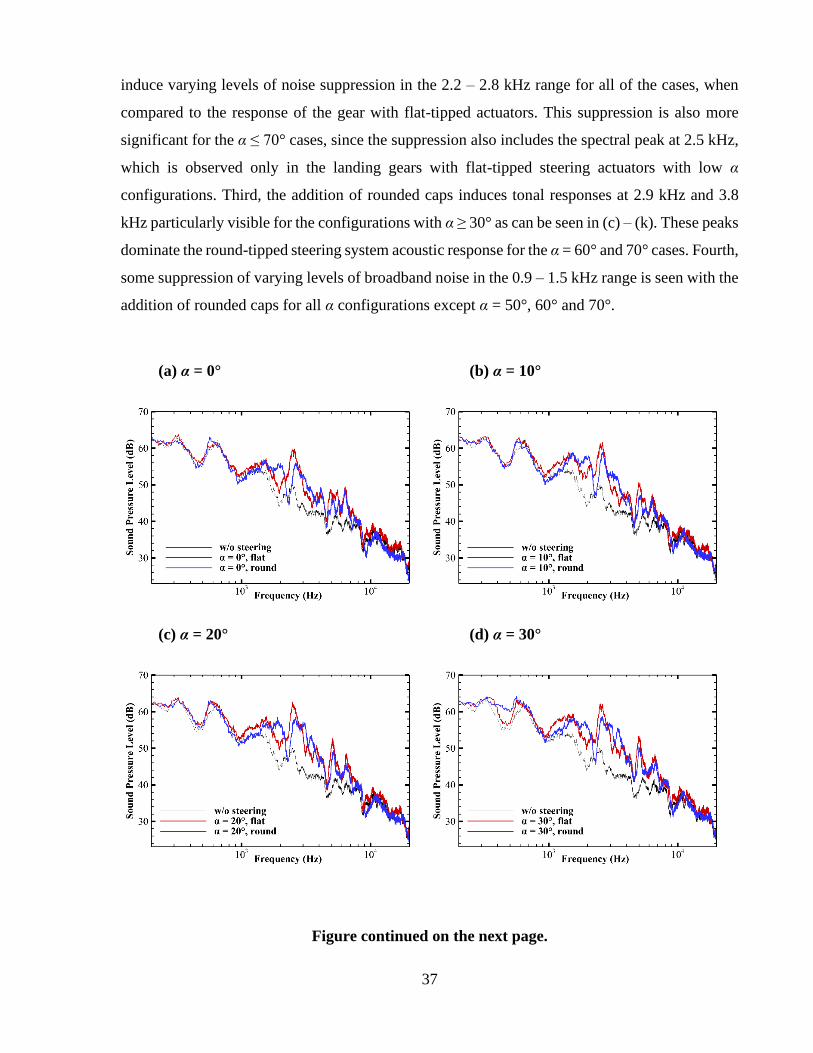
37
induce varying levels of noise suppression in the 2.2 – 2.8 kHz range for all of the cases, when
compared to the response of the gear with flat-tipped actuators. This suppression is also more
significant for the α ≤ 70° cases, since the suppression also includes the spectral peak at 2.5 kHz,
which is observed only in the landing gears with flat-tipped steering actuators with low α
configurations. Third, the addition of rounded caps induces tonal responses at 2.9 kHz and 3.8
kHz particularly visible for the configurations with α ≥ 30° as can be seen in (c) – (k). These peaks
dominate the round-tipped steering system acoustic response for the α = 60° and 70° cases. Fourth,
some suppression of varying levels of broadband noise in the 0.9 – 1.5 kHz range is seen with the
addition of rounded caps for all α configurations except α = 50°, 60° and 70°.
(a) α = 0° (b) α = 10°
(c) α = 20° (d) α = 30°
Figure continued on the next page.
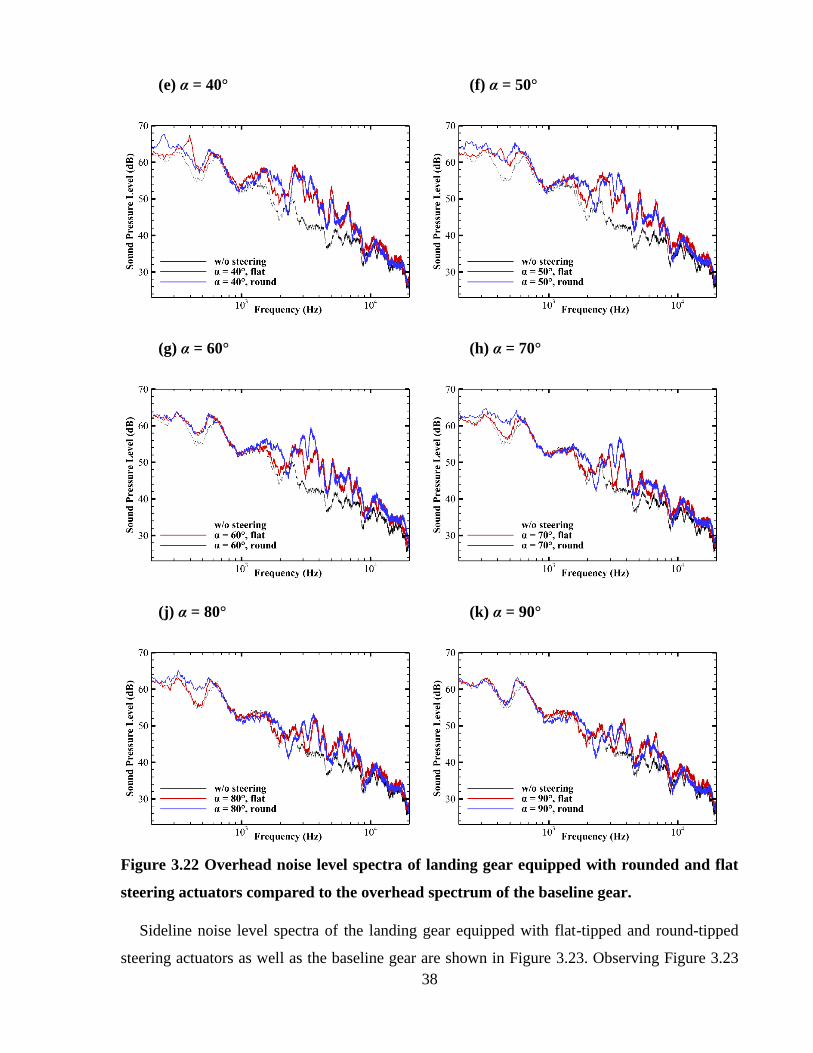
38
(e) α = 40° (f) α = 50°
(g) α = 60° (h) α = 70°
(j) α = 80° (k) α = 90°
Figure 3.22 Overhead noise level spectra of landing gear equipped with rounded and flat
steering actuators compared to the overhead spectrum of the baseline gear.
Sideline noise level spectra of the landing gear equipped with flat-tipped and round-tipped
steering actuators as well as the baseline gear are shown in Figure 3.23. Observing Figure 3.23
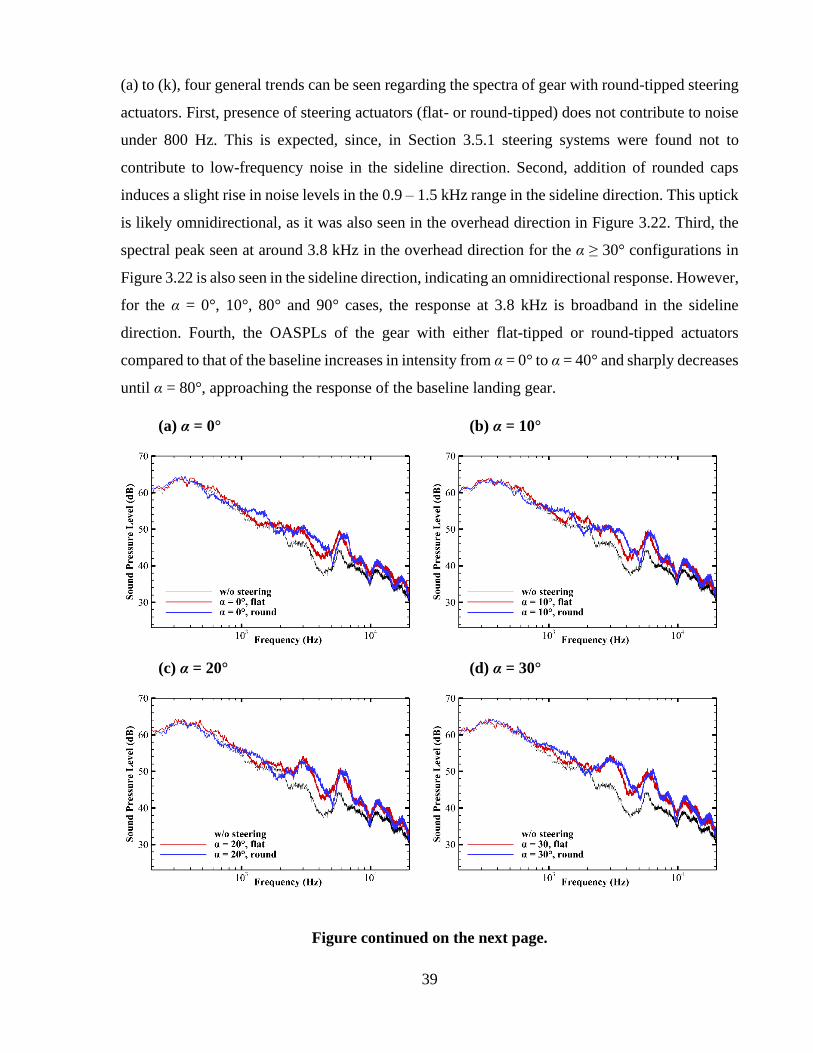
39
(a) to (k), four general trends can be seen regarding the spectra of gear with round-tipped steering
actuators. First, presence of steering actuators (flat- or round-tipped) does not contribute to noise
under 800 Hz. This is expected, since, in Section 3.5.1 steering systems were found not to
contribute to low-frequency noise in the sideline direction. Second, addition of rounded caps
induces a slight rise in noise levels in the 0.9 – 1.5 kHz range in the sideline direction. This uptick
is likely omnidirectional, as it was also seen in the overhead direction in Figure 3.22. Third, the
spectral peak seen at around 3.8 kHz in the overhead direction for the α ≥ 30° configurations in
Figure 3.22 is also seen in the sideline direction, indicating an omnidirectional response. However,
for the α = 0°, 10°, 80° and 90° cases, the response at 3.8 kHz is broadband in the sideline
direction. Fourth, the OASPLs of the gear with either flat-tipped or round-tipped actuators
compared to that of the baseline increases in intensity from α = 0° to α = 40° and sharply decreases
until α = 80°, approaching the response of the baseline landing gear.
(a) α = 0° (b) α = 10°
(c) α = 20° (d) α = 30°
Figure continued on the next page.
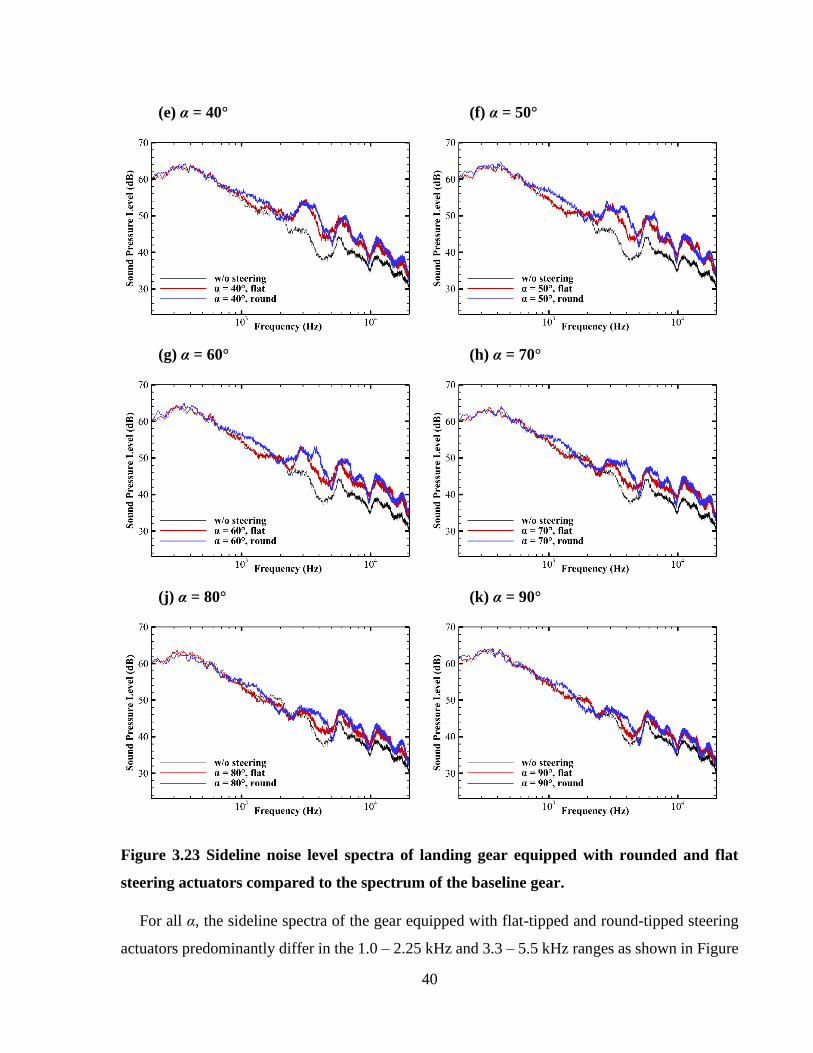
40
(e) α = 40° (f) α = 50°
(g) α = 60° (h) α = 70°
(j) α = 80° (k) α = 90°
Figure 3.23 Sideline noise level spectra of landing gear equipped with rounded and flat
steering actuators compared to the spectrum of the baseline gear.
For all α, the sideline spectra of the gear equipped with flat-tipped and round-tipped steering
actuators predominantly differ in the 1.0 – 2.25 kHz and 3.3 – 5.5 kHz ranges as shown in Figure
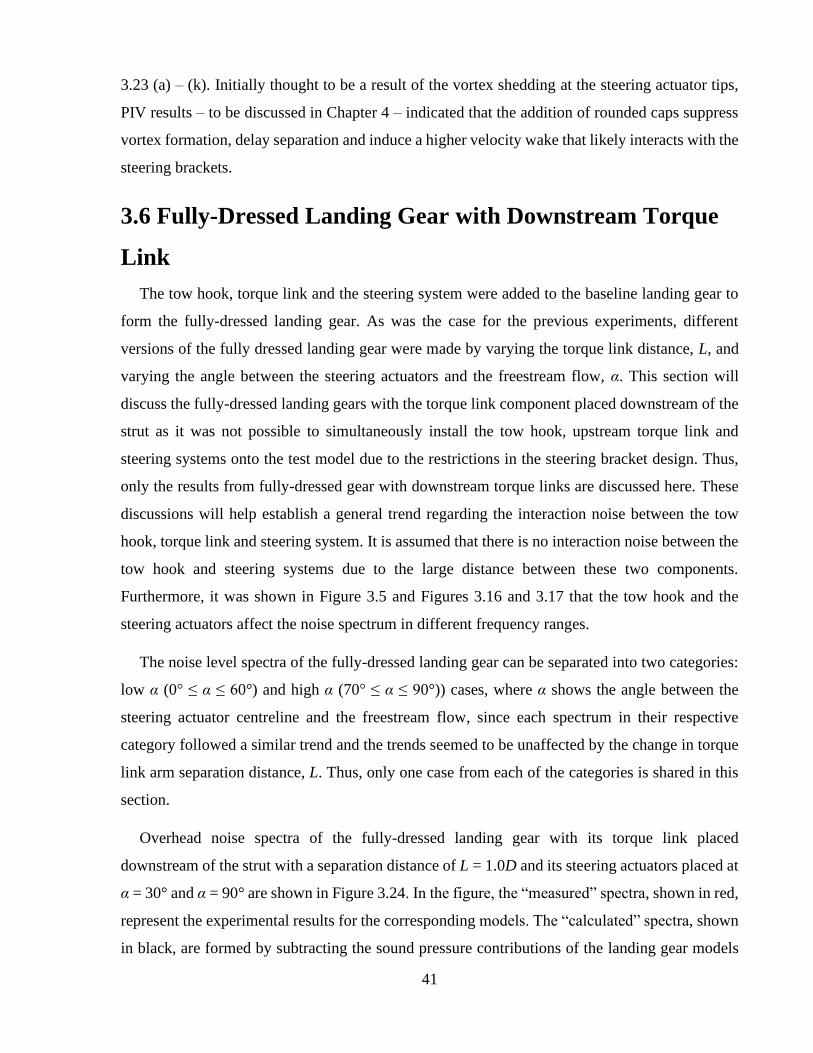
41
3.23 (a) – (k). Initially thought to be a result of the vortex shedding at the steering actuator tips,
PIV results – to be discussed in Chapter 4 – indicated that the addition of rounded caps suppress
vortex formation, delay separation and induce a higher velocity wake that likely interacts with the
steering brackets.
3.6 Fully-Dressed Landing Gear with Downstream Torque
Link
The tow hook, torque link and the steering system were added to the baseline landing gear to
form the fully-dressed landing gear. As was the case for the previous experiments, different
versions of the fully dressed landing gear were made by varying the torque link distance, L, and
varying the angle between the steering actuators and the freestream flow, α. This section will
discuss the fully-dressed landing gears with the torque link component placed downstream of the
strut as it was not possible to simultaneously install the tow hook, upstream torque link and
steering systems onto the test model due to the restrictions in the steering bracket design. Thus,
only the results from fully-dressed gear with downstream torque links are discussed here. These
discussions will help establish a general trend regarding the interaction noise between the tow
hook, torque link and steering system. It is assumed that there is no interaction noise between the
tow hook and steering systems due to the large distance between these two components.
Furthermore, it was shown in Figure 3.5 and Figures 3.16 and 3.17 that the tow hook and the
steering actuators affect the noise spectrum in different frequency ranges.
The noise level spectra of the fully-dressed landing gear can be separated into two categories:
low α (0° ≤ α ≤ 60°) and high α (70° ≤ α ≤ 90°)) cases, where α shows the angle between the
steering actuator centreline and the freestream flow, since each spectrum in their respective
category followed a similar trend and the trends seemed to be unaffected by the change in torque
link arm separation distance, L. Thus, only one case from each of the categories is shared in this
section.
Overhead noise spectra of the fully-dressed landing gear with its torque link placed
downstream of the strut with a separation distance of L = 1.0D and its steering actuators placed at
α = 30° and α = 90° are shown in Figure 3.24. In the figure, the “measured” spectra, shown in red,
represent the experimental results for the corresponding models. The “calculated” spectra, shown
in black, are formed by subtracting the sound pressure contributions of the landing gear models
42
formed by the individual installment of each of the components to the baseline landing gear from
the baseline model and then adding their contribution linearly to the spectra of the baseline landing
gear model. With such a linear summation of the pressure contribution of each component to the
baseline gear, the interaction noise between components can be identified as the difference
between the “calculated” and “measured” spectra.
Focusing on Figure 3.24 (a), where steering actuator angle is α = 30°, a trough at 640 Hz can
be seen in the calculated overhead spectrum. This is a direct result of the tow hook and torque
link suppressing some of the response at around 640 Hz when they are equipped on the landing
gear model on their own, as was shown in Figures 3.5 and 3.7 (e). The tow hook and the
downstream placement of the torque link were shown to reduce the noise around 640 Hz by
approximately 4 and 1 dB, respectively, when compared to the baseline model. Thus, when their
suppression effects are added linearly, it was assumed that without any interaction between these
components, the levels at 640 Hz would decrease down to 53 dB, as shown in Figure 3.24 (a).
However, when combined, as seen in the measured spectra in Figure 3.24 (a), no noise suppression
can be observed at 640 Hz. Furthermore, the suppression that was induced by the presence of
either the tow hook or the torque link is disappeared, and that the noise level at 640 Hz has reached
almost up to the levels of the baseline gear to roughly 61 dB. It was previously concluded that the
noise at this frequency was originating from the axle and strut area in the inter-wheel region. This
indicates that these two components – being directly upstream and downstream of the strut – may
be acoustically interacting with each other and inducing additional noise that negates the noise
reduction seen by individual installment of those components. However, it is also possible that
the addition of multiple components at once can vary the noise reflection patterns from the
surfaces of the components and cause the sound waves to propagate into the directions that are
not the overhead direction. It was shown earlier in Section 3.5 and in Figures 3.15 that the peaks
at 2.5 kHz and 5.0 kHz in the overhead direction originated from the steering systems. Focusing
on the peaks at 2.5 and 5.0 kHz in Figure 3.24 (a), the noise levels in the presence of both the tow
hook, torque link and steering system fall short by about 2 dB in the measured results compared
to the calculated spectra, indicating that the overhead noise originating from the steering system
at 2.5 kHz and 5.0 kHz are marginally suppressed in the presence of torque link downstream of
the steering system. Focusing on Figure 3.24 (b), for the steering actuator orientation of α = 90°,
the differences in peaks seen earlier in Figure 3.24 (a) for the α = 30° case at 2.5 and 5.0 kHz
between the calculated and measured spectra can no longer be seen. This is likely a result of the
43
larger portionratio of the steering brackets and actuators being positioned far out in ±y directions
at high α configurations (shown in Figure 2.4 (c) as the distance “AB”) such that the torque links
are not situated directly downstream of them, thus, minimizing the interaction between these two
components. Besides the vast difference in spectra at 640 Hz in Figure 3.24 (b), reasons of which
were discussed previously, the calculated and measured spectra share a similar overall shape and
noise levels, indicating minimum interaction between the torque links and steering system for α
= 90°.
(a) α = 30° (b) α = 90°
Figure 3.24: Overhead calculated (black) and measured (red) noise level spectra of the fully
dressed landing gear.
Narrowband sideline noise level spectra of the fully-dressed landing gear with its torque link
placed downstream of the strut with a separation distance of L = 1.0D and its steering actuators
placed at α = 30° and 90° are shown in Figure 3.25. Examining Figure 3.25 (a), where steering
actuator angle is α = 30°, the difference in sideline noise levels between the calculated and
measured spectra is minimal in the entire frequency range, indicating that the flow interactions
between the components do not have a significant impact on the acoustic response of these
components in the sideline direction. The discrepancy at 640 Hz that was seen in the overhead
direction in Figure 3.24 (a) is not observed in the sideline direction in Figure 3.25 (a), further
indicating that this noise is generated in the axle and strut junction region, and propagated between
the wheels in the overhead direction while being shielded by the wheels against sideline
propagation. A slight rise of 2 dB is seen in Figure 3.25 (a) and (b) in the calculated spectra
compared to the measured spectra between 1.3– 1.8 kHz. Noise at this frequency range was found
out to have been caused in the presence of either the torque link or the steering system in Section
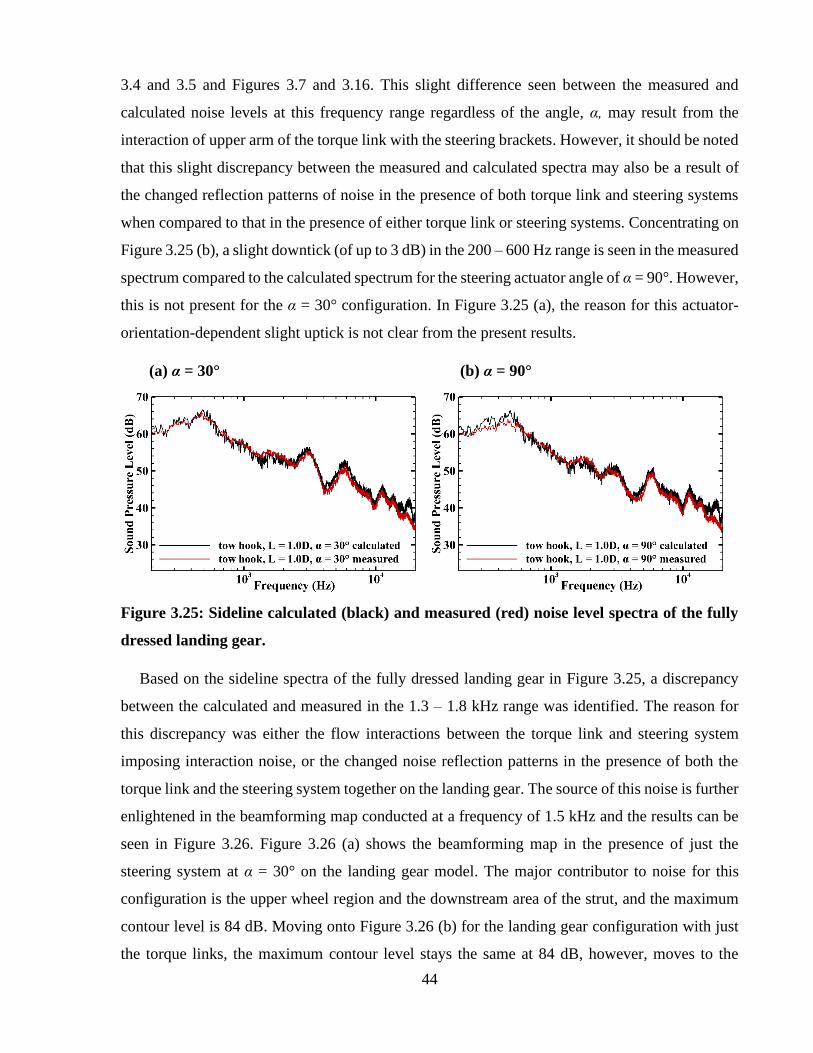
44
3.4 and 3.5 and Figures 3.7 and 3.16. This slight difference seen between the measured and
calculated noise levels at this frequency range regardless of the angle, α, may result from the
interaction of upper arm of the torque link with the steering brackets. However, it should be noted
that this slight discrepancy between the measured and calculated spectra may also be a result of
the changed reflection patterns of noise in the presence of both torque link and steering systems
when compared to that in the presence of either torque link or steering systems. Concentrating on
Figure 3.25 (b), a slight downtick (of up to 3 dB) in the 200 – 600 Hz range is seen in the measured
spectrum compared to the calculated spectrum for the steering actuator angle of α = 90°. However,
this is not present for the α = 30° configuration. In Figure 3.25 (a), the reason for this actuator-
orientation-dependent slight uptick is not clear from the present results.
(a) α = 30° (b) α = 90°
Figure 3.25: Sideline calculated (black) and measured (red) noise level spectra of the fully
dressed landing gear.
Based on the sideline spectra of the fully dressed landing gear in Figure 3.25, a discrepancy
between the calculated and measured in the 1.3 – 1.8 kHz range was identified. The reason for
this discrepancy was either the flow interactions between the torque link and steering system
imposing interaction noise, or the changed noise reflection patterns in the presence of both the
torque link and the steering system together on the landing gear. The source of this noise is further
enlightened in the beamforming map conducted at a frequency of 1.5 kHz and the results can be
seen in Figure 3.26. Figure 3.26 (a) shows the beamforming map in the presence of just the
steering system at α = 30° on the landing gear model. The major contributor to noise for this
configuration is the upper wheel region and the downstream area of the strut, and the maximum
contour level is 84 dB. Moving onto Figure 3.26 (b) for the landing gear configuration with just
the torque links, the maximum contour level stays the same at 84 dB, however, moves to the
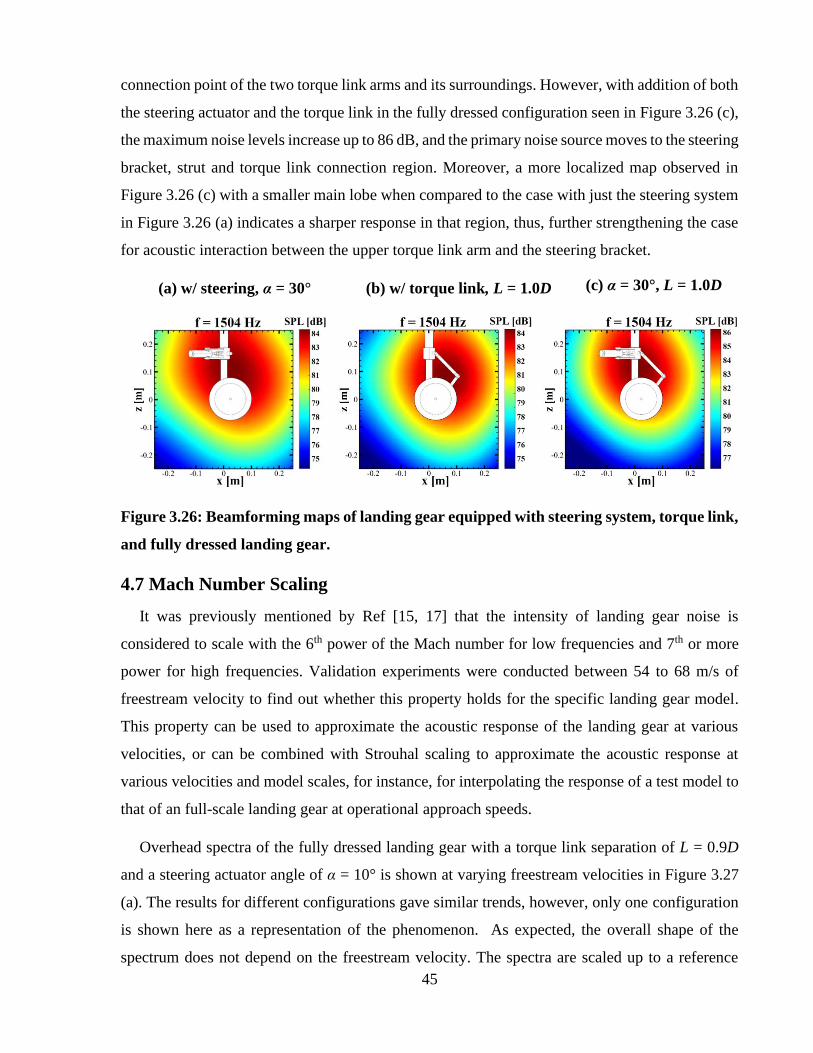
45
connection point of the two torque link arms and its surroundings. However, with addition of both
the steering actuator and the torque link in the fully dressed configuration seen in Figure 3.26 (c),
the maximum noise levels increase up to 86 dB, and the primary noise source moves to the steering
bracket, strut and torque link connection region. Moreover, a more localized map observed in
Figure 3.26 (c) with a smaller main lobe when compared to the case with just the steering system
in Figure 3.26 (a) indicates a sharper response in that region, thus, further strengthening the case
for acoustic interaction between the upper torque link arm and the steering bracket.
(a) w/ steering, α = 30° (b) w/ torque link, L = 1.0D
Figure 3.26: Beamforming maps of landing gear equipped with steering system, torque link,
and fully dressed landing gear.
4.7 Mach Number Scaling
It was previously mentioned by Ref [15, 17] that the intensity of landing gear noise is
considered to scale with the 6th power of the Mach number for low frequencies and 7th or more
power for high frequencies. Validation experiments were conducted between 54 to 68 m/s of
freestream velocity to find out whether this property holds for the specific landing gear model.
This property can be used to approximate the acoustic response of the landing gear at various
velocities, or can be combined with Strouhal scaling to approximate the acoustic response at
various velocities and model scales, for instance, for interpolating the response of a test model to
that of an full-scale landing gear at operational approach speeds.
Overhead spectra of the fully dressed landing gear with a torque link separation of L = 0.9D
and a steering actuator angle of α = 10° is shown at varying freestream velocities in Figure 3.27
(a). The results for different configurations gave similar trends, however, only one configuration
is shown here as a representation of the phenomenon. As expected, the overall shape of the
spectrum does not depend on the freestream velocity. The spectra are scaled up to a reference
(c) α = 30°, L = 1.0D
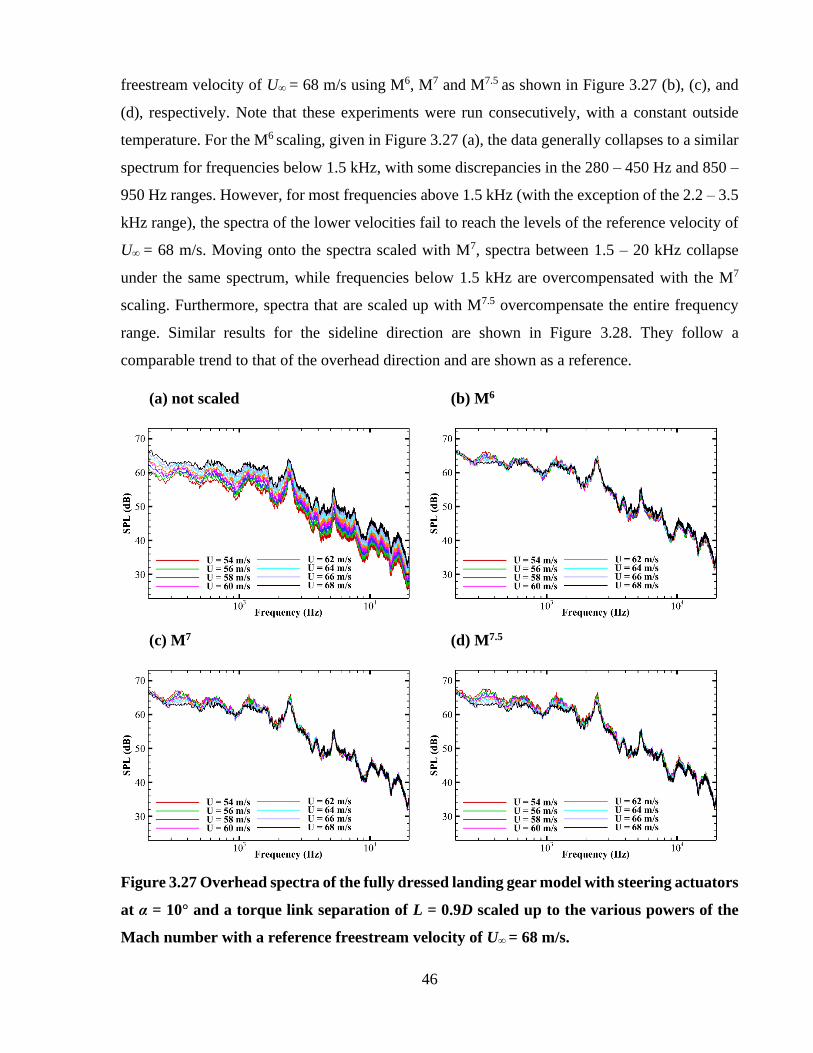
46
freestream velocity of U∞ = 68 m/s using M6, M7 and M7.5 as shown in Figure 3.27 (b), (c), and
(d), respectively. Note that these experiments were run consecutively, with a constant outside
temperature. For the M6 scaling, given in Figure 3.27 (a), the data generally collapses to a similar
spectrum for frequencies below 1.5 kHz, with some discrepancies in the 280 – 450 Hz and 850 –
950 Hz ranges. However, for most frequencies above 1.5 kHz (with the exception of the 2.2 – 3.5
kHz range), the spectra of the lower velocities fail to reach the levels of the reference velocity of
U∞ = 68 m/s. Moving onto the spectra scaled with M7, spectra between 1.5 – 20 kHz collapse
under the same spectrum, while frequencies below 1.5 kHz are overcompensated with the M7
scaling. Furthermore, spectra that are scaled up with M7.5 overcompensate the entire frequency
range. Similar results for the sideline direction are shown in Figure 3.28. They follow a
comparable trend to that of the overhead direction and are shown as a reference.
(a) not scaled (b) M6
(c) M7 (d) M7.5
Figure 3.27 Overhead spectra of the fully dressed landing gear model with steering actuators
at α = 10° and a torque link separation of L = 0.9D scaled up to the various powers of the
Mach number with a reference freestream velocity of U∞ = 68 m/s.
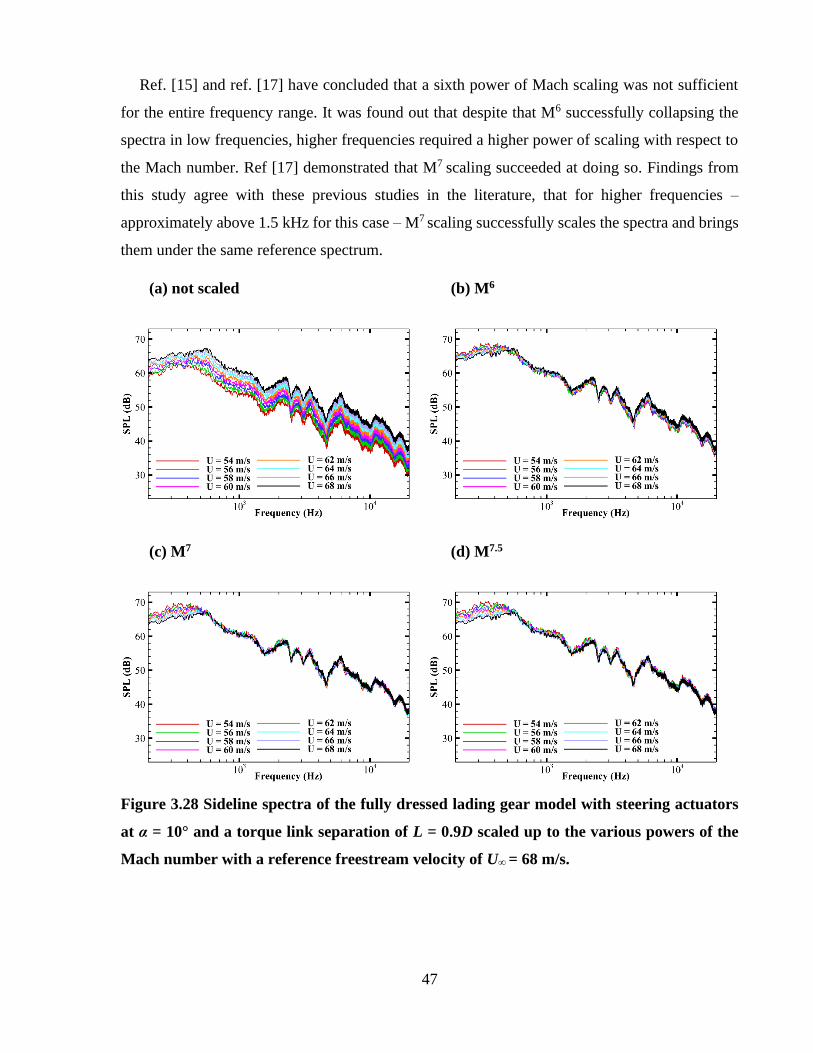
47
Ref. [15] and ref. [17] have concluded that a sixth power of Mach scaling was not sufficient
for the entire frequency range. It was found out that despite that M6 successfully collapsing the
spectra in low frequencies, higher frequencies required a higher power of scaling with respect to
the Mach number. Ref [17] demonstrated that M7 scaling succeeded at doing so. Findings from
this study agree with these previous studies in the literature, that for higher frequencies –
approximately above 1.5 kHz for this case – M7 scaling successfully scales the spectra and brings
them under the same reference spectrum.
(a) not scaled (b) M6
(c) M7 (d) M7.5
Figure 3.28 Sideline spectra of the fully dressed lading gear model with steering actuators
at α = 10° and a torque link separation of L = 0.9D scaled up to the various powers of the
Mach number with a reference freestream velocity of U∞ = 68 m/s.
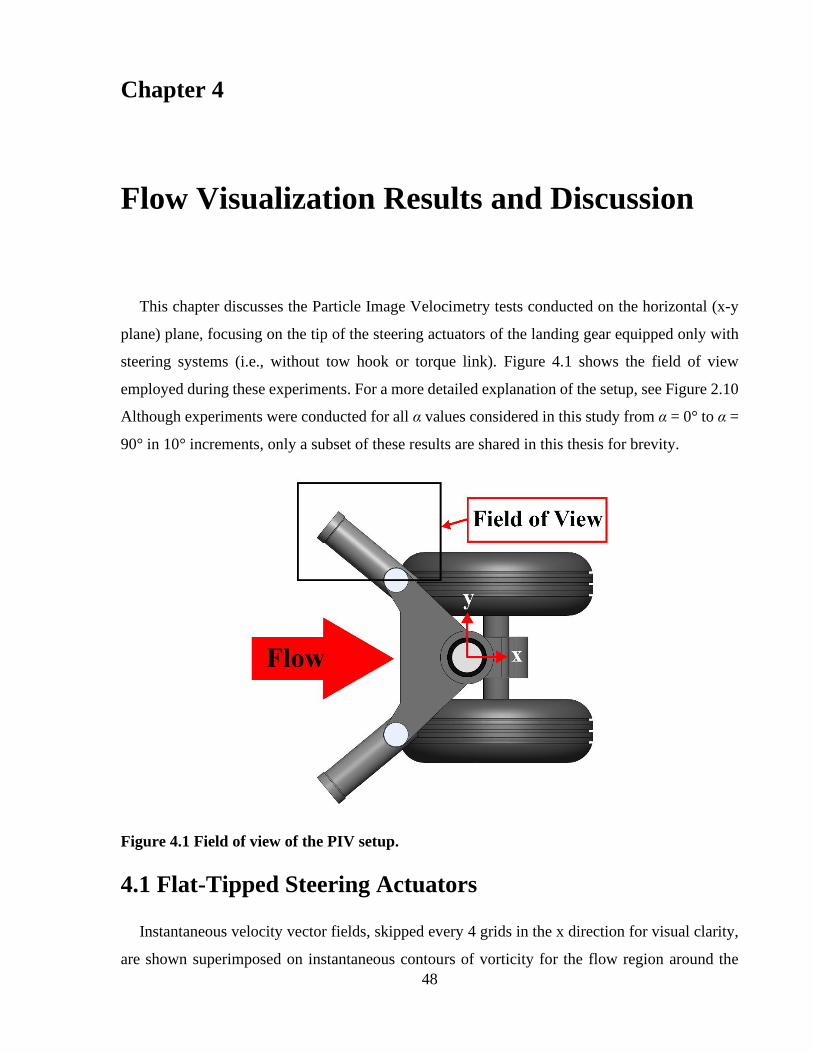
48
Chapter 4
Flow Visualization Results and Discussion
This chapter discusses the Particle Image Velocimetry tests conducted on the horizontal (x-y
plane) plane, focusing on the tip of the steering actuators of the landing gear equipped only with
steering systems (i.e., without tow hook or torque link). Figure 4.1 shows the field of view
employed during these experiments. For a more detailed explanation of the setup, see Figure 2.10
Although experiments were conducted for all α values considered in this study from α = 0° to α =
90° in 10° increments, only a subset of these results are shared in this thesis for brevity.
Figure 4.1 Field of view of the PIV setup.
4.1 Flat-Tipped Steering Actuators
Instantaneous velocity vector fields, skipped every 4 grids in the x direction for visual clarity,
are shown superimposed on instantaneous contours of vorticity for the flow region around the
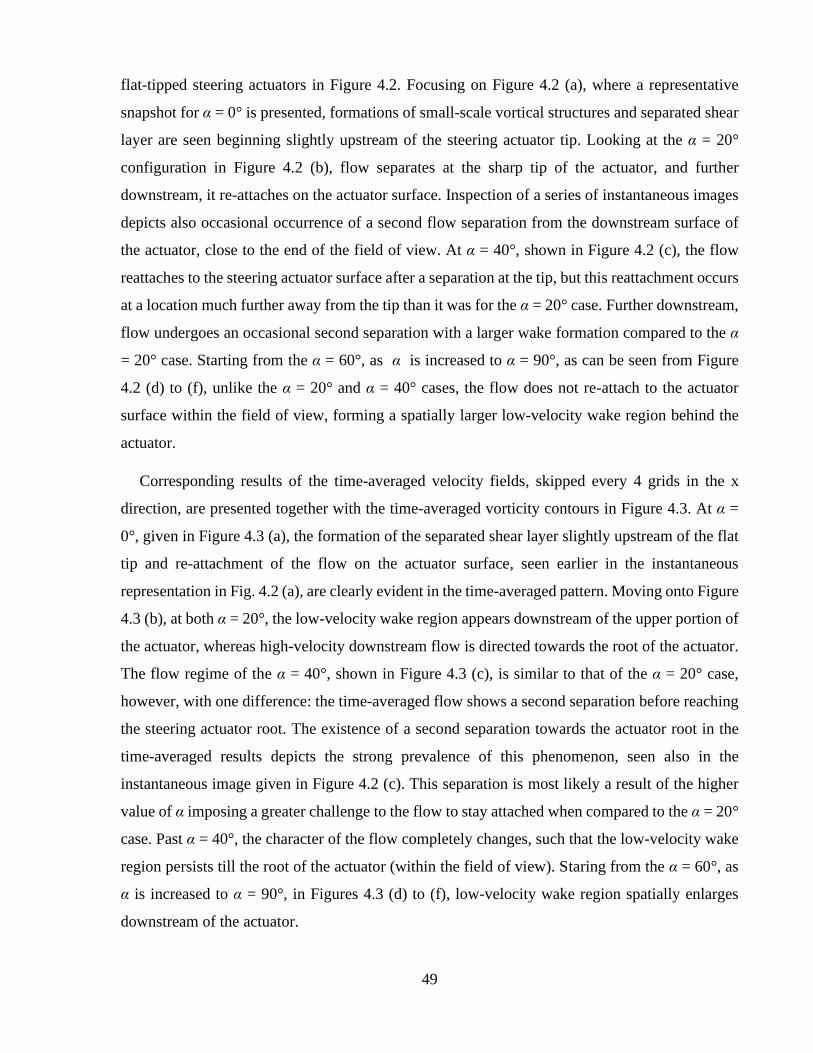
49
flat-tipped steering actuators in Figure 4.2. Focusing on Figure 4.2 (a), where a representative
snapshot for α = 0° is presented, formations of small-scale vortical structures and separated shear
layer are seen beginning slightly upstream of the steering actuator tip. Looking at the α = 20°
configuration in Figure 4.2 (b), flow separates at the sharp tip of the actuator, and further
downstream, it re-attaches on the actuator surface. Inspection of a series of instantaneous images
depicts also occasional occurrence of a second flow separation from the downstream surface of
the actuator, close to the end of the field of view. At α = 40°, shown in Figure 4.2 (c), the flow
reattaches to the steering actuator surface after a separation at the tip, but this reattachment occurs
at a location much further away from the tip than it was for the α = 20° case. Further downstream,
flow undergoes an occasional second separation with a larger wake formation compared to the α
= 20° case. Starting from the α = 60°, as α is increased to α = 90°, as can be seen from Figure
4.2 (d) to (f), unlike the α = 20° and α = 40° cases, the flow does not re-attach to the actuator
surface within the field of view, forming a spatially larger low-velocity wake region behind the
actuator.
Corresponding results of the time-averaged velocity fields, skipped every 4 grids in the x
direction, are presented together with the time-averaged vorticity contours in Figure 4.3. At α =
0°, given in Figure 4.3 (a), the formation of the separated shear layer slightly upstream of the flat
tip and re-attachment of the flow on the actuator surface, seen earlier in the instantaneous
representation in Fig. 4.2 (a), are clearly evident in the time-averaged pattern. Moving onto Figure
4.3 (b), at both α = 20°, the low-velocity wake region appears downstream of the upper portion of
the actuator, whereas high-velocity downstream flow is directed towards the root of the actuator.
The flow regime of the α = 40°, shown in Figure 4.3 (c), is similar to that of the α = 20° case,
however, with one difference: the time-averaged flow shows a second separation before reaching
the steering actuator root. The existence of a second separation towards the actuator root in the
time-averaged results depicts the strong prevalence of this phenomenon, seen also in the
instantaneous image given in Figure 4.2 (c). This separation is most likely a result of the higher
value of α imposing a greater challenge to the flow to stay attached when compared to the α = 20°
case. Past α = 40°, the character of the flow completely changes, such that the low-velocity wake
region persists till the root of the actuator (within the field of view). Staring from the α = 60°, as
α is increased to α = 90°, in Figures 4.3 (d) to (f), low-velocity wake region spatially enlarges
downstream of the actuator.
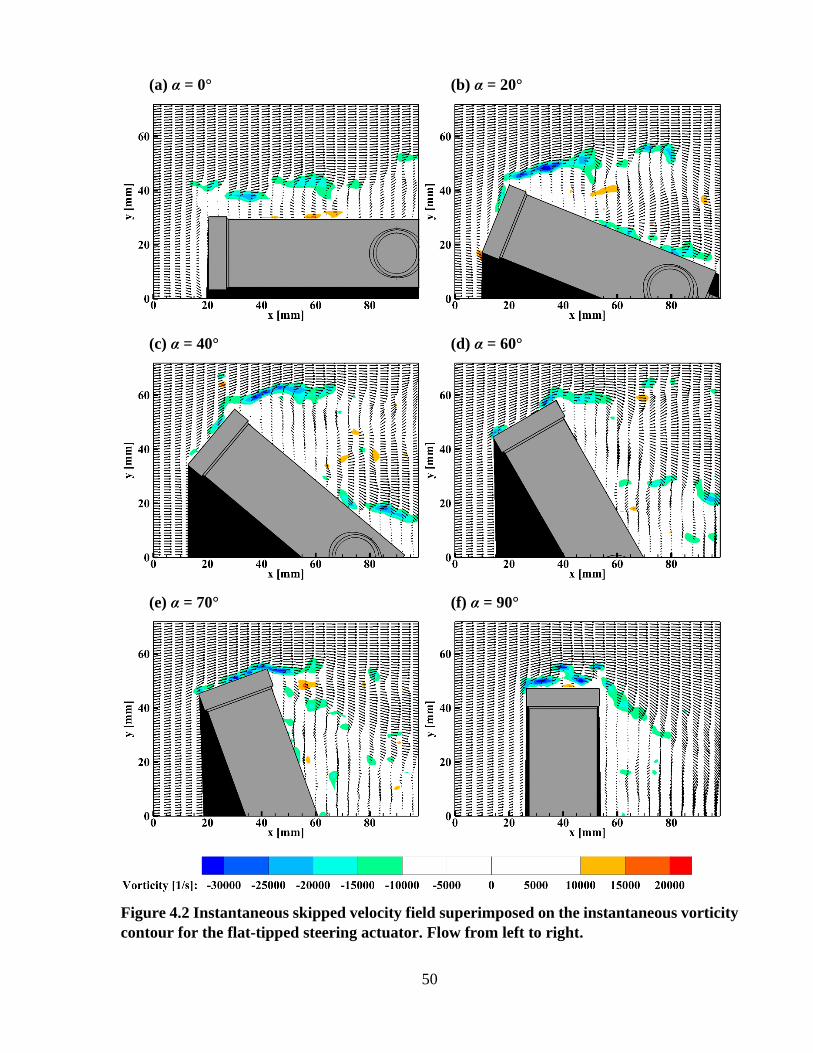
50
(a) α = 0° (b) α = 20°
(c) α = 40° (d) α = 60°
(e) α = 70° (f) α = 90°
Figure 4.2 Instantaneous skipped velocity field superimposed on the instantaneous vorticity
contour for the flat-tipped steering actuator. Flow from left to right.
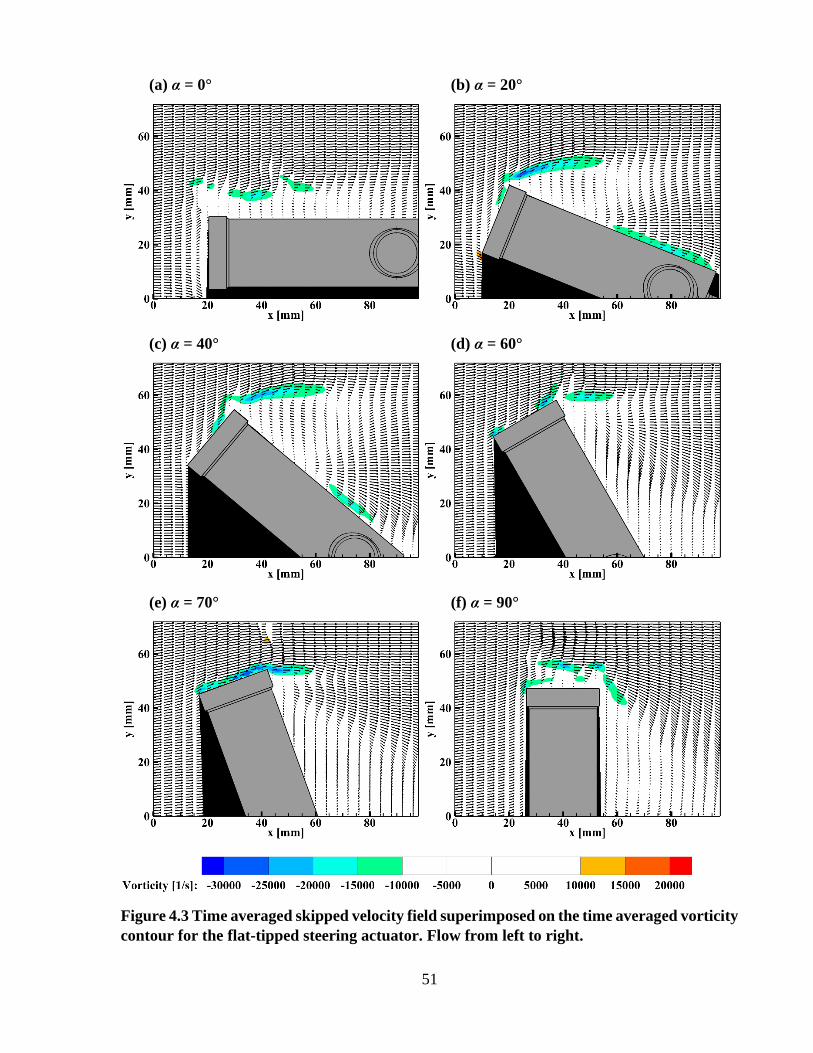
51
(a) α = 0° (b) α = 20°
(c) α = 40° (d) α = 60°
(e) α = 70° (f) α = 90°
Figure 4.3 Time averaged skipped velocity field superimposed on the time averaged vorticity
contour for the flat-tipped steering actuator. Flow from left to right.
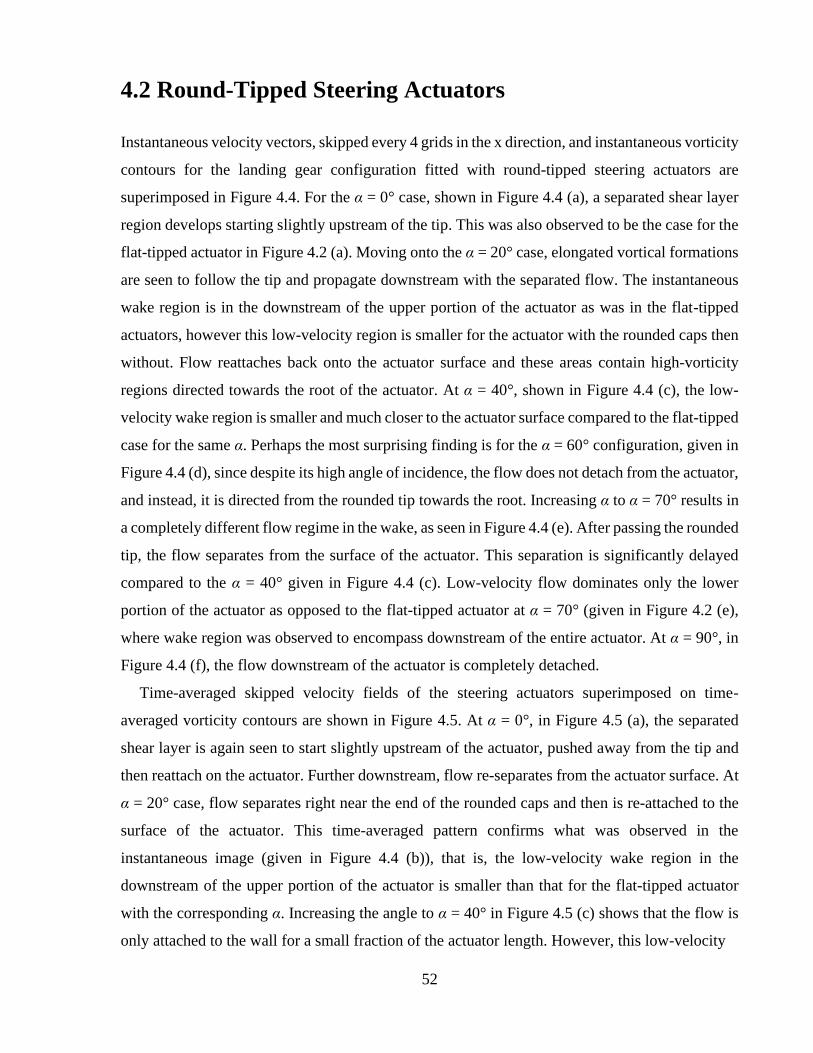
52
4.2 Round-Tipped Steering Actuators
Instantaneous velocity vectors, skipped every 4 grids in the x direction, and instantaneous vorticity
contours for the landing gear configuration fitted with round-tipped steering actuators are
superimposed in Figure 4.4. For the α = 0° case, shown in Figure 4.4 (a), a separated shear layer
region develops starting slightly upstream of the tip. This was also observed to be the case for the
flat-tipped actuator in Figure 4.2 (a). Moving onto the α = 20° case, elongated vortical formations
are seen to follow the tip and propagate downstream with the separated flow. The instantaneous
wake region is in the downstream of the upper portion of the actuator as was in the flat-tipped
actuators, however this low-velocity region is smaller for the actuator with the rounded caps then
without. Flow reattaches back onto the actuator surface and these areas contain high-vorticity
regions directed towards the root of the actuator. At α = 40°, shown in Figure 4.4 (c), the low-
velocity wake region is smaller and much closer to the actuator surface compared to the flat-tipped
case for the same α. Perhaps the most surprising finding is for the α = 60° configuration, given in
Figure 4.4 (d), since despite its high angle of incidence, the flow does not detach from the actuator,
and instead, it is directed from the rounded tip towards the root. Increasing α to α = 70° results in
a completely different flow regime in the wake, as seen in Figure 4.4 (e). After passing the rounded
tip, the flow separates from the surface of the actuator. This separation is significantly delayed
compared to the α = 40° given in Figure 4.4 (c). Low-velocity flow dominates only the lower
portion of the actuator as opposed to the flat-tipped actuator at α = 70° (given in Figure 4.2 (e),
where wake region was observed to encompass downstream of the entire actuator. At α = 90°, in
Figure 4.4 (f), the flow downstream of the actuator is completely detached.
Time-averaged skipped velocity fields of the steering actuators superimposed on time-
averaged vorticity contours are shown in Figure 4.5. At α = 0°, in Figure 4.5 (a), the separated
shear layer is again seen to start slightly upstream of the actuator, pushed away from the tip and
then reattach on the actuator. Further downstream, flow re-separates from the actuator surface. At
α = 20° case, flow separates right near the end of the rounded caps and then is re-attached to the
surface of the actuator. This time-averaged pattern confirms what was observed in the
instantaneous image (given in Figure 4.4 (b)), that is, the low-velocity wake region in the
downstream of the upper portion of the actuator is smaller than that for the flat-tipped actuator
with the corresponding α. Increasing the angle to α = 40° in Figure 4.5 (c) shows that the flow is
only attached to the wall for a small fraction of the actuator length. However, this low-velocity
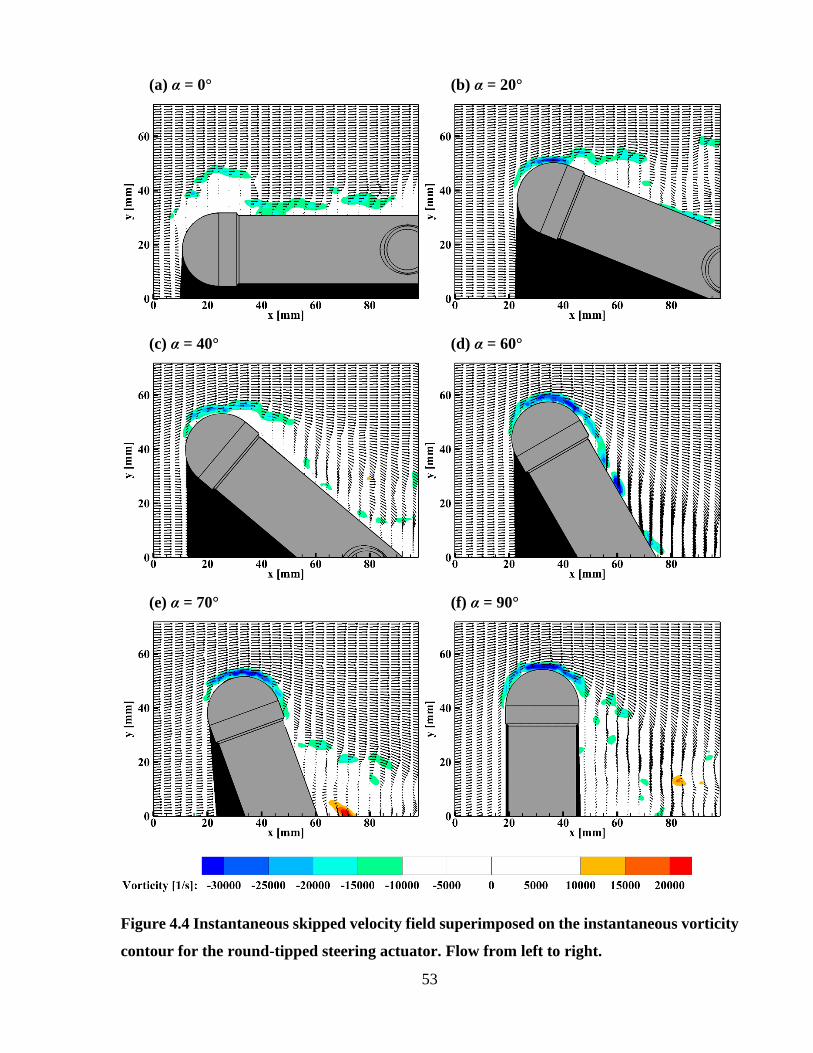
53
(a) α = 0° (b) α = 20°
(c) α = 40° (d) α = 60°
(e) α = 70° (f) α = 90°
Figure 4.4 Instantaneous skipped velocity field superimposed on the instantaneous vorticity
contour for the round-tipped steering actuator. Flow from left to right.
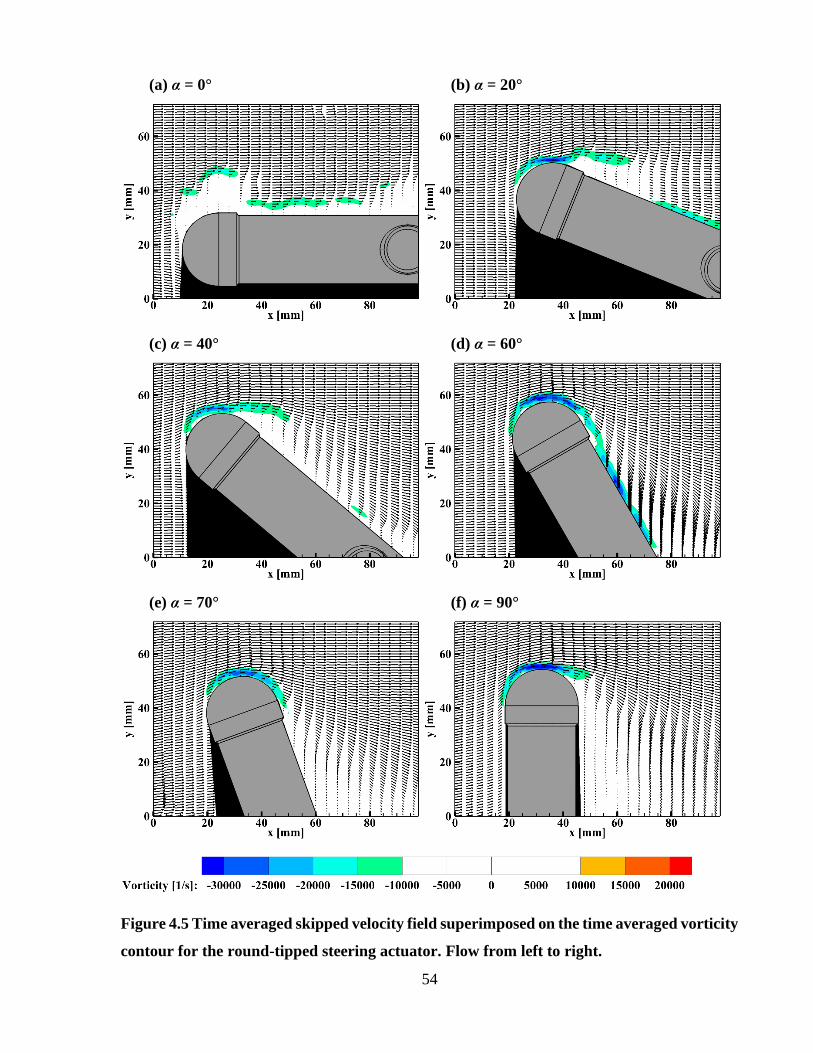
54
(a) α = 0° (b) α = 20°
(c) α = 40° (d) α = 60°
(e) α = 70° (f) α = 90°
Figure 4.5 Time averaged skipped velocity field superimposed on the time averaged vorticity
contour for the round-tipped steering actuator. Flow from left to right.
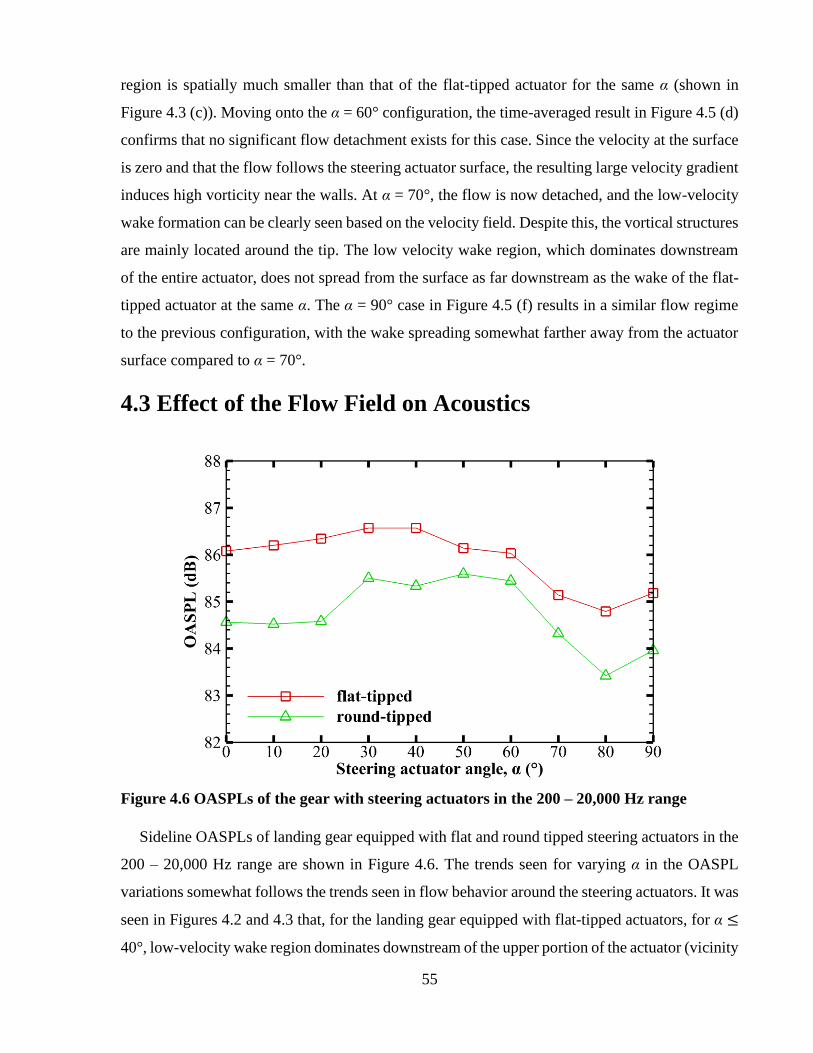
55
region is spatially much smaller than that of the flat-tipped actuator for the same α (shown in
Figure 4.3 (c)). Moving onto the α = 60° configuration, the time-averaged result in Figure 4.5 (d)
confirms that no significant flow detachment exists for this case. Since the velocity at the surface
is zero and that the flow follows the steering actuator surface, the resulting large velocity gradient
induces high vorticity near the walls. At α = 70°, the flow is now detached, and the low-velocity
wake formation can be clearly seen based on the velocity field. Despite this, the vortical structures
are mainly located around the tip. The low velocity wake region, which dominates downstream
of the entire actuator, does not spread from the surface as far downstream as the wake of the flat-
tipped actuator at the same α. The α = 90° case in Figure 4.5 (f) results in a similar flow regime
to the previous configuration, with the wake spreading somewhat farther away from the actuator
surface compared to α = 70°.
4.3 Effect of the Flow Field on Acoustics
Figure 4.6 OASPLs of the gear with steering actuators in the 200 – 20,000 Hz range
Sideline OASPLs of landing gear equipped with flat and round tipped steering actuators in the
200 – 20,000 Hz range are shown in Figure 4.6. The trends seen for varying α in the OASPL
variations somewhat follows the trends seen in flow behavior around the steering actuators. It was
seen in Figures 4.2 and 4.3 that, for the landing gear equipped with flat-tipped actuators, for α ≤
40°, low-velocity wake region dominates downstream of the upper portion of the actuator (vicinity
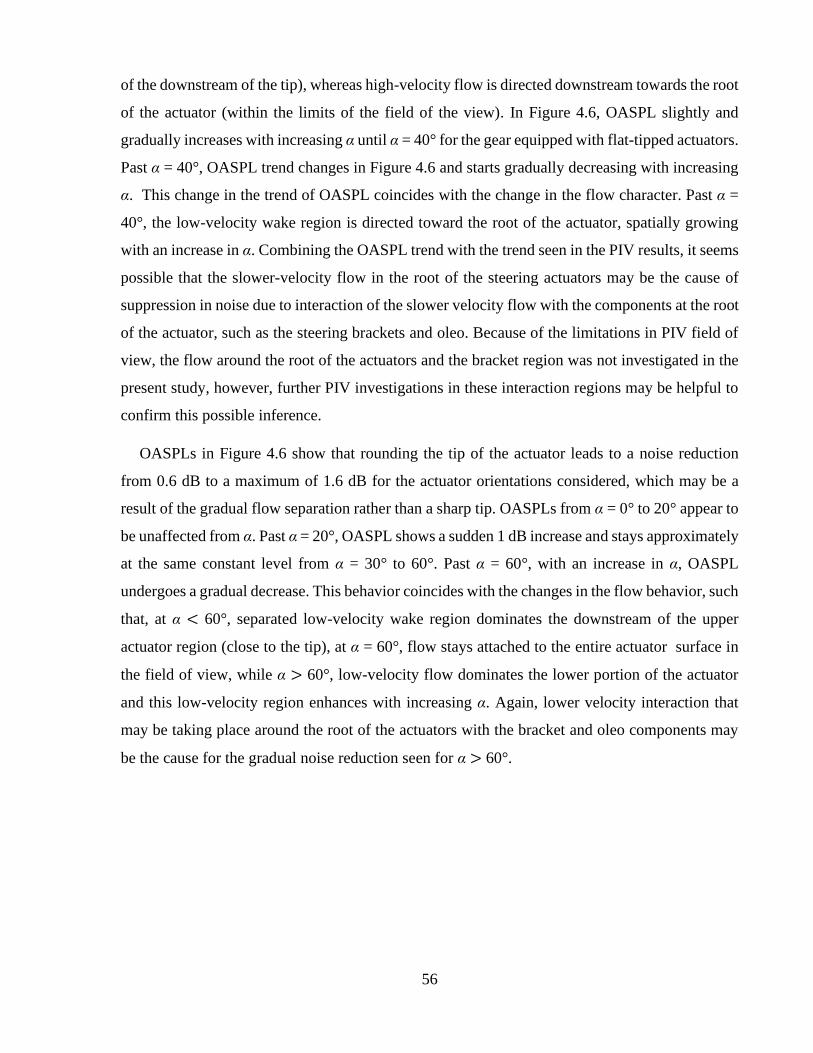
56
of the downstream of the tip), whereas high-velocity flow is directed downstream towards the root
of the actuator (within the limits of the field of the view). In Figure 4.6, OASPL slightly and
gradually increases with increasing α until α = 40° for the gear equipped with flat-tipped actuators.
Past α = 40°, OASPL trend changes in Figure 4.6 and starts gradually decreasing with increasing
α. This change in the trend of OASPL coincides with the change in the flow character. Past α =
40°, the low-velocity wake region is directed toward the root of the actuator, spatially growing
with an increase in α. Combining the OASPL trend with the trend seen in the PIV results, it seems
possible that the slower-velocity flow in the root of the steering actuators may be the cause of
suppression in noise due to interaction of the slower velocity flow with the components at the root
of the actuator, such as the steering brackets and oleo. Because of the limitations in PIV field of
view, the flow around the root of the actuators and the bracket region was not investigated in the
present study, however, further PIV investigations in these interaction regions may be helpful to
confirm this possible inference.
OASPLs in Figure 4.6 show that rounding the tip of the actuator leads to a noise reduction
from 0.6 dB to a maximum of 1.6 dB for the actuator orientations considered, which may be a
result of the gradual flow separation rather than a sharp tip. OASPLs from α = 0° to 20° appear to
be unaffected from α. Past α = 20°, OASPL shows a sudden 1 dB increase and stays approximately
at the same constant level from α = 30° to 60°. Past α = 60°, with an increase in α, OASPL
undergoes a gradual decrease. This behavior coincides with the changes in the flow behavior, such
that, at α < 60°, separated low-velocity wake region dominates the downstream of the upper
actuator region (close to the tip), at α = 60°, flow stays attached to the entire actuator surface in
the field of view, while α > 60°, low-velocity flow dominates the lower portion of the actuator
and this low-velocity region enhances with increasing α. Again, lower velocity interaction that
may be taking place around the root of the actuators with the bracket and oleo components may
be the cause for the gradual noise reduction seen for α > 60°.
57
Chapter 5
Conclusion and Future Work
5.1 Conclusion
The research discussed in this work is a component-by component experimental aeroacoustic
study of a simplified nose landing gear, with the main focus on the acoustic response of the tow
hook, and various configurations of torque link and steering systems. Acoustic experiments
consisted of far-field flyover and sideline linear array, and sideline phased array microphone
measurements. Further emphasis on the flow regimes around flat-tipped and round-tipped steering
actuators were made with PIV experiments. The current study utilized the UTIAS Anechoic Wind
Tunnel, for both acoustic and PIV experiments. Experiments, with the exception of Mach scaling
tests were conducted at a freestream velocity of U∞ = 60 m/s, whereas the Mach scaling tests were
conducted at freestream velocities between 54 – 68 m/s. The test model used in the experiments
was a 30%-scale model of a simplified nose landing gear. The modular design of the test model
enabled the individual addition and variation of tow hook, torque link and steering systems onto
the baseline gear, which consisted of the two wheels, axle, strut and the oleo. Torque link arm
separation was varied between L = 0.8D – 1.1D in 0.1D increments, with D being the wheel
diameter. Steering actuator angle was varied between α = 0° – 90° in 10° increments, where α is
the angle between the steering actuator centreline and the freestream velocity. This modular
design enabled the study of acoustic contribution of each of these components to the overall
response of the landing gear.
The acoustic response of the baseline landing gear was observed to be dominated by the low
frequencies. Two spectral peaks centred at 324 Hz and 648 Hz were seen in the overhead direction.
Sideline beamforming maps for this configuration indicated that the major regions for noise
generation were the downstream region of the oleo and the wheels. With the addition of the tow
hook, the spectral peak centred at 648 Hz is suppressed by up to 4 dB. Since this spectral peak
58
was not observed in the sideline direction and was highly dependent on the addition of the tow
hook, it was speculated that this peak is generated in the inter wheel region and radiated between
the wheels in the overhead direction while being shielded by the wheels against sideline radiation.
Landing gear equipped with torque links that are placed downstream of the strut were discovered
to generate less intense noise in both overhead and sideline direction for small arm separation
distances where the inclination of torque link arms with respect to the strut are large. As the torque
link arm separation is increased, and the arms get closer to the strut, a broadband increase in the
acoustic response is observed. Gear equipped with upstream torque links were found out to
generate 18 dB higher levels of spectral peaks centred around 824 Hz than their downstream
counterparts, and overall higher levels in the entire frequency range for the configuration with a
torque link arm separation of L = 0.9D. However, as the separation is increased to L = 1.0D and
1.1D, the peaks become broader and decrease in amplitude by up to 5 dB when compared to the
peak for the L = 0.9D case. These peaks were also seen to exhibit highly dimensional behaviour,
with the peaks disappearing completely 30° off of the sideline direction. As the separation
between the torque link arms increased to L = 1.1D and the arms got closer to the strut as a result
of this, the spectra of the gear with upstream and downstream torque links approached one another
possibly as a result of the torque link-strut pair acting like one bluff body. The steering system
was discovered to predominantly induce noise in the 1 – 8 kHz range, with two prominent spectral
peaks at 2.5 kHz and 5.0 kHz. Noise levels were found out to increase from α = 0° to α = 40° and
then sharply decrease all the way up to about α = 90°. The addition of rounded caps delayed the
sharp decrease in noise levels to the configuration beyond α = 60° and induced a slight (0.6 – 1.6
dB) reduction in the OASPLs. It was discovered that with the addition of both the torque link and
the tow hook for the fully dressed landing gear, which also had the steering system, the
suppression of the low-frequency spectral peak centred at 648 Hz, seen when only the tow hook
or torque link components were installed, diminishes indicating an noise increase at this frequency
as a result of a possible interaction in the inter wheel region between the tow hook and the lower
torque link arm. Moreover, for the fully-dressed configurations with low α, the presence of both
the torque link and steering system was found out to suppress the noise at 2.5 kHz, however,
suppression disappeared for the configurations with high α values.
PIV results collected around the tip of the steering actuator and its wake indicated that for the
flat-tipped steering actuators where α ≤ 40°, low velocity wake was found out to dominate the
vicinity of the downstream of the tip, whereas the high velocity flow was directed towards the
59
root, parallel to the centreline of the actuator within the field of view. OASPLs showed the noise
levels increased up to the α = 40° case for the gear equipped with flat-tipped actuators. However,
after α = 40°, OASPLs gradually decreased with the further increase in α. This trend in the
OASPLs correspond to the trend in the flow regime around the steering actuators. For the α ≥ 40°
cases, the low-velocity wake is directed to the root of the actuator and increasing in size with the
increase in α. These trends indicate that it is possible that the low-velocity flow downstream of
the actuator and near the root may be the reason of the noise suppression for the high α
configurations, where the noise is suppressed due to the low-velocity interaction of the flow with
the steering bracket and the oleo, which are located at the root of the steering actuator. Rounding
the tips of the actuators induce up to 1.6 dB of OASPL reduction. The OASPLs of the actuators
stay relatively same between α = 30° – 60°, and they decrease for higher α configurations. This
trend coincides with the flow regime around the steering actuators, since the low-velocity wake
formation is delayed until α > 60° with the addition of rounded caps.
5.2 Future Work
Spectral analyses and noise localization studies have been conducted on the baseline gear, gear
equipped with either of the tow hook, torque link or steering systems, and the fully-dressed
landing gear which consisted f all three of tow hook, torque link and steering systems added to
the baseline gear. The spectral contribution of each component has now been observed and well
understood. Moreover, a possible mechanism of noise generation has been theorized for the
steering system through the combine consideration of the PIV and acoustic results.
Future research should utilize these findings and equip the landing gear with additional
components such as the landing lights, piping and gear bay doors in order to bring the complexity
of the geometry one step closer to the geometry of the aircraft landing gears. Current research has
utilized the knowledge and expertise of the past research conducted in the same facility while
increasing the complexity one step from previous studies. Thus, the future work should
incorporate these findings as foundational knowledge.
PIV experiments were only limited to the near-tip region of the steering actuators due to the
opaque colour of the actuators, torque link arms and the wheels. Future PIV experiments should
be designed to visualize other regions around the landing gear components such as the torque-link
strut region or the inner steering actuator region by incorporating mirrors into the experimental
60
setup. Moreover, it was theorized that the possible mechanism of noise generation in the steering
system was the impingement of high velocity wake to the steering bracket and strut region.
However, this theory was not materialized as the steering bracket and strut regions were out of
the field of view of the PIV setup. Thus, a flow visualization study in his region can help prove
or disprove this theory and suggest more defined mechanisms of noise generation. Identification
of these noise sources and noise generation mechanisms within the landing gear will eventually
help reduce noise originating from landing gear and its components.
61
References
[1] Dobrzynski, W., and Buchholz H., “Full-scale noise testing on Airbus landing gears in the
German Dutch wind tunnel,” 3rd AIAA/CEAS Aeroacoustics Conference, Atlanta, GA, May
12-14, 1997, pp. 98-111.
doi: 10.2514/6.1997-1597
[2] Benzakein, M. J., “Commercial engine noise,” Encyclopedia of Aerospace Engineering,
2010.
doi: 10.1002/9780470686652.eae097
[3] Dobrzynski, W., “Almost 40 years of airframe noise research: What did we achieve?” Journal
of Aircraft, Vol. 47, No. 2, 2010, pp. 353-367.
doi: 10.2514/1.44457
[4] Casalino, D., Diozzi, F., Sannino, and R., Paonessa, A., “Aircraft noise reduction
technologies: A bibliographic review,” Aircraft Science and Technology, Vol. 12, Issue 1,
2008, pp. 1-17.
doi: 10.1016/j.ast.2007.10.004
[5] Casalino, D., Ribeiro, A. F. P., Fares, E. “Facing rim cavities fluctuation modes,” Journal of
Sound and Vibration, Vol. 333, Issue 13, 2014, pp. 2812-2830.
doi: 10.1016/j.jsv.2014.01.028
[6] Ingard, K.U., “Fundamentals of waves and oscillations,” Cambridge University Press,
Cambridge, 1988.
[7] Manoha, E., Bulte, J., and Caruelle, B., “LAGOON: an experimental database for the
validation of CFD/CAA methods for landing gear noise prediction,” AIAA Paper 2008-2816,
14th AIAA/CEAS Aeroacoustics Conference, Vancouver, BC, May 05-07, 2008.
doi: 10.2514/6.2008-2816
[8] Manoha, E., Bulte, J., Ciobaca, V, and Caruelle, B., “LAGOON: further analysis of
aerodynamic experiments and early aeroacoustic results,” AIAA Paper 2009-3277, 15th
AIAA/CEAS Aeroacoustics Conference, Miami, FL, May 11-13, 2009.
doi: 10.2514/6.2009-3277
[9] Dobrzynski, W., Ewert, R., Pott-Pollenske, M., Herr, M., and Delfs, J., “Research at DLR
towards airframe noise prediction and reduction,” Aerospace Science and Technology, Vol.
12, Issue 1, 2008, pp. 80-90.
62
doi: 10.1016/j.ast.2007.10.014
[10] Neuhart, D. H., Khorrami, M. R., and Choudhari, M. M., “Aerodynamics of a Gulfstream
G550 nose landing gear model,” AIAA Paper 2009-3152, 15th AIAA/CEAS Aeroacoustics
Conference, Miami, FL, May 11-13, 2009.
doi: 10.2514/6.2009-3152
[11] Zawodny, N. S., Liu, F., Yardibi, T., Cattafesta, L. Khorrami, M. R., Neuhart, D. H., and
Van de Ven, T., “A comparative study on a ¼-scale Gulfstream aircraft noise landing gear,”
AIAA Paper 2009-3153, 15th AIAA/CEAS Aeroacoustics Conference, Miami, FL, May 11-
13, 2009.
doi: 10.2514/6.2009-3153
[12] Tabesh, M., and Waller, G., “Numerical investigation of 1/3- and full-scale partially-dressed
small business jet landing gear,” AIAA 2012-2236, 18th AIAA/CEAS Aeroacoustics
Conference, Colorado Springs, CO, June 04-06, 2012.
doi: 10.2514/6.2012-2236
[13] Dobrzynski, W. M., Schoning, B., Chow, L.-C., Wood, C., Smith, M., and Seror, C.,
“Design and testing of low noise landing gears,” AIAA Paper 2005-3008, 11th AIAA/CEAS
Aeroacoutsics Conference, Monterey, CA, May 23-25, 2005.
doi: 10.2514/6.2005-3008
[14] Guo, Y. P., Yamamoto, K. J., and Stoker R.W., “Experimental study on aircraft landing gear
noise,” Journal of Aircraft, Vol. 43, No.2, 2006, pp. 306-317.
doi: 10.2514/1.11085
[15] Long, S., Nie, H., Xue, C., and Xu, X., “Aeroacoustic testing of the landing gear
components,” Journal of Vibroengineering, Vol. 14, Issue 1, 2012, pp. 205-215.
[16] Windiate, S., Stalnov, O., Angland, D., and Zhang, X., “Aerodynamic and aeroacoustic
measurements of a landing gear torque link,” 31st AIAA Applied Aerodynamics Conference,
San Diego, CA, June 24-27, 2013.
doi: 10.2514/6.2013-2537
[17] Bennett, G. J., Neri, E., and Kennedy, J., “Noise characterization of a full-scale nose landing
gear,” Journal of Aircraft, Vol.55, No. 6, 2018, pp. 2476-2490.
doi: 10.2514/1.C034750
[18] Chow, D. H. F., “Design and characterization of the UTIAS anechoic wind tunnel”,
MASc. Thesis, Institute for Aerospace Studies, University of Toronto, Canada, 2016.
63
[19] Underbrink, J. R. “Circularly symmetric, zero redundancy, planar array having broad
frequency range applications.”, U.S. Patent No. 6,205,224 B1, 20 Mar. 2001.
[20] Prime, Z., and Doolan, C., “A comparison of popular beamforming arrays,” Proceedings of
Acoustics 2013: Science, Technology and Amenity, Victor Harbor, Australia, Nov. 17-20,
2013.
[21] Dougherty, R. P., “Functional beamforming,” 5th Berlin Beamforming Conference, Berlin,
Germany, Feb. 19-20, 2014.
[22] Porteous, R., Geyer, T., Moreau, D. J., Doolan, C. J., “A correction method for acoustic
source localisation in convex shear layer geometries,” Journal of Applied Acoustics, Vol.
130, 2018, pp. 128-132.
doi: 10.1016/j.apacoust.2017.09.020
[23] Achenbach, E., and Heinecke, E., “On vortex shedding from smooth and rough cylinders in
the range of Reynolds numbers 6x10³ to 5x10⁶,” Journal of Fluid Mechanics, Vol.109, 1981,
pp.239-251.
doi: 10.1017/S002211208100102X
[24] Moffat, R. J., “Describing the Uncertainties in Experimental Results,” Experimental Thermal
and Fluid Science, Vol.1, 1988, pp.3-17.
[25] Bendat, J. S., Piersol, A. G., Random Data Analysis and Measurement Procedures,
Hoboken, USA: Wiley, 2010. Print.
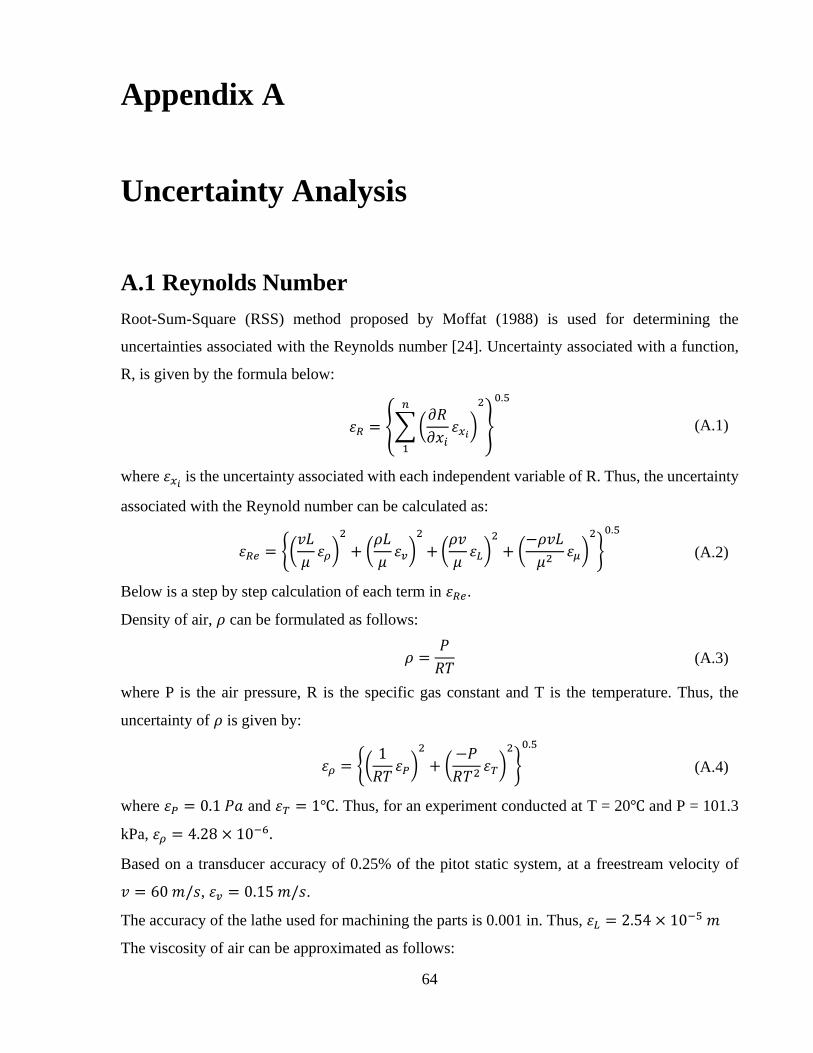
64
(A.1)
(A.2)
(A.3)
(A.4)
Appendix A
Uncertainty Analysis
A.1 Reynolds Number
Root-Sum-Square (RSS) method proposed by Moffat (1988) is used for determining the
uncertainties associated with the Reynolds number [24]. Uncertainty associated with a function,
R, is given by the formula below:
𝜀𝑅 = {∑ (𝜕𝑅
𝜕𝑥𝑖𝜀𝑥𝑖
)
𝑛
1
2
}
0.5
where 𝜀𝑥𝑖 is the uncertainty associated with each independent variable of R. Thus, the uncertainty
associated with the Reynold number can be calculated as:
𝜀𝑅𝑒 = {(𝑣𝐿
𝜇𝜀𝜌)
2
+ (𝜌𝐿
𝜇𝜀𝑣)
2
+ (𝜌𝑣
𝜇𝜀𝐿)
2
+ (−𝜌𝑣𝐿
𝜇2𝜀𝜇)
2
}
0.5
Below is a step by step calculation of each term in 𝜀𝑅𝑒.
Density of air, 𝜌 can be formulated as follows:
𝜌 =𝑃
𝑅𝑇
where P is the air pressure, R is the specific gas constant and T is the temperature. Thus, the
uncertainty of 𝜌 is given by:
𝜀𝜌 = {(1
𝑅𝑇𝜀𝑃)
2
+ (−𝑃
𝑅𝑇2𝜀𝑇)
2
}
0.5
where 𝜀𝑃 = 0.1 𝑃𝑎 and 𝜀𝑇 = 1℃. Thus, for an experiment conducted at T = 20℃ and P = 101.3
kPa, 𝜀𝜌 = 4.28 × 10⁻⁶.
Based on a transducer accuracy of 0.25% of the pitot static system, at a freestream velocity of
𝑣 = 60 𝑚/𝑠, 𝜀𝑣 = 0.15 𝑚/𝑠.
The accuracy of the lathe used for machining the parts is 0.001 in. Thus, 𝜀𝐿 = 2.54 × 10⁻⁵ 𝑚
The viscosity of air can be approximated as follows:
65
(A.5)
(A.6)
(A.7)
𝜇 = 𝜇0 (𝑇
𝑇0)
0.7
Therefore, the uncertainty of the viscosity of air is given by:
𝜀𝜇 = {(𝜇0
𝑇−0.3
𝑇00.7 )
2
}
0.5
For reference values of 𝜇0 = 1.81 × 10⁻⁵ 𝑘𝑔
𝑚×𝑠 and 𝑇0 = 15℃ (288 𝐾), 𝜀𝜇 = 1.4 × 10⁻⁷ 𝑘𝑔
𝑚×𝑠.
Thus, for a Reynolds number of 𝑅𝑒 = 600,000 based on a wheel diameter of 𝐿 = 0.152 𝑚 in the
aforementioned conditions, the uncertainty is 𝜀𝑅𝑒 = 4800.
A.2 Spectral Analyses
Uncertainties regarding spectral analyses are calculated based on a formula given by Bendat and
Piersol [25]. The normalized uncertainty is given by:
𝜀 =1
√𝑁
where 𝑁 is the number of overlapping windows used in analysing the data with Fast Fourier
Transform. For all of the spectral analyses shown in this work, 𝑁 = 8192. Thus the normalized
uncertainty is 𝜀 = 0.011 = 1.1%