Embed Size (px)
Citation preview
American Institute of Aeronautics and Astronautics
1
An Experimental Study of Momentum-Preserving Shaped
Holes for Film Cooling Using PSP and PIV
Wenwu Zhou1, Blake Johnson
2, and Hui Hu
3(�)
Department of Aerospace Engineering, Iowa State University, Ames, Iowa, 50010
An experimental investigation was conducted to study the performance of film cooling
injection from a cylindrical hole and a “W-shaped” hole. A Pressure Sensitive Paint (PSP)
technique was used to map the spatial distribution of film cooling effectiveness on the
surface of the test plate based on a mass-transfer analogy. The effects of mass flux ratio and
density ratio on film cooling effectiveness are investigated by performing PSP experiments at
various mass flux ratio using two coolant gases. In order to investigate the kinematic
relationship between film cooling effectiveness and mass flux ratio, a high resolution PIV
system was used to conduct flow field measurements. Interactions between the mainstream
flow and injection flow are also investigated to elucidate the kinematic mechanisms of film
cooling.
Nomenclature
M = Mass flux ratio of the coolant and mainstream flow, c cV Vρ ρ
∞ ∞
I = Momentum flux ratio of the coolant and mainstream flow, 2 2
c cV Vρ ρ
∞∞
DR = Density ratio of the coolant and mainstream, c
ρ ρ∞
D = Diameter of hole
awη = Adiabatic film cooling effectiveness
awT = Adiabatic wall temperature
cT = Temperature of coolant
T∞
= Temperature of main stream
( )2o
mainC = Oxygen concentration of mainstream
( )2o
mixC = Oxygen concentration of mainstram-coolant mixture
( )2o
coolantC = Oxygen concentration of cooling flow
( )2o
airp = Partial pressure of oxygen with air as the coolant
( )2o
mixp = Partial pressure of oxygen with N2 or CO2 as the coolant
re fp = Partial pressure of oxygen at reference state
bI = Intensity of background noise
refI = Intensity of the excitation light at the reference state without flow
airI = Intensity recorded with air as the coolant
mixI = Intensity recorded with N2 or CO2 as the coolant
cM = Molecular mass of coolant
airM = Molecular mass of mainstream
1 Graduate student, Department of Aerospace Engineering
2 Postdoctoral research associate, Department of Aerospace Engineering
3 Professor, Department of Aerospace Engineering, AIAA Associate Fellow, email: [email protected]
Dow
nloa
ded
by H
ui H
u on
Apr
il 29
, 201
4 | h
ttp://
arc.
aiaa
.org
| D
OI:
10.
2514
/6.2
014-
0280
52nd Aerospace Sciences Meeting
13-17 January 2014, National Harbor, Maryland
AIAA 2014-0280
Copyright © 2014 by Wenwu Zhou, Blake Johnson, and Hui Hu. Published by the American Institute of Aeronautics and Astronautics, Inc., with permission.
AIAA SciTech

American Institute of Aeronautics and Astronautics
2
I. Introduction
ILM cooling technology was born under the necessity to protect turbine blades from damage due to corrosion and
melting despite the extremely high temperature of the stage in which they operate, which may be as high as
1700℃ for certain gas turbine engines. By releasing a film of coolant gas on the surface of the turbine blades, the
solid components can be protected from the high temperature flow through the turbine stage, thus extending their
life. Because the greatest potential to improve the performance of gas turbine engines is realized through further
increasing the temperature of the combustion process, there is an inherent desire to optimize the film cooling
systems for significant economic savings. Thoroughly understanding the mechanism of the coolant film behavior is
necessary for such optimization.
Many researchers over the past 40 years have contributed their talents and efforts to investigate the fundamental
principle of film cooling to improve gas turbine engine performance. The performance of film cooling elements is
significantly affected by several parameters: mass flux ratio (M, commonly referred to as the blowing rate),
momentum flux ratio (I), turbulence intensity of the mainstream, the coolant density ratio (DR), and the
configurations of holes [1]
. After summarizing recent research results from other researchers, Bogard and Thole
(2005) [2]
listed a series of physical factors that affect the film cooling effectiveness. Their research shows that the
interaction between the coolant jets and the mainstream flow result in mixing and decay of film cooling
effectiveness, which is highly dependent on the mass- and momentum-flux ratios. Baldauf, et al. [3, 4]
utilized
infrared thermography to study the influence of blowing rate, density ratio, and other factors on a flat surface with a
row of cylindrical holes. Their results show that the lateral film cooling effectiveness increases with increasing
blowing rate (before jet lift-off), and lower density ratios with higher momentum ratios promote the shear layer
effects while enhancing interactions with adjacent jets. Pressure sensitive paint (PSP) was used by Johnson and Hu
et al [5]
to investigate the relationship between film cooling effectiveness, mass flux ratio, and density ratio for
coolant flowing from cylindrical holes, demonstrating results similar to those of Baldauf, et al. [3, 4]
. The results of
Wright et al, (2011) [6]
showed that the turbulent mixing near the edge of film cooling holes increased and lead to
reduced film cooling effectiveness. Meanwhile, their PIV results showed the augmentation of mixing between the jet
and mainstream, driving coolant away from the test surface.
Besides cylindrical holes, researchers have designed a variety of novel hole geometries that can dramatically
increase the performance of the coolant delivery: shaped holes. Rather than using simple cylindrical holes to inject
coolant onto a turbine blade, a scooped outlet of some particular geometry is often employed to reduce the effluent
velocity at the blade surface, reducing the likelihood of the coolant to separate and improving the spanwise
distribution of the film. Goldstein et al. [7]
demonstrated and quantified the remarkable enhancement of film cooling
effectiveness using fan-shaped holes, an initial round cross section widened to 10° diffusion angle on each side.
Both flow visualization and film cooling measurements showed that the secondary coolant jet would stay close to
the wall as the mass flux ratio increases, whereas the jet of the cylindrical hole would detach from the surface at
higher blowing rates. Other researchers, like Schmidt et al. [8]
studied compound angle holes, Lu and Ekkad et al [9]
presented a crescent-shaped hole, Sargison et al. (2001)[10]
demonstrated a console-shaped hole, Dhungel et
al.(2009)[11]
studied anti-vortex holes, and so on. All of these holes, compared with cylindrical holes, have their own
aerodynamic characteristics and exhibit higher film cooling effectiveness within certain conditions. In fact, Bunker
(2005)[12]
reviewed various kinds of shaped holes and made comprehensive comparisons of film cooling
performance among them, showing advantages of each type of shaped hole.
In the present study, the film cooling effectiveness and associated flow field of a moment-preserving shaped hole
are investigated experimentally using the PSP and PIV methods. The momentum-preserving shaped hole (also called
“w-shaped hole”) was designed by Shih et al (2007) [13, 14]
, and their CFD results show higher lateral film cooling
effectiveness than the cylindrical hole at M=0.49. With a nearly constant cross-sectional area for the injection flow,
the momentum of the coolant is supposed to be held roughly constant despite the widening of the scoop from its
leading to trailing edge. PIV measurements are also used to reveal the relationship between film cooling
effectiveness and various other flow factors, such as M, I, and hole configuration. Interactions between the
mainstream flow and injection flow and how the stream-wise vortical structures influence the film cooling efficiency
are also investigated to elucidate the kinematic mechanisms of film cooling.
F
Dow
nloa
ded
by H
ui H
u on
Apr
il 29
, 201
4 | h
ttp://
arc.
aiaa
.org
| D
OI:
10.
2514
/6.2
014-
0280
American Institute of Aeronautics and Astronautics
3
II. Experimental Setup and Test Model
A. Experimental rig and test model
The experimental studies were conducted in a in a low-speed, open-circuit wind tunnel located in the Wind
Simulation and Testing (WiST) laboratory at the Department of Aerospace Engineering of Iowa State University.
The tunnel has an optically-transparent test section with a 200 mm×125 mm cross section and is driven by an
upstream blower. A honeycomb and screen structures are installed upstream of the contraction section to create a
uniform low-turbulence incoming flow. The turbulence intensity in the test section was found to be less than 1.0%,
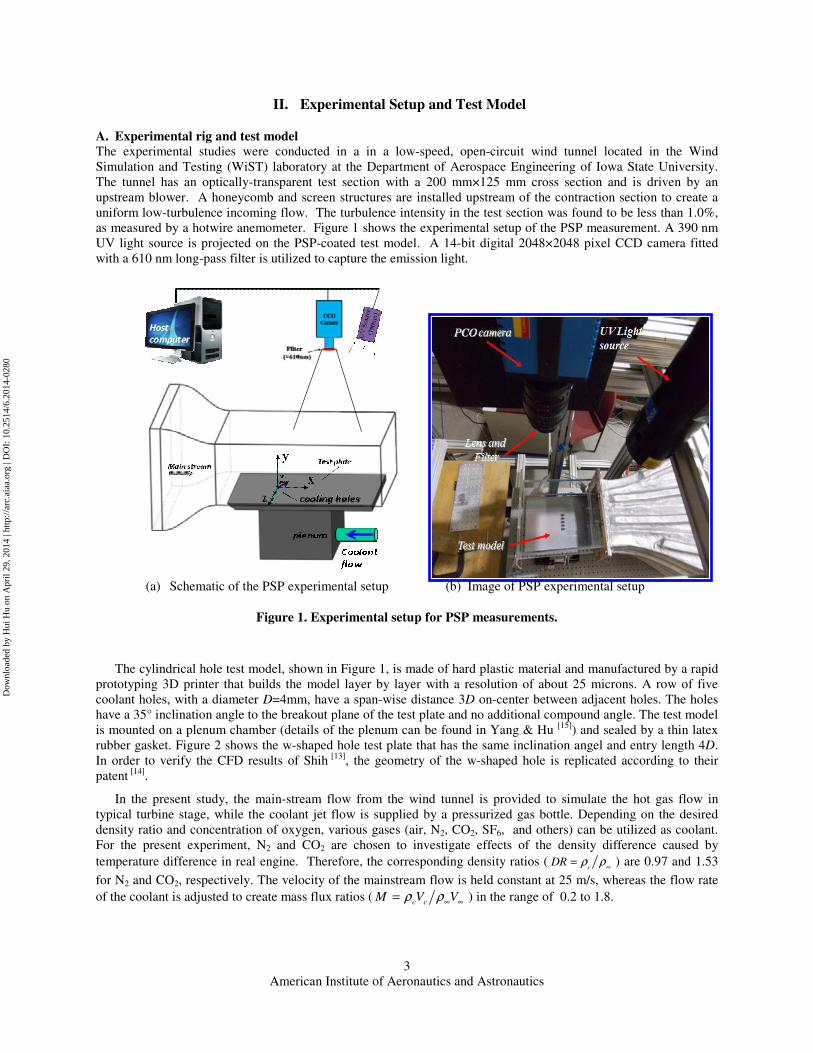
as measured by a hotwire anemometer. Figure 1 shows the experimental setup of the PSP measurement. A 390 nm
UV light source is projected on the PSP-coated test model. A 14-bit digital 2048×2048 pixel CCD camera fitted
with a 610 nm long-pass filter is utilized to capture the emission light.
(a) Schematic of the PSP experimental setup (b) Image of PSP experimental setup
Figure 1. Experimental setup for PSP measurements.
The cylindrical hole test model, shown in Figure 1, is made of hard plastic material and manufactured by a rapid
prototyping 3D printer that builds the model layer by layer with a resolution of about 25 microns. A row of five
coolant holes, with a diameter D=4mm, have a span-wise distance 3D on-center between adjacent holes. The holes
have a 35° inclination angle to the breakout plane of the test plate and no additional compound angle. The test model
is mounted on a plenum chamber (details of the plenum can be found in Yang & Hu [15]
) and sealed by a thin latex
rubber gasket. Figure 2 shows the w-shaped hole test plate that has the same inclination angel and entry length 4D.
In order to verify the CFD results of Shih [13]
, the geometry of the w-shaped hole is replicated according to their
patent [14]
.
In the present study, the main-stream flow from the wind tunnel is provided to simulate the hot gas flow in
typical turbine stage, while the coolant jet flow is supplied by a pressurized gas bottle. Depending on the desired
density ratio and concentration of oxygen, various gases (air, N2, CO2, SF6, and others) can be utilized as coolant.
For the present experiment, N2 and CO2 are chosen to investigate effects of the density difference caused by
temperature difference in real engine. Therefore, the corresponding density ratios (c
DR ρ ρ∞
= ) are 0.97 and 1.53
for N2 and CO2, respectively. The velocity of the mainstream flow is held constant at 25 m/s, whereas the flow rate
of the coolant is adjusted to create mass flux ratios (c c
M V Vρ ρ∞ ∞
= ) in the range of 0.2 to 1.8.
Dow
nloa
ded
by H
ui H
u on
Apr
il 29
, 201
4 | h
ttp://
arc.
aiaa
.org
| D
OI:
10.
2514
/6.2
014-
0280

American Institute of Aeronautics and Astronautics
4
Figure 2. Cylindrical hole test plate used in the present study.
Figure 3. W-shaped hole test plate used in the present study.
B. Adiabatic film cooling effectivenss measurement using the PSP technique
The adiabatic film cooling effectiveness awη has been investigated for many years. It is defined based on
temperature difference ratio between the mainstream and wall condition at the wall by:
aw
aw
c
T T
T Tη ∞
∞
−=
−, (1)
where T∞ is the temperature of the main stream, Taw is the adiabatic wall temperature of the studied surface, and Tc is
the initial temperature of the coolant flow.
In general, experimental measurements of film cooling effectiveness can be classified into two categories: “hot”
methods and the “cold” methods. Hot methods, are based on conventional thermal measurement techniques, such as
thermocouples [16]
, liquid crystal thermometry [17]
, infrared thermography [3, 4]
, and Temperature Sensitive Paint
Dow
nloa
ded
by H
ui H
u on
Apr
il 29
, 201
4 | h
ttp://
arc.
aiaa
.org
| D
OI:
10.
2514
/6.2
014-
0280
American Institute of Aeronautics and Astronautics
5
(TSP) [18]
, to measure the surface temperatures and then compute the adiabatic film cooling effectiveness directly.
Though it is a straight forward way to reveal useful information of film cooling effectiveness, there always exists a
primary concern and difficulty about the error of the adiabatic wall temperature measurement due to effects of heat
conduction within the test plate. However, cold methods, such as the Pressure Sensitive Paint (PSP) technique [19]
,
can eliminate errors due to conduction successfully since it is based on a mass transfer analog to the temperature
ratio of equation (1), freeing the measurement of concern about heat conduction. It is reasonable to use the mass
transfer to analogy rather than heat transfer in the present experiment because the Lewis number 1Le ≈ at
atmospheric pressure.
In PSP measurements, the surface of the test model is painted with PSP which is sensitive to diatomic oxygen.
The paint consists of light-sensitive molecules called luminophores mixed into a gas-permeable polymeric binder..
When the luminophores are exposed to UV light, the luminophores are excited and floresce light at a longer
wavelength, 650 nm for the particular paint used herein (ISSI UniFIB). However, in the presence of oxygen, the
excited electrons can return to their ground state via a radiationless transition, a process called oxygen quenching[19]
.
Consequently, the intensity of the photoluminescence is inversely proportional to the concentration of oxygen,
which means a reduced concentration of oxygen would cause higher intensity of emission light.
During the “cold” film cooling measurements, some coolant gas is chosen that containsno oxygen, whereas the
main stream of the wind tunnel consists of atmospheric air, which is approximately 21% oxygen. Where the coolant
gas is in contact with the PSP, the partial pressure of atmospheric oxygen is reduced, causing a subsequent reduction
in qxygen quenching such that the photoluminescence may increase. The mass transfer analogy states that the film
cooling effectiveness can be expressed according to the distribution of oxygen concentration along the surface of
interest. Replacing the temperature in equation (1) with the concentrations of oxygen, the film cooling effectiveness
can be written as following equation (2).
( ) ( )
( ) ( )
( ) ( )
( )2 2 2 2
2 2 2
o o o omain mix main mix
o o omain coolant main
C C C C
C C Cη
− −= =
− (2)
Because the PSP method provides a means of measuring the partial pressure of the oxygen rather than its
concentration, Charbonnier et al (2009) [20]
derived an expression (3) that accounts for the effect of the difference in
molecular mass between the coolant gas and the main stream flow. By relating the concentration of oxygen to the
partial pressure of oxygen ratio, they found the following expression for the film cooling effectiveness:
( )( )
2
2
11
1 1o
air c
airomix wall
p M
Mp
η = − − +
, (3)
where c
M and air
M are the molecular masses of the coolant gas and mainstream air, respectively.
The pressures listed in equation (3) can be calculated based on the normalized intensity of the emission light,
which is directly related to the partial pressure of oxygen. As for the relationship between the normalized intensity
ratio and normalized pressure ratio, it can be determined by calibrating the PSP. Through the calibration curve, the
following relations between the normalized intensity ratios and partial pressure ratios can be found:
( )
( )2
2
oref b air
air b oref
pI If
I I p
− = −
, (4)
( )
( )2
2
oref b mix
mix b oref
pI If
I I p
− = −
, (5)
where Iref is the reference intensity, recorded at atmosphere pressure with no flow on, Iair is the emission intensity
with the wind tunnel on and pure air injected as the coolant such that the oxygen concentration is uniform
throughout the flow field, Imix is the intensity the flow on and O2-free coolant gas flowing. Finally, Ib is the
background image, taken with the flow and illumination off to isolate effects of dark current and ambient
Dow
nloa
ded
by H
ui H
u on
Apr
il 29
, 201
4 | h
ttp://
arc.
aiaa
.org
| D
OI:
10.
2514
/6.2
014-
0280

American Institute of Aeronautics and Astronautics
6
illumination. Dtailed information of how to conduct PSP experiment can be found in Johnson & Hu [5]
and Yang &
Hu [15]
.
In the present study, a pressure and temperature-controlled test cell was used to calibrate the PSP, as shown in
Figure 4. To conduct the PSP calibration, a copper test surface was pained with ISSI UniFIB pressure sensitive
paint, which has low stated temperature sensitivity (about 0.5%/°C) and single-coat application. The painted surface
of the test plate was set in a pressurized chamber and made visible through a quartz window while the other side of
the test plate was exposed to a reservoir through which a thermally-regulated fluid was circulated. A 390 nm LED
light source was used for the excitation light. The pressure within the chamber was measured with a digital sensor
array (DSA 3217 Module, Scanivalve Corp, accuracy 0.05%). Air was removed from the test chamber by a vacuum
pump. A thermostatic water bath was used to adjust the temperature of the test plate, and the temperature was
monitored by a K-type thermocouple. The PSP calibration curve, which was based on the averaged intensity ratio
and the averaged pressure ratio, is shown in Figure 5.
Figure 4 Schematic of ISSI UniFIB paint Calibration. Figure 5 PSP calibration curve.
C. PIV Measurements
Figure 6 shows the experimental setup for PIV experiments. The mainstream airflow and the cooling jet were
seeded with ~1 µm oil droplets generated from a theatrical fog machine and an oil droplet generator, respectively. A
Nd:YAG laser was utilized to emit two pulses of 200 mJ at wavelength of 532 nm. Using a set of high-energy
mirrors and optical lenses, the laser beam was shaped into a thin light sheet with a thickness in the measurement
interest of about 1 mm. In order to reveal the interaction between the coolant flow and the mainstream flow, the
illuminating laser sheet was aligned with the streamwise flow direction, bisecting the coolant hole. The
experimental conditions, they remain the same with PSP experiments where the oxygen-free coolant gas is used.
The PIV system was used to measure the incoming flow boundary layer thickness at the leading edge of the
coolant hole. Without coolant flow, the boundary layer thickness δ99 is 0.7D while the momentum thickness δ* is
0.08D.
0
0.2
0.4
0.6
0.8
1
1.2
0 0.2 0.4 0.6 0.8 1 1.2
P(o
2 )/P
(o2 )
ref
(I(o2) ref-Ib)/(I(o2) -Ib)
Calibration data
Poly. (Calibration data)
Dow
nloa
ded
by H
ui H
u on
Apr
il 29
, 201
4 | h
ttp://
arc.
aiaa
.org
| D
OI:
10.
2514
/6.2
014-
0280

American Institute of Aeronautics and Astronautics
7
Figure 6. Experimental rig for PIV measurements.
III. Result and Discussion
The PSP experiment was validated by comparing the centerline film cooling effectiveness of cylindrical hole
with published results: Schmidt et al [22]
, Sinha et al [23]
, and Pedersen et al [24]
, which is shown in Figure 7. For
M=0.6 in Figure 7(a), the centerline effectiveness for a cylindrical hole from the present study matches previous
research results quite well on the whole. Though there is a slight difference in the range of 1<x/D<10, the trend is
consistent with their results where x/D is greater than 10. The discrepancy could be caused by differences of surface
roughness within the coolant hole or other experimental conditions. For M=1.0 in Figure 7(b), the cases of all four
results differ with each other in first eight diameters, beyind which they become similar.
(a) M=0.6, I=0.24 (b) M=1.0, I=0.65
Figure 7. Comparison of Cylindrical hole centerline effectiveness to published data.
A. The film cooling effectiveness distribution of cylindrical holes
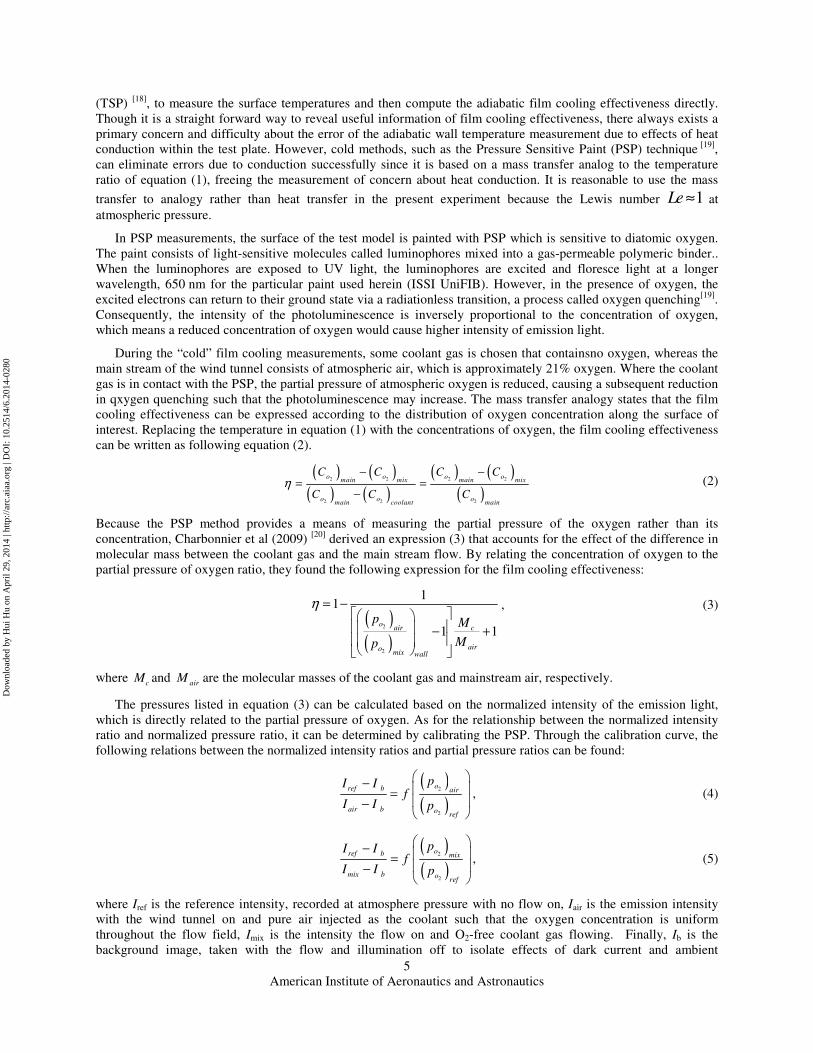
The spatial distribution of film cooling effectiveness for varying mass flux ratios of different coolants is shown
in Figure 8. On the whole, the length of the film cooling footprint along the streamwise direction first increases with
increasing M before then decreasing. The optimal point of mass flux ratio is about M=0.6 for CO2 coolant flow, and
M=0.4 for N2 coolant flow. The spanwise distribution of coolant follows a similar trend versus M as the streamwise
Dow
nloa
ded
by H
ui H
u on
Apr
il 29
, 201
4 | h
ttp://
arc.
aiaa
.org
| D
OI:
10.
2514
/6.2
014-
0280
American Institute of Aeronautics and Astronautics
8
distribution. When mass flux ratios of M is smaller than the optimal point, the coolant flow covers the surface
widely. However, when mass flux ratio is greater than the optimal value, the red contours (roughly η=0.50, as
shown in legend) becomes smaller and narrower compared with other cases. Note that this point is the mass flux
ratio where the coolant jet separates from the wall of test plate. When the momentum of the jet flow was sufficiently
low, the jet emitting from the coolant hole would simply attach to the plate. However, as the velocity of the coolant
gas increases, the coolant stream eventually detaches from the surface. One thing that needs to be pointed out is that,
according to the definition of the mass flux ratio, for a fixed M, the coolant jet with a lower density ratio would have
higher momentum ratio, I. For this reason, the N2 coolant separates at a lower mass flux ratio than the CO2 coolant
flow.
M=0.2, I=0.04
DR=0.97
M=0.4, I=0.16
DR=0.97
M=0.6, I=0.37
DR=0.97
M=0.85, I=0.74
DR=0.97
M=1.0, I=1.03
DR=0.97
M=0.2, I=0.03
DR=1.53
M=0.4, I=0.10
DR=1.53
M=0.6, I=0.24
DR=1.53
M=0.85, I=0.47
DR=1.53
M=1.0, I=0.65
DR=1.53
(a) Coolant: CO2 (b) Coolant: N2
Figure 8. Comparison of spatial distribution of film cooling effectiveness for varing mass flux ratios.
Figure 9 shows the effects of mass flux ratios upon the film cooling effectiveness of a row of five cylindrical
holes for CO2, which has DR=1.53. The centerline and laterally-averaged effectivenessare shown, wherethe lateral
averaged effectiveness here is performed over the domain of -3<z/D<3, or two full periods of the hole spacing
pattern. Comparing the centerline effectiveness for various mass blowing ratios [Figure 9(a)], the film cooling
effectiveness for all cases decreases along the stream-wise direction. For low-M cases M=0.2, 0.4, and 0.6, the
centerline effectiveness changes inversely with the mass flux ratio in the near-field for x/D<4.5. Beyond x/D=5, the
performance for these three cases switch in that the centerline effectiveness increases with increasing M. This
phenomenon can be explained by the fact that before the coolant separates from the surface, the increased
momentum of the coolant jet has an increased likelihood of flowing further downstream before reattaching on the
surface of interest. For a smaller mass flux ratio, the reattachment position is closer to the coolant hole and the
trajectory of the coolant flow stays closer to the surface of interest in. Therefore, the centerline film cooling
effectiveness is higher during the reattachment process for smaller M. Coolant injection for higher mass flux ratio
delivers more coolant to cool the surface than a coolant flow with lower mass flux ratio, thus leading to higher film
cooling effectiveness. Something thing that should be pointed out is thatthe above explanation is based on the
assumption that the injection flow doesn’t completely separate from the surface of test plate. When M is greater than
0.6, such as M=0.85 in Figure 9 (a), the measurement results indicate that the jet flow has separated from the surface
because of the low centerline effectiveness compared to the M=0.2, 0.4, and 0.6 cases. As M increases greater than
0.85, the centerline effectiveness gradually decreases for as x/D>5. Figure 9(b) presents the laterally-averaged film
cooling effectiveness for the cylindrical holes. It obeys a similar trend as the centerline effectiveness. For M<0.85,
laterally-averaged effectiveness increases with M. But, after the coolant flow separates from the surface, the lateral
averaged effectiveness decreases with M.
Dow
nloa
ded
by H
ui H
u on
Apr
il 29
, 201
4 | h
ttp://
arc.
aiaa
.org
| D
OI:
10.
2514
/6.2
014-
0280

American Institute of Aeronautics and Astronautics
9
(a) centerline effectiveness
(b)
lateral averaged effectiveness
Figure 9. Effects of mass flux ratios on film effectiveness of cylindrical hole (CO2).
In order to gain more insight into the physics of film cooling effectiveness, quantitative comparison is made in
Figure 10, which shows the effects of density ratio DR upon the film cooling effectiveness. According to the
definition of mass flux ratio, for a fixed mass flux ratio, the momentum flux of the coolant increases as density ratio
decreases. For example, the momentum flux of coolant with DR=0.97 (N2) is greater than that of coolant with
DR=1.53 for constant M. The behavior shown in Figure 10 (a) can be explained by this reality. For mass flux ratio
of M=0.4, the centerline effectiveness of the N2 coolant jet is higher than for the corresponding value of CO2. As
mentioned above, for M=0.4 the momentum flux of the N2 jet flow is higher than that of the CO2 jet flow. Thus,
based on the results of Figure 9, the corresponding centerline effectiveness of N2 coolant should be higher than CO2
beyond x/D>5. Note that the laterally-averaged effectiveness appears to have little dependence on the density ratio at
M=0.4, suggesting that the coolant remains well-attached to the surface and spreads nicely at lower M values,
regardless of DR. However, the centerline effectiveness greatly depends on DR for larger mass flux ratio, such as
M=0.6 and 1.0, and thus coolant flows of higher DR have better centerline and laterally-averaged effectiveness.
(b) centerline effectiveness
(b)
lateral averaged effectiveness
Figure 10. Effects of density ratio upon film cooling effectiveness.
B. Comparison of film cooling effectiveness between cylindrical and W-shaped holes
The results of the effectiveness measurements are displayed as color contour maps showed in Figure 11. For
both cylindrical holes and W-shaped holes, the length of the effectiveness footprint ‘tails’ increases along the
stream-wise direction when M is less than 0.6, while the lateral spread of effectiveness is rather wide. However, the
Dow
nloa
ded
by H
ui H
u on
Apr
il 29
, 201
4 | h
ttp://
arc.
aiaa
.org
| D
OI:
10.
2514
/6.2
014-
0280

American Institute of Aeronautics and Astronautics
10
film cooling performance decreases sharply for M>0.6 for cylindrical holes due to the separation of coolant jet from
the plate surface. As for the W-shaped holes, the trends of the film cooling distribution is similar to the cylindrical
holes, but the effectiveness footprint maintains a high performance for much higher M. It seems that the coolant
streams do not separate for the W-shaped holes.
M=0.4, I=0.10
DR=1.53
M=0.5, I=0.16
DR=1.53
M=0.6, I=0.24
DR=1.53
M=0.85, I=0.47
DR=1.53
M=1.0, I=0.65
DR=1.53
M=1.25, I=1.02
DR=1.53
M=1.5, I=1.47
DR=1.53
M=1.8, I=2.12
DR=1.53
M=0.2, I=0.03
DR=1.53
M=0.4, I=0.10
DR=1.53
M=0.5, I=0.16
DR=1.53
M=0.6, I=0.24
DR=1.53
M=0.85, I=0.47
DR=1.53
M=1.0, I=0.65
DR=1.53
M=1.25, I=1.02
DR=1.53
M=1.5, I=1.47
DR=1.53
M=1.8, I=2.12
DR=1.53
M=0.2, I=0.03
DR=1.53
(a) Cylindrical hole
(b)
W shaped hole
Figure 11. Comparison of spatial distribution of film cooling effectiveness for different hole geometries.
In order to more-clearly explain the quantitative trends of the film cooling performance of W-shaped hole, a
comparison of both centerline and laterally-averaged film cooling effectiveness was made for the cylindrical and W-
shaped holes, shown in Figure 12. For the low-M cases of the W-shaped hole, such as M=0.4 and 0.6 in Figure
12(a), the centerline film cooling effectiveness of M=0.4 is slightly higher than the value of M=0.6 at first, but the
curves cross after about x/D=6, beyond which point the M=0.6 case shows higher effectiveness than the M=0.40
case... From the analysis of Figure 11, it is known that the coolant injection from both types of holes tends to differ
when M is bigger than 0.6, and the cylindrical jet flows seem to detach from the surface at M=0.85. Therefore, it is
straightforward to arrive at the same conclusion for the higher mass flux ratio cases (M=0.85, 1.0, and 1.25) shown
in Figure 12(b). Since the jet flow separated at M=0.85, the other jets with higher mass flux ratios certainly should
drive further away from the surface. Therefore, the values of centerline effectiveness decrease dramatically with
increasing of mass flux ratio. All in all, the main difference of centerline effectiveness between the non-separating
cases (M=0.4 and 0.6) and the separating cases (M=0.85, 1.0, and 1.25) lies in the dramatically low effectiveness in
the near-field, as shown in Figure 12(b).
Worthy of attention is that the peak location of centerline effectiveness moves downstream as M increases, from
about x/D=3.7 (trailing edge of shaped hole) to 6. Also, concerning the laterally-averaged film cooling effectiveness
presented in Figure 12(c) & (d), the same trends are observed as for the centerline effectiveness except that the peak
locations of laterally-averaged effectiveness do not tend to move downstream, rather appearing at the same
streamwise location—the trailing edge of the shaped hole, which can be verified by checking the contour maps of
coolant flow in Figure 11 where the jet flows reach their widest spread at the exit of shaped hole.
As described above, both types of hole tend to separate when mass flux ratio is greater than 0.6, so it is
convenient to divide all the cases into a non-separation regime (Figure 12 (a)&(c)) and a separation regime [Figure
12(b)&(d)]. During the non-separation regime, there is little difference for the cylindrical and W-shaped holes in the
centerline and lateral effectiveness for x/D>7, suggesting that the coolant emitting from the two types of holes
spreads uniformly and remains attached. But they do have differences for x/D<7 in that the film cooling
effectiveness of the W-shaped hole is somewhat higher than the cylindrical hole. Due to the laidback and scooped
geometry of the shaped hole, the injections after the entrance passage tend to stay closer to the surface than
Dow
nloa
ded
by H
ui H
u on
Apr
il 29
, 201
4 | h
ttp://
arc.
aiaa
.org
| D
OI:
10.
2514
/6.2
014-
0280

American Institute of Aeronautics and Astronautics
11
cylindrical hole for x/D<7 region, while after passing the trailing edge of the shaped hole, all of the jets flow remain
well-attached to the surface of the test plate. As for the separation-stage cases shown in Figure 12(b) & (d), the
centerline and laterally-averaged film cooling effectiveness of the W-shaped hole is considerably higher than the
cylindrical hole, particularly for the laterally-averaged effectiveness. There is more than 100% enhancement of the
effectiveness for the M=0.85 and 1.25 cases at the trailing edge of the shaped hole compared with the cylindrical
hole. The expansion geometry of the shaped holesignificantly reduces the jet velocity, postponing the separation of
coolant from the test surface. As x/D increases, the film cooling effectiveness of both holes decreases, but the film
cooling effectiveness of W-shaped hole remains slightly higher up to the end of our test plate.
(a) Centerline effectiveness M=0.4, 0.6
(b)
Centerline effectiveness M=0.85, 1.0, 1.25
(c) Laterally-averaged effectiveness M=0.4, 0.6
(d)
Laterally-averaged effectiveness M=0.85, 1.0, 1.25
Figure 12. Comparison of film cooling effectiveness between cylindrical and W-shaped holes for various mass
flux ratios (CO2).
Comparisons of film cooling effectiveness between cylindrical and W-shaped holes are also conducted for the N2
coolant cases. As discussed above, for a fixed M, the momentum flux of the coolant jet is higher if a coolant of
lower density ratio is used. Higher momentum would cause the jet to separate from the surface in a lower mass flux
ratio for low DR. For the N2–as coolant cases, the jet starts to lift off when M is greater than 0.4 for cylindrical and
W-shaped holes, as shown in Figure 13. It is obvious that the film cooling effectiveness of the N2 cases follows the
Dow
nloa
ded
by H
ui H
u on
Apr
il 29
, 201
4 | h
ttp://
arc.
aiaa
.org
| D
OI:
10.
2514
/6.2
014-
0280
American Institute of Aeronautics and Astronautics
12
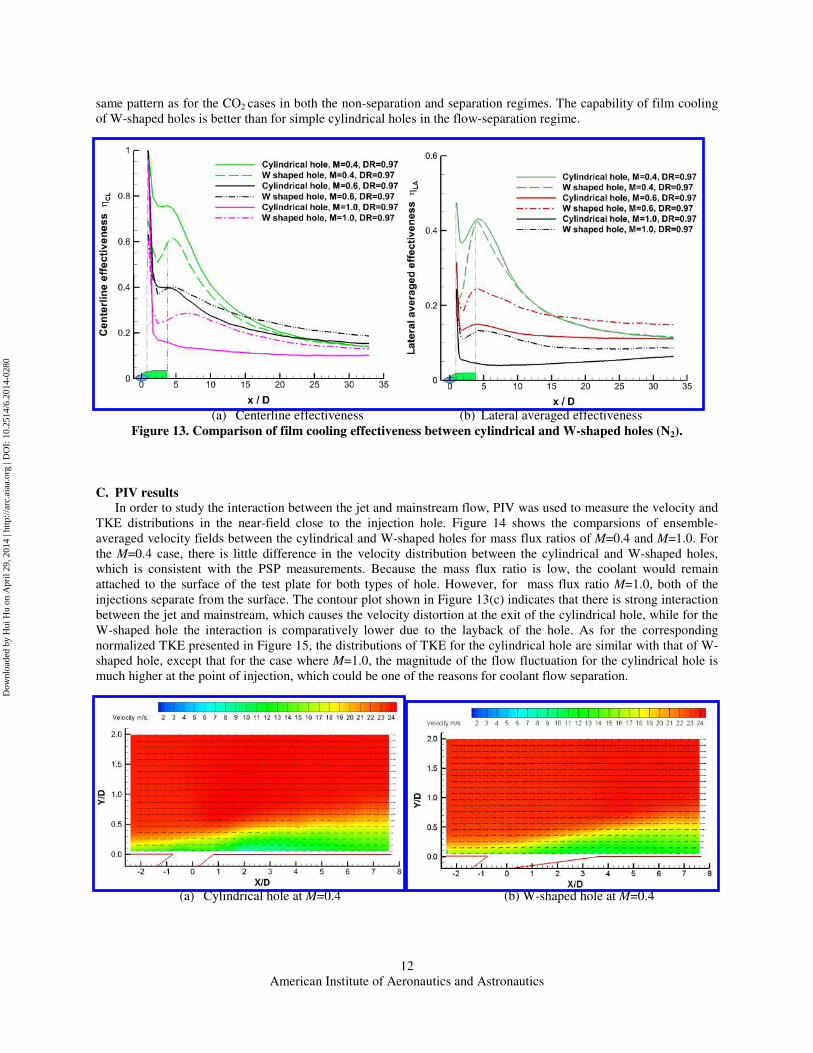
same pattern as for the CO2 cases in both the non-separation and separation regimes. The capability of film cooling
of W-shaped holes is better than for simple cylindrical holes in the flow-separation regime.
(a) Centerline effectiveness
(b)
Lateral averaged effectiveness
Figure 13. Comparison of film cooling effectiveness between cylindrical and W-shaped holes (N2).
C. PIV results
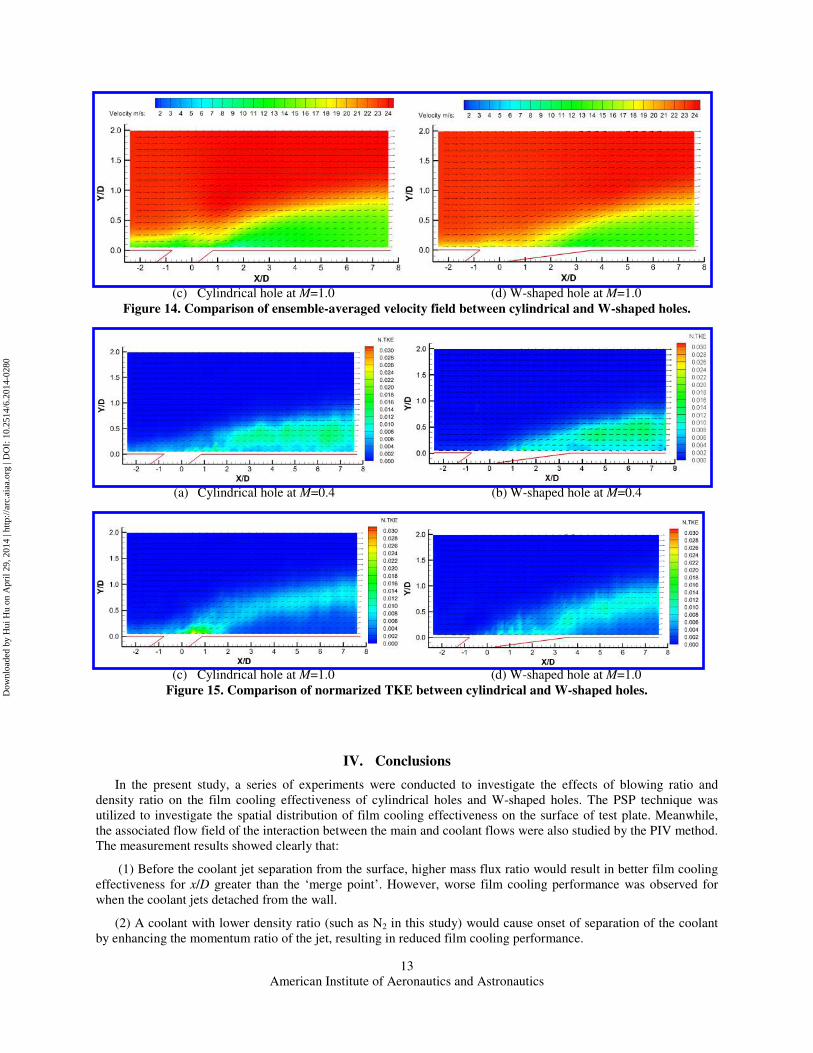
In order to study the interaction between the jet and mainstream flow, PIV was used to measure the velocity and
TKE distributions in the near-field close to the injection hole. Figure 14 shows the comparsions of ensemble-
averaged velocity fields between the cylindrical and W-shaped holes for mass flux ratios of M=0.4 and M=1.0. For
the M=0.4 case, there is little difference in the velocity distribution between the cylindrical and W-shaped holes,
which is consistent with the PSP measurements. Because the mass flux ratio is low, the coolant would remain
attached to the surface of the test plate for both types of hole. However, for mass flux ratio M=1.0, both of the
injections separate from the surface. The contour plot shown in Figure 13(c) indicates that there is strong interaction
between the jet and mainstream, which causes the velocity distortion at the exit of the cylindrical hole, while for the
W-shaped hole the interaction is comparatively lower due to the layback of the hole. As for the corresponding
normalized TKE presented in Figure 15, the distributions of TKE for the cylindrical hole are similar with that of W-
shaped hole, except that for the case where M=1.0, the magnitude of the flow fluctuation for the cylindrical hole is
much higher at the point of injection, which could be one of the reasons for coolant flow separation.
(a) Cylindrical hole at M=0.4 (b) W-shaped hole at M=0.4
Dow
nloa
ded
by H
ui H
u on
Apr
il 29
, 201
4 | h
ttp://
arc.
aiaa
.org
| D
OI:
10.
2514
/6.2
014-
0280
American Institute of Aeronautics and Astronautics
13
(c) Cylindrical hole at M=1.0 (d) W-shaped hole at M=1.0
Figure 14. Comparison of ensemble-averaged velocity field between cylindrical and W-shaped holes.
(a) Cylindrical hole at M=0.4 (b) W-shaped hole at M=0.4
(c) Cylindrical hole at M=1.0 (d) W-shaped hole at M=1.0
Figure 15. Comparison of normarized TKE between cylindrical and W-shaped holes.
IV. Conclusions
In the present study, a series of experiments were conducted to investigate the effects of blowing ratio and
density ratio on the film cooling effectiveness of cylindrical holes and W-shaped holes. The PSP technique was
utilized to investigate the spatial distribution of film cooling effectiveness on the surface of test plate. Meanwhile,
the associated flow field of the interaction between the main and coolant flows were also studied by the PIV method.
The measurement results showed clearly that:
(1) Before the coolant jet separation from the surface, higher mass flux ratio would result in better film cooling
effectiveness for x/D greater than the ‘merge point’. However, worse film cooling performance was observed for
when the coolant jets detached from the wall.
(2) A coolant with lower density ratio (such as N2 in this study) would cause onset of separation of the coolant
by enhancing the momentum ratio of the jet, resulting in reduced film cooling performance.
Dow
nloa
ded
by H
ui H
u on
Apr
il 29
, 201
4 | h
ttp://
arc.
aiaa
.org
| D
OI:
10.
2514
/6.2
014-
0280
American Institute of Aeronautics and Astronautics
14
(3) Because of the laidback and scooped geometry of the W-shaped hole, the velocity from the injection is
reduced and, therefore, prevents the jet from separating. By using CO2 as coolant, the film cooling effectiveness for
the W-shaped hole is about twice the film cooling effectiveness for the cases of M=0.85, 1.0, and 1.25.
(4) Based on the PIV results, the coolant stream from the W-shaped hole would stays closer to the test surface
and has slightly lower TKE than for the cylindrical hole.
References
1. Bogard, D. G., Airfoil Film Cooling, The Gas Turbine Handbook, National Energy Technology Laboratory, 2006, Section
4.2.2.1
2. Bogard, D. G., and Thole, K.A., “Gas turbine film cooling”, Journal of Propulsion and Power,Vol. 22, 2006, pp.249-269.
3. Baldauf, S., Schulz, A, and Wittig, S., “High-Resolution Measurements of Local Effectiveness from Discrete Hole Film
Cooling.” Journal of Turbomachinery. Vol. 123, 2001, pp. 758–765.
4. Baldauf, S., Scheurlen, M., Schulz, A, and Wittig, S., “Correlation of Film-Cooling Measurements from Thermographic
Measurements at Enginelike Conditions.” Journal of Turbomachinery. Vol. 124, 2002, pp. 686–698.
5. Johnson, B., Zhang K., “An Experimental Study of Film Cooling Effectiveness by Using PIV and PSP Techniques”. 51th
AIAA Aerospace Sciences Meeting, 2013, AIAA 2013-0603.
6. Wright, L.M., McClain, S.T., Clemenson, M.D., "Effect of Freestream Turbulence Intensity on Film Cooling Jet Structure
and Surface Effectiveness Using PIV and PSP." Journal of Turbomachinery. Vol. 133, 2001, pp. 041023-1--12
7. Goldstein, J. C., and Eckert. “Effect of Hole Geometry and Density on Three Dimensional Film Cooling”. Int. J. Heat Mass
Transfer, Vol. 17,1974, pp595-607.
8. Schmidt, D. L., Sen, B., “Film cooling with compound angle holes:adiabatic effectiveness”, Journal of Turbomachinery,
Vol.118, 1996, pp807-813.
9. Lu, Y.P., Nasir, H., “film cooling measurements for novel hole configurations”, Vol. 128, 2006, pp. 737.
10. Sargison J. E., “Development of a novel film cooling hole geometry” PhD Dissertation, Dept. of Engineering Sci., University
fo Oxford, 2001.
11. Dhungel, A., Lu, Y., Phillips, W., Ekkad, S.V., Heidmann, J. “Film Cooling from a Row of Holes Supplemented with
Antivortex Holes.” Journal of Turbomachinery. Vol. 131, 2009, pp. 021007-1–10.
12. Bunker, R.S., “A review of shaped hole turbine film cooling technology”, Journal of heat transfer, Vol. 127, 2005, pp.441-
453.
13. Shih T. I-P, and Na S., “Momentum-preserving shaped holes for film cooling”, ASME Turbo. Expo 2007:Power for Land,
Sea and Air, GT-2007-7600.
14. Shih T. I-P, and Na S., “Momentum Preserving Film-Cooling Shaped Holes”, U. S. Patent Application, No. US7997867B1,
filed 16 Aug. 2011.
15. Yang Z, and Hu H., “Study of Trailing-Edge Cooling Using Pressure Sensitive Paint Technique” Journal of Propulsion and
Power. Vol.27, No.3, 2011, pp. 700-709.
16. Ou, S., Han, J.C., Mehendale, A.B., and Lee, C.P., “Unsteady Wake over a Linear Turbine Blade Casecade with Air and CO2
Film Injection. Part I: Effect on Heat Transfer Coefficients,” Journal of Turbomachinery, Vol.116, 1994, pp.721-729.
17. Han J.C., Dutta, S., and Ekkad, S., Gas Turbine Heat Transfer and Cooling Technology, Taylor and Francis, New York,
2000, pp.540-559.
18. Wright L. M., Gao, Z., VArvel, T. A., and Han, J., “Assessment of steady state PSP, TSP, and IR measurement techniques for
flat plate film cooling,” ASME Summer Heat Transfer Conference, San Francisco, California, 2005, HT2005-72363
19. Bell J. H., “Surface Pressure Measurements Using Luminescent Coatings1”, Annu. Rev. Fluid Mech. 2001, Vol 33, pp. 155-
206.
20. Charbonnier D. Ott. P., Jonsson M. C. F., “Experimental and Numerical Study of the Thermal Performance of a Film Cooled
Platform”, Proc. Of ASME Turbo Expo 2009: Power for Land, Sea and Air. June 8-12, 2009.
21. Kline, S.J., and McClintock, F.A., “Describing Uncertainties in a Single Sample Experiment,” Mechanical Engineering, vol.
75, 1953, pp.3-8.
22. Schmidt D. L., Sen B., “Film Cooling with Compound Angle Holes: Adiabatic Effectiveness”, Journal of Turbomachinery,
vol.118, 1996, pp. 807-813.
23. Sinha A.K., Bogard D. G., “Film Cooling Effectiveness Downstream of a Single Row of Holes with variable Density Ratio”
Journal of Turbomachinery, vol.113,1991, pp.442-449.
24. Pedersen D.R., Eckert E.R., and Goldstein, R. J., “Film Cooling with Large Density Differences between the Mainstream and
Secondary Fluid Measured by the Heat-Mass Transfer Analogy”, ASME, Journal of Heat Transfer, vol.99, 1977, pp.620-627.
Dow
nloa
ded
by H
ui H
u on
Apr
il 29
, 201
4 | h
ttp://
arc.
aiaa
.org
| D
OI:
10.
2514
/6.2
014-
0280