Embed Size (px)
Citation preview

NASA CONTRACTOR
REPORT
AN EXPERIMENTAL INVESTIGATION OF THE RADIAL DISPLACEMENTS OF A THIN-WALLED CYLINDER
by 0. G. 5’. Ricmdo
Prepared by
CALIFORNIA INSTITUTE OF TECHNOLOGY
Pasadena, Calif.
f Or
NATIONAL AERONAUTICS AND SPACE ADMINISTRATION . WASHINGTON, D. C. . NOVEMBER 1967

1; -
TECH LIBRARY KAFB, NM
lllllll~llllll~m#1lllllll11llll~ll 0099853 NASA CR- 934
AN EXPERIMENTAL INVESTIGATION OF THE RADIAL
DISPLACEMENTS OF A THIN-WALLED CYLINDER
By 0. G. S. Ricardo
Distribution of this report is provided in the interest of information exchange. Responsibility for the contents resides in the author or organization that prepared it.
Issued by Originator as Report No. SM 67-7
Prepared under Grant No. NsG-18-59 by CALIFORNIA INSTITUTE OF TECHNOLOGY
Pasadena, Calif.
for
NATIONAL AERONAUTICS AND SPACE ADMINISTRATION
For sale by the Clearinghouse for Federal Scientific and Technical Information
Springfield, Virginia 22151 - CFSTI price $3.00

ACKNOWLEDGMENT
The author wants to express his deep appreciation for all the
help and advice he was given by Dr. E. E. Sechler, who made his
work possible. He also wants to show his appreciation for the help
he received in many ways from Dr. C. D. Babcock, Miss H. Burrus,
Mr. M. J. Wood, and all others of the GALCIT Solid Mechanics Group.
He also wants to thank the authorities of the Escola Politecnica
da Univer sidade de S. Paulo, of the National Aeronautics and Space
Administration, of the Engineering Division of the California Institute
of Technology, and of the Fulbright Committee who helped make possible
his work at the GALCIT.
iii


A
d
e
E
ES
H
I
K
K max
k
P
pCL
R
t
%i
W
S
yg
LIST OF SYMBOLS
cross- sectional area of the cylinder, sq. in.
imperfection depth, inches
eccentricity of the axial load, inches
Young’s Modulus of Mylar, pounds per sq. in.
Young’s Modulus of the seam (one overlapping Mylar strip,
plus the epoxy cement) pounds per sq. in.
effective cylinder height, inches
moment of inertia of the cylinder section about the neutral
axis, in. 4
ratio P
P CL
o- max ‘OCi
seam width cylinder radius
axial load that causes collapse of the cylinder, pounds
classical buckling load = AEt
4-R ’ ‘Ounds
radius of the middle surface of the cylinder wall, inches
wall thickne s s , inche s
seam thickness, inches
seam width, inches
section modulus, = (R + e)/I in. 3
distance from the C. G. of the cylinder (including seam)
to the geometrical center, inches
V

LIST OF SYMBOLS (cont’d)
cr f compressive. stress, psi
W = classical buckling load =
ubl = bending stress at the seam psi
ubz = bending stress opposite to the seam psi
Y = Poisson’s ratio
vi

AN EXPERIMENTAL INVESTIGATION OF THE RADIAL
DISPLACEMENTS OF A THIN WALLED CYLINDER
By 0. G. S. Ricardo *
ABSTRACT
A series of experiments have been carried out in order to deter-
mine the behavior of the wall of a circular cylinder loaded in axial
compr e s sion. One case considered was when the wall was subjected to
an initial displacement by a point radial load. A second case measured
wall displacements. with no side loads or initial displacements and the
third case considered the change in an initial permanent deformation in
the thin wall of the cylinder. The data obtained indicate the behavior of
such cylinders near the collapse load.
INTRODUCTION
The improvement of experimental techniques of manufacturing
thin-walled cylindrical shells and of controlling their boundary conditions
has made it possible to more accurately match the theoretical buckling
loads with those obtained experimentally, (Ref. 1, 2, 3). Howe.ver the
mechanism leading to collapse is still not fully understood. The
purpose of this investigation was to get information concerning the
behavior of the cylinder wall under various conditions in the hope that
this information would eventually contribute to the clarification of the
buckling process. In order to accomplish this, the following series of
-. - *
Research Associate at the Califo.rnia Institute of Technology during preparation of this report.

experiments were carried out in thin-walled circular cylinders made
of Mylar. These cylinders had an R/t ratio of approximately 400.
1. An imperfection was impressed in the cylinder
wall by a point radial load and the cylinder &as then
subjected to an increasing axial load, The effect of
changes in the depth of this imperfection on the axial
load was recorded. A further variable was the
eccentricity of the axial load to the cylinder.
2. A cylinder with no initial imperfections was
tested with increasing axial load while radial
displacements of several points on the cylinder wall
were measured. Displacement measurements were
taken from zero axial load up to the final collapse load.
3. One permanent imperfection was imposed on the
cylinder wall and the action of the wall in the vicinity of
this imperfection was studied as the axial load was
increased to buckling. The displacements of points on
the cylinder generator passing through the permanent
imperfection were measured as a function of the axial
load.
2

Experimental Set-Up
The general experimental system is shown in Fig. 1. The
cylinder had a 4 inch radius and was made of 0. 010 inch thick Mylar
sheet. Mylar was used because of its recovery properties that permit
it to be rebuckled many times without lowering the buckling stress of
the specimen. The specimen w.as 11 inches long with an extra l/2 inch
at each end which was cast into grooves in aluminum plates with
Cerrolow 117 low melting point alloy. In order to obtain good end
fixity and uniform loading, l/8 inch holes were punched in the end
areas so that the Cerrolow could flow through and give a good lock to
the edges. The seam in all cases was l/2 inch wide and the bonding
agent was epoxy cement.
Load was applied by a standard testing machine but was meas-
ured by the load recording system shown. This consisted of four small
Mylar cylinders about 1 l/4 inches high and 1 inch in diameter. Strain
gages were cemented to these cylinders and their output was fed into a
strain gage bridge. Mylar was used because the loads expected were
very low and the low modulus of Mylar gave reasonable gage outputs
for these low loads. The load measuring system was calibrated and
found to be sufficiently linear over the ranges desired.
Displacement measurements were made with a reluctance type
pick-up which did not require mechanical contact with the cylinder wall.
Because such a pick-up only measures deflections of metal surfaces,
small (7/16” diameter) circles of aluminum foil (0. 002” thick) were
cemented to the Mylar surface with a small (0.005” diameter) spot of
epoxy cement. The deflection read was considered to be the deflection
B

of the center point of this aluminum circle and rotation effects were
neglected. The pick-up was initially centered in front of the metallic
circle at a distance of from 0. 06 to 0. 10 inches. With this system it
was possible to read radial deflections as small as 10 -4 inches.
In the first and.second series of experiments, calibration
readings were made for every point. As the pick-up was inside the
specimen, a pointer on a calibrated screw (reading to 10 -3 ) inches)
could be pushed against the cylinder wall from the outside thus getting
a direct measurement calibration. For the third series of experiments
the pick-up was placed outside the cylinder and no calibration was made.
However, from the calibration results of the other two cases, the
calibration could be estimated and, as will be shown later, the results
are consistent.
In the first series of experiments, the collapse load in the cylin-
der was measured as a function of wall displacements. In the second
and third series, a plotter was used which gave the displacement of a
point in the cylinder as a function of the load. Both sets of instrumen-
tation had relatively large time constants which did not affect the
recording of the loading branch of the curves. For points beyond
buckling (post-buckling) only the initial buckling point can be considered
as valid.
First Series of Experiments
In previous studies by the author (Ref. 4), dimples with
increasing depths were imposed on Mylar and brass cylinders and the
axial load was increased from zero to the collapse load while the
4
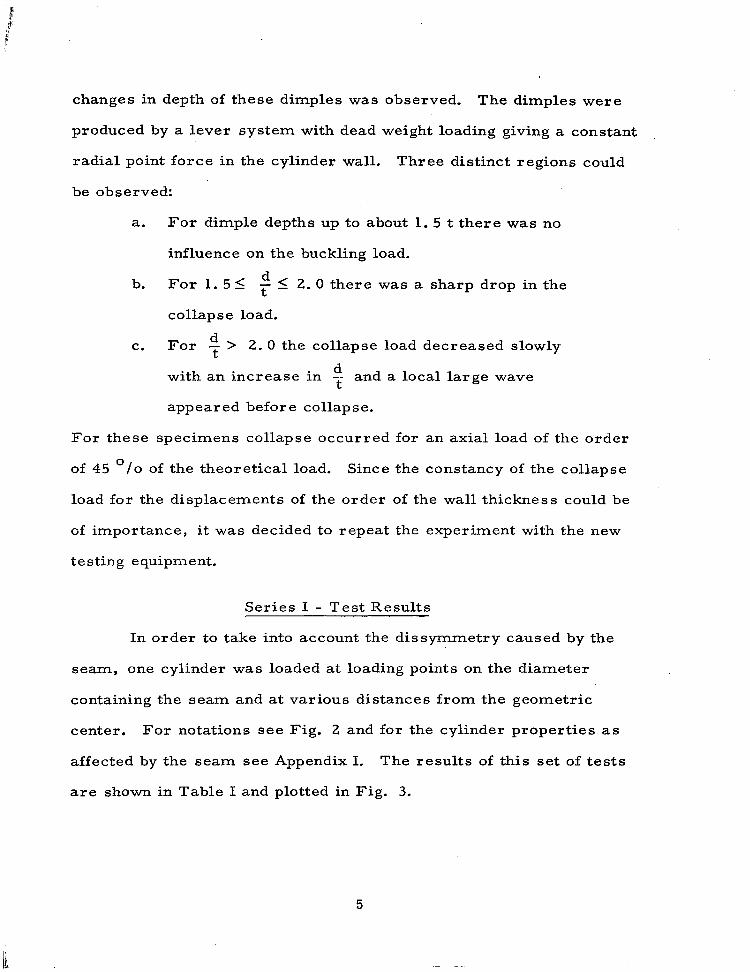
changes in depth of these dimples was observed. The dimples were
produced by a lever system with dead weight loading giving a constant
radial point force in the cylinder wall. Three distinct regions could
be observed:
a. For dimple depths up to about 1.5 t there was no
influence on the buckling load.
b. For 1.51 p 5 2.0 there was a sharp drop in the
collapse load.
C. For d T > 2. 0 the collapse load decreased slowly
d with an increase in -- t
and a local large wave
appeared before collapse.
For these specimens collapse occurred for an axial load of the order
of 45 O/o of the theoretical load. Since the constancy of the collapse
load for the displacements of the order of the wall thickness could be
of importance , it was decided to repeat the experiment with the new
testing equipment.
Series I - Test Results
In order to take into account the dissymmetry caused by the
seam, one cylinder was loaded at loading points on the diameter
containing the seam and at various distances from the geometric
center. For notations see Fig. 2 and for the cylinder properties as
affected by the seam see Appendix I. The results of this set of tests
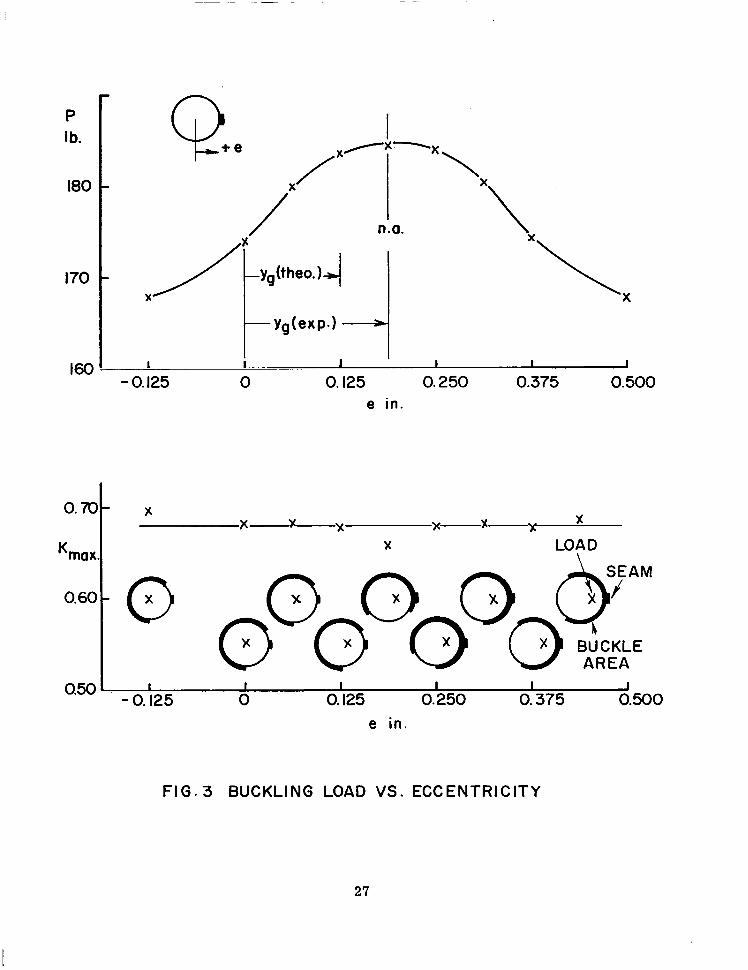
are shown in Table I and plotted in Fig. 3.
5

The initial cylinder imperfections were relatively low as
indicated by the fact that the maximum buckling stress was nearly
70 O/o of the classical value which is what would be expected from
previous test on cylinders with ends restrained against radial motion.
The curve of P vs. eccentricity is symmetric about an eccentricity
of 3/16 inch indicating that this is the location of the stiffness center
of the cylinder. This value of 3/16 = 0. 187 inch must be compared
with the predicted value of 0. 078 inch from Appendix I. Although the
agreement is not exact, the value of y is of the correct sign and the g
right order of magnitude. Differences between the measured and
calculated values may occur for several reasons, including possible
cylinder imperfections, effects of clamping the seam at the ends, or
non-uniform values of seam thickness which would affect the effective
s earn mo dulu s . It will also be noted from the location of the buckling
band in Fig. 3 that the true stiffness center is probably not exactly on
the diameter passing through the seam. This fact has been ignored in
the study.
The second phase of this series of test was concerned with the
effect of an imposed imperfection. The imposed imperfection. of
depth d, was always located in the center of the cylinder height and
directly opposite the seam. Table II and Fig. 4 gives the results of
this set of tests. The conclusion from this set of experiments can be
summarized as follows:
1. The maximum buckling stress (axial compression
plus bending) lies in the range of 0. 65 - 0. 71 times the
classical buckling stress.

2. An imposed dimple does not change the maximum
buckling stress until the dimple depth has reached a
magnitude of 1. 5 - 2. 0 times the cylinder sheet thickness
after which it falls to approximately half of the classical
value remaining at this level for deformations up to at
least 7 times the sheet thickness.
3. In some cases (eccentricity in the direction of the
deformation) an initial wave pattern was formed at a
somewhat lower stress value (u/a Cl
‘Y 0. 45) but complete
collapse did not occur until a value of U/W cj = 0.50 was
reached.
4. Moving the eccentricity away from the initial defor-
mation tended to delay the point where the initial
deformation took effect and to increase the final collapse
value a small account. In this case, below the critical
value of d/t, collapse takes place on the side opposite the
deformation where the maximum stress is highest. Above
d/t critical, the deformation induces the collapse and the
buckling band is in the side of the initial deformation.
The critical value of d/t as a function of the load distance
from the neutral axis is shown in Fig. 5. Plus values of
eccentricity give tension bending stresses at the deformation.
A typical shape of the imposed deformation is shown in Fig. 6.
Curvatures in the circumferential direction are seen to be much larger
than those in the axial direction.
7
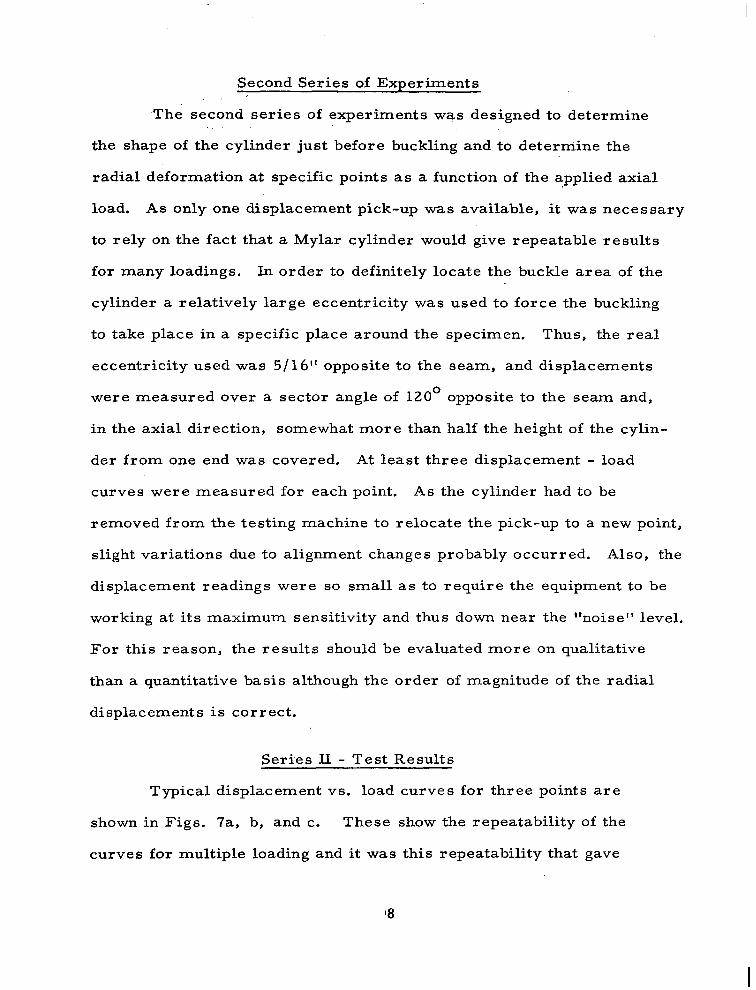
Second Series of Experiments
-The second series of experiments was designed to determine
the shape of the cylinder just before buckling and to determine the
radial deformation at specific points as a function of the applied axial
load. As only one displacement pick-up was available, it was necessary
to rely on the fact that a Mylar cylinder would give repeatable results
for many loadings. In order to definitely locate the buckle area of the
cylinder a relatively large eccentricity was used to force the buckling
to take place in a specific place around the specimen. Thus, the real
eccentricity used was 5/16” opposite to the seam, and displacements
were measured over a sector angle of 120° opposite to the seam and,
in the axial direction, somewhat more than half the height of the cylin-
der from one end was covered. At least three displacement - load
curves were measured for each point. As the cylinder had to be
removed from the testing machine to relocate the pick-up to a new point,
slight variations due to alignment changes probably occurred. Also, the
displacement readings were so small as to require the equipment to be
working at its maximum sensitivity and thus down near the “noise” level.
For this reason, the results should be evaluated more on qualitative
than a quantitative basis although the order of magnitude of the radial
displacements is correct.
Series II - Test Results
Typical displacement vs. load curves for three points are
shown in Figs. 7a, b, and c. These show the repeatability of the
curves for multiple loading and it was this repeatability that gave
‘8

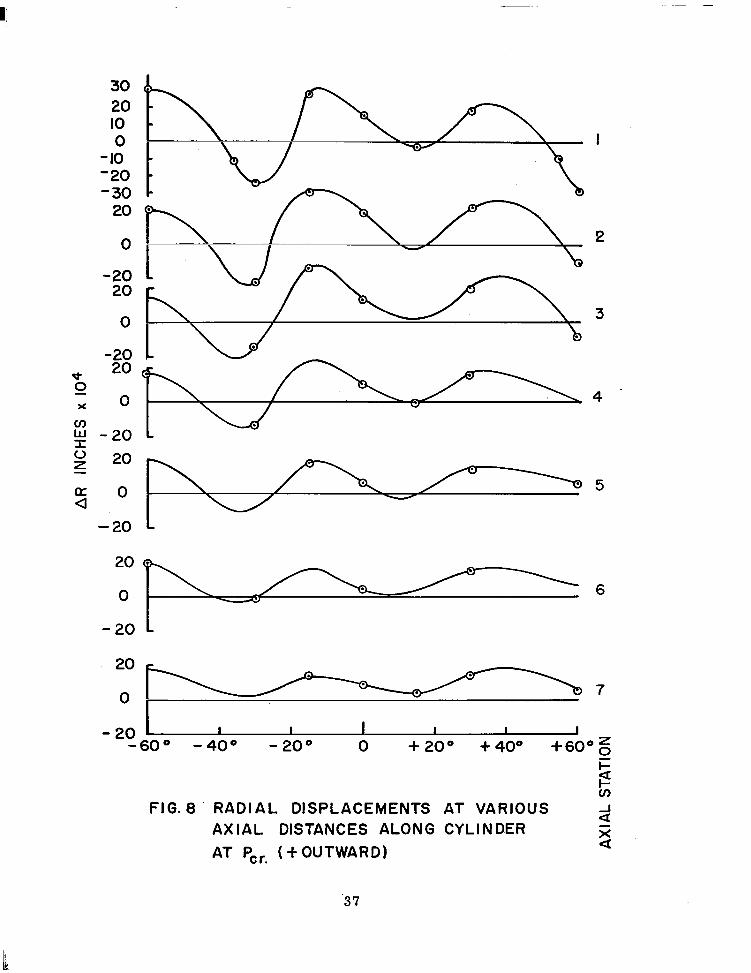
confidence in the method. Cross-faired circumferential and axial
plots of the radial formation just prior to buckling are shown in Figs.
8 and 9 and a surface plot is shown in Fig. 10. These curves show
the following results:
1. That a definite wave pattern has been established
just before buckling with a maximum amplitude of
about l/3 the sheet thickness.
2. That the curvatures in the axial direction are
generally much lower than those in the circumferential
direction.
3. That the circumferential wave pattern has a wave
length corresponding to approximately 45O of
circumferential angle. This wave length is very nearly
equal to the wave length of the diamond-shaped buckles
which form at collapse.
4. Appreciable non-linearity is shown in only two
regions (see Fig. 10) and it is probably these two
regions which precipitate collapse.
Since the recording apparatus was too slow to follow the post-
buckling deformation, the load-deformation waves beyond the collapse
point in Fig. 7 are not to be considered accurate. Curves with
considerable non-linearity as in Figs, 7b and 7c show that displacements
are increasing rapidly where they reach 20 - 40 O/o of the sheet thickness
corresponding in magnitude to the values of d/t critical of 1. 5 to 2 found
in Series I.
9
Third Series of Exneriments
These tests were made to watch the development of a local
imperfection into a large diamond shaped wave. The set-up is shown
in Fig. 11 and the permanent initial deformation (made by locally
loading the shell surface until yielding took place) was located at
point 2 (11/16” from the end of the cylinder). This region was chosen
because it was believed, at the time, that initial deformations near the
fixed end of the cylinder would have the most serious effect in the
buckling stress. Measurements were taken by attaching 7/ 16” dia-
meter aluminum foil discs along the generator through the initial
deformation and reading the change in displacement by the usual
reluctance pick-up. Again, repeatability of the Mylar was assumed
and checked by duplicate runs in the same point.
Series III - Test Results
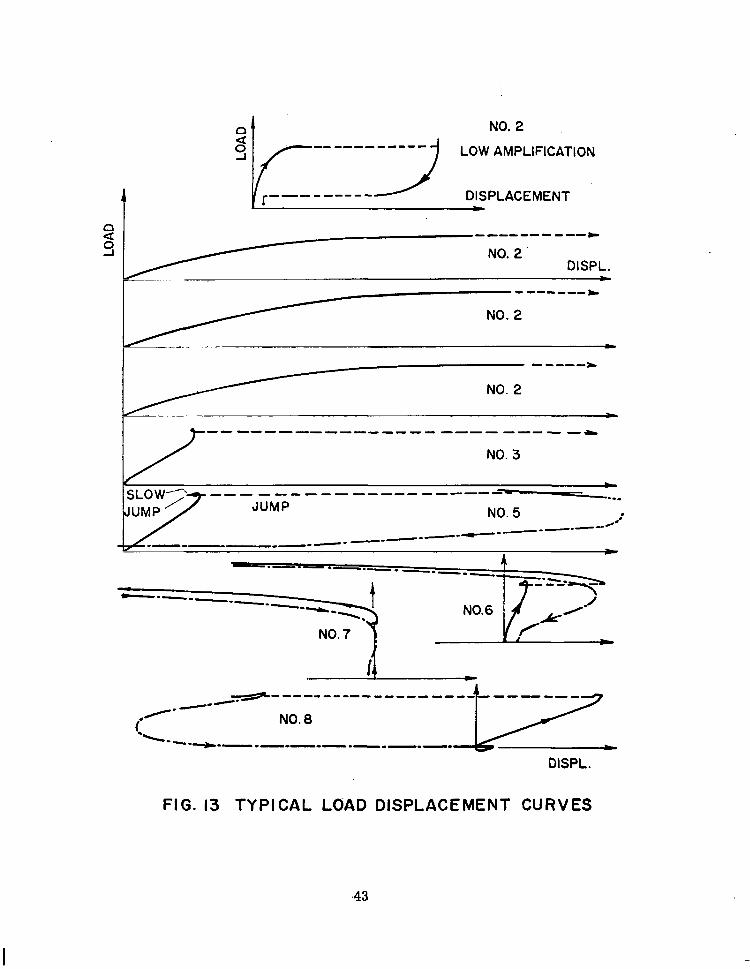
The repeatability of the load-deformation curves for separate
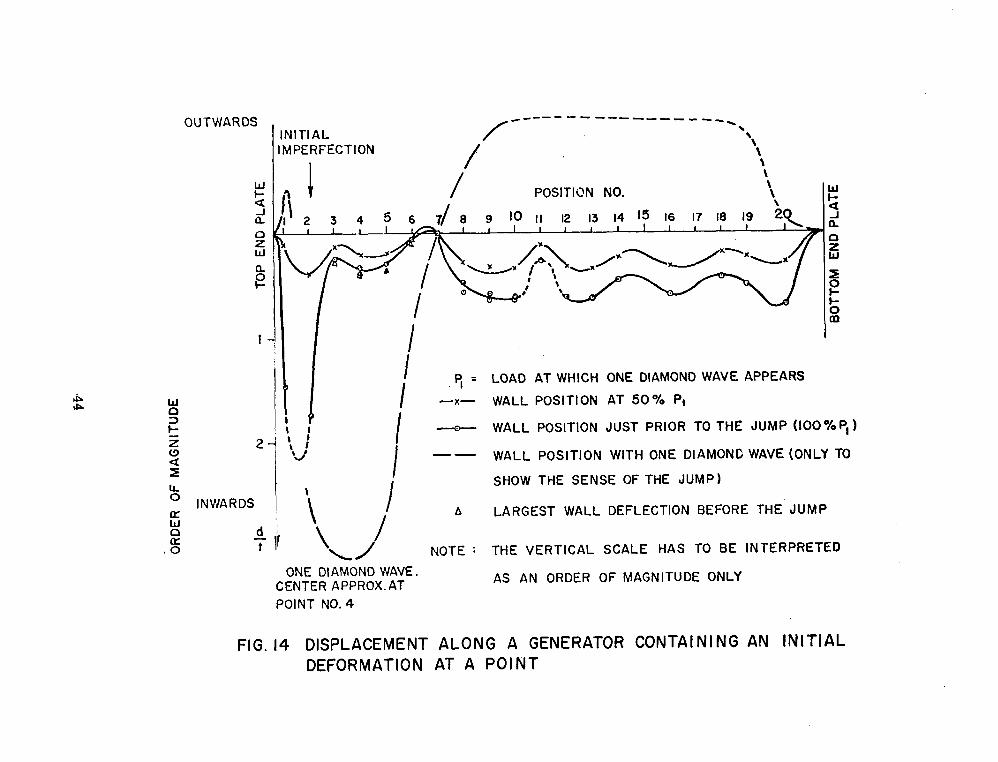
loading is shown in Fig. 12 and 13. The displacement along the
generator is shown in Fig. 14 for variou.s load conditions. From these
figures the following observations can be made:
1. A small region of local instability develops around the
initial deformation at point 2.
2. That collapse occurs when the displacement at point 2
has built up to approximately twice the thickness. This
agrees again with the first series of tests.
3. At points 3 to 8 there are displacement sense
reversals just before collapse.
10

4. After ‘collapse, and the formation of diamond waves,
the center of the first wave is at point 4 showing a sudden
jump to the stable post-buckling wave form.
The first formation of the diamond wave occurred at 0.45 Pee
and final collapse occurred at 0.47 P Ck
This also agrees with the
general results of the first series of tests.
Fig. 15 shows some of the complex displacements that can take
place in a cylinder as the load increases. Considering point No. 22
which is very close (l/4”) to the fixed edge we see that first it has an
outward radial deformation which is nearly linear and which corres-
ponds to the Poisson expansion. Then, due possibly to some
development of a circumferential wave pattern, the deformation goes
from positive to negative. Finally, just before collapse the sign again
reverses and large positive deformation occurs as collapse takes place.
Conclusions and Recommendations
1. For cylinders under axial load and a given boundary condition
there will be a buckling load which is a certain percentage of the classical
buckling load. For the present set of tests this percentage is from 65 O/o
to 75 O/o. Other tests at GALCIT indicate that this amount of reduction
from the classical value is probably due to the restraint against outward
expansion at the ends of the cylinder (prevention of Poisson expansion)
which causes an initial deformation at the ends.
11
2. That, for dimple-type initial deformations, no reduction
in the above collapse load occurs until the ratio of the dimple depth
to the hickness reaches a value of 1. 5 to 2. 0. The actual value of
this initial d/t value depends upon the type of loading (e. g. - ratio of
bending to axial stress).
3. That there is a small but finite wave pattern established
in the cylinder just before collapse takes place and, at least for these
experiments, the circumferential wave length of this wave pattern is
essentially equal to the diamond shape post-buckling pattern.
4. With sufficiently large initial deformation (d/t >, d/tcr)
there appears to be a lower bound for the collapse load which is of the
order of 0. 5 P c$ -
at least for values of d/t up to 7. 0.
Further research problems that are indicated by the above
results are:
1. Determine if d/tcr approaches zero for an essentially
perfect cylinder. This would mean that P - P CJ?
Such a
phenomenon is indicated by some of the recent work of the GALCIT
group for plated cylinders which are essentially perfect.
2. Attempt to correlate the displacements before collapse with
initial deformations. To do this correctly, an overall picture of the
initial state of the cylinder is needed as well as a means of following
the initial displacements during loading. Such a system has been
designed and is now being checked out.
3. Investigate the effect of location as well as size of an initial
deformation in the buckling load and determine how each form of initial
deformation changes as the load increases up to collapse.
12

APPENDIX I
W
%I
ES
E
t
R
V
GEOMETRICAL PROPERTIES OF CYLINDER WITH SEAM
= width of seam = 0. 5 in.
= thickness of seam = 0. 025 in.
= Young’s modulus of seam = 600,
= Young’s modulus of Mylar = 725,
Load Point -.
= cylinder wall thickness = 0. 010 in.
= cylinder radius = 4 in.
= Poisson’s ratio = 0. 3
e -+tL-
The effective area is given by
1 = 0. 256 sq. in.
Location of neutral axis is given by
E Yg = w tsg - t 1 R/A = 0.078 in.
Moment of inertia is
E I = rR3t + 2rRty2 t w(R
4 R - Ygj2bs $ - t) = 2. 09 in.
ub = ( pe,xp) F - ygfexp)j 1 I
u, = ( pee,) CR + y&exp;l “2 I
13
APPENDIX II
CLASSICAL LOAD FOR THE SPECIMEN
Using Poisson’s Ratio Y g 0. 3 for Mylar
‘2 = 725,000 . T . = 1,090psi
pCl! = A- ~,a = 0.256 - 1090 = 280 pounds
Radius expansion due to Poisson’s Ratio, for K = 0. 66 (Ref. Table I)
As suming u = 0.3
AR = J&R =0.3 g R =0.3 733
725,000 4 = 0. 00122 in.
14

REFERENCES
1. Babcock, C. D. , and Sechler, E. E. : The Effect of Initial
Imperfections in the Buckling Stress of Cylindrical Shells.
Collected papers in Instability of Shell Structures.
NASA TN D-1510, 1962.
2. Babcock, C. D., and Sechler, E. E. : The Effect of End Slope
on the Buckling Stress of Cylindrical Shells. NASA TN D-2537,
Dee ember 1964.
3. Sechler, E. E. : (Principal Investigator), Status Report No. 9 -
On the Buckling of Cylindrical Shells. Graduate Aeronautical
Laboratories, California Institute of Technology, Pasadena,
California, NASA Grant No. NsG-18-59, July 1965.
4. Ricardo, 0. G. S.: An Experimental Study on the General
Buckling of Thin-Walled Circular Cylinders under Axial Loads.
Internal Report. Guggenheim Aeronautical Laboratory,
California Institute of Technology, 1960.
5. Ricardo, 0. G. S. : Experiments on the Buckling of Cylinders.
Doctorate Thesis, Polytechnic School of the University of
S. Paulo, Brazil, 1964.
15

TABLE I
BUCKLING LOAD VS ECCENTRICITY
e P
in. lb
k **c
u e abl ub2 OTOTl uTOT2
g C exp ma.x
=P/P& psi. in. psi. psi. psi. psi. = uml”q~
-l/8 167. 7 0.599
0 174.0 0.621
l/16 180.0 0.643
118 183.6 0.656
s 3/16 184.4 0.659
l/4 184. 0 0.657
5116 180.4 0.644
318 174.2 0.622
-655 -5116
-680 -3116
-703 -l/8
-717 -l/16
-720 0
-719 l/16
-705 118
-680 3/16
112 167.7 0.599 -655 5116 -97 t107
yg (exp) = 3/16” = 0. 1875”
* PC1 = 280 lb.
** From Fig. 3
“cl = PcfA = - 1093 psi.
t97
t59
t41
t21
0
-21
-41
-59
-107 -558 -762 0.697
-65 -621 -745 0.682
-45 -562 - 748 0.684
-23 -698 -742 0.679
0 -720 -720 0.659
t23 -740 -696 0.677
t45 -746 -660 0.683
t65 -739 -615 0.676
-752 -548 0.688

TABLE IIa
EFFECT OF INITIAL DEFORMATION
Load Eccentricity = l/8” Opposite Seam = -0. 125”
Distance of Load from Neutral Axis = 5/16 = 0.3125”
x = 0.3125 P x 3.8125/2.09 = 0.570 P
ub2 = 0.3125 P x 4.187512.09 = -0.626 P
.~ d/t
_._. ii_ 0
0. 14
0. 23
0. 32
0.46
0. 58
0.68
0. 90
1.01
1.10
1.30
1.47
1.49
1.57
1. 60
1. 60
1.67
P
lb
u K C % ObZ O;rOT 1 OTOT2 max
psi. psi. psi. psi. psi.
171 -668 97 -107 -571 .-775
170 -664 97 -106 -567 -770
169 -660 96 -106 -564 -766
167 -652 95 -105 -557 -757
168 -656 96 -105 -560 -761
168 -656 96 -105 -560 -761
168 -656 96 -105 -560 -761
171 -668 97 -107 -571 -775
170 -664 97 -106 -567 -770
170 -664 97 -106 -567 -770
170 -664 97 -106 -567 -770
168 -656 96 -105 -560 -761
169 -660 96 -106 -564 -766
165 -644 94 - 103 -550 - 746
163 -637 93 - 102 -544 -739
161 -629 92 -101 -537 -730
160 -625 91 -100 -534 -725
0.711
0.706
0.703
0.694
0.698
0.698
0.698
0.711
0.706
0.706
0.706
0.698
0.703
0.684
0.678
0.670
0.665
17

TABLE IIa (cont’d. )
EFFECT OF INITIAL DEFORMATION
Load Eccentricity = l/8” Opposite Seam = -0. 125”
Distance of Load from Neutral Axis = 5/ 16 = 0.3125”
ubl = 0.3125 P x 3.8125/2.09 = 0.570 P
ub2 = 0.3125 P x 4.8175/2.09 = 0.626 P
d/t P U C
=bI ub2 =TOTl =TOT2 K max
lb psi. psi. psi. psi. psi.
1. 78 156 -609
1. 87 152 -594
1.99 150 -586
2.07 145 -566
2.17 142 -555
One Initial Wave
3.15 116 -453
3. 16 118 -46 1
5. 00 111 -434
Collapse
3.70 122 -477
3. 80 125 -488
5.40 126 -492
89 -98 -520 -707 0.649
87 -95 -507 -689 0.632
86 -94 -500 -680 0.624
83 -91 -483 -657 0.603
81 -89 -474 -644 0.591
66 -73 -387 -526 0.482
67 -74 -394 -535 0.491
63 -69 -371 -503 0.461
70 -76 -407 -553 0.507
71 -78 -417 -566 0.519
72 -79 -420 -571 0.524
18

. TABLE IIb
Load Eccentricity = 3/16” Towards Seam = to. 1875
Distance of Load from Neutral Axis = 0 (Therefore, no bending)
d/t P U
lb pk. Kmax
0 187 732 0.672
0.20 190 741 0.680
0.22 184 720 0.661
0. 25 183 716 0.657
0.36 185 723 0.663
0. 60 185 723 0.663
0.69 183 716 0.657
1. 10 186 728 0.668
1.48 185 723 0.663
1.55 184 720 0.661
1. 60 185 723 0.663
1.70 183 716 0.657
1.70 179 701 0.643
1.75 177 693 0.636
1.80 177 693 0.636
1.88 174 681 0.625
2. 30 162 632 0.580
5.00 140 548 0.503
19

TABLE IIc
Load Eccentricity = l/4” Towards Seam = +O. 250”
Distance.of Load from Neutral Axis = -0. 0625”
ubl = -0.0625 P x 3.8125/2.09 = -0.1140 P
ab2 = 0.0625 P x 4. 187512.09 = 0.1252 P
d/t P o- C ubl
lb psi. psi. psi. psi. psi.
0
0.21
0. 27
0.35
0.53
0. 62
0. 78
1. 20
1.51
1.68
1.70
1.70
1.90
1. 92
1. 96
2. 22
2. 30
2. 70
3. 20
188
185
184
182
185
185
184
183
184
185
185*
187
184*
184*
180*
165*
169*
149+
141*
-734
-723
-719
-711
-723
-723
-719
-715
-719
-723
-723
-730
-719
-719
-703
-645
-660
-582
-551
-21
-21
-21
-21
-21
-21
-21
-21
-21
-21
-21
-21
-21
-21
-20
-19
-19
-17
-16
24 -755 -710 0.693
23 -744 -700 0.683
23 -740 -696 0.679
23 -732 -688 0.672
23 - 744 -700 0.683
23 - 744 -700 0.683
23 -740 -696 0.679
23 -736 -692 0.675
23 -740 -696 0.679
23 - 744 -700 0.683
23 - 744 -700 0.683
23 -751 -707 0.689
23 -740 -696 0.679
23 -740 -696 0.679
22 -723 -681 0.663
21 -664 -624 0.609
21 -679 -639 0.623
19 -599 -563 0.550
18 -567 -553 0.520
One Initial Wave
120

- ri
TABLE IIc (cont’d. )
Load Eccentricity = l/4” Towards Seam = +O. 250”
Distance of Load from Neutral Axis 3: -0. 0625”
ubl = 0.625 P x 3.8125/2.09 = -0.1140 P
ub2 = 0.625 P x 4.1875/2.09 = 0.1252 P .-
d/t P U C
Obl ub2 aTOTl uTOT2 Kmax
lb psi. psi. ._ Psi. ~~ ~~ _ psi. psi. *
3.20 138 -539 -16 17 -555 -522 0.509
5.10 114* -445 -13 14 -458 -43 1 0.420
Collapse
3. 32 141* -551 -16 18 -567 -533 0.520
5. 10 144* -563 -16 18 -579 -545 0.531
5.40 142* -555 -16 18 -571 -537 0.524
* Buckle Band On Side of Dimple (Opposite Seam) Otherwise, Buckle
Band On Seam Side (Opposite Deformation).
821

TABLE IId
Load Eccentricity = 3/8” Towards Seam = +O. 375”
Distance of Load from Neutral Axis = -3/16” = -0.1875
= -0.1875 P x 3.8125/2.09 = -03420 P ubl
ub2 = 0. 1875 P x 4. 1875/2. 09 = 0.3757 P
d/t P U C
Obl Ob2 OTOTl uTOT2 %nax
lb psi. psi. psi. psi. ps~i. psi.
0 178 -695 -61 67 -756 -628 0.694
0. 29 179 -699 -61 67 -760 -632 0.697
0.35 178 -695 -61 67 -756 -628 0.694
0.45 179 -699 -61 67 -760 -632 0.697
0.56 179 -699 -61 67 -760 -632 0.697
0.67 182 -711 -62 68 -773 -643 0.709
0. 72 177 -691 -61 66 -752 -625 0.690
0.86 179 -699 -61 67 -760 -632 0.697
1. 27 178 -695 -61 67 -756 -628 0.694
1.51 177 -691 -61 66 -752 -625 0.690
1. 67 176 -688 -60 66 -748 -622 0.686
1.77 179 -699 -61 67 -760 -632 0.697
1.99 179 -699 -61 67 -760 -632 0.697
2. 02 176 -688 -60 66 -748 -622 0.686
2. 05 177* -691 -61 66 -752 -625 0.690
2. 08 181 -707 -62 68 -769 -639 0.706
2. 17 184 -719 -63 69 -782 -650 0.717
2. 24 171* -668 -58 64 -726 -604 0.666
2. 36 174* -680 -60 65 -740 -615 0.679
2. 38 176* -688 -60 66 -748 -622 0.686
22
TABLE IId (cont’d. )
Load Eccentricity = 3/8” Towards Seam = +O. 375”
Distance of Load from Neutral Axis = -3/16” = -0.1875
Obl = -0.1875 P x 3.8125/2.09 = -0.3420 P
u’b, = 0. 1875 P x 4. 1875/2. 09 = 0.3757 P
d/t P U C
ubl ub2 uTOT 1 uTOT2 K
max
lb psi. psi. psi. psi. psi. psi.
2.66 15z -617 -54 59 -671 -558 0.616
3. 27 149* -582 -51 56 -633 -526 0.581
5. 00 151* -590 -52 57 -642 -533 0.589
7.00 145* -566 -50 54 -616 -512 0.565
7.00 149* -582 -51 56 -633 -526 0.581
* Buckle Band On Side Of Dimple (Opposite Seam) Otherwise, Buckle
Band On Seam Side (Opposite Deformation).

I
////I/ I I I BALDWIN TESTING MACHINE
I I
I- METALLIC CIRCLE
DISPLACEMENT _ /- CALIBRATED POINTER
I I I ‘I I
BRIDGE . .
RECORDER FIG. I a EXPERIMENTAL ASSEMBLY
ELECTRONIC EQUIF! AND BRIDGE
24

FIG. 1 b
25

C = GEOMETRICAL CENTER CG = CENTER OF GRAVITY
w = SEAM WIDTH
FIG. 2 CYLINDER NOTATION
26
P lb.
180
170
I60
Q +e
t-
Yg(exp.1 -
- 0.125 0 0.125 0.250 0.375 0.500 e in.
--x --
K::- ; ;p&gJ)~~;&~AM
x x X x BUCKLE AREA
0.50 I I I I I I
- 0.125 0 0.125 0.250 0.375 0.500 e in.
FIG.3 BUCKLING LOAD VS. ECCENTRICITY
827

0.9c
0.80
K mox
0.60
m
‘\
\
\
- \
\
\
\
. !
REAL ECCENTRICITY gOPPOSITE SEAM
X INITIAL WAVE
0 COLLAPSE BUCKLING BAND ON SIDE CONTAINING INITIAL DEFORMATION (OPPOSITE SEAM)
R=4in. t = O.OIOin. MYLAR
I 2 d/t
3 4 5
FIG.4 EFFECT OF INITIAL DIMPLE OF DEPTH d
28

1.00
0.9c
0.8C
Kmax
0.70
0.60
.
\
\ \
\ \
\
\ \
\
REAL ECCENTRICITY = 0
o COLLAPSE
BUCKLING BAND ON SIDE CONTAINING INITIAL DEFORMATION (OPPOSITE SEAM)
R=4 in. t = 0.010 in. MYLAR
\ \
(b)
FIG. 4 (Can’t.)
29

1.00
0.90
0.80
K mm
0.79
0.60
0.50
REAL ECCENTRICITY L
&‘TOWARDS SEAM
‘\ \ x INITI.AL WAVE
\ 0 COLLAPSE (BUCKLE BAND ON SEAM SIDE)
\ p COLLAPSE (BUCKLE BAND OPPOSITE SEAM
\ ON DEFORMATION SIDE)
\
‘\ R=4 in. t =O.OlO in. MYLAR
- \
\ \
\ \
.
2 3 d/t
(cl
FIG. 4 (Con?.)
30

I.OC
09C
0.8C
K max.
0.7c
0.6C
w
‘\
gTOWARDS SEAM REAL ECCENTRICITY 16
\ \ 0 COLLAPSE (BUCKLE BAND ON SEAM SIDE)
\ p’ COLLAPSE (BUCKLE BAND OPPOSITE SEAM \ ON DEFORMATION SIDE )
\ \ R=4in. t = 0.010 in. MYLAR
\ \
\ \
-\
----g*
d/t
Id)
FIG. 4 (Con?.)
31

2.0
( ) % C
I.0
0 I I I I I
- l/4
FIG. 5 CR
- ‘4.) 0
REAL ECCENTRICITY (
+I/8
INCHES)
TICAL DEFORMATION DEPTH VS. ECCENTRICITY
+ ‘/4
132

INCHES
IO
I
x ALONG TRANSVERSE SECTION
z ALONG GENERATOR
d DEPTH, (RADIAL)
/ 20
U d INCH . im5
POINTER AT x=0 ,z=O
DEPTH = 0.020” d
t =2
R=4” t - o.oloy MYLAR
FIG. 6 TYPICAL DEFORMATION SHAPE
33

0 0
-t
Q WALL POSITION AT BUCW.JNG
!2 t EXTRAPOLATION OF THE LINEAR PORTION
53 $} NON- LINEAR PORTION OF THE WALL DISPLACEMENT
FIG.7 LOAD DISPLACEMENT CURVES FOR TYPICAL POINTS ON THE CYLINDER

o WALL POSITION AT BUCKLING
+ EXTRAPOLATION OF THE
LINEAR PORTION OF THE
DISPLACEMENT
I I
I 2 POISSON’S EFFECT 0 0.00122”OUTWARDS DISPLACEMENT INWARDS, INCH/ 1000
FIG. 7 b
35

APPROX. ASYMPTOTIC LINE
K S 0.85
o WALL POSITION AT BUCKLING + EXTRAPOLATION OF THE LINEAR
PORTION OF THE DISPLACEMENT
0 I 2 3 4 DISPLACEMENT INWARDS, INCH / 1000
FIG. 7c
136
30 20 IO 0
-10 -20 -30
20
0
-20 20
0
t 2:
0 x 0
ii -20 $ 20 -
-20
20
0
-20
20
0
- 20
6
7
60° -40° -20° 0 + 2o” + 4o” +60° 5 i=
FIG. 8 RADIAL DISPLACEMENTS AT VARIOUS AXIAL DISTANCES ALONG CYLINDER AT PC,. (tOUTWARD)
.37

30 20 IO 0
-10 -20 -30
20
0
-20
20
0
t -20 0 % 20
E 3
0 z --20 a d 20
0
-20
20
0
-20
F- - ---__-- ----------------- Z
L
r -c-----w\
-\ --- ____- -------- -___
_-------_ -ma_ _--m--------w
r
8
-60” -40 O -20° O0 2o” 4o” 60° 22 v)
FIG. 8 (CON’T. 1
98

0 W
I
2
3
4 2 05 F 5”
-If a z a8
I I I
L
l/2”
T
:LAMPED
m- I
.
.
\
f I I
I I
j 1
0 -30°
-20 AR INCHES xl04
0 20 -20 0 20
\ \
I 6
+60°
FIG. 9 RADIAL DISPLACEMENT OF GENERATORS AT Per

t ’ ‘/2*
+ 2
3
4
5
6
7
0
IO
RADIUS EXTENSION DUE TO POISSON’S STRAIN AT BUCKLliG ’ 0.00122’ WHEN P= I04 LB.
WALL POSITION AT BUCKLING IF POISSON’S STRAIN ACTED ALONE
DISPLACEMENT Q WALL POSITION AT BUCKLING
+ EXTRAPOLATED LINEAR PORTION
NON-LINEAR PORTION OF THE
WALL DISPLACEMENT
FIG. IO CYLINDER DEFORMATION AT BUCKLING
‘40

$1 l/2 ” 4
REGION OF PERMANENT IMPERFECTION
0 I8 0 19
CIF%iE
P P
MYLAR s
PICK- UP
P
FIG.11 EXPERIMENTAL SET-UP FOR SERIES III TESTS

DISPLACEMENT DISPLACEMENT
* DISPLACEMENT
----------e-m----
(b)
DISPLACEMENT
FIG. I2 LOAD DISPLACEMENT CURVES FOR POINT I AT DIFFERENT LOADS. (a) LOW AMPLIFICATION (b) HIGH AMPLIFICATION
NO. 2 ----------- LOW AMPLIFICATION
-----s--- DISPLACEMENT
-----w-m--*
NO. 2 DISPL.
h ---W.--w)
NO. 2
--B--L
NO. 2
NO. 3
DISPL.
FIG. 13 TYPICAL LOAD DISPLACEMENT CURVES
,43
OUTWARDS
I
W 0
2 ‘-
: 2
ZJE IL
o INWARDS
a t
INITIAL IMPERFECTION
---------a -______ N
/ \
‘\ \ \
POSITION NO.
LOAD AT WHICH ONE DIAMONO WAVE APPEARS
-x- WALL POSITION AT 50% P,
WALL POSITION JUST PRIOR TO THE JUMP (lOO%P,)
-- WALL POSITION WITH ONE DIAMONC WAVE (ONLY TO
\ I
SHOW THE SENSE OF THE JUMP)
\ /
A LARGEST WALL DEFLECTION BEFORE THE JUMP
I \ I/ NOTE : THE VERTICAL SCALE HAS TO BE INTERPRETED
ONE DIAMOND WAVE. CENTER APPROX. AT AS AN ORDER OF MAGNITUDE ONLY
POINT NO. 4
FIG. 14 DISPLACEMENT ALONG A GENERATOR CONTAINING AN INITIAL DEFORMATION AT A POINT

II
ONE WAVE
NO.6 ’ I
NO. I2
b INWARDS
DISPLACEMENT INWARDS
DISPLACEMENT C ONE WAVE
NO. 22
(l/4” FROM TOP END PLATE )
INWARDS *
DISPLACEMENT
FIG. I5 DISPLACEMENT CURVES AT VARIOUS POINTS DURING LOADING
NASA-Langley, 1967 _ 32 CR-934
I ---_-_-___ .
,45