Embed Size (px)
Citation preview
1
An Experimental Investigation of Hot Surface Ignition of Hydrogen and
Hydrocarbon Mixtures in Air
Brian Ventura
Mechanical Engineering California Institute of Technology
Pasadena, CA 91125
Senior Thesis
Submitted June 1, 2011

2
Acknowledgements
This project was carried out in the Explosion Dynamics Laboratory under the guidance of Philipp Boettcher. Without Phil’s many hours of help in the lab, this work would not be possible. Dr. Sally Bane performed numerous flame speed calculations, and Dr. Guillaume Blanquart provided the simulations involving the glow plug ignition. Dr. Shepherd supplied the initial opportunity for me to do this work and also provided valuable advice throughout the process. The SURF program, specifically John and Barbara Gee, also helped provide me with the initial opportunity to work in the lab over this last summer. The project was financially supported by the Boeing Company through the strategic research and development agreement at Caltech.
3
Abstract
Hot surface ignition was examined using a variety of heat sources in a series of premixed hydrocarbon, hydrogen, and air mixtures. Building off previous work, hexane-air, heptane-air and hydrogen-air experiments were performed in addition to the eventual hexane-hydrogen-air mixtures. Using high-speed schlieren photography, thermocouples, and a fast-response pressure transducer, flame characteristics such as ignition temperature, flame speed, pressure rises, and combustion mode were recorded. Variations in the mixture composition gave rise to different modes of combustion: single flame, multiple flames, and continuously puffing ignition. A puffing mode was demonstrated for lean hydrogen-air mixtures and for a narrow range of hydrogen-hexane-air mixtures.
4
Table of Contents Introduction 5 Experimental Setup Vessel 6 Schlieren imaging 7 Quantitative Data 8 Results Hexane Air 9 Heptane Air 12 Hydrogen Air 12 Variable Geometries 14 Hexane Hydrogen Air 14 Conclusion 21 References 22 Appendix I 25 Simulated Expansion Ratios Appendix II 30 Simulated Laminar Burning Velocities
5
Introduction
Ignition of flammable gas mixtures cannot be treated solely as a threshold phenomenon where the risk of accidental ignition is evaluated in many applications based solely on the temperature. Studies have shown that ignition is a statistical phenomenon [19], dependent not only on temperature but also on factors such as heat source geometry [9]. The dependence of ignition temperature on heat source size is shown in Figure 1, where several fuels are tested over a range of surface areas. This figured overlays two studies, one by Kuchta et. all comparing two separate geometries are plotted together: heated rods and wires, with a low velocity mixture flowing by the heating element. Over this has been plotted for ignition of quiescent hexane-air mixtures of varying fuel-air ratios with a glow plug. We clearly see that parameters beyond simply temperature are significant for ignition. Thus, a more thorough understanding of thermal ignition and its contributing factors is necessary to properly design and evaluate engineering systems.
Figure 1: Hot surface ignition temperature vs. heat source area for various hydrocarbon
fuels and an engine oil in air [9]
One such engineering system is the internal combustion engine. In the ongoing quest for higher efficiencies and lower emissions, the idea of burning fuel lean mixtures holds several attractive benefits [1]. However, near the flammability limit, the mean effective pressure is reduced and ignition timing becomes greatly variable [2]. This results in knocking, which is inefficient and damaging to the engine. It has been proposed that the addition of a small amount of hydrogen could mitigate some of these negative lean combustion features while preserving the positive ones [3]. Having a low flammability limit, a high diffusivity, and a high flame speed compared to hydrocarbons [20], it is possible that hydrogen could make lean hydrocarbon combustion faster and more reliable, resulting in a cleaner and more efficient engine. Hydrogen has an autoignition temperature of 520o C as opposed to 225o C for both heptane and hexane.
6
However, hydrogen’s flame speed of 325 cm/s is close to 8 times faster than both hydrocarbons (41 cm/s at stoichiometric mixtures) [20]. Hydrogen also has a much wider flammability range (4.1%-75%) than hexane (1.5% - 7.6%) [12]. However, the characteristics of the combustion properties of the combined mixtures are undergoing continued study [11]. Studies have shown that, by a small addition of H2, NO concentrations are halved, CO concentrations are decreased by a factor of 20 from their highest point, and hydrocarbon emissions are reduced by more than 1/5 [16]. Leaner mixtures would also enable higher pressure ratios, giving higher thermal efficiencies [11]. The objective of this research was to experimentally examine hot surface ignition and flame propagation of a hydrogen-hydrocarbon fuel mixture. Parameters such as ignition temperature, flame speed, pressure rises, lower flammability limit, and combustion chamber temperature were examined over a range of hydrogen-hydrocarbon ratios and fuel–oxygen ratios (equivalence ratio). Hexane and heptane were used as hydrocarbon fuel. Hexane is experimentally easiest to work with due to its high volatility, while heptane has similar combustion properties to some components of gasoline and detailed chemical reaction mechanisms are more readily available for heptane [15]. Initial pressures were not equivalent to that of internal combustion engines, so investigation of areas such as emissions is outside the scope of this research. However, we believe the results are useful in conjunction with computational work in order to better understand the mechanisms and properties of hydrogen-hydrocarbon ignition. Experimental Apparatus Vessel The experiments were conducted inside a closed 2 liter combustion vessel, shown in Figure 2. For each experiment, the vessel was completely evacuated, then filled with hexane, hydrogen, oxygen, and nitrogen for a mixture accurate to 0.01 kPa using the method of partial pressures. The mixture was then mixed using a circulation pump for 2 minutes and left to come to rest for 2 minutes before increasing the temperature of the hot surface. The hot surface was usually an Autolite 1110 glow plug, though metal and wire strips were also used to investigate the effect of surface area on the flame. For mixtures involving a single fuel, the fuel to air ratio can be expressed as an equivalence ratios (denoted ø), with ø = 1 denoting a stoichiometric mixture, ø < 1 denoting a fuel-lean mixture, and ø > 1 denoting a fuel rich mixture. Hexane-air mixtures were examined across a range from the lower flammability limit (around ø = 0.5) to a very rich mixture (ø = 3). When multiple fuels are present, as in our hexane-hydrogen-air mixtures, equivalence ratio becomes much more difficult to define [11]. Because of this, we have referred to these mixtures in terms of only the fuel mixture fractions.
7
Dark point
Figure 2: (a) Vessel, boundary plate, glow plug, and field of view (FOV) with dimensions in mm.
(b) Example of color schlieren picture showing FOV, glow plug, flame, and a thermocouple (to the right of the glow plug). The mixture shown is hexane-air at ø = 2.5
Schlieren Imaging From similar research performed during the summer, a high speed dark background schlieren imaging system was in place and ready to use. The schlieren setup gave qualitative information of the flow field, ignition, and flame propagation. A dark background schlieren system works by first turning a point source into a collimated light beam by passing it through a lens. This beam passes through the test region where changes in fluid density (brought about by heat or flame) result in changes in the index of refraction. The light beam is then focused onto small dark point, blocking out all non-refracted light. Locations with large changes in the index of refraction (and thus large density variations) cause light to be deflected away from the dark point. Thus the projected image will display density gradients in terms of varying intensity of light. An example schlieren setup is diagramed in Figure 2, shown below [7]:
Figure 3: Example schlieren setup, taken from [7].
Boundary plate
8
Quantitative Measurements A fine wire thermocouple touching the glow plug (shown on the right in Figure 4b) enabled measurements of the temperature of the glow plug at the time of ignition as determined from the video. This was reported as the hot surface ignition temperature. A fast-acting pressure transducer (Endevco Model 8530B-200) at the top of the vessel measures the pressure rise in the vessel during combustion. In our previous research, the pressure rise has a strong correlation with combustion mode and Richardson Number [15] (a relation of buoyancy to flame speed), both of which are related to flame speed. For measurements of temperature in the hot plume and path of the flame, we have an array of fine wire thermocouples that sit vertically above the glow plug as shown in Figure 4a. There are always concerns about the catalytic effect of these thermocouples, so the array will not be present during lower flammability limit tests. However, while the array was present it did allow us to characterize the plume temperature, shown below in Figure 4. Additionally, the array showed that the thermocouple on the glow plug itself was not capable of measuring the temperature of the flame. It is unlikely that any of our thermocouples have fast enough time constants to accurately measure the temperature of the flame as it passes – the adiabatic flame temperature is around 2000K, while the peak recorded by these thermocouples was around 1200K. However, the thermocouple at the glow plug was additionally lower, peaking at around 950K.
(a) (b) Figure 4: (a) Vessel window showing glow plug and thermocouple array
(b) Temperature trace of glow plug heating air without fuel (hot plume development)
Height above GP (in).01 .4 .8 1.2 1.6 2.0 2.4
9
6:
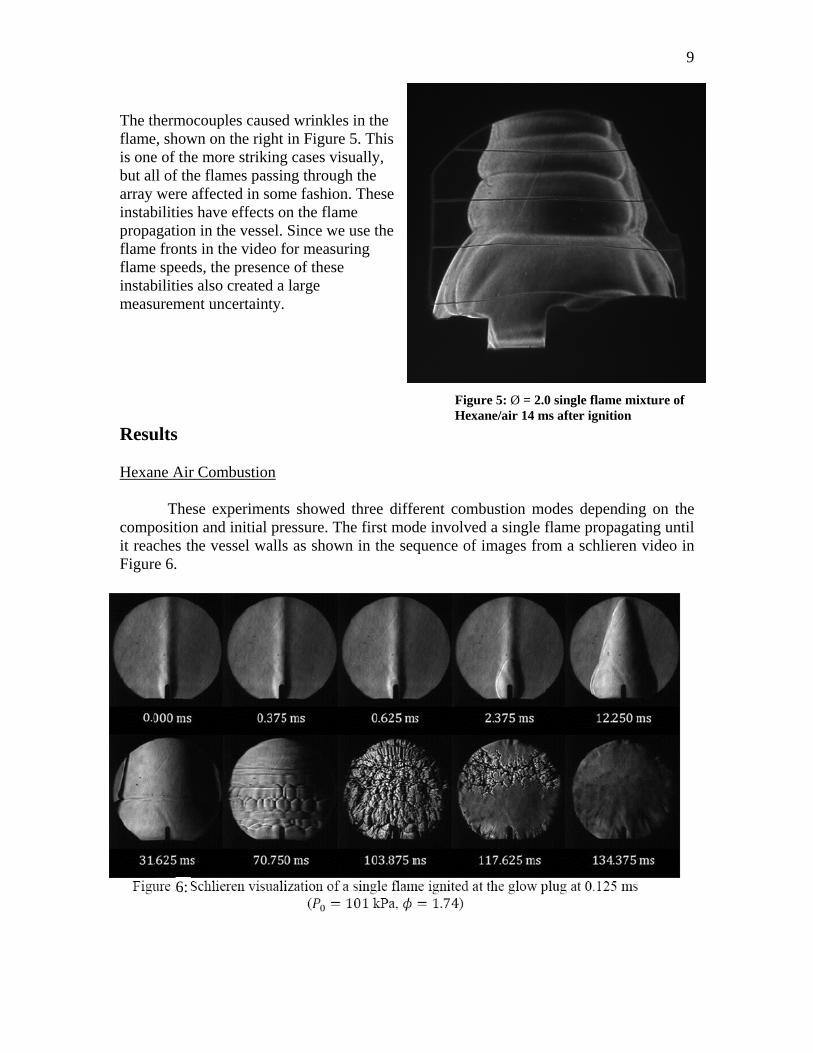
The thermocouples caused wrinkles in the flame, shown on the right in Figure 5. This is one of the more striking cases visually, but all of the flames passing through the array were affected in some fashion. These instabilities have effects on the flame propagation in the vessel. Since we use the flame fronts in the video for measuring flame speeds, the presence of these instabilities also created a large measurement uncertainty.
Figure 5: Ø = 2.0 single flame mixture of Hexane/air 14 ms after ignition
Results Hexane Air Combustion These experiments showed three different combustion modes depending on the composition and initial pressure. The first mode involved a single flame propagating until it reaches the vessel walls as shown in the sequence of images from a schlieren video in Figure 6.
10
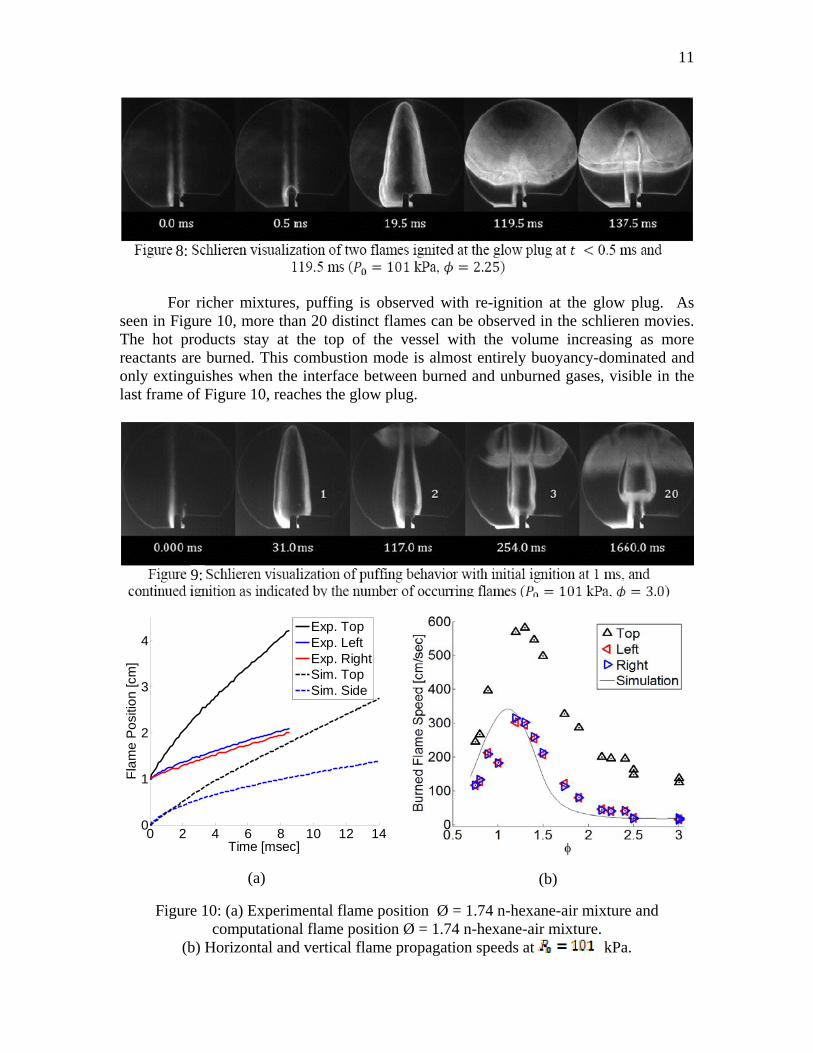
In the second mode, two to three flames ignited sequentially, as shown in Figure 8. The final mode corresponds to a continuously puffing flame, with separate and distinct ignitions seen throughout the duration of the video (about 6 seconds), as shown in Figure 10.
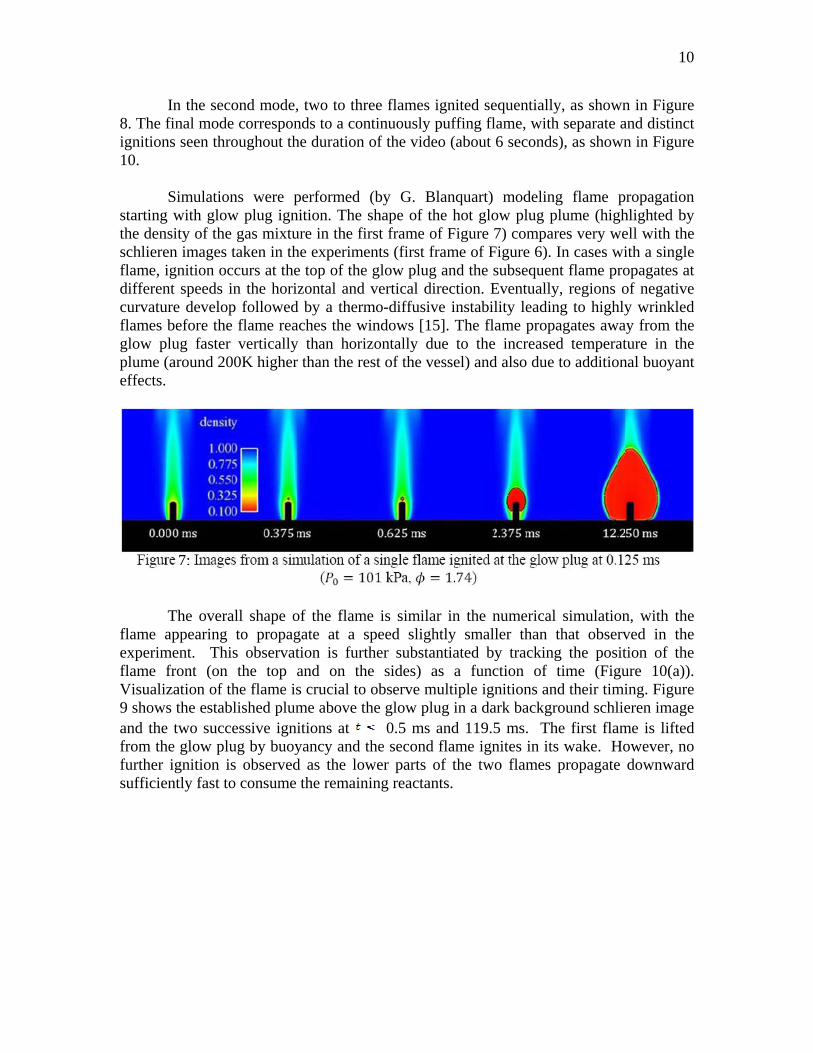
Simulations were performed (by G. Blanquart) modeling flame propagation
starting with glow plug ignition. The shape of the hot glow plug plume (highlighted by the density of the gas mixture in the first frame of Figure 7) compares very well with the schlieren images taken in the experiments (first frame of Figure 6). In cases with a single flame, ignition occurs at the top of the glow plug and the subsequent flame propagates at different speeds in the horizontal and vertical direction. Eventually, regions of negative curvature develop followed by a thermo-diffusive instability leading to highly wrinkled flames before the flame reaches the windows [15]. The flame propagates away from the glow plug faster vertically than horizontally due to the increased temperature in the plume (around 200K higher than the rest of the vessel) and also due to additional buoyant effects.
The overall shape of the flame is similar in the numerical simulation, with the flame appearing to propagate at a speed slightly smaller than that observed in the experiment. This observation is further substantiated by tracking the position of the flame front (on the top and on the sides) as a function of time (Figure 10(a)). Visualization of the flame is crucial to observe multiple ignitions and their timing. Figure 9 shows the established plume above the glow plug in a dark background schlieren image and the two successive ignitions at 0.5 ms and 119.5 ms. The first flame is lifted from the glow plug by buoyancy and the second flame ignites in its wake. However, no further ignition is observed as the lower parts of the two flames propagate downward sufficiently fast to consume the remaining reactants.
7:
11
For richer mixtures, puffing is observed with re-ignition at the glow plug. As seen in Figure 10, more than 20 distinct flames can be observed in the schlieren movies. The hot products stay at the top of the vessel with the volume increasing as more reactants are burned. This combustion mode is almost entirely buoyancy-dominated and only extinguishes when the interface between burned and unburned gases, visible in the last frame of Figure 10, reaches the glow plug.
0 2 4 6 8 10 12 140
1
2
3
4
Time [msec]
Fla
me
Po
sitio
n [c
m]
Exp. TopExp. LeftExp. RightSim. TopSim. Side
(a)
(b)
Figure 10: (a) Experimental flame position Ø = 1.74 n-hexane-air mixture and computational flame position Ø = 1.74 n-hexane-air mixture.
(b) Horizontal and vertical flame propagation speeds at kPa.
9:8:
9:
12
Tests with Heptane
Tests have been conducted with heptane in order to validate the comparisons between the hexane combustion tests accomplished during the summer and the heptane-based computations. Heptane is, in general, a better studied surrogate for gasoline than hexane, and has been used in computational models for comparison. Because one target application of hydrogen–hydrocarbon combustion is automobile engines [2], it is important that we know if our experiments are applicable to this case. In order to validate the hexane/heptane comparisons, we examined a range of important points, but not as detailed a spectrum of equivalence ratios. Conducting these experiments, we did run into some problems. Heptane (C7H16, 100.21 g/mol) is a larger molecule than hexane (C6H14, 86.18 g/mol) and its vapor pressure is thus lower. Hexane’s vapor pressure at STP is 130 Torr, while heptane is only around 44 Torr. While all of our target mixture ratios had heptane pressures under 44 Torr, we still saw evidence that all of the fuel was not in vapor form. Normally, with hexane, we are able to inject fuel in liquid form, which then vaporizes into the system. Reading the pressure from a transducer accurate to 0.1 Torr, we are able to either add additional hexane or bleed out excess hexane (since this is the only gas in the evacuated system at this time) through a needle valve until we reach our target value. With the heptane, we tried this same method, but had trouble reaching the higher fuel-air ratios. The pressure would continually decrease after injection, never equilibrating to a good final value. To make matters worse, when we added the oxygen and nitrogen afterwards, the pressure would be seen to slowly creep higher, thus adding uncertainty to the oxygen and nitrogen measurements as well as that of the heptane. Knowing that vapor pressure increases with temperature, we tried to warm the system. First, we raised the temperature of the room several degrees using the thermostat, but this was not very effective in addition to being somewhat uncomfortable. In the current setup, our combustion vessel is inside an insulated box with a heater installed. Utilizing this, we heated the vessel while circulating air throughout the system using the mixing pump. However, even with this increased temperature, we still had some minor condensation issues. Hydrogen Air Mixtures Before adding hydrogen to hydrocarbon fuels, it is important to know how hydrogen behaves in combustion with air by itself. Hopefully this data will help us to understand the differences between hexane and hydrogen + hexane combustion. Table 1 summarizes some of the data obtained on hydrogen flames, which were all conducted at initial pressures of 101 kPa.
13
Table 1
% H2 5 7 8 72 74 Ø 0.13 0.18 0.21 6.11 6.77 Ignition Temp (K) 910 840 808 1038 1087 Peak Pressure (kPa) * 111.4 125.8 384.1 361.2 Combustion Mode One puff A few puffs Puffing One flame One flame * - The pressure rise here was so small as to be indiscernible
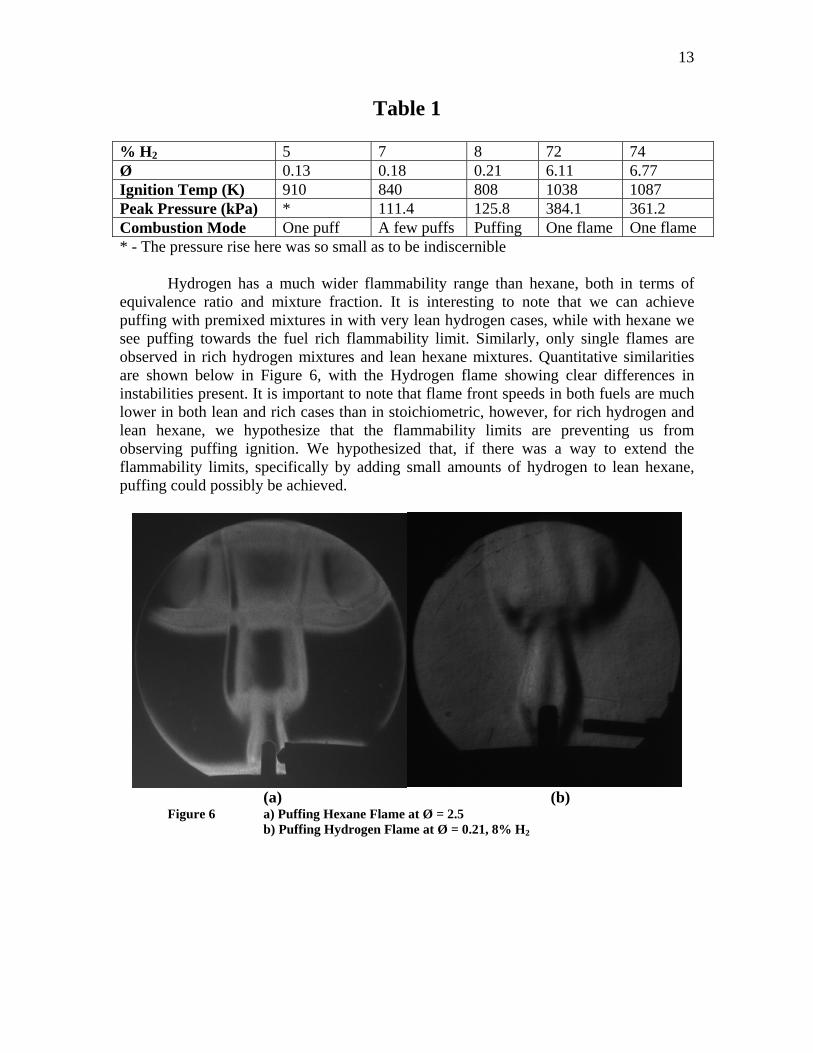
Hydrogen has a much wider flammability range than hexane, both in terms of equivalence ratio and mixture fraction. It is interesting to note that we can achieve puffing with premixed mixtures in with very lean hydrogen cases, while with hexane we see puffing towards the fuel rich flammability limit. Similarly, only single flames are observed in rich hydrogen mixtures and lean hexane mixtures. Quantitative similarities are shown below in Figure 6, with the Hydrogen flame showing clear differences in instabilities present. It is important to note that flame front speeds in both fuels are much lower in both lean and rich cases than in stoichiometric, however, for rich hydrogen and lean hexane, we hypothesize that the flammability limits are preventing us from observing puffing ignition. We hypothesized that, if there was a way to extend the flammability limits, specifically by adding small amounts of hydrogen to lean hexane, puffing could possibly be achieved.
(a) (b)
Figure 6 a) Puffing Hexane Flame at Ø = 2.5 b) Puffing Hydrogen Flame at Ø = 0.21, 8% H2
14
Variable Geometries Aspects of hot surface ignition, in particular ignition temperature, have been shown to be dependent on heat source geometry [9]. Several tests were conducted at Ø = 3.0 to determine how much of an effect the heat source had on ignition temperature and flame propagation in our experimental setup. A larger vessel size was also tested, to see if this had an effect as well. The results, from [17], are shown below highlight ignition temperature and puffing frequency. The data was collected for Ø = 3.0 at initial pressures of 101 kPa. Hot Surface Power[W] Area[m2] Vvessel[m
3] Tign[K] Freq[Hz] Bosch Glow plug ~100 8x10⁻⁵ 2x10⁻³ 920-975 12 + 1 Autolite Glow plug 96 1.5x10⁻⁴ 2x10⁻³ 775-825 12 + 1 22x10-3 1120 14 + 1 Nickel Foil 0.05 mm ~400 2.4x10⁻⁵ 2x10⁻³ 980 20 +8/-2 Chromel Wire d=.13mm ~10 2.4x10⁻⁶ 2x10⁻³ n/a 14 +3/-2
The chromel wire’s temperature was not measured. Due to its small size, the uncertainty and the effects of the thermocouple on the ignition would have been too large. We see that they all puff at relatively similar frequencies, within the uncertainties. There is a slight dependence on the area of the hot surface, as we would expect, but the effect is not extremely large. The spike in ignition temperature seen in the larger vessel may be interesting, but there were problems with electronics during this test. Very few tests were conducted in the larger vessel, and to examine this further we would need to conduct more experiments over a larger range of equivalence ratios. Hexane - Hydrogen Combustion The theorized benefits, such as faster flame speeds [11], of adding hydrogen to hydrocarbon mixtures occur in lean mixtures towards the lower flammability limit [2]. In order to determine the actual effects of hydrogen on the combustion, it is important to look at a larger range of data, in addition to mixtures around the lean flammability limit. To this end, tests were performed involving both hydrogen and hexane as fuels. These mixtures were done with a 5% volume fraction of hydrogen present. The “equivalence ratio” of this mixture was still calculated only paying attention to the hexane present. In order to still be at atmospheric pressures inside the vessel, the mixture was essentially 95% by volume hexane and air at the equivalence ration listed, and an additional 5% hydrogen on top of that. The first test was conducted at an equivalence ratio of 0.70. We compared this to a hexane-air mixture of equivalence ratio of 0.70. The mixture data are shown below for reference.
15
Mixture Without Hydrogen (Shot 37) Gas Volume % Partial Pressure [Torr] Total Pressure [Torr]Hexane 1.52% 11.6 11.6 O2 20.68% 157.2 168.7 N2 77.80% 591.3 760.0 Ø 0.70
Mixture With Hydrogen (Shot 97) Gas Volume % Partial Pressure [Torr] Total Pressure [Torr]Hexane 1.45% 11.0 11.0 H2 5.00% 38.0 49.0 N2 73.90% 561.7 610.7 O2 19.65% 149.3 760.0
This choice of how to define equivalence ratio is advantageous when considering the lowest equivalence ratios, especially around the lower flammability limit. However, when comparing these with hexane-air combustions, we must remember that there is less total oxygen and hexane in these mixtures, and that the hydrogen will play a larger roll in the combustion, especially as hexane decreases.
Comparing our two initial hexane-hydrogen experiments to corresponding hexane
experiments using the equivalence ratio first described, i.e. dependent only on the hexane/air ratio, we have the following table.
At Ø = 3.0
Shot # Mixture Tign(K) Puffing Frequency Vertical Raw Flame Speed* 60 Hexane/Air 775 12.7 Hz 68 in/s 98 Hexane/5%H2/Air 1001 13.8 Hz 48 in/s
At Ø = 0.7 Shot # Mixture Tign(K) Horizontal Speed* Vertical Speed* Peak Pressure 64 Hexane/Air 710 33 in/s 81 in/s 523 kPa 97 Hexane/5%H2/Air 999 62 in/s 152 in/s 649.8 kPa *- These speeds are measured directly from the video, as the speed the flame front travels.
16
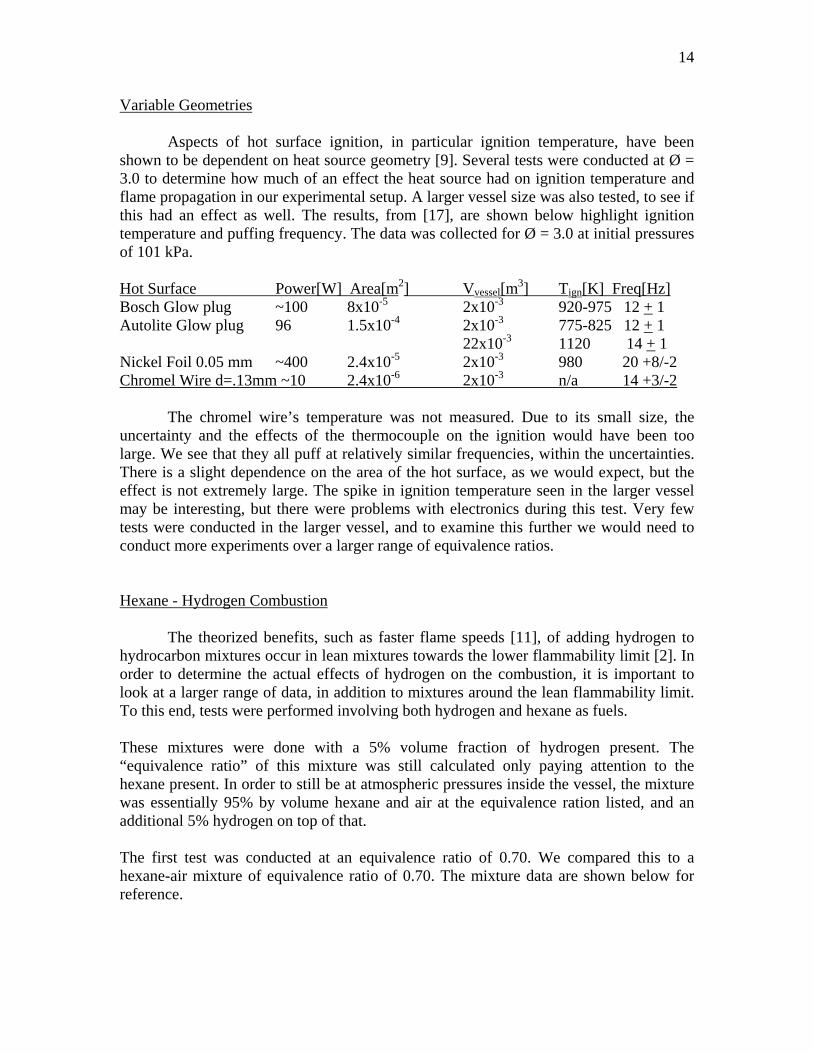
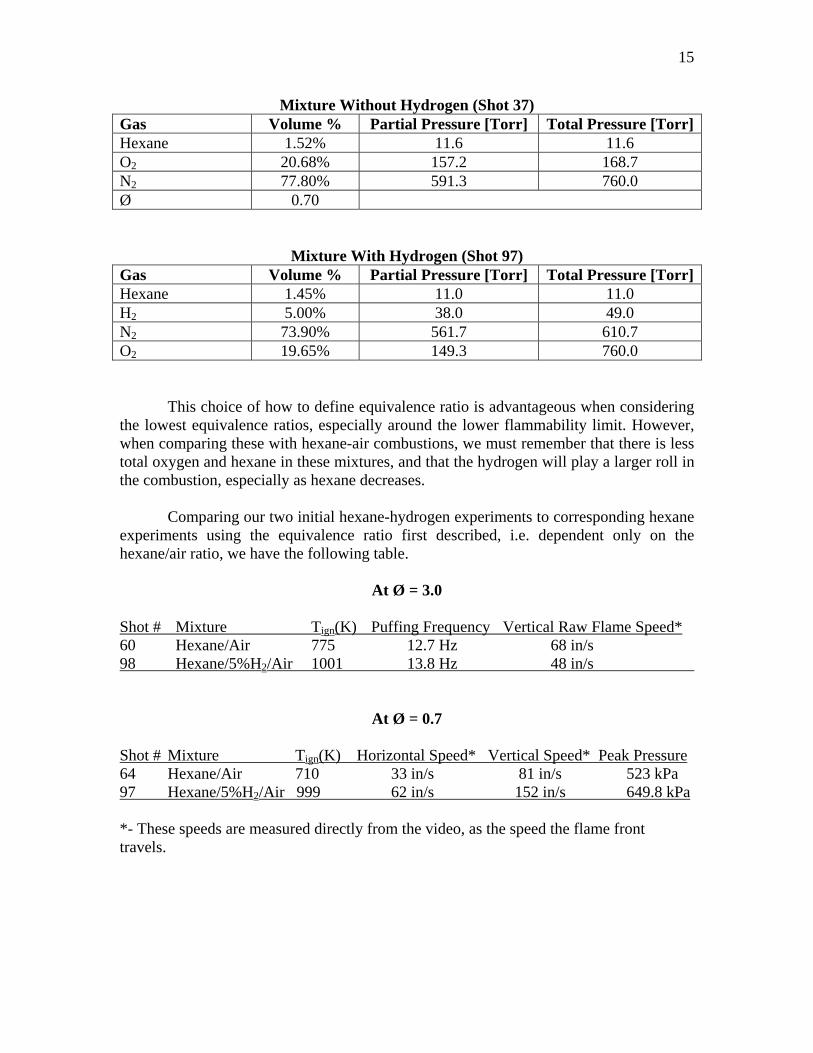
For qualitative comparison, Figure 7 and 8 below show images from the four cases described above.
(a) Hydrogen Hexane Air (b) Hexane Air
Figure 7: Ø = 0.7. Both images were taken at 0.010 ms after ignition
(a) Hydrogen Hexane Air (b) Hexane Air
Figure 8: Ø = 3.0, with images were taken at 0.073ms after ignition. We can see, especially with the Ø = 0.7 ignitions, there are significant differences in both cases. Both hydrogen mixtures ignited at temperatures higher by more than 200K than their hexane air counterparts. The flame speeds are also different, with the hydrogen
17
hexane having significantly higher speeds in the Ø = 0.7 case, yet slightly lower speeds in the Ø = 3.0 case.
These differences are most likely due to both the faster flame speeds of hydrogen and also the fact that, while the hexane/oxygen equivalence ratio is the same between the comparisons, the total mixture equivalence ratio has been altered. In the hydrogen hexane mixture is closer to stoichiometric in the lean case and farther from stoichiometric in the rich case. Around stoichiometric and slightly fuel rich (Ø = ~ 1.3) [15], the highest flame speeds occur. The peak pressures and puffing frequency also qualitatively agree with this explanation as well. However, there must be other factors at play. For instance, hydrogen has a much higher diffusivity than hexane or air, conducting more heat away from the glow plug and raising the glow plug temperature at which ignition occurs.
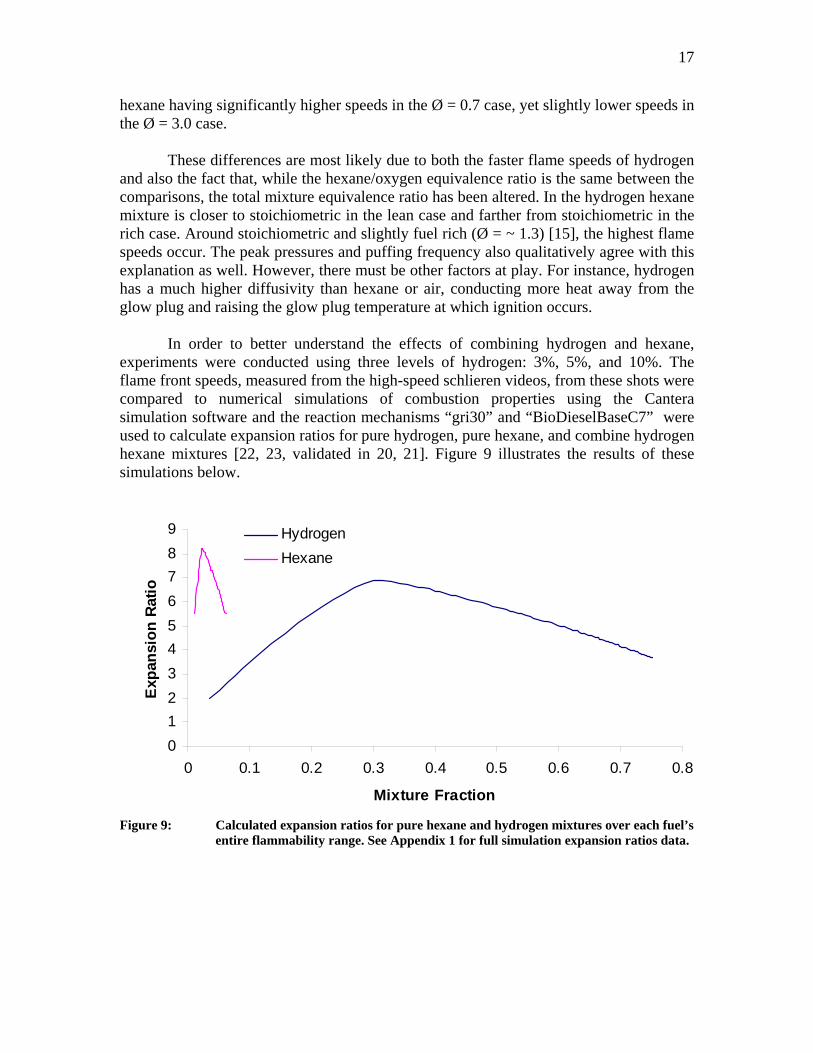
In order to better understand the effects of combining hydrogen and hexane,
experiments were conducted using three levels of hydrogen: 3%, 5%, and 10%. The flame front speeds, measured from the high-speed schlieren videos, from these shots were compared to numerical simulations of combustion properties using the Cantera simulation software and the reaction mechanisms “gri30” and “BioDieselBaseC7” were used to calculate expansion ratios for pure hydrogen, pure hexane, and combine hydrogen hexane mixtures [22, 23, validated in 20, 21]. Figure 9 illustrates the results of these simulations below.
0
1
2
3
4
5
6
7
8
9
0 0.1 0.2 0.3 0.4 0.5 0.6 0.7 0.8
Mixture Fraction
Exp
ansi
on
Rat
io
Hydrogen
Hexane
Figure 9: Calculated expansion ratios for pure hexane and hydrogen mixtures over each fuel’s
entire flammability range. See Appendix 1 for full simulation expansion ratios data.
18
6.000
6.500
7.000
7.500
8.000
8.500
9.000
0.01 0.012 0.014 0.016 0.018 0.02 0.022
Mixture Fraction Hexane
Exp
ansi
on
Rat
io0% H2
3% H2
5% H2
10% H2
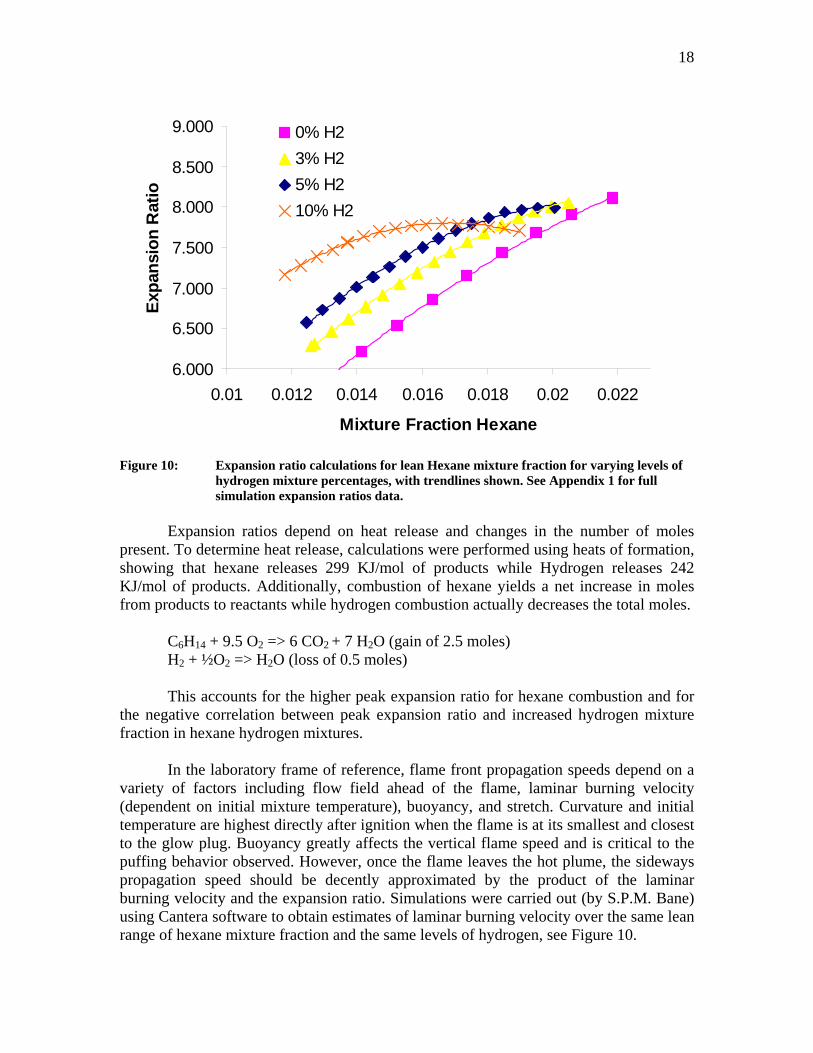
Figure 10: Expansion ratio calculations for lean Hexane mixture fraction for varying levels of hydrogen mixture percentages, with trendlines shown. See Appendix 1 for full simulation expansion ratios data.
Expansion ratios depend on heat release and changes in the number of moles
present. To determine heat release, calculations were performed using heats of formation, showing that hexane releases 299 KJ/mol of products while Hydrogen releases 242 KJ/mol of products. Additionally, combustion of hexane yields a net increase in moles from products to reactants while hydrogen combustion actually decreases the total moles.
C6H14 + 9.5 O2 => 6 CO2 + 7 H2O (gain of 2.5 moles) H2 + ½O2 => H2O (loss of 0.5 moles) This accounts for the higher peak expansion ratio for hexane combustion and for
the negative correlation between peak expansion ratio and increased hydrogen mixture fraction in hexane hydrogen mixtures.
In the laboratory frame of reference, flame front propagation speeds depend on a variety of factors including flow field ahead of the flame, laminar burning velocity (dependent on initial mixture temperature), buoyancy, and stretch. Curvature and initial temperature are highest directly after ignition when the flame is at its smallest and closest to the glow plug. Buoyancy greatly affects the vertical flame speed and is critical to the puffing behavior observed. However, once the flame leaves the hot plume, the sideways propagation speed should be decently approximated by the product of the laminar burning velocity and the expansion ratio. Simulations were carried out (by S.P.M. Bane) using Cantera software to obtain estimates of laminar burning velocity over the same lean range of hexane mixture fraction and the same levels of hydrogen, see Figure 10.
19
SL vs Hexane Mixture Fraction
0.0
0.1
0.2
0.3
0.4
0.5
0.6
0.7
0.010 0.012 0.014 0.016 0.018 0.020 0.022
Hexane mixture fraction
SL
0% H2
3% H2
5% H2
10% H2
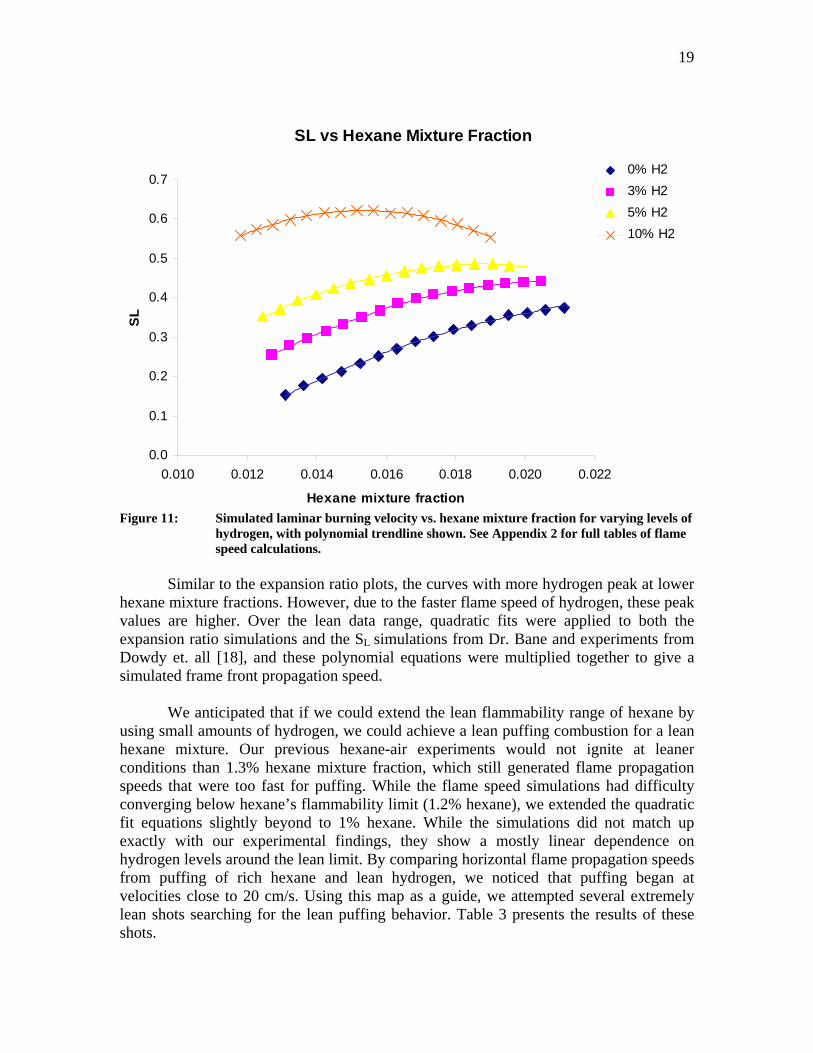
Figure 11: Simulated laminar burning velocity vs. hexane mixture fraction for varying levels of
hydrogen, with polynomial trendline shown. See Appendix 2 for full tables of flame speed calculations.
Similar to the expansion ratio plots, the curves with more hydrogen peak at lower hexane mixture fractions. However, due to the faster flame speed of hydrogen, these peak values are higher. Over the lean data range, quadratic fits were applied to both the expansion ratio simulations and the SL simulations from Dr. Bane and experiments from Dowdy et. all [18], and these polynomial equations were multiplied together to give a simulated frame front propagation speed. We anticipated that if we could extend the lean flammability range of hexane by using small amounts of hydrogen, we could achieve a lean puffing combustion for a lean hexane mixture. Our previous hexane-air experiments would not ignite at leaner conditions than 1.3% hexane mixture fraction, which still generated flame propagation speeds that were too fast for puffing. While the flame speed simulations had difficulty converging below hexane’s flammability limit (1.2% hexane), we extended the quadratic fit equations slightly beyond to 1% hexane. While the simulations did not match up exactly with our experimental findings, they show a mostly linear dependence on hydrogen levels around the lean limit. By comparing horizontal flame propagation speeds from puffing of rich hexane and lean hydrogen, we noticed that puffing began at velocities close to 20 cm/s. Using this map as a guide, we attempted several extremely lean shots searching for the lean puffing behavior. Table 3 presents the results of these shots.
20
Table 3
Shot # Percent Hexane
Percent Hydrogen
“Ø” of Hexane (hydrogen ignored)
Result
120 1.1% 1% 0.51 No Ignition
121 1.1% 2% 0.52 Single Flame
122 1.1% 1.5% 0.52 Single Flame, almost lifted
123 1.05% 1.5% 0.49 Puffing
When our first attempt, Shot 120, did not ignite, we increased the hydrogen
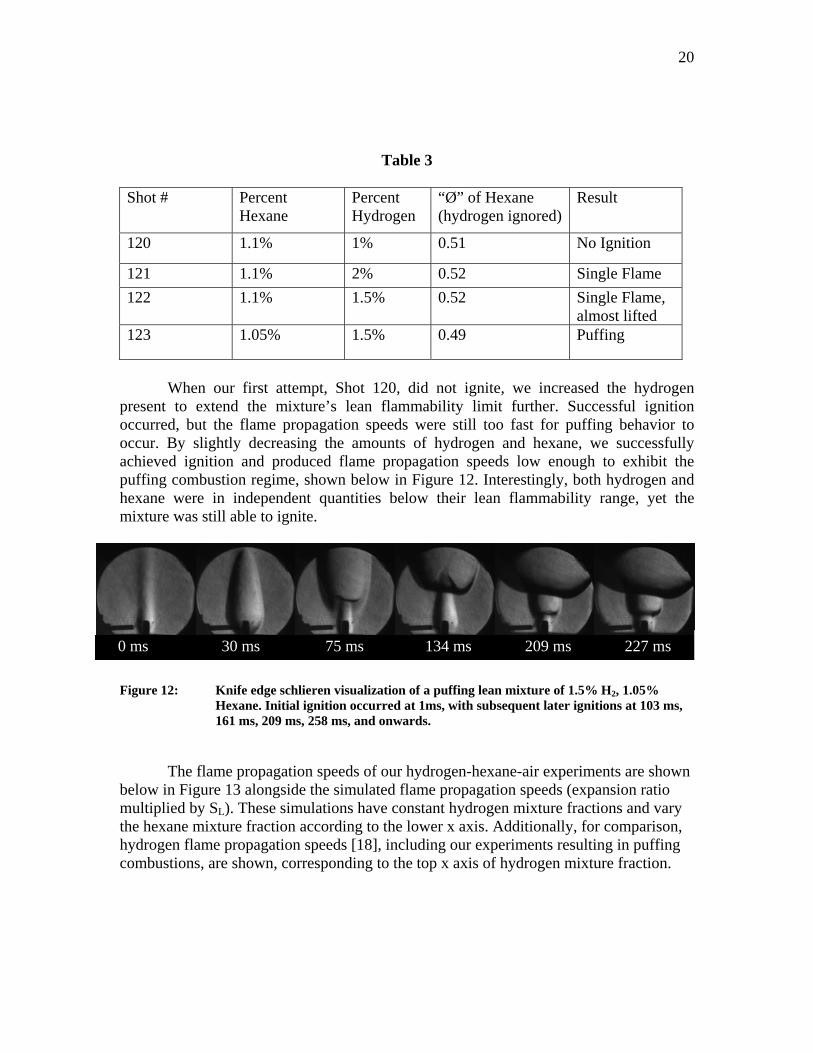
present to extend the mixture’s lean flammability limit further. Successful ignition occurred, but the flame propagation speeds were still too fast for puffing behavior to occur. By slightly decreasing the amounts of hydrogen and hexane, we successfully achieved ignition and produced flame propagation speeds low enough to exhibit the puffing combustion regime, shown below in Figure 12. Interestingly, both hydrogen and hexane were in independent quantities below their lean flammability range, yet the mixture was still able to ignite.
Figure 12: Knife edge schlieren visualization of a puffing lean mixture of 1.5% H2, 1.05%
Hexane. Initial ignition occurred at 1ms, with subsequent later ignitions at 103 ms, 161 ms, 209 ms, 258 ms, and onwards.
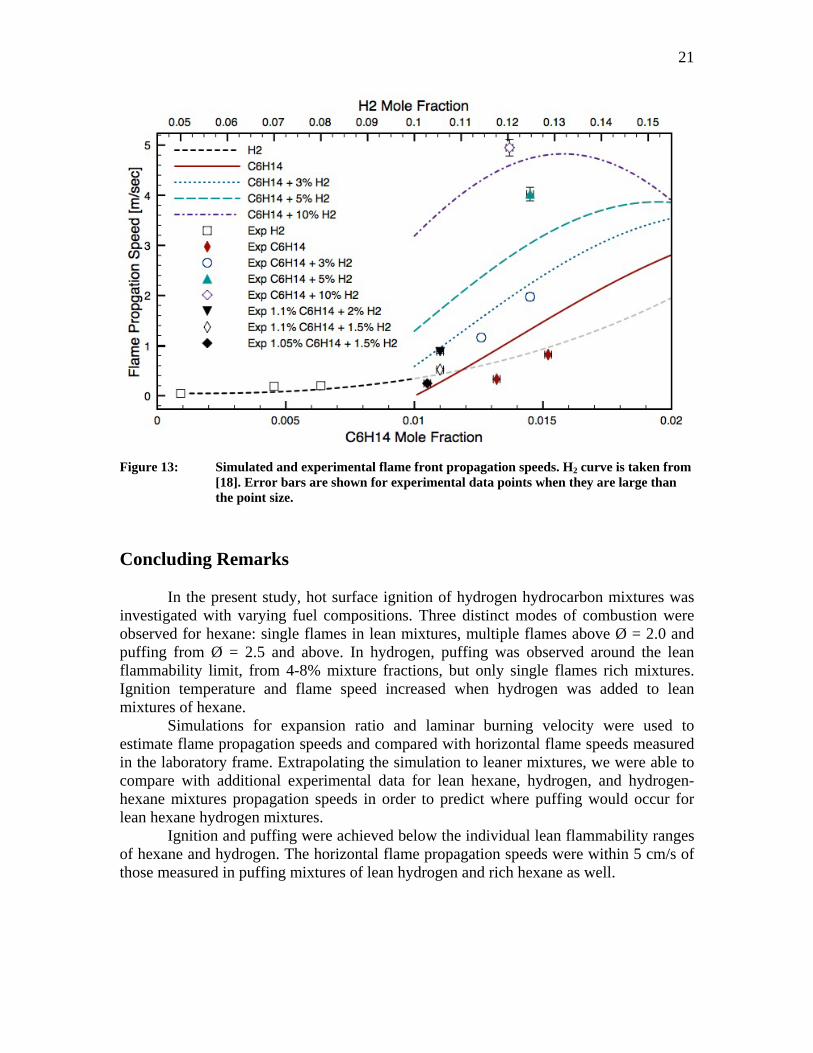
The flame propagation speeds of our hydrogen-hexane-air experiments are shown below in Figure 13 alongside the simulated flame propagation speeds (expansion ratio multiplied by SL). These simulations have constant hydrogen mixture fractions and vary the hexane mixture fraction according to the lower x axis. Additionally, for comparison, hydrogen flame propagation speeds [18], including our experiments resulting in puffing combustions, are shown, corresponding to the top x axis of hydrogen mixture fraction.
0 ms 30 ms 75 ms 134 ms 209 ms 227 ms
21
Figure 13: Simulated and experimental flame front propagation speeds. H2 curve is taken from
[18]. Error bars are shown for experimental data points when they are large than the point size.
Concluding Remarks In the present study, hot surface ignition of hydrogen hydrocarbon mixtures was investigated with varying fuel compositions. Three distinct modes of combustion were observed for hexane: single flames in lean mixtures, multiple flames above Ø = 2.0 and puffing from Ø = 2.5 and above. In hydrogen, puffing was observed around the lean flammability limit, from 4-8% mixture fractions, but only single flames rich mixtures. Ignition temperature and flame speed increased when hydrogen was added to lean mixtures of hexane. Simulations for expansion ratio and laminar burning velocity were used to estimate flame propagation speeds and compared with horizontal flame speeds measured in the laboratory frame. Extrapolating the simulation to leaner mixtures, we were able to compare with additional experimental data for lean hexane, hydrogen, and hydrogen-hexane mixtures propagation speeds in order to predict where puffing would occur for lean hexane hydrogen mixtures. Ignition and puffing were achieved below the individual lean flammability ranges of hexane and hydrogen. The horizontal flame propagation speeds were within 5 cm/s of those measured in puffing mixtures of lean hydrogen and rich hexane as well.
22
References
1. NASA Technical Note, May 1977 "Advanced Emissions and Fuel Economy Control Using Combined Injection of Gasoline and Hydrogen in SI-Engines"
2. Changwei Ji, Shuofeng Wang, Effect of hydrogen addition on combustion and
emissions performance of a spark ignition gasoline engine at lean conditions, International Journal of Hydrogen Energy, Volume 34, Issue 18, September 2009, Pages 7823-7834, ISSN 0360-3199, DOI: 10.1016/j.ijhydene.2009.06.082.
3. E. Porpatham, A. Ramesh, B. Nagalingam, Effect of hydrogen addition on the
performance of a biogas fuelled spark ignition engine, International Journal of Hydrogen Energy, Volume 32, Issue 12, August 2007, Pages 2057-2065, ISSN 0360-3199, DOI: 10.1016/j.ijhydene.2006.09.001.
4. G. A. Karim, I. Wierzba, Y. Al-Alousi, Methane-hydrogen mixtures as fuels,
International Journal of Hydrogen Energy, Volume 21, Issue 7, July 1996, Pages 625-631, ISSN 0360-3199, DOI: 10.1016/0360-3199(95)00134-4.
5. Experimental Study on Engine Performance and Emissions for an Engine Fueled
with Natural Gas−Hydrogen Mixtures, Zuohua Huang,, Bing Liu,, Ke Zeng,, Yinyu Huang,, Deming Jiang,, Xibin Wang, and, Haiyan Miao Energy & Fuels 2006 20 (5), 2131-2136
6. Combustion Characteristics and Heat Release Analysis of a Spark-Ignited Engine
Fueled with Natural Gas−Hydrogen Blends Zuohua Huang,, Bing Liu,, Ke Zeng,, Yinyu Huang,, Deming Jiang,, Xibin Wang, and, Haiyan Miao Energy & Fuels 2007 21 (5), 2594-2599
7. Gary S. Settles. Schlieren and Shadowgraph Techniques: Visualizing Phenomena
in Transparent Media. Spring-Verlag Berlin Heidelberg New York 2001. 8. Kuchta, J. M. (1985). Investigation of Fire and Explosion Accidents in the
Chemical, Mining, and Fuel-Related Industries - A Manual. Bulletin 680, U.S. Bureau of Mines.
9. Kuchta J, Bartkowiak A, Zabetakis M. Hot surface ignition temperatures of
hydrocarbon fuel vapor-air mixtures. Journal of Chemical Engineering Data 1965; 10 (3): 282-288.
10. J. M. Kuchta, A. Bartkowiak, M. G. Zabetakis, Hot Surface Ignition
Temperatures of Hydrocarbon Fuel Vapor-Air Mixtures. Journal of Chemical & Engineering Data 1965 10 (3), 282-288
11. G. Yu, C.K. Law, C.K. Wu, Laminar flame speeds of hydrocarbon + air mixtures
with hydrogen addition, Combustion and Flame, Volume 63, Issue 3, March 1986, Pages 339-347
23
12. Changwei Ji, Shuofeng Wang, Effect of hydrogen addition on combustion and
emissions performance of a spark ignition gasoline engine at lean conditions, International Journal of Hydrogen Energy, Volume 34, Issue 18, September 2009, Pages 7823-7834
13. P .A. Boettcher, B. L. Ventura, G. Blanquart, S. K. Menon, J. E. Shepherd,
Experimental Investigation of Hot Surface Ignition of Hydrocarbon-Air Mixtures, in 7th US National Technical Meeting of the Combustion Institute Georgia Institute of Technology, Atlanta, GA Mar 20 - 23, 2011.
14. Philipp A. Boettcher, Brian L. Ventura, Guillaume Blanquart, and Joseph E.
Shepherd. Hot Surface Ignition of Hydrocarbons in Air - A Comparison of Experimental and Computational Results. In Eighth International Symposium on Hazard, Prevention, and Mitigation of Industrial Explosions, 2010.
15. J. Li, L. Guo and T. Du, Formation and restraint of toxic emissions in hydrogen–
gasoline mixture fueled engines, International Journal of Hydrogen Energy 23 (1998), pp. 971–975.
16. P .A. Boettcher, B. L. Ventura, G. Blanquart, S. K. Menon, J. E. Shepherd,
Experimental Investigation of Hot Surface Ignition of Hydrocarbon-Air Mixtures, in 7th US National Technical Meeting of the Combustion Institute Georgia Institute of Technology, Atlanta, GA Mar 20 - 23, 2011.
17. David R. Dowdy, David B. Smith, Simon C. Taylor, Alan Williams, The use of
expanding spherical flames to determine burning velocities and stretch effects in hydrogen/air mixtures, Symposium (International) on Combustion, Volume 23, Issue 1, Twenty-Third Symposium (International) on Combustion, 1991, Pages 325-332, ISSN 0082-0784, DOI: 10.1016/S0082-0784(06)80275-4.
18. S.P.M. Bane, J.E. Shepherd, E. Kwon, A.C. Day, Statistical analysis of
electrostatic spark ignition of lean H2/O2/Ar mixtures, International Journal of Hydrogen Energy, Volume 36, Issue 3, The Third Annual International Conference on Hydrogen Safety, February 2011, Pages 2344-2350, ISSN 0360-3199, DOI: 10.1016/j.ijhydene.2010.05.082.
19. Glassman, Irvin. Combustion. San Diego, CA: Academic, 1996
20. T. Held, M. A.J., D. F.L., a semi-empirical reaction mechanism for n-heptane
oxidation and pyrolysis, Combustion Science and Technology 123 (1997) 107-146
21. P. Dagaut, M. Reuillon, M. Cathonnet, Experimental study of the oxidation of n-
heptane in a jet stirred reactor from low to high temperature and pressures up to 40 atm, Combustion and Flame 101 (1995) 132-140
24
22. H. Ramierez, K. Hadj-Ali, P Dieveart, G. Dayma, C. Togbe, G. Moreac, P. Dagaut, Oxidation of commercial and surrogate bio-diesel fuels (b30) in a jet-stirred reactor at elevated pressure: Experimental and modeling kinetic study, Proceedings of the Combustion Institute 33.
23. GRI 3.0 mechanism, Gregory P. Smith, David M. Golden, Michael Frenklach,
Nigel W. Moriarty, Boris Eiteneer, Mikhail Goldenberg, C. Thomas Bowman, Ronald K. Hanson, Soonho Song, William C. Gardiner, Jr., Vitali V. Lissianski, and Zhiwei Qin http://www.me.berkeley.edu/gri_mech/
25
Appendix 1: Expansion Ratio Simulation Data Hexane Oxygen Nitrogen Hydrogen Expansion Ratio 0.012017 0.20756 0.780424 5.5300.013095 0.207333 0.779572 5.875
0.01417 0.207107 0.778722 6.2110.015244 0.206882 0.777875 6.5360.016315 0.206657 0.777028 6.8500.017384 0.206432 0.776184 7.148
0.01845 0.206208 0.775342 7.4280.019514 0.205984 0.774501 7.6820.020576 0.205761 0.773663 7.9010.021847 0.205494 0.772658 8.1000.022693 0.205317 0.77199 8.1770.023748 0.205095 0.771157 8.2070.024801 0.204874 0.770326 8.1850.025851 0.204653 0.769496 8.1410.026899 0.204433 0.768668 8.0880.027945 0.204213 0.767842 8.0300.028989 0.203994 0.767017 7.970
0.03003 0.203775 0.766195 7.9080.031069 0.203557 0.765374 7.8450.032106 0.203339 0.764555 7.7810.033141 0.203122 0.763737 7.7160.034173 0.202905 0.762922 7.6510.035204 0.202688 0.762108 7.5840.036232 0.202472 0.761296 7.5170.037258 0.202257 0.760485 7.4480.038282 0.202042 0.759677 7.3790.039303 0.201827 0.75887 7.3090.040323 0.201613 0.758065 7.237
0.04134 0.201399 0.757261 7.1650.042355 0.201186 0.756459 7.0920.043368 0.200973 0.755659 7.0180.044379 0.200761 0.754861 6.9430.045387 0.200549 0.754064 6.8670.046394 0.200337 0.753269 6.7900.047398 0.200126 0.752475 6.7120.048401 0.199916 0.751684 6.6330.049401 0.199706 0.750893 6.5530.050399 0.199496 0.750105 6.4720.051395 0.199287 0.749318 6.3900.052389 0.199078 0.748533 6.3070.053381 0.19887 0.74775 6.2230.054371 0.198662 0.746968 6.1380.055358 0.198454 0.746188 6.0510.056344 0.198247 0.745409 5.9640.057327 0.19804 0.744632 5.8760.058309 0.197834 0.743857 5.788
26
Hexane Oxygen Nitrogen Hydrogen Expansion Ratio 0.059289 0.197628 0.743083 5.7020.060266 0.197423 0.742311 5.6220.061241 0.197218 0.74154 5.5510.062215 0.197014 0.740771 5.495 0.202429 0.761134 0.036437 1.960 0.19671 0.739628 0.063662 2.640 0.191304 0.719304 0.089391 3.240 0.186188 0.700068 0.113744 3.780 0.181339 0.681833 0.136828 4.270 0.176735 0.664524 0.15874 4.710 0.17236 0.648073 0.179568 5.110 0.168196 0.632416 0.199388 5.480 0.164228 0.617498 0.218274 5.810 0.160443 0.603267 0.236289 6.100 0.156829 0.589678 0.253493 6.360 0.153374 0.576687 0.269939 6.580 0.150068 0.564256 0.285675 6.760 0.146902 0.55235 0.300748 6.860 0.143866 0.540936 0.315197 6.870 0.140953 0.529985 0.329062 6.830 0.138156 0.519467 0.342376 6.780 0.135468 0.50936 0.355172 6.710 0.132882 0.499638 0.36748 6.640 0.130394 0.49028 0.379327 6.580 0.127996 0.481266 0.390738 6.510 0.125686 0.472578 0.401737 6.440 0.123457 0.464198 0.412346 6.380 0.121306 0.456109 0.422585 6.310 0.119228 0.448298 0.432473 6.250 0.117221 0.44075 0.442029 6.190 0.11528 0.433452 0.451268 6.120 0.113402 0.426392 0.460206 6.060 0.111584 0.419558 0.468858 6.000 0.109824 0.412939 0.477236 5.950 0.108119 0.406526 0.485355 5.890 0.106465 0.40031 0.493225 5.830 0.104862 0.39428 0.500858 5.780 0.103306 0.38843 0.508264 5.730 0.101795 0.38275 0.515454 5.670 0.100328 0.377235 0.522437 5.620 0.098903 0.371876 0.529221 5.570 0.097518 0.366667 0.535816 5.520 0.096171 0.361602 0.542228 5.470 0.09486 0.356675 0.548465 5.430 0.093585 0.35188 0.554535 5.380 0.092344 0.347213 0.560443 5.330 0.091135 0.342668 0.566197 5.290 0.089957 0.33824 0.571802 5.240 0.08881 0.333925 0.577265 5.200
27
Hexane Oxygen Nitrogen Hydrogen Expansion Ratio 0.087691 0.329719 0.582589 5.160 0.086601 0.325618 0.587781 5.120 0.085537 0.321617 0.592846 5.080 0.084498 0.317714 0.597788 5.040 0.083485 0.313904 0.602611 5.000 0.082496 0.310184 0.60732 4.960 0.08153 0.306552 0.611918 4.920 0.080586 0.303004 0.61641 4.880 0.079664 0.299537 0.6208 4.850 0.078763 0.296148 0.62509 4.810 0.077882 0.292835 0.629283 4.780 0.07702 0.289595 0.633385 4.740 0.076177 0.286427 0.637396 4.710 0.075353 0.283326 0.641321 4.670 0.074546 0.280293 0.645161 4.640 0.073756 0.277323 0.64892 4.610 0.072983 0.274416 0.652601 4.580 0.072226 0.271569 0.656205 4.550 0.071484 0.268781 0.659735 4.520 0.070758 0.266049 0.663193 4.490 0.070046 0.263372 0.666582 4.460 0.069348 0.260749 0.669903 4.430 0.068664 0.258177 0.673159 4.400 0.067994 0.255656 0.676351 4.370 0.067336 0.253183 0.679481 4.340 0.066691 0.250758 0.682551 4.310 0.066058 0.248379 0.685563 4.290 0.065437 0.246044 0.688519 4.260 0.064828 0.243753 0.691419 4.230 0.06423 0.241504 0.694266 4.210 0.063643 0.239296 0.697061 4.180 0.063066 0.237129 0.699805 4.160 0.0625 0.235 0.7025 4.130 0.061944 0.232909 0.705147 4.110 0.061398 0.230855 0.707747 4.090 0.060861 0.228837 0.710302 4.060 0.060333 0.226854 0.712813 4.040 0.059815 0.224905 0.71528 4.020 0.059306 0.222989 0.717705 3.990 0.058805 0.221106 0.72009 3.970 0.058312 0.219254 0.722434 3.950 0.057828 0.217432 0.72474 3.930 0.057351 0.215641 0.727007 3.910 0.056883 0.213879 0.729238 3.890 0.056422 0.212146 0.731432 3.860 0.055968 0.210441 0.733591 3.840 0.055522 0.208762 0.735716 3.820 0.055083 0.207111 0.737807 3.800 0.05465 0.205485 0.739865 3.780
28
Hexane Oxygen Nitrogen Hydrogen Expansion Ratio 0.054225 0.203884 0.741891 3.770 0.053806 0.202309 0.743886 3.750 0.053393 0.200757 0.74585 3.730 0.052987 0.199229 0.747784 3.710 0.052586 0.197724 0.749689 3.690 0.052192 0.196242 0.751566 3.670
0.0145 0.1964 0.7391 0.05 7.1420.0126 0.2062 0.7511 0.0301 6.2750.0147 0.2006 0.7534 0.0313 6.9080.0137 0.1863 0.6999 0.1001 7.563
0.012702 0.201113 0.756185 0.03 6.3050.013224 0.201003 0.755773 0.03 6.4610.013745 0.200894 0.755361 0.03 6.6150.014266 0.200784 0.754949 0.03 6.7650.014787 0.200675 0.754538 0.03 6.9110.015306 0.200566 0.754128 0.03 7.0530.015826 0.200457 0.753718 0.03 7.1910.016344 0.200348 0.753308 0.03 7.3230.016862 0.200239 0.752899 0.03 7.450
0.01738 0.20013 0.75249 0.03 7.5690.017897 0.200022 0.752082 0.03 7.6800.018413 0.199913 0.751674 0.03 7.7810.018929 0.199805 0.751266 0.03 7.8710.019444 0.199697 0.750859 0.03 7.9480.019959 0.199588 0.750453 0.03 8.0080.020473 0.19948 0.750047 0.03 8.050
0.01244 0.196966 0.740594 0.05 6.5760.012951 0.196859 0.74019 0.05 6.7220.013462 0.196752 0.739786 0.05 6.8650.013972 0.196645 0.739383 0.05 7.0040.014482 0.196537 0.738981 0.05 7.1380.014991 0.196431 0.738579 0.05 7.2660.015499 0.196324 0.738177 0.05 7.3890.016007 0.196217 0.737776 0.05 7.5050.016515 0.19611 0.737375 0.05 7.6130.017021 0.196004 0.736975 0.05 7.7110.017528 0.195898 0.736575 0.05 7.7980.018033 0.195791 0.736175 0.05 7.8710.018539 0.195685 0.735776 0.05 7.9290.019043 0.195579 0.735378 0.05 7.9680.019547 0.195473 0.734979 0.05 7.9900.020051 0.195367 0.734582 0.05 7.9970.011785 0.1866 0.701615 0.1 7.166
0.01227 0.186498 0.701232 0.1 7.2780.012753 0.186396 0.70085 0.1 7.3820.013237 0.186295 0.700468 0.1 7.478
0.01372 0.186193 0.700087 0.1 7.5650.014202 0.186092 0.699706 0.1 7.6390.014683 0.185991 0.699326 0.1 7.700
29
Hexane Oxygen Nitrogen Hydrogen Expansion Ratio 0.015165 0.18589 0.698946 0.1 7.7450.015645 0.185789 0.698566 0.1 7.7730.016126 0.185688 0.698187 0.1 7.7860.016605 0.185587 0.697808 0.1 7.7880.017084 0.185486 0.697429 0.1 7.7820.017563 0.185386 0.697051 0.1 7.7700.018041 0.185286 0.696674 0.1 7.7540.018519 0.185185 0.696296 0.1 7.7350.018996 0.185085 0.695919 0.1 7.715
30
Appendix II: Laminar Burning Velocity Simulation Data
Hexane Oxygen Nitrogen Hydrogen sL (ms) 0.01309 0.2073 0.7796 0 0.153 0.01363 0.2072 0.7791 0 0.177 0.01417 0.2071 0.7787 0 0.194 0.01471 0.2070 0.7783 0 0.214 0.01524 0.2069 0.7779 0 0.234 0.01578 0.2068 0.7775 0 0.252 0.01631 0.2067 0.7770 0 0.269 0.01685 0.2065 0.7766 0 0.288 0.01738 0.2064 0.7762 0 0.303 0.01792 0.2063 0.7758 0 0.320 0.01845 0.2062 0.7753 0 0.332 0.01898 0.2061 0.7749 0 0.344 0.01951 0.2060 0.7745 0 0.356 0.02005 0.2059 0.7741 0 0.363 0.02058 0.2058 0.7737 0 0.370 0.02111 0.2056 0.7732 0 0.376 0.0127 0.2011 0.7562 0.03 0.254 0.0132 0.2010 0.7558 0.03 0.278 0.01375 0.2009 0.7554 0.03 0.297 0.01427 0.2008 0.7549 0.03 0.316 0.01479 0.2007 0.7545 0.03 0.333 0.01531 0.2006 0.7541 0.03 0.352 0.01583 0.2005 0.7537 0.03 0.367 0.01634 0.2003 0.7533 0.03 0.384 0.01686 0.2002 0.7529 0.03 0.397 0.01738 0.2001 0.7525 0.03 0.408 0.01790 0.2000 0.7521 0.03 0.417 0.01841 0.1999 0.7517 0.03 0.424 0.01893 0.1998 0.7513 0.03 0.432 0.01944 0.1997 0.7509 0.03 0.437 0.01996 0.1996 0.7505 0.03 0.441 0.02047 0.1995 0.7500 0.03 0.442 0.0124 0.1970 0.7406 0.05 0.334 0.01295 0.1969 0.7402 0.05 0.354 0.01346 0.1968 0.7398 0.05 0.371 0.01397 0.1966 0.7394 0.05 0.392 0.01448 0.1965 0.7390 0.05 0.408 0.01499 0.1964 0.7386 0.05 0.424 0.01550 0.1963 0.7382 0.05 0.438 0.01601 0.1962 0.7378 0.05 0.448 0.01651 0.1961 0.7374 0.05 0.459 0.01702 0.1960 0.7370 0.05 0.469 0.01753 0.1959 0.7366 0.05 0.476 0.01803 0.1958 0.7362 0.05 0.481 0.01854 0.1957 0.7358 0.05 0.484 0.01904 0.1956 0.7354 0.05 0.485
31
Hexane Oxygen Nitrogen Hydrogen sL (ms) 0.01955 0.1955 0.7350 0.05 0.485 0.02005 0.1954 0.7346 0.05 0.482 0.0118 0.1866 0.7016 0.1 0.560 0.01227 0.1865 0.7012 0.1 0.575 0.01275 0.1864 0.7009 0.1 0.586 0.01324 0.1863 0.7005 0.1 0.598 0.01372 0.1862 0.7001 0.1 0.609 0.01420 0.1861 0.6997 0.1 0.616 0.01468 0.1860 0.6993 0.1 0.618 0.01516 0.1859 0.6989 0.1 0.622 0.01565 0.1858 0.6986 0.1 0.623 0.01613 0.1857 0.6982 0.1 0.614 0.01661 0.1856 0.6978 0.1 0.617 0.01708 0.1855 0.6974 0.1 0.610 0.01756 0.1854 0.6971 0.1 0.595 0.01804 0.1853 0.6967 0.1 0.589 0.01852 0.1852 0.6963 0.1 0.572 0.01900 0.1851 0.6959 0.1 0.555 0.00000 0.1866 0.7015 0.1119 0.07 0.00000 0.1799 0.6763 0.1439 0.18 0.00000 0.1736 0.6528 0.1736 0.34 0.00000 0.1678 0.6309 0.2013 0.65 0.00000 0.1623 0.6104 0.2273 0.97 0.00000 0.1572 0.5912 0.2516 1.39 0.00000 0.1524 0.5732 0.2744 1.77 0.00000 0.1479 0.5562 0.2959 2.14 0.00000 0.1437 0.5402 0.3161 2.43 0.00000 0.1397 0.5251 0.3352 2.65 0.00000 0.1359 0.5109 0.3533 2.83 0.00000 0.1323 0.4974 0.3704 2.90 0.00000 0.1289 0.4845 0.3866 2.83 0.00000 0.1256 0.4724 0.4020 2.70 0.00000 0.1225 0.4608 0.4167 2.56 0.00000 0.1196 0.4498 0.4306 2.36 0.00000 0.1168 0.4393 0.4439 2.14 0.00000 0.1142 0.4292 0.4566 1.90 0.00000 0.1116 0.4196 0.4688 1.63 0.00000 0.1092 0.4105 0.4803 1.37 0.00000 0.1068 0.4017 0.4915 1.10