Embed Size (px)
Citation preview
Int. J. Rock Mech. Min. Sci. & Geomech. Abstr. Vol. 30, No. 3, pp. 189-202, 1993 0148-9062/93 $6.00 + 0.00 Printed in Great Britain. All rights reserved Copyright © 1993 Pergamon Press Ltd
An Experimental Investigation into Hydraulic Fracture Propagation Part 2. Single Well Tests F. GUO'[" N. R. MORGENSTERNt J. D. SCOTT?
This paper presents the experimental results of single well hydraulic fracture tests. The tests were conducted in dry gypstone blocks of 305 x 305 x 305ram. True triaxial stresses were applied to the specimens. Leak-off was incorpor- ated. The deformation of the specimens during injection was monitored to provide further data to characterize the fracture. The fracture and the oil penetration area were observed after testing. The influences of the least principal stress and the injection rate on fracture propagation were studied. The experiments produced considerable data on build-up of bottomhole pressure before breakdown, breakdown pressure under various states of stress and injection rates, behavior of fracture propagation post breakdown, and leak-off behavior. The monitoring of fracture propagation post breakdown and obser- vation of leak-off provided data for a leak-off dominated material for use in numerical models.
INTRODUCTION
Since the development of hydraulic fracturing to en- hance the production of oil or gas from a well, many fracture propagation models [1-4] have been put for- ward. They have advanced rapidly from simple 2-D theoretical models in the early 1960s, such as the PKN and DdK models, to complex 3-D numerical models. More than 2000 publications have been devoted to various aspects of hydraulic fracturing. However, practi- cal methods of evaluating the theoretical and numerical models have been few. Mostly, they have been limited to indirect and generally inconclusive field evaluations. Only three significant laboratory research programs have been carried out (Medlin et al. [5, 6], Rubin [7] and Johnson and Cleary [8]). Evidently experimental confir- mation of models has not been paid the attention that it deserves.
Many factors affect fracture propagation and fracture geometry, such as the state of stress, injection rate, frac- ture fluid, Young's Modulus, fracture toughness of rocks or tensile strength, initial pore pressure, leak-off coeffi- cient and relative bed thickness of formations, specimen size, and the like. It is impossible to cover all the factors in one program. The set of experiments reported here mainly concentrated on the influence of the least princi- pal stress and injection rate on fracture propagation.
tDepartment of Civil Engineering, University of Alberta, 220 Civil Engineering Building, Edmonton, Alberta, Canada T6G 2G7.
In Part 1 [9], the experimental facilities were described in detail. One typical experimental result was shown to illustrate data presentation, and the effect of specimen size on breakdown pressure was examined through comparison of hydraulic fracture tests under different specimen size. No size effects were encountered. This part presents the experimental results from the program. First, all hydraulic fracture tests are summarized. Sub- sequently, effects of the least principal stress and injec- tion rate on fracture propagation are discussed. Finally, several interesting observations are noted.
SUMMARY OF HYDRAULIC FRACTURE TESTS
Twenty-two hydraulic fracture tests have been con- ducted. Twenty of them were run on 305 x 305 x 305mm (12 x 12 x 12in.) block specimens, and the other two were run on 610 x 584 x 305 mm (24 x 23 x 12 in.) block specimens. Three preliminary Tests 0, 1 and 2 were conducted first. Through them, the experimental equipment was examined, and fracture fluid and injec- tion tubing were chosen. Hydraulic oil with 30 mPa. sec viscosity at room temperature was first used as fracture fluid in Test 0. However, the experimental results showed that oil viscosity was not high enough, and all the fracture fluid leaked off into the rock. A fracture could not be created. Although the hydraulic fracture test failed, it was possible to estimate the hydraulic conduc- tivity of gypstone according to Hvorslev's theory [10].
189
190 GUO et al.: HYDRAULIC FRACTURE PROPAGATION: EXPERIMENTS
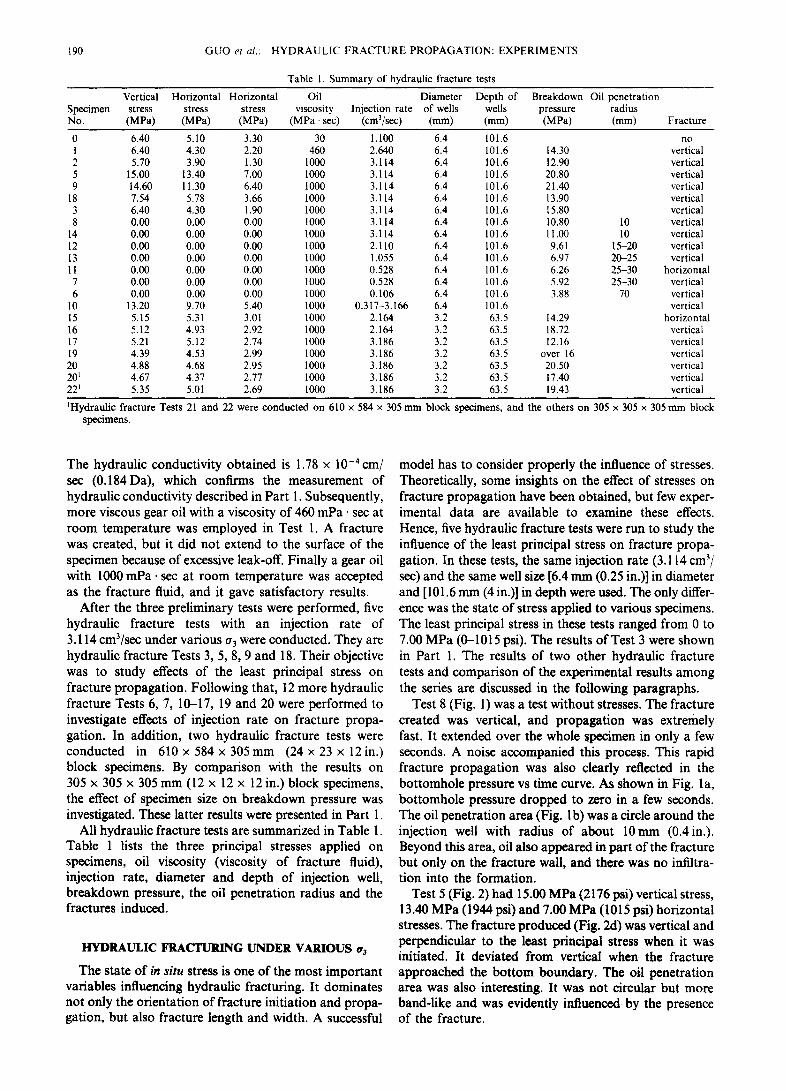
Table I. Summary of hydraulic fracture tests
Vertical Horizontal Horizontal Oil Diameter Depth of Breakdown Oil penetration Specimen stress stress stress viscosity Injection rate of wells wells pressure radius No. (MPa) (MPa) (MPa) (MPa, sec) (cm3/sec) (mm) (mm) (MPa) (mm) Fracture
0 6.40 5.10 3.30 30 1.100 6.4 101.6 no 1 6.40 4.30 2.20 460 2.640 6.4 101.6 14.30 vertical 2 5.70 3.90 1.30 1000 3.114 6.4 101.6 12.90 vertical 5 15.00 13.40 7.00 I000 3.114 6.4 101.6 20.80 vertical 9 14.60 11.30 6.40 1000 3.114 6.4 101.6 21.40 vertical
18 7.54 5.78 3.66 1000 3.114 6.4 101.6 13.90 vertical 3 6.40 4.30 1.90 1000 3.114 6.4 101.6 ! 5.80 vertical 8 0.00 0.00 0.00 1000 3.114 6.4 101.6 10.80 10 vertical
14 0.00 0,00 0.00 1000 3.114 6.4 101.6 11.00 10 vertical 12 0.00 0.00 0.00 1000 2.110 6.4 101.6 9.61 15-20 vertical 13 0.00 0.00 0.00 1000 1.055 6.4 101.6 6.97 20-25 vertical 11 0.00 0.00 0.00 1000 0.528 6.4 101,6 6.26 25-30 horizontal 7 0.00 0.00 0.00 I000 0.528 6.4 101.6 5.92 25-30 vertical 6 0.00 0.00 0.00 1000 0.106 6.4 I01.6 3.88 70 vertical
10 13.20 9.70 5.40 1 0 0 0 0.317-3.166 6.4 101.6 vertical 15 5.15 5.31 3.0l 1000 2.164 3.2 63.5 14.29 horizontal 16 5.12 4.93 2.92 1000 2.164 3.2 63.5 18.72 vertical 17 5.21 5.12 2.74 1000 3.186 3.2 63.5 12.16 vertical 19 4.39 4.53 2.99 1000 3.186 3.2 63.5 over 16 vertical 20 4.88 4,68 2.95 1000 3,186 3.2 63.5 20.50 vertical 201 4.67 4.37 2.77 1000 3.186 3.2 63.5 17.40 vertical 221 5.35 5.01 2,69 1000 3.186 3.2 63.5 19.43 vertical
tHydraulic fracture Tests 21 and 22 were conducted on 610 × 584 x 305mm block specimens, and the others on 305 x 305 x 305mm block specimens.
The hydraulic conductivity obtained is 1.78 x 10 -4 cm/ sec (0.184 Da), which confirms the measurement of hydraulic conductivity described in Part 1. Subsequently, more viscous gear oil with a viscosity of 460 mPa" sec at room temperature was employed in Test 1. A fracture was created, but it did not extend to the surface of the specimen because of excessive leak-off. Finally a gear oil with 1000 mPa. sec at room temperature was accepted as the fracture fluid, and it gave satisfactory results.
After the three preliminary tests were performed, five hydraulic fracture tests with an injection rate of 3.114 cm3/sec under various a3 were conducted. They are hydraulic fracture Tests 3, 5, 8, 9 and 18. Their objective was to study effects of the least principal stress on fracture propagation. Following that, 12 more hydraulic fracture Tests 6, 7, 10-17, 19 and 20 were performed to investigate effects of injection rate on fracture propa- gation. In addition, two hydraulic fracture tests were conducted in 6 1 0 x 5 8 4 x 3 0 5 m m ( 2 4 x 2 3 x 12 in.) block specimens. By comparison with the results on 305 x 305 x 305 mm (12 x 12 x 12 in.) block specimens, the effect of specimen size on breakdown pressure was investigated. These latter results were presented in Part 1.
All hydraulic fracture tests are summarized in Table 1. Table 1 lists the three principal stresses applied on specimens, oil viscosity (viscosity of fracture fluid), injection rate, diameter and depth of injection well, breakdown pressure, the oil penetration radius and the fractures induced.
HYDRAULIC FRACTURING UNDER VARIOUS o3
The state of in situ stress is one of the most important variables influencing hydraulic fracturing. It dominates not only the orientation of fracture initiation and propa- gation, but also fracture length and width. A successful
model has to consider properly the influence of stresses. Theoretically, some insights on the effect of stresses on fracture propagation have been obtained, but few exper- imental data are available to examine these effects. Hence, five hydraulic fracture tests were run to study the influence of the least principal stress on fracture propa- gation. In these tests, the same injection rate (3.114 cm3/ sec) and the same well size [6.4 mm (0.25 in.)] in diameter and [101.6 mm (4 in.)] in depth were used. The only differ- ence was the state of stress applied to various specimens. The least principal stress in these tests ranged from 0 to 7.00 MPa (0-1015 psi). The results of Test 3 were shown in Part 1. The results of two other hydraulic fracture tests and comparison of the experimental results among the series are discussed in the following paragraphs.
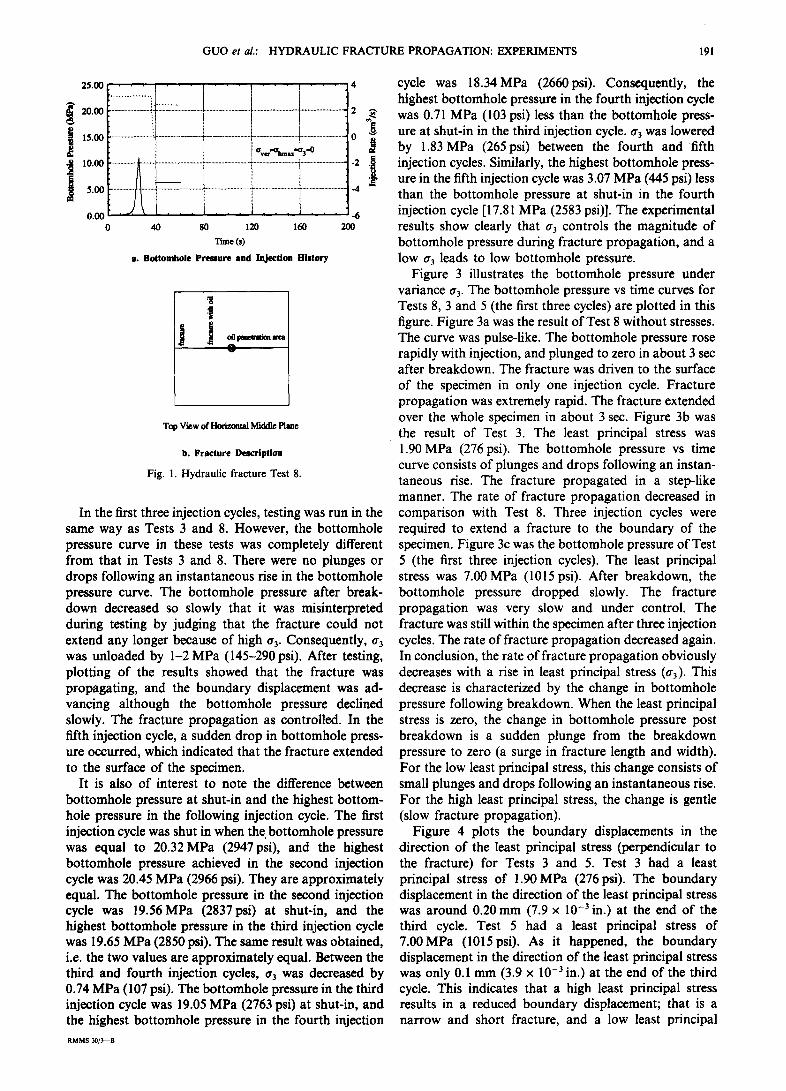
Test 8 (Fig. 1) was a test without stresses. The fracture created was vertical, and propagation was extremely fast. It extended over the whole specimen in only a few seconds, A noise accompanied this process. This rapid fracture propagation was also clearly reflected in the bottomhole pressure vs time curve. As shown in Fig. la, bottomhole pressure dropped to zero in a few seconds. The oil penetration area (Fig. lb) was a circle around the injection well with radius of about 10ram (0.4in.). Beyond this area, oil also appeared in part of the fracture but only on the fracture wall, and there was no infiltra- tion into the formation.
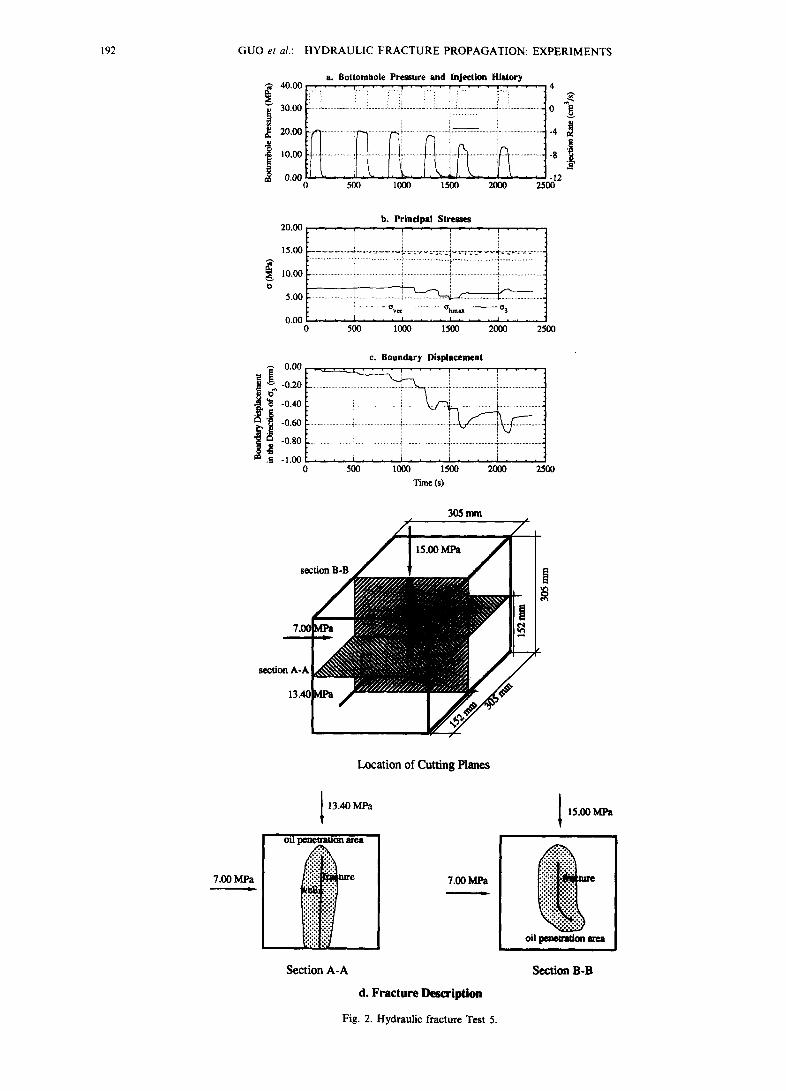
Test 5 (Fig. 2) had 15.00 MPa (2176 psi) vertical stress, 13.40 MPa (1944 psi) and 7.00 MPa (1015 psi) horizontal stresses. The fracture produced (Fig. 2d) was vertical and perpendicular to the least principal stress when it was initiated. It deviated from vertical when the fracture approached the bottom boundary. The oil penetration area was also interesting. It was not circular but more band-like and was evidently influenced by the presence of the fracture.
GUO et at,.: HYDRAULIC FR AC TUR E PROPAGATION: EXPERIMENTS 191
............... , i ............................... i .............................. . . . . . . . . . . . . . . . . . . . . . . . . . .
00or i i 0
2 ~
-4
40 80 120 160
Time (s)
a. Bottomhole Pressure and Injection History
-6 200
.S
j j
Top View of Horizontal Middle Plane
b. Fracture Description
Fig. 1. Hydraulic fracture Test 8.
In the first three injection cycles, testing was run in the same way as Tests 3 and 8. However, the bottomhole pressure curve in these tests was completely different from that in Tests 3 and 8. There were no plunges or drops following an instantaneous rise in the bottomhole pressure curve. The bottomhole pressure after break- down decreased so slowly that it was misinterpreted during testing by judging that the fracture could not extend any longer because of high a3. Consequently, 0" 3 was unloaded by 1-2 MPa (145-290 psi). After testing, plotting of the results showed that the fracture was propagating, and the boundary displacement was ad- vancing although the bottomhole pressure declined slowly. The fracture propagation as controlled. In the fifth injection cycle, a sudden drop in bottomhole press- ure occurred, which indicated that the fracture extended to the surface of the specimen.
It is also of interest to note the difference between bottomhole pressure at shut-in and the highest bottom- hole pressure in the following injection cycle. The first injection cycle was shut in when the bottomhole pressure was equal to 20.32 MPa (2947psi), and the highest bottomhole pressure achieved in the second injection cycle was 20.45 MPa (2966 psi). They are approximately equal. The bottomhole pressure in the second injection cycle was 19.56MPa (2837psi) at shut-in, and the highest bottomhole pressure in the third injection cycle was 19.65 MPa (2850 psi). The same result was obtained, i.e. the two values are approximately equal. Between the third and fourth injection cycles, a3 was decreased by 0.74 MPa (107 psi). The bottomhole pressure in the third injection cycle was 19.05 MPa (2763 psi) at shut-in, and the highest bottomhole pressure in the fourth injection RMMS 30/~-B
cycle was 18.34MPa (2660psi). Consequently, the highest bottomhole pressure in the fourth injection cycle was 0.71 MPa (103 psi) less than the bottomhole press- ure at shut-in in the third injection cycle. ¢r 3 was lowered by 1.83 MPa (265psi) between the fourth and fifth injection cycles. Similarly, the highest bottomhole press- ure in the fifth injection cycle was 3.07 MPa (445 psi) less than the bottomhole pressure at shut-in in the fourth injection cycle [17.81 MPa (2583 psi)]. The experimental results show clearly that a3 controls the magnitude of bottomhole pressure during fracture propagation, and a low a3 leads to low bottomhole pressure.
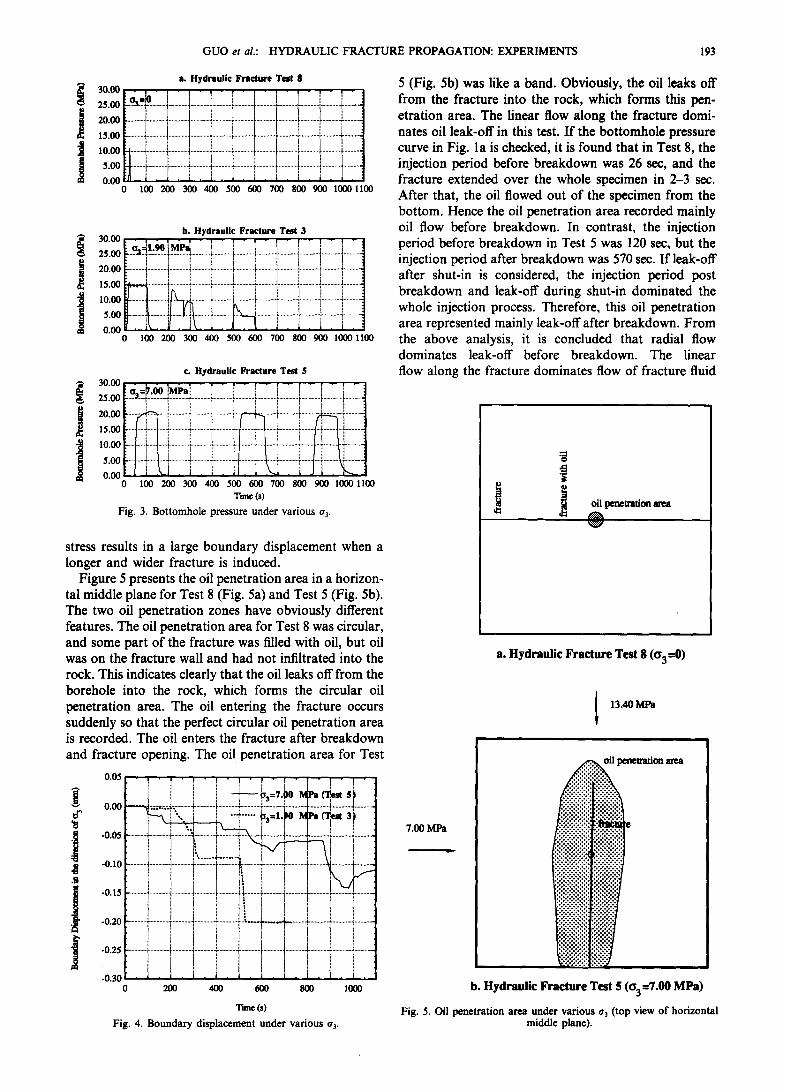
Figure 3 illustrates the bottomhole pressure under variance a3. The bottomhole pressure vs time curves for Tests 8, 3 and 5 (the first three cycles) are plotted in this figure. Figure 3a was the result of Test 8 without stresses. The curve was pulse-like. The bottomhole pressure rose rapidly with injection, and plunged to zero in about 3 sec after breakdown. The fracture was driven to the surface of the specimen in only one injection cycle. Fracture propagation was extremely rapid. The fracture extended over the whole specimen in about 3 sec. Figure 3b was the result of Test 3. The least principal stress was 1.90 MPa (276 psi). The bottomhole pressure vs time curve consists of plunges and drops following an instan- taneous rise. The fracture propagated in a step-like manner. The rate of fracture propagation decreased in comparison with Test 8. Three injection cycles were required to extend a fracture to the boundary of the specimen. Figure 3c was the bottomhole pressure of Test 5 (the first three injection cycles). The least principal stress was 7.00MPa (1015 psi). After breakdown, the bottomhole pressure dropped slowly. The fracture propagation was very slow and under control. The fracture was still within the specimen after three injection cycles. The rate of fracture propagation decreased again. In conclusion, the rate of fracture propagation obviously decreases with a rise in least principal stress (a3). This decrease is characterized by the change in bottomhole pressure following breakdown. When the least principal stress is zero, the change in bottomhole pressure post breakdown is a sudden plunge from the breakdown pressure to zero (a surge in fracture length and width). For the low least principal stress, this change consists of small plunges and drops following an instantaneous rise. For the high least principal stress, the change is gentle (slow fracture propagation).
Figure 4 plots the boundary displacements in the direction of the least principal stress (perpendicular to the fracture) for Tests 3 and 5. Test 3 had a least principal stress of 1.90 MPa (276psi). The boundary displacement in the direction of the least principal stress was around 0.20 mm (7.9 x 10 -3 in.) at the end of the third cycle. Test 5 had a least principal stress of 7.00MPa (1015psi). As it happened, the boundary displacement in the direction of the least principal stress was only 0.1 mm (3.9 x 10 -3 in.) at the end of the third cycle. This indicates that a high least principal stress results in a reduced boundary displacement; that is a narrow and short fracture, and a low least principal
192 GUO et al.: HYDRAULIC FRACTURE PROPAGATION: EXPERIMENTS
a. Bottomhole Pressure and Injection History 4 0 t ~ . . . . ~ . . . . ~ ' I . . . . . ~ 1 I " J 4
30.00 I ~ 1~, '~ :I~20'00 ...................... '"'i . . . . . . . . . . . . . . . . . . ~ ~ .................. ~ i ............................... f'"i . . . . . ~ ~ i " ~ ............ i" .......... ~ i i ............................. i ......... 1"4-128 .~ ~
0 500 1000 1500 2000 2500
7.00 MPa L
b. Principal Stresses 20.00 . . . . ~ . . . . , . . . . i . . . . i . . . .
15.oo ............... .~. ................... ~--=-.=~. ~=.-==-.=-i.~.-~~.=.-: ....... ~-...=-.-o .............. t" . . . . . . . . . . . . . . . i . . . . . . . . . . . . . . . . . . . . . . . . . . . . . . . . . i . . . . . . . . . . . . . . . . . . . . . . . . . . . . .
1o.00 ........................... i ................................................................ i .............................................................
~.oo ........................... i ..................................... ~ . . . . . . . . . . . . . . . . . . . . . .
i ..... O w r ......... ~knutx ¢~3
O.OC . . . . i . . . . ~ . . . . i . . . . i . . . . 500 1000 1500 2000 2500
0.00
i -0.20
i -0.40 -0,60 -0.80 -1.00
0
c. Boundary Displacement
.... / 7 7 1 .......... 1 7 1 i .......... 7 1 1 7 / i i 7 7 / i / 7 / i .... 500 1000 1500 2000 2500
Time (s)
305 m
section A-A I ' 7
Location of Cutting Planes
13.40 MPa
oil pence_Lion Lvea
7.00 MPa 7.-
15.00MPa
oil l : ~ m n ~ area
Section A-A
d. Fracture Description
Fig. 2. Hydraulic fracture Test 5.
Section B-B
G U O et al.: H Y D R A U L I C F R A C T U R E P R O P A G A T I O N : E X P E R I M E N T S 193
a. Hydrau l i c Fracture Test 8
~i~ ~.~..~....~......I-...:.....~.......~...~......:.....~......;....I......;-.I.-:.....L.: ............ :....i.._.:~ ,ooo ........ I--I ....................................... ~ ................................................. ' .........
,;+LI ............. I ............. 1 ............. 1 ............. i ............. I ............ I ........... : ............. ::::::::::::::::::
'.~H ..................... I ............. i ............. + ............. i ............ -I ............. i ............. ~ ............. .i ............. +-.-.--.-...~ 0 . 0 0 " ' ' • ~ ' J ' i , £ - i . ~ . i . i . i . ;
0 100 2 0 0 3 0 0 4 0 0 5 0 0 6 0 0 7 0 0 8 0 0 9 0 0 1 0 0 0 1100
b. Hydrau l i c F r a c t u r e Tes t 3 30.00~., . , . , • ! . ! . ~ • ~ • ~ . ~ • .
o 41.90 M P : [ 1 : I ' ,.ooF.~..+ .............. I .......... ~ ............. + ............. , ............. ~ ............. + .............. + .............. + ............. i ........... ~ o . o o l - ........... i .............. I ............. ~ ............. ~ ............. ! ............. i ............. i .............. i ............. i ............. + ........... -1 15oob.~ .......................... i ............. : ............. : ............. : .............. i .............. i .............. i ............. i ........... .]
" ~ i i n : i } i i i i i
0 . 0 0 , + . i~_. ~ . ~ . . i . ~ . ~ . i . ~ . i . I . 0 100 200 300 400 500 600 700 S00 900 1000 1100
c. Hydrau l i c F r a c t u r e Tes t $
3 0 . 0 0 . • . . , . ~ • v • ~ • ! • v - f - ~ • ~ •
..ool-.~.~..~...!..."..~".i ............. i ............. i .............. i---..-.-.....i ............. i ............. ~ ............. i ............
~o.oo[......~...-..i ............. i ............. : ............. i,-'~~ ............. ~ ~ [ ...........
150o~-....,. . .+...... , . . . . . .+ ............. + ............. ~ ................ ,.......,..,.......~ ............. +.........~..~.........,...~ ........... • [ I i I + i i II i I ! i I) It
10 00 [---["-{--l-"~ ............. + ............. ! .............. .~.~...-....-.~--.--~..-.-.-i .............. i---H"--'}~ .......... i i i + t +
,.ooH..H.....i ............. + ............. ~ ............. &-!-~..-.i ............ ~.-.-.-.l+-~ ........... o . O O F I i - ' ~ - i . i . i j . i ) , ~ . ~ ~ + .
0 100 2 0 0 3 0 0 4 0 0 5 0 0 6 0 0 7 0 0 8 0 0 9 0 0 1 0 0 0 1 1 0 0
Time (s)
F i g . 3. B o t t o m , h o l e p r e s s u r e u n d e r v a r i o u s 03 .
stress results in a large boundary displacement when a longer and wider fracture is induced.
Figure 5 presents the oil penetration area in a horizon- tal middle plane for Test 8 (Fig. 5a) and Test 5 (Fig. 5b). The two oil penetration zones have obviously different features. The oil penetration area for Test 8 was circular, and some part of the fracture was filled with oil, but oil was on the fracture wall and had not infiltrated into the rock. This indicates clearly that the oil leaks off from the boreholc into the rock, which forms the circular oil penetration area. The oil entering the fracture occurs suddenly so that the perfect circular oil penetration area is recorded. The oil enters the fracture after breakdown and fracture opening. The oil penetration area for Test
0.05 • 7 • I - T - [ - I - - - - " .
o.0o : ......... .+.,-..-..il,..,.... .............. i ~ - ~ " ' ' ' = 1 " i ............. ! ........................ t ........... 1-.-4 ......... p : i . .......
+ ..... + [ + , , -0.10 .................................................... i
.o.,, ............ + .............. + .............. + .............. ~ ............. 4.1 ....................... [ .............. ~..':'--+ .......... ~: | i ! +; ' ~ ~ i | 1 + i i It ! i I I
-o.2o ........... { ............. ~ ............. + .............. ~ ............ 1 ......... "-'~---~ .......... + ............ ~ ....... : I i [
.o.. ............ i ............. i .............. ' ............... + ............ i ............. I ............ I .......... ! .................. i ......
' i + [
200 40O 6O0 8O0 1000
Time (s)
F i g . 4. B o u n d a r y d i s p l a c e m e n t u n d e r v a r i o u s o3.
5 (Fig. 5b) was like a band. Obviously, the oil leaks off from the fracture into the rock, which forms this pen- etration area. The linear flow along the fracture domi- nates oil leak-off in this test. I f the bottomhole pressure curve in Fig. la is checked, it is found that in Test 8, the injection period before breakdown was 26 sec, and the fracture extended over the whole specimen in 2-3 sec. After that, the oil flowed out of the specimen from the bottom. Hence the oil penetration area recorded mainly oil flow before breakdown. In contrast, the injection period before breakdown in Test 5 was 120 sec, but the injection period after breakdown was 570 sec. If leak-off after shut-in is considered, the injection period post breakdown and leak-off during shut-in dominated the whole injection process. Therefore, this oil penetration area represented mainly leak-off after breakdown. From the above analysis, it is concluded that radial flow dominates leak-off before breakdown. The linear flow along the fracture dominates flow of fracture fluid
oil penemuion axea
a. H y d r a u l i c F r a c t u r e T e s t 8 ( o 3 = 0 )
13.40 M P a
7.00 M P a
oil penel ra t ion m e a
b . H y d r a u l i c F r a c t u r e T e s t 5 ( a 3 = 7 . 0 0 M P a )
F i g . 5. O i l p e n e t r a t i o n a r e a u n d e r v a r i o u s o 3 ( t o p v i e w o f h o r i z o n t a l m i d d l e p l ane ) .
194 G U O et al.: H Y D R A U L I C F R A C T U R E P R O P A G A T I O N : E X P E R I M E N T S
after breakdown, and leak-off from the fracture into the rock is the main leak-off mode. The breakdown seems to be a transient point between the two flow modes.
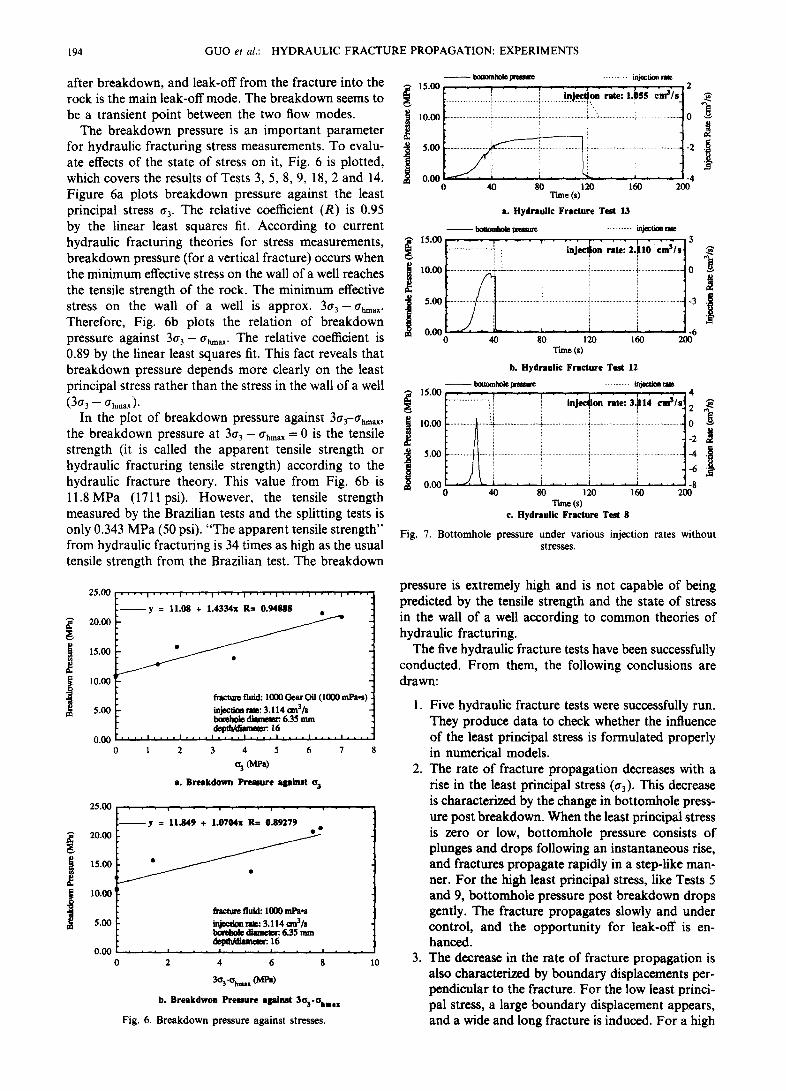
The breakdown pressure is an important parameter for hydraulic fracturing stress measurements. To evalu- ate effects of the state of stress on it, Fig. 6 is plotted, which covers the results of Tests 3, 5, 8, 9, 18, 2 and 14. Figure 6a plots breakdown pressure against the least principal stress 0.3. The relative coefficient (R) is 0.95 by the linear least squares fit. According to current hydraulic fracturing theories for stress measurements, breakdown pressure (for a vertical fracture) occurs when the minimum effective stress on the wall of a well reaches the tensile strength of the rock. The minimum effective stress on the wall of a well is approx. 30.3- 0.hmax" Therefore, Fig. 6b plots the relation of breakdown pressure against 30.3- 0.h~ax. The relative coefficient is 0.89 by the linear least squares fit. This fact reveals that breakdown pressure depends more clearly on the least principal stress rather than the stress in the wall of a well (30"3 - - 0"hmax)"
In the plot of breakdown pressure against 30"3-0.rtmax,
the breakdown pressure at 30. 3 - - O ' h m a x = 0 is the tensile strength (it is called the apparent tensile strength or hydraulic fracturing tensile strength) according to the hydraulic fracture theory. This value from Fig. 6b is l l . 8MPa (1711psi). However, the tensile strength measured by the Brazilian tests and the splitting tests is only 0.343 MPa (50 psi). "The apparent tensile strength" from hydraulic fracturing is 34 times as high as the usual tensile strength from the Brazilian test. The breakdown
25.00
20.00
15.00
10.00
5.00
' ' ' • I . . . . I . . . . I . . . . I . . . . I ' " ' ' 1 . . . . I . . . .
y = 11,08 + 1.4334x R= 0.94888
/ /
/
/
ffactme fluid: I000 Gear Oil (I000 mPa.s)
injection rate: 3.114 ¢m3/s borehole diamem~. 6.35 mm
16
0 1 2 3 4 5 6 7
O3 (MPa) a. Breakdown Pressure apinst %
25.00
20.00
15.00
10.00
5.00
0.00 0
y = 11.849 + 1.0704x R= 0.89279
/ • / / •
/
fracttae fluid: 1000 mPa.s
injection rate: 3.114 ~a3/s bomrole d t a m e ~ . 6.35 mm
t6 • . . i i J - i . . . i i t , I
2 4 6 8
303-Oh~ ~ (MPa)
b. Breakdwon Premurc aga ins t 3Os-Olmax
F i g . 6. B r e a k d o w n p r e s s u r e a g a i n s t s t r e s ses .
I0
- - bomnh~,¢ ~'¢uur¢ ......... mj~cuoa ra~
I ............................. .............................. , ....................... .................... . . . . . . . . . . . . . . . . io
i ........................... ' ........................ . . . . t 0 40 80 120 160 200
Time (s)
a. Hydraulic Fracture Test 13
- - boaomho~ inma~ ......... iajectioa ~
15 .00 , . • - ~ . . . . . . , • . . , . . . , 3
t0.00 ............................. ...................... , ............................... i .............................. i . . . . . . . . . . . . . . . . . . . . . . . . . . . . . 1
. . . . . . ...16 5.00 . . . . . . . 3
0 4O 80 120 160 20O
Time (s)
b. Hydraulic Fracture Test 12
- - bomanta~I¢ laCm~ ......... iajocfim ra~
15.00 " • " T . . . . . . . . . r " " " 4
~o.oo ......................... -i ................... ~ ........................ i ............................... i ............................ o
i -6 o.oo . . . . i . . . . . . i.,. s
0 40 80 120 160 200 Tune (s)
c. Hydraulic Fracture Test 8
F i g . 7. B o t t o m h o l e p r e s s u r e u n d e r v a r i o u s i n j e c t i o n r a t e s w i t h o u t s t resses .
pressure is extremely high and is not capable of being predicted by the tensile strength and the state of stress in the wall of a well according to common theories of hydraulic fracturing.
The five hydraulic fracture tests have been successfully conducted. From them, the following conclusions are drawn:
1. Five hydraulic fracture tests were successfully run. They produce data to check whether the influence of the least principal stress is formulated properly in numerical models.
2. The rate of fracture propagation decreases with a rise in the least principal stress (~r3). This decrease is characterized by the change in bottomhole press- ure post breakdown. When the least principal stress is zero or low, bottomhole pressure consists of plunges and drops following an instantaneous rise, and fractures propagate rapidly in a step-like man- ner. For the high least principal stress, like Tests 5 and 9, bottomhole pressure post breakdown drops gently. The fracture propagates slowly and under control, and the opportunity for leak-off is en- hanced.
3. The decrease in the rate of fracture propagation is also characterized by boundary displacements per- pendicular to the fracture. For the low least princi- pal stress, a large boundary displacement appears, and a wide and long fracture is induced. For a high
G U O et al.: H Y D R A U L I C F R A C T U R E PROPAGATION: EXPERIMENTS 195
.
.
least principal stress, a small boundary displace- ment is produced, which implies that the fracture induced is short and narrow. Through the evaluation of oil penetration area, it is found that radial flow dominates leak-off before breakdown. The linear flow along the fracture dominates flow of fracture fluid after breakdown, and leak-off from the fracture into rock is the main leak-off mode after breakdown. The breakdown is a transient point between two flow modes. The breakdown pressure can be related to a3 rather than a 3 - a~,,~ under some experimental con- ditions. "The tensile strength" calculated from hydraulic fracturing is 34 times as high as the usual tensile strength from the Brazilian test. The two facts indicate that breakdown pressure is extremely high for experiments reported here and is not capable of being predicted by the tensile strength and the state of stress on the wall of a well according to conventional theory.
HYDRAULIC FRACTURING UNDER VARIOUS INJECTION RATES
Injection rate is one of the most important control- 1able variables in hydraulic fracturing. In field hydraulic fracturing stimulation, injection rate and injection pro- cedure are usually used to control fracture geometry. It is essential for a numerical model to formulate injection rate properly. Thirteen hydraulic fracture tests were performed under three different conditions to study the
effects of injection rate on fracture propagation, which were Tests 6-8, 10-17, 19 and 20. The first set was under zero stress. They were hydraulic fracture Tests 6-8 and 11-14. The injection rates ranged from 0.106 to 3.114 cm3/sec. The injection well was 6.4 mm (0.25 in.) in diameter and 101.6 ram (4 in.) in depth. Through these tests, effects of injection rate under zero stresses were evaluated. Also another Test 10 was performed under step-rate injection. The injection rates were 0.317, 0.528, 1.056 and 3.166 cm3/sec, respectively. The three principal stresses on the specimen remained constant. The injec- tion well was 6.4 mm (0.25 in.) in diameter and 101.6 mm (4 in.) in depth. This test was intended to reveal effects of injection rate on fracture propagation under constant stresses. Since subsequent injection cycles may be affected by the previous injection cycles, five other hydraulic fracture Tests 15-17, 19 and 20 were con- ducted to avoid this interaction. The stresses on different specimens were similar. The injection rates were 2.164 and 3.186cm3/sec. The injection well was 3.2ram (0.125in.) in diameter and 63.5mm (2.5 in.) in depth. They were also intended to study effects of injection rate under constant stresses on fracture propagation.
Hydraulic fracturing under various injection rates-- without stresses
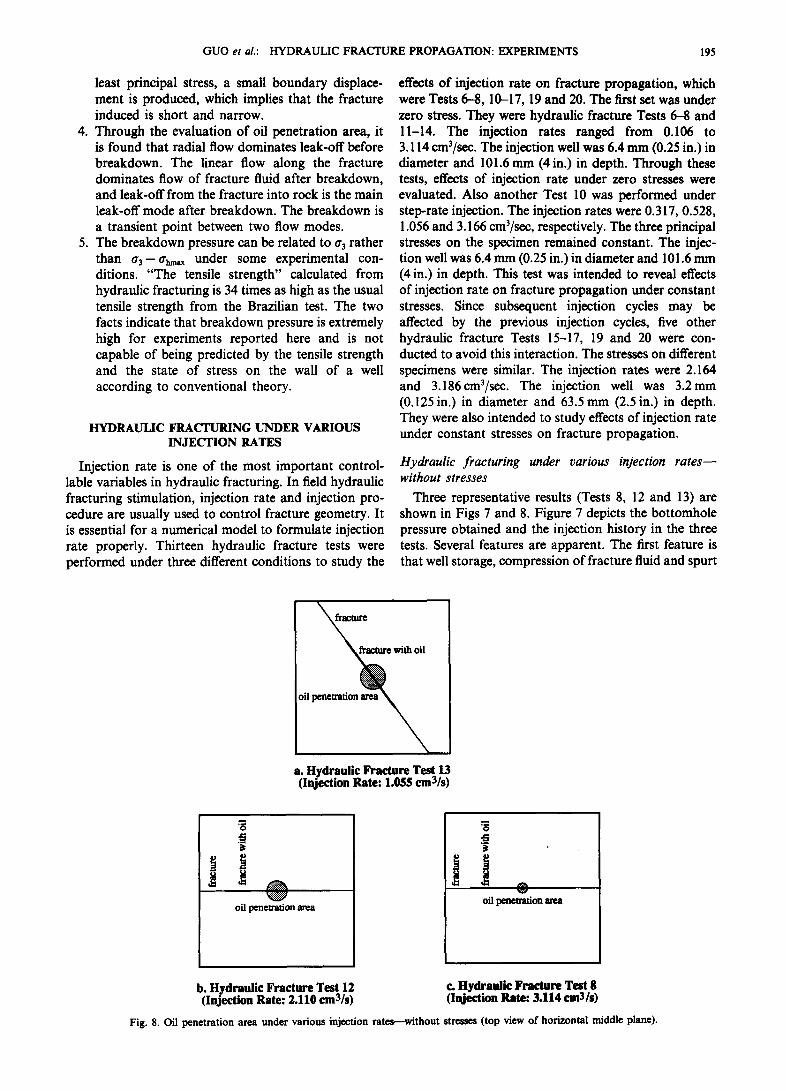
Three representative results (Tests 8, 12 and 13) are shown in Figs 7 and 8. Figure 7 depicts the bottomhole pressure obtained and the injection history in the three tests. Several features are apparent. The first feature is that well storage, compression of fracture fluid and spurt
e
with oil
oil penetration area
\ a. Hydraulic Fracture Test 13 (Injection Rate: 1.055 cm3/s)
I oil penetration area
oil penetration area
b. Hydraulic Fracture Test 12 c. Hydraulic Fracture Test 8 (Injection Rate: 2.110 cm3/s) (Injection Rate: 3.114 cm3/s)
Fig. 8. Oil penetration area under various injection ra tes--without stresses (top view of horizontal middle plane).
196 G U O e t al.: H Y D R A U L I C F R A C T U R E P R O P A G A T I O N : E X P E R I M E N T S
loss control the bottomhole pressure at the beginning of injection. The three factors lead to a slow rise in bottomhole pressure. This period increases with a de- crease of injection rate. Another feature is that when well storage terminates, leak-off of fracture fluid and com- pression of fracture fluid dominate the bottomhole pressure. During this duration, the bottomhole pressure increases rapidly. The final feature is that the fracture induced also affects bottomhole pressure. This is illus- trated in Fig. 7a. A fracture opened and closed before breakdown, which resulted in t~vo drops following an instantaneous rise in bottomhole pressure. Although radial flow still dominates flow of fracture fluid, as illustrated by oil penetration area, there are many other factors which also influence bottomhole pressure.
Figure 8 presents the oil penetration area in the horizontal middle plane for the three tests. Tests 12 and 13 induced vertical fractures similar to Test 8. Fracture propagation was extremely fast, and it extended over the whole specimen in only 2-3 sec. A noise accompanied this process. The bottomhole pressure dropped to zero in about 3 sec (Fig. 7). All the oil penetration areas were similar to Test 8 with radial penetration around wells. The oil penetration radius varied with injection rate, from 10 mm (0.4 in.) at an injection rate of 3.114 cm3/sec to 25 mm (1 in.) at an injection rate of 1.055 cm3/sec. Beyond this area, oil appeared on part of the fracture wall, and had not infiltrated into the formation. Similar fracture propagation and oil penetration areas were also obtained for an injection rate as low as 0.106 cma/sec in Test 6. In Test 6, injection continued for 1 h 23 min, and the oil penetration radius was 70mm (2.8 in.). These further proved that oil leaks off radially before breakdown pressure, and oil enters fractures after break- down even though the injection rate is as low as 0.106 cm3/sec.
The effect of injection rate on breakdown pressure is also of interest, especially for stress measurements. It is presented in Fig. 9. All breakdown pressure from the tests without stresses (Tests 6-8 and 11-14) are plotted in this figure. When injection rate increases from 0.106 to 3.114 cm3/sec, breakdown pressure rises from 3.88 MPa (563 psi) to 11.00 MPa (1595 psi). The influ- ence of injection rate is striking.
a. Bottomhole Pressure and Injection History 25.00 ~ 4
.......... ....... ....... I I t
,o E iil,iil,i<; ............. "7:1' ........
="°° ' I ........................... ............... S .................... I ............ 1 ............. 1 ................. H" . ; I i ...................
0 500 1000 1500 2000 2500 3000
~.oo
0.50
0.00
-0.50 o
b. Boundary Displacement . . . . ~ . . . . , . . . . , . . . . , . . . . ~ . . . .
. . . . t . . . . i . . . . , • . - . . . . . i . . . .
500 I000 1500 2000 2500 3000
Time (s)
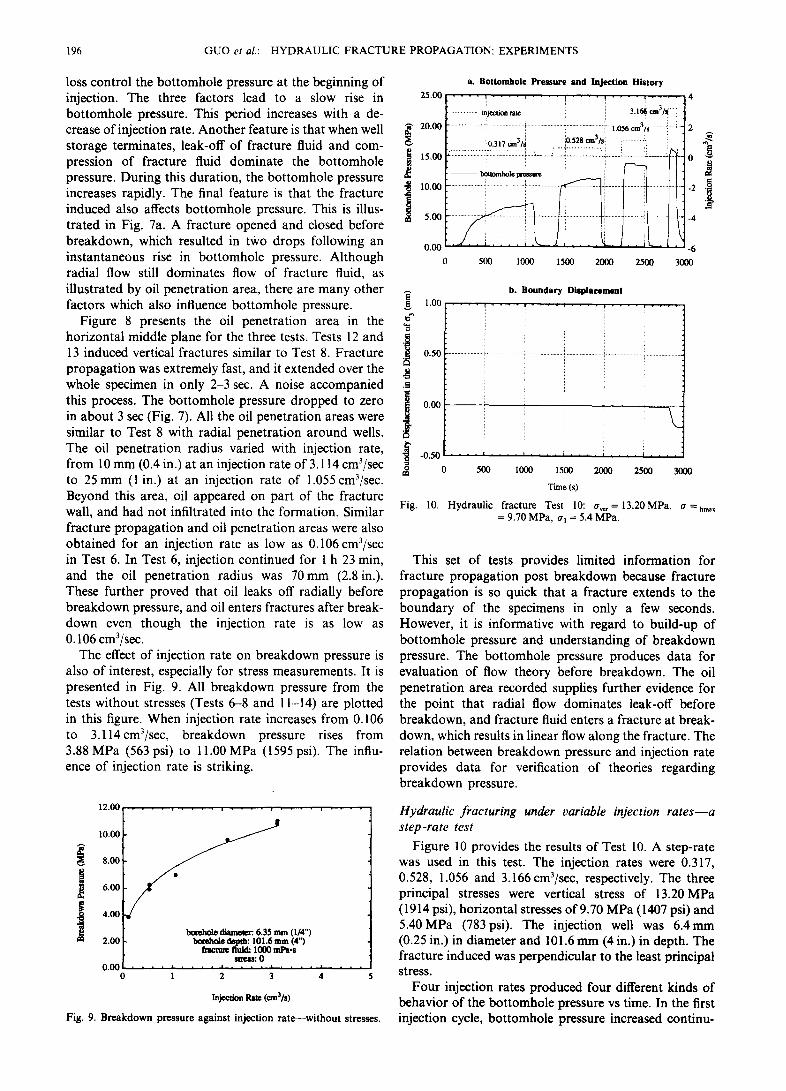
Fig. 10. H y d r a u l i c f r a c t u r e T e s t 10: C r ~ r = 1 3 . 2 0 M P a , O '=hmat = 9 .70 M P a , ¢r 3 = 5.4 M P a .
This set of tests provides limited information for fracture propagation post breakdown because fracture propagation is so quick that a fracture extends to the boundary of the specimens in only a few seconds. However, it is informative with regard to build-up of bottomhole pressure and understanding of breakdown pressure. The bottomhole pressure produces data for evaluation of flow theory before breakdown. The oil penetration area recorded supplies further evidence for the point that radial flow dominates leak-off before breakdown, and fracture fluid enters a fracture at break- down, which results in linear flow along the fracture. The relation between breakdown pressure and injection rate provides data for verification of theories regarding breakdown pressure.
1 2 . 0 0 . . . . . , . . . . , . . . . i . . . . , . . . .
f i ~ dien~m~. 6.35 mm (I/4")
2.00 I- b~eho~ dnl~a: I01.6 mm (4") [ ~aetum fluid: tO00 ml~.s
o.ool .......... .~::o .......... 0 I 2 3 4
Injection ~ (cm~)
Fig . 9. B r e a k d o w n p r e s s u r e a g a i n s t i n j ec t i on r a t e - - - w i t h o u t s t resses .
Hydraulic fracturing under variable injection rates--a step-rate test
Figure 10 provides the results of Test 10. A step-rate was used in this test. The injection rates were 0.317, 0.528, 1.056 and 3.166cm3/sec, respectively. The three principal stresses were vertical stress of 13.20MPa (1914 psi), horizontal stresses of 9.70 MPa (1407 psi) and 5.40MPa (783psi). The injection well was 6.4mm (0.25 in.) in diameter and 101.6 mm (4 in.) in depth. The fracture induced was perpendicular to the least principal stress.
Four injection rates produced four different kinds of behavior of the bottomhole pressure vs time. In the first injection cycle, bottomhole pressure increased continu-
GUO et a/.: HYDRAULIC FRACTURE PROPAGATION: EXPERIMENTS 197
ously. When bottomhole pressure reached 7.2MPa (1044 psi), the oil was used up, and the well was shut in. No features suggest that a fracture was initiated. In the second injection cycle, a sudden change in the slope of the bottom_hole pressure vs time curve appeared when the bottomhole pressure was 10 MPa (1450 psi). After that, the bottomhole pressure increased slowly. The highest bottomhole pressure had not been reached at shut-in. This sudden change in slope indicates that a fracture was initiated before breakdown, which was identical with the conclusions drawn from AE monitor- ing by Zoback et al. [11]. It also reflects that an induced fracture will affect a build-up of bottomhole pressure. In the third injection cycle, the breakdown occurred when bottomhole pressure rose to 13.83 MPa (2006 psi). After that, the bottomhole pressure declined gently with injec- tion. In the fourth injection cycle, the rate of decline in bottomhole pressure increased. This test demonstrates the effects of injection rate on hydraulic fracturing. When injection rate is very low, as happened in the first injection cycle, fracture fluid leaks off into the rock from the injection well. A fracture cannot be initiated, and the test is like a well test. For a higher injection rate, most of the fracture fluid still leaks off into rock from the injection well so that a wedge effect cannot be formed. Consequently, as happened in the second injection cycle, the bottomhole pressure increases slowly with fracture propagation. The fracture should be extremely narrow under this injection rate. When the injection rate rises again, the amount of fracture fluid entering the fracture increases, the wedge effect is formed so that the bottom- hole pressure develops as happened in the third injection
cycle. But the fracture is still narrow so that this wedge effect is slight, and bottomhole pressure declines slowly. For a higher injection rate, most of the fracture fluid enters into a fracture. Fracture width increases rapidly with injection, which leads to a low loss of pressure in the fracture. The fracture propagates unstably under these conditions, as happened in the fourth injection cycle.
The boundary displacement perpendicular to the frac- ture (in the direction of ~3) in Fig. 10b is consistent with the above explanation. There was no boundary displace- ment in the first injection cycle, which was identical with the fact that there was no fracture in the specimen. There still was no boundary displacement in the second injec- tion cycle, which was also consistent with extremely narrow fractures deduced from bottomhole pressure. In the third injection cycle, a slight boundary displacement developed at the end of the injection cycle. The fracture induced was narrow. In the fourth injection cycle, frac- ture fluid entered the fracture and a wide fracture developed, which led to a large boundary displacement. Therefore, boundary displacement, like bottomhole pressure, characterizes the fracture induced, but it is not sensitive to the narrow fracture as induced in the second and third injection cycles.
Hydraulic fracturing under various injection rates--with similar stresses
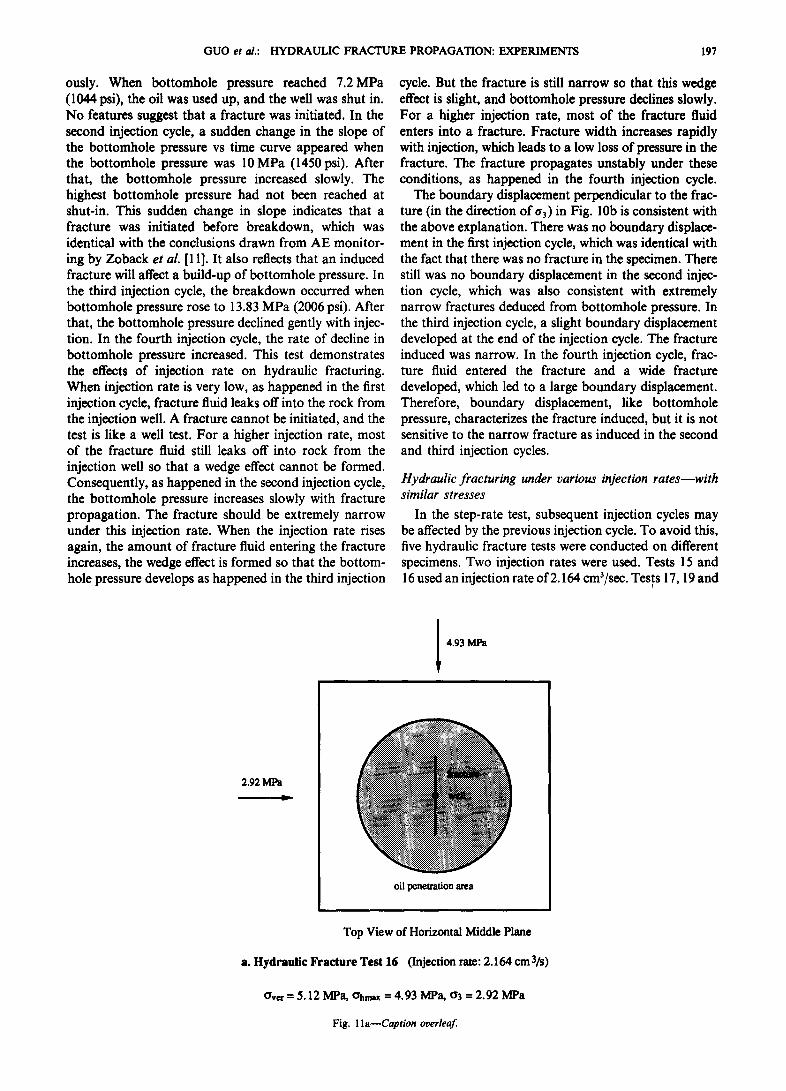
In the step-rate test, subsequent injection cycles may be affected by the previous injection cycle. To avoid this, five hydraulic fracture tests were conducted on different specimens. Two injection rates were used. Tests 15 and 16 used an injection rate of 2.164 cm3/sec. Tests 17, 19 and
4.93 MPa
2,92 MPa
oil penetration area
Top View of Horizontal Middle Plane
a. Hydraulic Fracture Test 16 (Injection rate: 2.164 cm3/s)
ov~ = 5.12 MPa, Ohmax = 4.93 MPa, o3 = 2.92 MPa
Fig. I la--Caption overleaf
198 G U O et al.: H Y D R A U L I C F R A C T U R E PROPAGATION: EXPERIMENTS
305 mm
section C-C • .
," L / J
2.99 MPa
I ~ 4. 53 MPa
oil extends to\ whole top p l ~
Top View of Top Plane
~ 4.53 MPa
f~
a
Tacture
oil penetration area
Front View of Back Hane
oil penewmion area
Section C-C
~ ture
oil penetration area
Section B-B
oil penetration
fracture oil penetration area
Section A-A
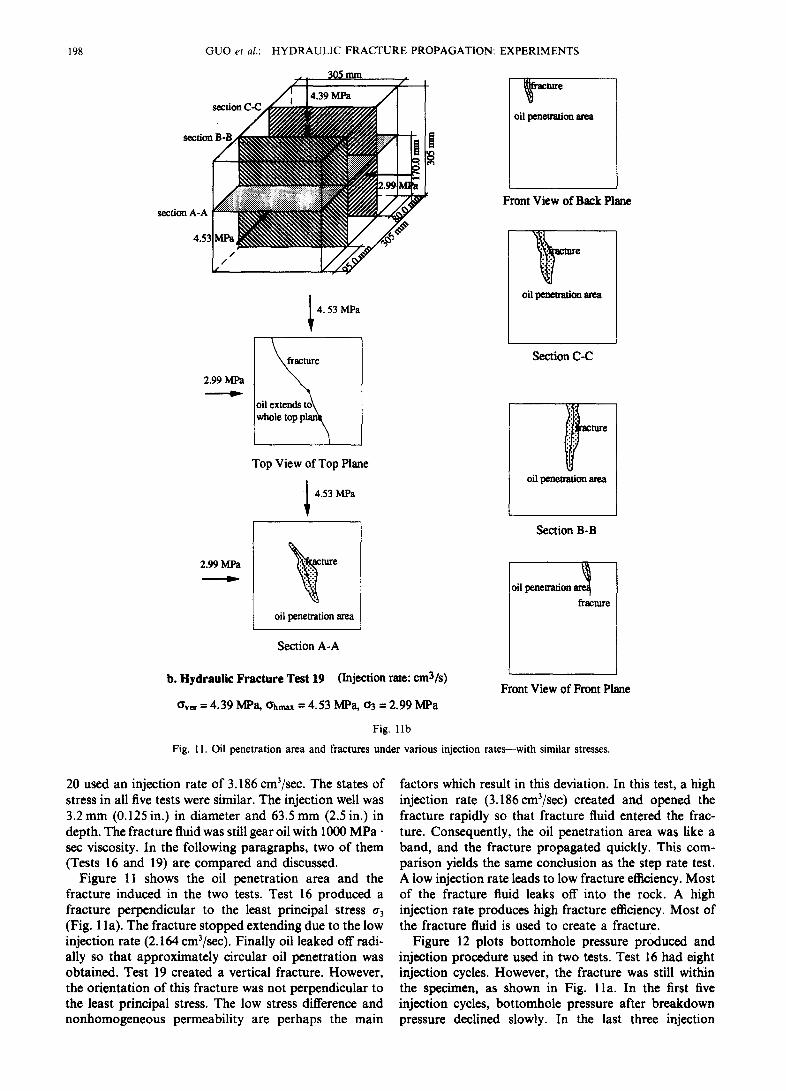
b. Hydraulic Fracture Test 19 (Injection rate: cm3/s)
Or= = 4.39 MPa, Ohnm =4.53 MPa, 03 = 2.99 MPa
Fig. l i b
Fig. 11. Oil penetration area and fractures under various injection rates--with similar stresses.
Front View of Front Plane
20 used an injection rate of 3.186 cm3/sec. The states of stress in all five tests were similar. The injection well was 3.2 mm (0.125 in.) in diameter and 63.5 mm (2.5 in.) in depth. The fracture fluid was still gear oil with 1000 MPa . sec viscosity. In the following paragraphs, two of them (Tests 16 and 19) are compared and discussed.
Figure 11 shows the oil penetration area and the fracture induced in the two tests. Test 16 produced a fracture perpendicular to the least principal stress a3 (Fig. 11 a). The fracture stopped extending due to the low injection rate (2.164 cm3/sec). Finally oil leaked off radi- ally so that approximately circular oil penetration was obtained. Test 19 created a vertical fracture. However, the orientation of this fracture was not perpendicular to the least principal stress. The low stress difference and nonhomogeneous permeability are perhaps the main
factors which result in this deviation. In this test, a high injection rate (3.186 cm3/sec) created and opened the fracture rapidly so that fracture fluid entered the frac- ture. Consequently, the oil penetration area was like a band, and the fracture propagated quickly. This com- parison yields the same conclusion as the step rate test. A low injection rate leads to low fracture efficiency. Most of the fracture fluid leaks off into the rock. A high injection rate produces high fracture efficiency. Most of the fracture fluid is used to create a fracture.
Figure 12 plots bottomhole pressure produced and injection procedure used in two tests. Test 16 had eight injection cycles. However, the fracture was still within the specimen, as shown in Fig. l la. In the first five injection cycles, bottomhole pressure after breakdown pressure declined slowly. In the last three injection
G U O et al.: H Y D R A U L I C F R A C T U R E P R O P A G A T I O N : E X P E R I M E N T S 199
25.00
20.00
15.00
10.00
5.00
0.00= 0
8. Hydraulic Fracture T a t 16
I
"-~---+'-" I'.~"i-"-~ ~ ....... i-T"~ .......
- r i .......... ++" ......... +
500 1000 1500 2000 2500
. . . . . . o . .
-",LI;CL,,,
I _ . £ . . . . . . . . . . . . . . . . . . . -2
-4
-6 300O
4
2~ ° 4
b, Hydraulic Fracture Test 19
. . . . . . . . . V . . . . . . . . ~ . . . . . . . . 25.00 . . . . . t . . . , . i . . . . . . . . . . . 4 | ' ' ' ~ :i
20.00 ~ ...... + : Dmmk~ti :~ :~ ........ t ~ ' ' + . + ......................................... + +,+.+ ................... ; ....................... + r+ ................. 2 ~ I --'I( i + + ++ ++ +
1 5 . 0 0 ........ .';"" ' - - " " .+~ . . . . . ~ . . . . "J'+ ................... '~[ . . . . ~ - ' 0
. . . . . ~--- i i i [ + lO.OO ...................... + + + :-+ i ...................... ...................... ................... ...................... .................. 2 .~
[ i + I i .............. i .................................................................... n+L+++++ i ..................... +.. 5 . 0 o [ [ l ,
+ + . ~ . _ ' l ' 0.0~ ~ j .... i . . . . . . . + " ' -6
0 100 200 300 400 500 600 700
Time (s~c)
Test 16: ov =5.12 MPa, Ohm~x---4.93 MPa, a3=2.92
Teat 19:awrY4.39 MPa, ahmLxffi4.53 MPa, o3=2.99 MI~
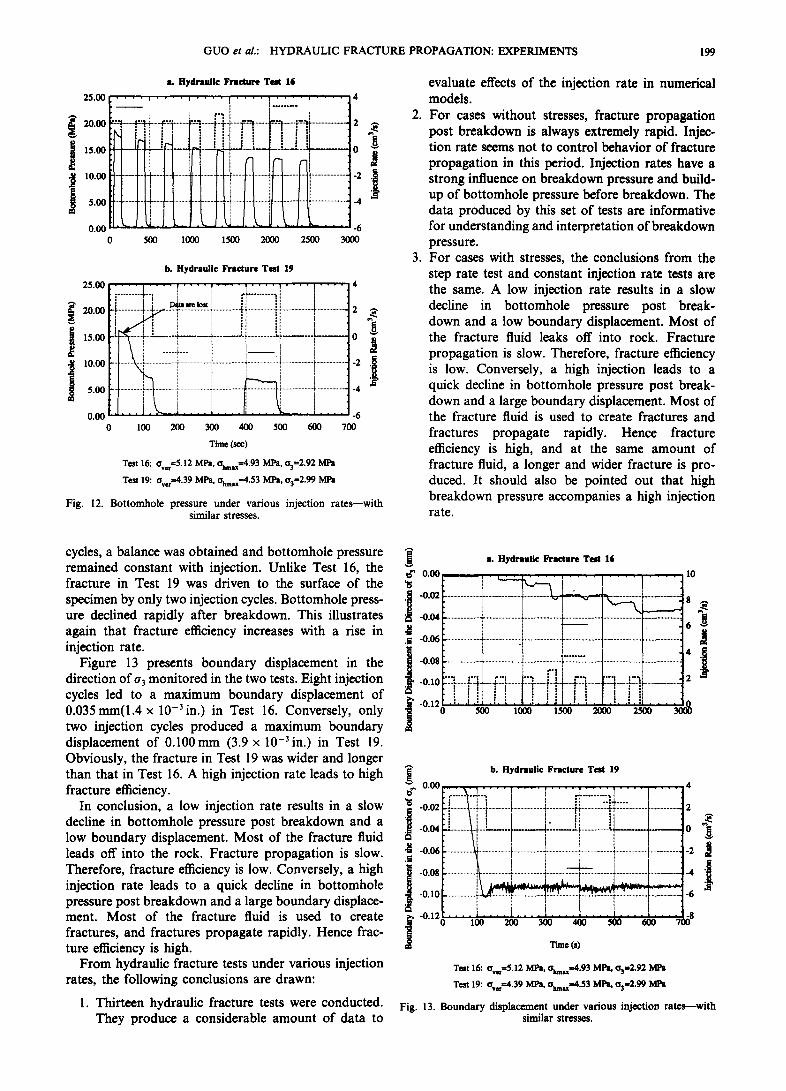
Fig. 12. Bottomhole pressure under various injection rates--with similar stresses.
.
.
evaluate effects of the injection rate in numerical models. For cases without stresses, fracture propagation post breakdown is always extremely rapid. Injec- tion rate seems not to control behavior of fracture propagation in this period. Injection rates have a strong influence on breakdown pressure and build- up of bottomhole pressure before breakdown. The data produced by this set of tests are informative for understanding and interpretation of breakdown pressure. For cases with stresses, the conclusions from the step rate test and constant injection rate tests are the same. A low injection rate results in a slow decline in bottomhole pressure post break- down and a low boundary displacement. Most of the fracture fluid leaks off into rock. Fracture propagation is slow. Therefore, fracture efficiency is low. Conversely, a high injection leads to a quick decline in bottomhole pressure post break- down and a large boundary displacement. Most of the fracture fluid is used to create fractures and fractures propagate rapidly. Hence fracture efficiency is high, and at the same amount of fracture fluid, a longer and wider fracture is pro- duced. It should also be pointed out that high breakdown pressure accompanies a high injection rate.
cycles, a balance was obtained and bottomhole pressure remained constant with injection. Unlike Test 16, the fracture in Test 19 was driven to the surface of the specimen by only two injection cycles. Bottomhole press- ure declined rapidly after breakdown. This illustrates again that fracture efficiency increases with a rise in injection rate.
Figure 13 presents boundary displacement in the direction of 0" 3 monitored in the two tests. Eight injection cycles led to a maximum boundary displacement of 0.035mm(1.4 x 10 -3 in.) in Test 16. Conversely, only two injection cycles produced a maximum boundary displacement of 0.100ram (3.9 x 10⁻³in.) in Test 19. Obviously, the fracture in Test 19 was wider and longer than that in Test 16. A high injection rate leads to high fracture efficiency.
In conclusion, a low injection rate results in a slow decline in bottomhole pressure post breakdown and a low boundary displacement. Most of the fracture fluid leads off into the rock. Fracture propagation is slow. Therefore, fracture efficiency is low. Conversely, a high injection rate leads to a quick decline in bottomhole pressure post breakdown and a large boundary displace- ment. Most of the fracture fluid is used to create fractures, and fractures propagate rapidly. Hence frac- ture efficiency is high.
From hydraulic fracture tests under various injection rates, the following conclusions are drawn:
1. Thirteen hydraulic fracture tests were conducted. They produce a considerable amount of data to
a. Hydraulic Fracture Te~t 16
~ 0'00 ~ x . . / - ~ [ - - I I0 ~s I -o.o~ : ....................... + ............................ ~ .......... ~ ......... ~ s
o + . ................. .................................................. .............
...................... [ ........................ :i::iiiii iii.t .t ii l iTi::ii i:T::iiT:
' . : : ............ : : : 1 : : : ........... i : : i : i - J : / t : : ; ......... ................. ] -0.10 2...L -....L-~.+L-.-.....L.......A+.....'--.b.-Jp-...I..'-.-I.+ --.}...+--..L...t ~ ............. :
i i: ~! i ~i z i i i' : i - 0 . 1 2 ~
b. Hydraulic Fracture Test 19
0 . 0 0 . . . . . . . . . + . . . . . . . . . . . . . . . . . . . . 4
° " : . . . . - % - - . , , ..-I .......... .T. i :
i - o . o 2 . -L . - . - . . -G. - . i ............... ~ .................... i ................... i.~ .............. : : ~ . : ' . : ............. ~ .................. = 2 : i / ~ I ~ l :
. . . . . !- . . . . . .................. 1 : II + l l i I :o
.li-o.o6 ........... ........~ ...................... i ..................... + ..................... i ..................... ,+ .................... f ................... 2
~ + i ' i .!i
-0.10 ........... ~ . . - ~ ' . ~ . . . _ ~ . . 2 -6
-012' ~ ' ~ " " ' ' ~ " " ' ' ~ . . . . :-8 0 100 200 300 400 500 600 700
Time (s)
Test 16:Ow=5.12 MPa, olua ~4.93 MPa, 03,-2.92 MPa
Test 19:aver=4.39 MPa, oluau~4.53 MP8, 03=2.99 MPa
Fig. 13. Boundary displacement under various injection ra tes - -wi th similar stl~'sses.
200 G U O et al.: H Y D R A U L I C F R A C T U R E P R O P A G A T I O N : E X P E R I M E N T S
DISCUSSION 0. t 5
Intersection of a fracture with the surface of specimens g o.to The identification of the intersection of a fracture with
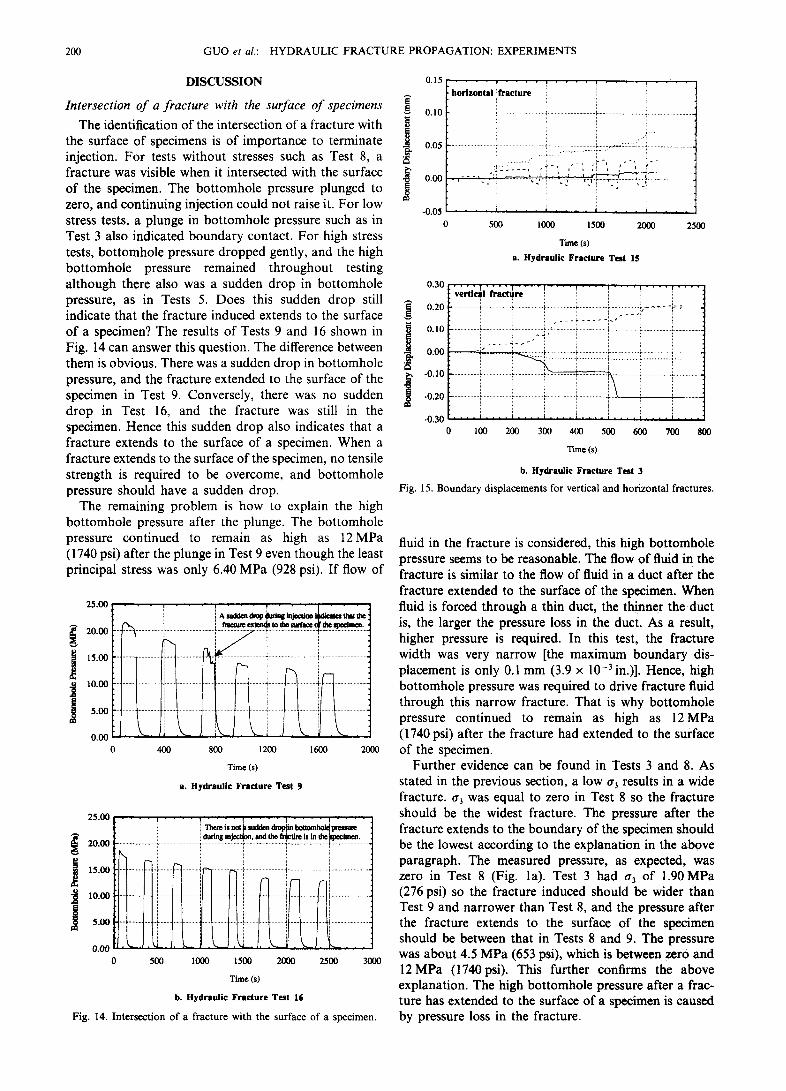
the surface of specimens is of importance to terminate -~ o.o5 injection. For tests without stresses such as Test 8, a fracture was visible when it intersected with the surface ~" o.oo of the specimen. The bottomhole pressure plunged to zero, and continuing injection could not raise it. For low
-0.05 stress tests, a plunge in bottomhole pressure such as in 0 Test 3 also indicated boundary contact. For high stress tests, bottomhole pressure dropped gently, and the high bottomhole pressure remained throughout testing although there also was a sudden drop in bottomhole 0.30 pressure, as in Tests 5. Does this sudden drop still ~ 0.2o indicate that the fracture induced extends to the surface g of a specimen? The results of Tests 9 and 16 shown in ~ ~ o.i0 Fig. 14 can answer this question. The difference between -~ o.oo them is obvious. There was a sudden drop in bottomhole .~ pressure, and the fracture extended to the surface of the g -0.10 specimen in Test 9. Conversely, there was no sudden ~ -0.20 drop in Test 16, and the fracture was still in the
-0.30 specimen. Hence this sudden drop also indicates that a fracture extends to the surface of a specimen. When a fracture extends to the surface of the specimen, no tensile strength is required to be overcome, and bottomhole pressure should have a sudden drop.
The remaining problem is how to explain the high bottomhole pressure after the plunge. The bottomhole pressure continued to remain as high as 12MPa (1740 psi) after the plunge in Test 9 even though the least principal stress was only 6.40 MPa (928 psi). If flow of
25.00
20.00
15.00
10.00
5.00
0.00 0
. . . . . . I
400 800 1200 1600 2000
Time (s)
a. Hydraulic Fracture Test 9
20.00
15.00
1o.o0
5.oo
2 5 . 0 0 . . . . i . . . . . . . . ~ . . . . T . . . . ! . . . .
i i d l a i n g i n j e ~ , m d t h e f r i c t i r e i s i n t h e t q ~ c i m e n . ........................... i ....................................................................................... ~ ............................ ~ ...........................
l 0.00 0 500 1000
...i . . . . . . . . . . . . . . . . . . . . ~ . . . . . . . . . . . . i .....................
1500 200O 2500 30O0
Time (s)
b. Hydraulic Fracture Test 16
Fig. 14. In tersec t ion of a f racture wi th the surface of a specimen.
. . . . i~ . . . . T . . . . i . . . . . . . . horizontal i fracture i i
........................... . . . . . . . . . . . . . . . . . . . . . . . . . . . . . . . . . . . . . . . . . . . . . . . . . . . . . . . . . . . . . . . . . . . . . . . . . . . . . . . . . . . . . . . . . . .
:z . . . . . i • ) i , ~ i ,
. • - - - , , ; ! . . . . . . . . . . . . . ~......~...-. . . . . . . . . . . . . . !...=_.:,....~.'.:.:_.;,=.~L.....~.L..~.~ ...........................
. . . . i . . . . i . . . . i . . . . i . . . .
500 1000 1500 2000 2500
Time (s)
a. Hydraulic Fracture Test 15
vertical fracture i i i
. . . . . . . . . . . . . . . .~ . . . . . . . . . . . . . . . . . . . . . . . . . . . . . . ~ . . ~ . . . . . . . . . . . . . . . . ~ . . . . . . . . . . . . . . . . . . . . ~. . . . . . . . . . . . . . . ~ . . . . . . . . . . . . . . . . . . . . ~ . . . . . . . . . . . . . . . .
. . . i . . . . . . . . . . . . . . . . . . . i . . . . i . . . . . . . . .
0 100 200 300 400 500 600 700 800
Time (s)
b. Hydraulic Fracture Test 3
Fig. 15. Boundary d isp lacements for vert ical and hor izonta l fractures.
fluid in the fracture is considered, this high bottomhole pressure seems to be reasonable. The flow of fluid in the fracture is similar to the flow of fluid in a duct after the fracture extended to the surface of the specimen. When fluid is forced through a thin duct, the thinner the duct is, the larger the pressure loss in the duct. As a result, higher pressure is required. In this test, the fracture width was very narrow [the maximum boundary dis- placement is only 0.1 mm (3.9 x 10 -3 in.)]. Hence, high bottomhole pressure was required to drive fracture fluid through this narrow fracture. That is why bottomhole pressure continued to remain as high as 12MPa (1740 psi) after the fracture had extended to the surface of the specimen.
Further evidence can be found in Tests 3 and 8. As stated in the previous section, a low a3 results in a wide fracture. ~3 was equal to zero in Test 8 so the fracture should be the widest fracture. The pressure after the fracture extends to the boundary of the specimen should be the lowest according to the explanation in the above paragraph. The measured pressure, as expected, was zero in Test 8 (Fig. la). Test 3 had ~r 3 of 1.90MPa (276 psi) so the fracture induced should be wider than Test 9 and narrower than Test 8, and the pressure after the fracture extends to the surface of the specimen should be between that in Tests 8 and 9. The pressure was about 4.5 MPa (653 psi), which is between zero and 12MPa (1740psi). This further confirms the above explanation. The high bottomhole pressure after a frac- ture has extended to the surface of a specimen is caused by pressure loss in the fracture.
GUO et al.: HYDRAULIC FRACTURE PROPAGATION: EXPERIMENTS 201
From the above analysis, it is concluded that the intersection of a fracture with the surface of a specimen is symbolized by a sudden drop in bottomhole pressure. The high bottomhole pressure after this plunge results from pressure loss in the fracture.
Boundary displacements and fractures Boundary displacements are monitored to supply
further information for fracture propagation. It is necessary to study to what degree boundary displace- ments can characterize a fracture. To achieve this goal, boundary displacement under different fracture modes (vertical and horizontal) are compared, and the relation between the boundary displacement and the bottomhole pressure is discussed in the following paragraphs.
One horizontal fracture was induced unexpectedly in hydraulic fracture Test 15. This offers a chance to compare the boundary displacements for a horizontal fracture with those for a vertical fracture. The results are plotted in Fig. 15. When a fracture is horizontal (Test 15), the two horizontal boundary displacements are always compressive throughout testing. The vertical boundary displacement is expansive during injection. On the other hand, when a fracture is vertical (Test 3), the vertical boundary displacement is compressive through- out testing. The boundary displacement in the direction of 0"3 (perpendicular to the fracture) is expansive. This indicates clearly that the fracture mode is characterized by boundary displacements. The boundary displacement perpendicular to the fracture is always expansive during injection. The boundary displacement in a direction with the higher stress in the other two directions is always compressive.
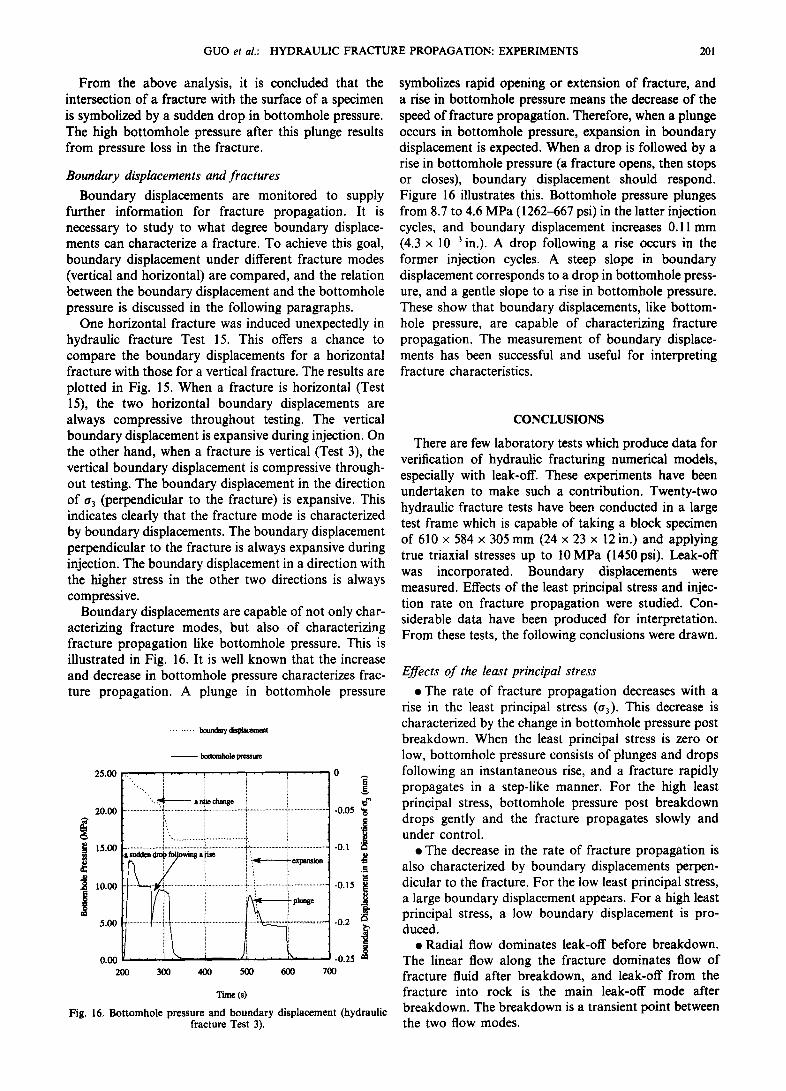
Boundary displacements are capable of not only char- acterizing fracture modes, but also of characterizing fracture propagation like bottomhole pressure. This is illustrated in Fig. 16. It is well known that the increase and decrease in bottomhole pressure characterizes frac- ture propagation. A plunge in bottomhole pressure
......... bound~ d~.~ce.m~t
- - boaomhole pe~'e
20.00 ~ . . . . . . . . . . . . . . . . . . . . . . :~ . . . . . . . . . . . . . . . . . . . . . . . . . . . . . . . . . . . . . . . . . . . . . . . . . . . . . . , . . . . . . . . . . . . . . . . . . . . . . . . . . . ~ . . . . . . . . . . . . . . . . . . . . . . . . . 1.0.05
113.00 ' ~ f o ~ i ~ , ~ i: i . -0.1 i L 10.00 -0.15
5.00 -0.2 i
0.00 -0.25 200 300 400 500 600 700
Time (s)
Fig. 16. Bottomhole pressure and boundary displacement (hydraulic fracture Test 3).
symbolizes rapid opening or extension of fracture, and a rise in bottomhole pressure means the decrease of the speed of fracture propagation. Therefore, when a plunge occurs in bottomhole pressure, expansion in boundary displacement is expected. When a drop is followed by a rise in bottomhole pressure (a fracture opens, then stops or closes), boundary displacement should respond. Figure 16 illustrates this. Bottomhole pressure plunges from 8.7 to 4.6 MPa (1262--667 psi) in the latter injection cycles, and boundary displacement increases 0.11 mm (4.3 x 10 -3 in.). A drop following a rise occurs in the former injection cycles. A steep slope in boundary displacement corresponds to a drop in bottomhole press- ure, and a gentle slope to a rise in bottomhole pressure. These show that boundary displacements, like bottom- hole pressure, are capable of characterizing fracture propagation. The measurement of boundary displace- ments has been successful and useful for interpreting fracture characteristics.
CONCLUSIONS
There are few laboratory tests which produce data for verification of hydraulic fracturing numerical models, especially with leak-off. These experiments have been undertaken to make such a contribution. Twenty-two hydraulic fracture tests have been conducted in a large test frame which is capable of taking a block specimen of 610 x 584 x 305 mm (24 x 23 x 12 in.) and applying true triaxial stresses up to 10 MPa (1450 psi). Leak-off was incorporated. Boundary displacements were measured. Effects of the least principal stress and injec- tion rate on fracture propagation were studied. Con- siderable data have been produced for interpretation. From these tests, the following conclusions were drawn.
Effects of the least principal stress • The rate of fracture propagation decreases with a
rise in the least principal stress (0"3). This decrease is characterized by the change in bottomhole pressure post breakdown. When the least principal stress is zero or low, bottomhole pressure consists of plunges and drops following an instantaneous rise, and a fracture rapidly propagates in a step-like manner. For the high least principal stress, bottomhole pressure post breakdown drops gently and the fracture propagates slowly and under control.
• The decrease in the rate of fracture propagation is also characterized by boundary displacements perpen- dicular to the fracture. For the low least principal stress, a large boundary displacement appears. For a high least principal stress, a low boundary displacement is pro- duced.
• Radial flow dominates leak-off before breakdown. The linear flow along the fracture dominates flow of fracture fluid after breakdown, and leak-off from the fracture into rock is the main leak-off mode after breakdown. The breakdown is a transient point between the two flow modes.
202 GUO et al.: HYDRAULIC FRACTURE PROPAGATION: EXPERIMENTS
• The breakdown pressure can be related to ~3 rather than 3a3--O'rana x under some experimental conditions. The tensile strength calculated from hydraulic fracturing is 34 times as high as the tensile strength from the Brazilian tests and the splitting tests. The breakdown pressure is extremely high and is not capable of being predicted by the tensile strength and the state of stress on the wall of a well according to common theories.
Effec ts o f injection rate
• For cases without stresses, fracture propagat ion post breakdown is always extremely rapid. Injection rate seems not to control the behavior of fracture propa- gation in this period. Injection rate has a strong influence on breakdown pressure and build-up of bottomhole pressure before breakdown for cases without stresses. The data produced by this set of tests are informative for understanding and interpretation of breakdown pressure.
• For cases with stresses, the conclusions from the step rate test and constant injection rate tests are the same. A low injection rate results in a slow decline in bot tom- hole pressure post breakdown and a low boundary displacement. Most of the fracture fluid leaks off into rock radially. Fracture propagat ion is slow. Therefore, fracture efficiency is low. Conversely, a high injection leads to a quick decline in bottomhole pressure post breakdown and a large boundary displacement. Most of the fracture fluid is used to create a fracture. A fracture propagates rapidly. Hence fracture efficiency is high, which means that at the same amount of fracture fluid in injection, a longer and wider fracture is produced. High breakdown pressure accompanies a high injection rate.
In addition, the experimental results showed also that the intersection of a fracture with a surface of specimens is symbolized by a sudden drop in bottomhole pressure.
The pressure loss in the fracture results in high bottom- hole pressure after a fracture intersects with the surface of a specimen. Boundary displacements, like bottomhole pressure, are capable of characterizing fracture propa- gation.
Acknowledgements--The authors wish to acknowledge the Natural Sciences and Engineering Research Council of Canada and Shell Canada Ltd for the financial support for this project.
Accepted for publication 21 December '1992
REFERENCES
1. Gidley J. L., Holditch S. A., Nierode D. E. and Veatch R. W. Recent Advances in Hydraulic Fracturing, Vol. 12. Monograph Series, SPE, Richardson, TX (1989).
2. Mendelsohn D. A. A review of hydraulic fracture modeling--part I: general concepts, 2D models, motivation for 3D modeling. ASME J. Energy Resour. Technol. 106, 369-376 (1984).
3. Mendelsohn D. A. A review of hydraulic fracture modeling--part II: 3D modeling and vertical growth in layered rock. ASME J, Energy Resour. Technol. 106, 543-553 (1984).
4. Veatch R. W. Jr and Moschovidis Z. A. An overview of recent advances in hydraulic fracturing technology. Soc. Petrol. Engrs Jl 26, 421~,54 (1986).
5. Biot M. A., Medlin W. L. and Mass6 L. Laboratory experiments in fracture propagation. Paper SPE 10377 presented at the 1981 Eastern Regional Meeting. Columbus, OH (1981).
6. Medlin W. L. and Mass~ L. Laboratory experiments in fracture propagation. Soc. Petrol. Engrs Jl 24, 256-268 (1984).
7. Rubin M. B. Experimental study of hydraulic fracturing in an impermeable material. J. Energy Resour. Technol. 105, 116-124 (1983).
8. Johnson E. and Cleary M. P. Implications of recent laboratory experimental results for hydraulic fractures. Paper SPE 21846 presented at the Rocky Mountain Regional Meeting and Low- Permeability Reservoirs Symp., Denver, CO (1991).
9. Guo F., Morgenstern N. R. and Scott J. D. An experimental investigation into hydraulic fracture propagation--Part 1. Exper- imental facilities. Int. J. Rock Mech. Min. Sci. & Geomech, Abstr. 30, 177-188 (1993).
10. Cedergren H. R. Seepage, Drainage, and Flow Nets. Wiley, New York (1977).
1 I. Zoback M. D., Rummel F., Jung R. and Raleigh C. B. Laboratory hydraulic fracturing experiments in intact and pre-fractured rock. Int. J. Rock Mech. Min. Sci. & Geomech. Abstr. 14, 49-58 (1977).