Embed Size (px)
Citation preview

FIBRES & TEXTILES in Eastern Europe April / Juni 2006, Vol. 14, No. 2 (56)64 65FIBRES & TEXTILES in Eastern Europe April / Juni 2006, Vol. 14, No. 2 (56)
n IntroductionConsidering their end uses, towels should display certain properties such as appropriate hydrophility, softness, and dimensional variation (dV), of which hy-drophility is the most important quality parameter. Since towels are frequently washed for hygiene, dimensional varia-tion after washing is also an important property. General descriptive informa-tion about their properties and perform-ance has been given in detail in Part I of our publication [1]. In this article, only hydrophility degree (HD), and dimen-sional variation are outlined.
The parameters affecting humidity absorption have been theoretically in-vestigated by Anis [2]. In this study, a model was developed giving optimum absorption value for evaluated towels. It was seen that the pile height (HP) value could not be higher than a definite value beyond which the loop cannot bear (re-sist) its weight.
Bozgeyik has experimentally investigat-ed the effect of different parameters on the hydrophility degree and dimensional variation of a handling towel [3]. The results showed that while hydrophility degree was not affected by the number of thread and the aerial density (dA) of the towels, the water absorption (WA) increased with the increase in aerial den-sity, and hight pile.
The parameters affecting the properties in use such as dimensional variation and the friction fastness of towels have also been investigated by Funder et al. [4]. They suggested certain correlations be-tween physical properties and properties during daily use.
An Experimental Approach on the Performance of Towels Part II. Degree of Hydrophility and Dimensional Variation
Belkis Zervent, Erdem Koç
Çukurova University,Department of Textile Engineering,
01330 Adana, TurkeyE-mail: [email protected]
The effects of repeated application of laundry softeners on fabric properties were studied experimentally by Anon [5].Various terry towels were treated through ten laundering cycles, and next the towel properties were evaluated. The investiga-tion carried out by Cary & Sproles com-pared five methods for measuring the moisture absorbency of terry towels [6]. The results indicated that the porous plate and sliding block methods might potentially be used for measuring the moisture absorbency of towels. Swani et al. [7] have compared the performance properties of terry towels made from open-end and ring-spun yarns. They stated that there was no difference in the water absorption rate, but the maximum absorption for OE towels was found to be better than that of ring-spun towels at a lower fabric density, as well as for a comparable fabric aerial density. Wasiak & Snycerski’s investigation concerned the influence of the type of raw materi-als, the fabrics’ structure, and the water absorption ability and handle of terry wo-ven fabrics [8]. Nostadt & Zyschka [9] have evaluated the effect of softeners on the softness and hydrophility properties of towels, and explained that hydrophilic softeners are the most convenient for use.
Further studies have been carried out by Koç and Zervent taking into account the effects of physical, production, and performance properties on the defined performance of selected towel samples experimentally, and the results have been discussed [10, 11]. Zervent experimental-ly investigated the relationship between physical properties, selected production parameters, and the performance of tow-els [12]. The results obtained showed that the softness of towels decreased with the increase in aerial density and pile height,
although the aerial density and hydro-phility degree of the towels could not be related to each other systematically.
In this paper, the results of the experi-mental study performed for determining the parameters affecting the hydrophil-ity degree and dimensional variation in towels are presented. These parameters are considered as physical properties. The pile height, and dimensional varia-tion of the towels have been measured on selected towel samples, and the results obtained were evaluated.
n Experimental proceduresAs explained in the first part of this in-vestigation [1], the towel performance has been examined by applying Turkish standards. Here the standards concerning hydrophility degree and percentage of di-mensional variation of towel samples are briefly described, and the corresponding procedures given below.
Determining the degree of hydrophilityIn order to determine the hydrophility degree of samples, one of the methods known as the ‘sinking Test’ was adapted to the experiment as described in TS 866, which is called ‘Determination of absorbency of bleached cotton textile materials’ [13]. According to the sink-ing test, the prepared towel samples are put in a pot full of water and the sinking time (ts) of a sample is measured. This procedure is repeated three times with different samples for one towel, and the arithmetical mean of the results is taken. The mean sinking time identifies the hy-drophility degree of samples measured in seconds. For any towel, the smaller the value of sinking time which is found, the
Abstract In this experimental study, the relationship between the towel performance (hydrophility and dimensional variation properties) and selected physical & production parameters such as pile height, aerial density, type of softener etc. was obtained. For this purpose, the degrees of hydrophility and dimensional variation after washing the selected towel samples were tested according to the relevant standards, and the results obtained were analysed.
Key words: performance of towels, hydrophility, dimensional variation.
FIBRES & TEXTILES in Eastern Europe April / Juni 2006, Vol. 14, No. 2 (56)64 65FIBRES & TEXTILES in Eastern Europe April / Juni 2006, Vol. 14, No. 2 (56)
higher the hydrophility degree of the cor-responding towel will be. In other words, the sinking time for any towel should be as small as possible to give a higher hy-drophility degree. According to the Turk-ish Standard TS 629 (‘Terry towels and terry toweling’), when the hydrophility degree or sinking time is less than fifty seconds, the towel is called a hydrophilic towel.
Since the sinking test is known to be the most convenient method for towels, this method was applied to determine the hydrophility degree of samples in this study. In addition to this method, the determination of hydrophility degree can also be performed with the ‘drop test’ and the ‘potassium chromate test’.
According to TS 866, in the drop test, the prepared towel samples 20×20 cm in size are put on a hoop. Next, a distilled water drop is dripped onto the sample with a burette, and the absorption time of the drop of water is measured. This procedure is repeated ten times, and the arithmetical mean of these measured values is taken. The smaller the dropping time, the higher the hydrophility degree of corresponding towel will be.
Another method used to determine the softness degree is the ‘potassium chro-mate test’ which is based on DIN 54924. In this method, five samples 3×25 cm in size in both warp and weft directions are prepared. Each sample is dipped into potassium chromate solutions from the tip of the sample, and the rising level of solution is measured consequently at 10, 30, 60, and 300 seconds. The arithmeti-cal means of the 20 rising level measure-ments are taken in both warp and weft directions separately, and the results of these two values are examined. In gen-eral application, these two values are very similar to each other. Changing the towel type may give different values than that of the previous ones. To call a towel more hydrophilic, the measured value of the rising level of potassium chromate solution for that towel should be higher than those of the towel compared.
Determining dimensional variationThe dimensional variation of towel samples after washing is found by con-sidering TS 392 which is known as ‘de-termination of dimensional change after washing’ [15]. According to this method, three different lines of 50 cm length are
marked in weft and warp directions on the surface of a sample towel of a given size. The numbers of marked lines are three in each direction, or six in total for one sample. The sample prepared in this way is washed in a standard washing machine under certain conditions. After washing, the sample is dried and the line displacements measured. Then either the geometrical variation of related lines detected are calculated separately as a percentage and the the arithmetical mean of corresponding three values mentioned above is taken; or the dimensional varia-tion after washing can be determined di-rectly by using a standard ruler known as a Sanfor ruler. These measurements have been repeated for both weft and warp directions. Like the other performance parameters, the value of dimensional variation of a sample should be as small as possible.
In addition to this method, the dimen-sional variation can also be determined in accordance with ISO 5077 ‘Textiles: Determination of dimensional change in washing and drying’ [16]. According to this standard, wherein the original length and width of the samples were measured, the samples are washed and dried according to one of the procedures specified in ISO 6330. After washing and drying, the dimensions are measured, and consequently the dimensional change is calculated.
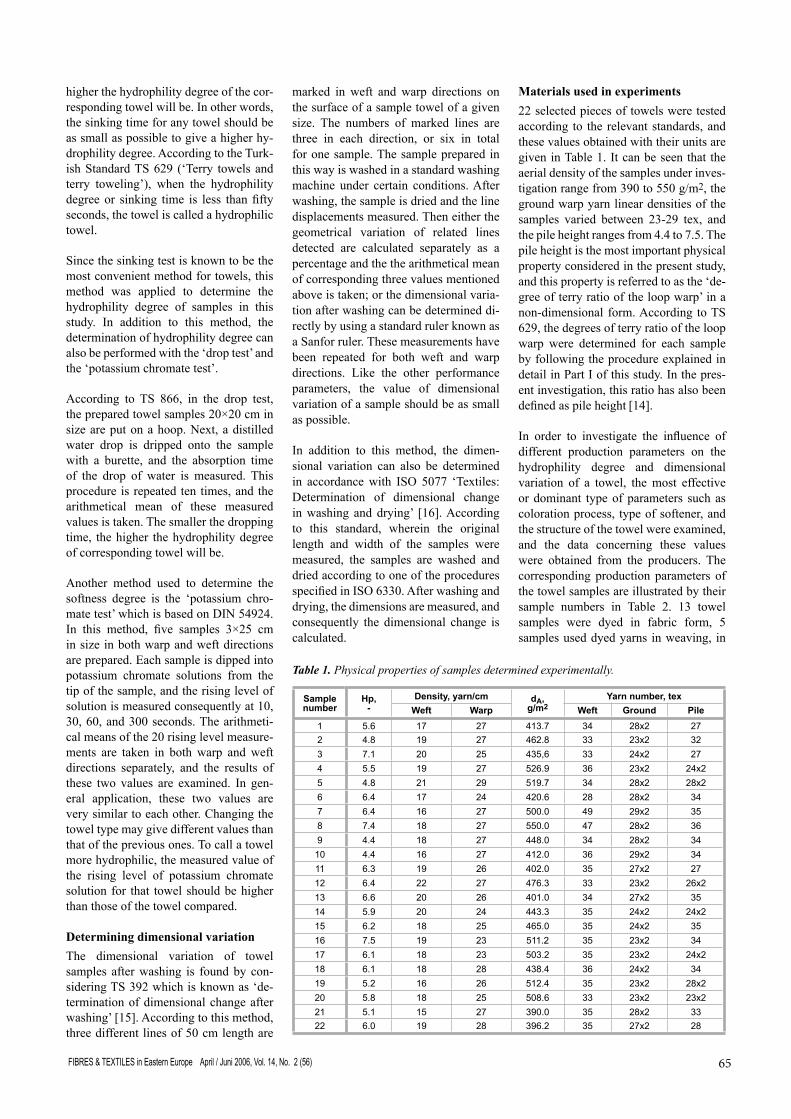
Materials used in experiments22 selected pieces of towels were tested according to the relevant standards, and these values obtained with their units are given in Table 1. It can be seen that the aerial density of the samples under inves-tigation range from 390 to 550 g/m2, the ground warp yarn linear densities of the samples varied between 23-29 tex, and the pile height ranges from 4.4 to 7.5. The pile height is the most important physical property considered in the present study, and this property is referred to as the ‘de-gree of terry ratio of the loop warp’ in a non-dimensional form. According to TS 629, the degrees of terry ratio of the loop warp were determined for each sample by following the procedure explained in detail in Part I of this study. In the pres-ent investigation, this ratio has also been defined as pile height [14].
In order to investigate the influence of different production parameters on the hydrophility degree and dimensional variation of a towel, the most effective or dominant type of parameters such as coloration process, type of softener, and the structure of the towel were examined, and the data concerning these values were obtained from the producers. The corresponding production parameters of the towel samples are illustrated by their sample numbers in Table 2. 13 towel samples were dyed in fabric form, 5 samples used dyed yarns in weaving, in
Table 1. Physical properties of samples determined experimentally.
Samplenumber
Hp,-
Density, yarn/cm dA,g/m2
Yarn number, texWeft Warp Weft Ground Pile
1 5.6 17 27 413.7 34 28x2 272 4.8 19 27 462.8 33 23x2 323 7.1 20 25 435,6 33 24x2 274 5.5 19 27 526.9 36 23x2 24x25 4.8 21 29 519.7 34 28x2 28x26 6.4 17 24 420.6 28 28x2 347 6.4 16 27 500.0 49 29x2 358 7.4 18 27 550.0 47 28x2 369 4.4 18 27 448.0 34 28x2 34
10 4.4 16 27 412.0 36 29x2 3411 6.3 19 26 402.0 35 27x2 2712 6.4 22 27 476.3 33 23x2 26x213 6.6 20 26 401.0 34 27x2 3514 5.9 20 24 443.3 35 24x2 24x215 6.2 18 25 465.0 35 24x2 3516 7.5 19 23 511.2 35 23x2 3417 6.1 18 23 503.2 35 23x2 24x218 6.1 18 28 438.4 36 24x2 3419 5.2 16 26 512.4 35 23x2 28x220 5.8 18 25 508.6 33 23x2 23x221 5.1 15 27 390.0 35 28x2 3322 6.0 19 28 396.2 35 27x2 28

FIBRES & TEXTILES in Eastern Europe April / Juni 2006, Vol. 14, No. 2 (56)66 67FIBRES & TEXTILES in Eastern Europe April / Juni 2006, Vol. 14, No. 2 (56)
3 samples optical bleaching operations were applied as finishing, and one sample was processed by printing (No 22). In ad-dition to these, 2 samples were processed with cationic softeners (No 11, and 16), and the rest with silicone softeners.
n Experimental results and discussion
In this experimental study to analyse the effect of aerial density, pile height and different production parameters on the hydrophility degree and dimensional variation values of the samples, the hydrophility degree and percentage dimensional variation of selected samples were determined by applying the procedures explained above, and we discuss the more important of the results which we obtained.
Parameters affecting the degree of hydrophilityIn order to determine the influence of the pile height and aerial density values on the hydrophility degree, the sinking time of all samples were measured before the washing process. The sinking time of the towel represents the hydrophility degree of the corresponding sample. When these measurements were evaluated, it was seen that sample 3 has the highest hydrophility degree with 2 seconds, and the sample 22 has the least hydrophility degree. Sample 3 was produced with the fabric-form dyeing method, whereas sample 22 was coloured in a printing process; both of these samples were processed as un-cut pile form with silicone softener.
The variation between the hydrophil-ity degree of examined samples and the pile height is shown in Figu-
Table 2. Selected production parameters of sample towels; F - Fabric-form dyeing, Y - Yarn dyeing, O - Optical Bleach, P - Printing, S - Silicone, C - Cationic, N - Non-ionic, A - Anionic, U - Un-cut pile, V - Velvet.
Sample number
Colouration process
Type of softener
Velvet or un-cutpile
towel1-10 F S U11 F C U
12, 13 F S V14 Y S V
15, 17, 18 Y S U
16 Y C U19 - 21 O S U
22 P S U
res 1 & 2. In these figures, the vertical distance corresponds to ts in seconds, and the other axis represents the pile height of the samples; the different scales for the six curves should be noted. For a systematic analysis, the samples with the same physi-cal properties (densities, yarn linear densi-ties, etc.) have been grouped according to their aerial density intervals such as 412-435 g/m2. In the figures, the samples with the almost same physical properties, apart from pile height, were selected, and the hydrophility degree (sinking time) against various pile height values were illustrated.
In each variation, the measured values are represented by solid lines, whereas the expected sinking time values cor-respondingly calculated with the use of the equations obtained are represented by dashed lines. In this evaluation, as in part I, the samples being produced by silicone softener, dyed in fabric form and having an un-cut pile type structure were defined as ‘reference samples’ and their properties were called ‘reference proper-
ties’. The expected sinking time values of these samples have been accepted as almost the same as the measured values. The relationship between pile height and sinking timebelonging to these reference samples can be seen in Figures 1a and 1b. The simple regression equations obtained and the relevant curves fitted are given in Figures 1c and 1d. These equations were used to predict the expected sinking time of a sample whose properties differ from the reference samples. It may be seen that the correlation coefficients (R2) of these equations are considerably higher. In other words, the correlation between pile height and sinking time is strong. In these figures, y represents sinking time in seconds and x represents the pile height value. It can be seen from Figures 1a and 1b that, in general, increasing the pile height of the reference samples decreases ts, which is interpreted as an increase in the hydrophility degree. So the larger the pile height found, the smaller is the sink-ing time value of the corresponding tow-el. The general trend obtained with these
Table 3. Measured and predicted bending resistances of selected reference samples.
Sample No
Pile height
Sinking time, s Sample No
Pile height
Sinking time, smeasured predicted measured predicted
10 4.4 8 7.96 5 4.8 22 21.571 5.6 4 4.15 4 5.5 16 17.056 6.4 3 2.67 7 6.4 14 13.123 7.1 2 2.06 8 7.4 11 11.25
Figure 1. The sinking time/pile height variation of reference samples.

FIBRES & TEXTILES in Eastern Europe April / Juni 2006, Vol. 14, No. 2 (56)66 67FIBRES & TEXTILES in Eastern Europe April / Juni 2006, Vol. 14, No. 2 (56)
reference samples was used to evaluate the behaviour of the other samples.
The predicted values calculated with these equations and the experimentally measured sinking time values of the sam-ples considered in Figures 1a and 1b are given in Table 3 for comparison. It can be seen that there is a good agreement among the calculated and measured sink-ing time values.
In order to explore the effect of the vari-ous production parameters and physical properties selected on the sinking time of the towels, the variations given in Figure 2 were obtained. The sinking time values of some samples deviated from the gen-eral trend (i.e. samples 18, 22, 13, and 11). These deviations were attributed due to the samples having different properties than those of the reference samples. Due to the scale adopted in the figure, some of the measured values belonging to certain sam-ples fell beyond the scale, and hence those values were not included in the figure.
In order to determine the real positions of the deviated points mentioned above, the prediction equations given in Figures 1c and 1d have been adopted. Therefore, if a sample had the same production param-eters with the reference sample, it would take the experimental value coinciding with a point located on the dotted curve on the figures.
In Figure 2a, three samples with a aerial density within 412-438 g/m2 were consid-ered. Because samples 10, 6, and 3 have reference properties, the measured and pre-dicted values of these samples coincided. However, the value of sample 18 deviated from the general trend described in Fig-ure 1. While the measured sinking time of this sample is 7 seconds, the expected value is calculated as 3.9 seconds. This discrepancy would appear to be due to the coloration process of this sample; it is thus apparent from Table 2 that this sample was processed with dyed yarns, which causes the relatively high experimental value.
A considerable difference was seen be-tween the predicted and measured sinking time in the case of sample 22 (Figure 2b), as this sample was produced by printing different from the reference samples. Experiments showed that this sample yielded 306 seconds sinking time and if this sample was produced in dyed fabric form, the corresponding sinking time would clearly be described as down to 3.5
seconds, which in turn increased the hy-drophility degree as shown in the figure.
Similar behaviour in the case of sample 13 has been illustrated in Figure 2c. The higher experimental value obtained in this case may be explained as arising from the sample’s structure. If this sample had a reference property (un-cut pile towel), the sinking time for this sample would be lower than that of the measured value.
Figure 2d demonstrates the results of three samples (10, 1, and 11), and there seemed to be a visible deviation in the re-sults obtained for sample 11. The reason for this difference could be attributed to the production parameters of the sample, as sample 11 was processed with cationic softener. We can thus state that this fea-ture of production leads to considerably high sinking time.
The effect of the washing process on hydrophilityIn this study, the influence of the washing process on the hydrophility degree of the towel was also investigated. For this pur-pose, so as to determine the dimensional variation, the towel samples were washed by the following method described above, and the sinking time (hydrophil-ity degree) of the washed samples were measured according to the TS 866 ‘sink-ing test’. The sinking time of selected
samples before and after washing are illustrated with the sample numbers in Table 4. It can be seen that consider-able differences exist between the two values. The sinking times obtained for samples before washing are in general greater than those obtained after wash-ing, which means that the washing proc-ess causes a higher hydrophility degree. For sample 22, the sinking time before and after washing have been recorded as 306 seconds and 7 seconds respectively. From this table, it can be stated that the
Figure 2. The variation of hydrophility degree with pile height.
Table 4. The sinking time of before and after washing process.
Sample number
Sinking time, sbefor washing after washing
1 4 32 11 34 13 35 25 256 3 37 14 48 14 3
11 146 1112 66 413 38 414 29 316 159 217 9 218 7 219 18 320 32 321 6 322 306 7

FIBRES & TEXTILES in Eastern Europe April / Juni 2006, Vol. 14, No. 2 (56)68 69FIBRES & TEXTILES in Eastern Europe April / Juni 2006, Vol. 14, No. 2 (56)
washing process is an important pa-rameter in defining the sinking time or hydrophility degree of towels.
Parameters affecting dimensional variationTo determine the relationship between the dimensional variation and selected physi-cal properties and production parameters of the samples, the towel samples were washed in accordance with TS 392 ‘de-termination of dimensional change after washing’, and the percentage dimen-sional variation of all samples in both weft and warp side were measured. In general, the dimensional variation or size change of towel sample may be in the form of shrinkage or extension, and the acceptable limits are around 2% for weft and 4% for warp side. In addition to this, according to ASTM D5433-00, the acceptable limits of weft and warp side for towels are 5% and 10% respectively [17]. From the experiments carried out, it appears that all the samples under investigation seemed to shrink after the washing process. It was observed that the shrinkage values recorded for 3 samples occurred in the weft side were found to be over the limits described above.
Effect of the pile highness on dimen-sional variationThe variation of dimensional change with the pile height of towels for differ-ent aerial density, as well as the shrinkage values of both weft and warp side of se-lected towels, are demonstrated in Figure 3. Here, each curve corresponds to the variations obtained with the samples with the same physical properties apart from pile height. As in the evaluation of hydrophility degree, here some samples have also been defined as ‘reference sam-ples’. It can be seen that increasing the pile height increases the percentage of dimensional variation. In addition to this, in all samples apart from the velvet tow-els, the measured dimensional change in the warp side seemed to be higher than that in the weft side. The general trend explained above can easily be seen from Figure 3a on which samples 2 and 3 are evaluated.
Figure 3b demonstrates the results for three samples of aerial density within 390-415 g/m2. Samples 21 and 1 were processed by silicone softener, whereas sample 11 was treated with a cationic softener. The dimensional change which occurred in sample 11 was higher than
that expected. This seems to be due to the softener used in the production of this sample. From the figures, the shrink-age value belonging to sample 21 in the weft side can be extracted as 1.5% and in the warp side as 3%, whereas sample 11 gives 4% in the weft side and 5.5% in the warp side.
Figure 3 (c) demonstrates the dimen-sional variation vs. pile height for three samples in a selected aerial density interval. The slope of the lines in the region marked as II seems to be steeper than that of region I. This increase is thought to be due to sample 17, which is obtained by dyeing yarns as the colora-tion process.
Effect of the aerial density on the di-mensional variationFigure 4 demonstrates the relationship between the aerial density and dimen-sional variation of the selected samples for both warp and weft sides. It can be
seen that, in general, the increase in aerial density decreases the dimensional variation in percent. In addition to this, the dimensional variation in warp side of all samples apart from the velvet towels were found to be higher than that of the other side.
The general trend can easily be seen in Figure 4a, and the samples considered in this figure have reference properties. In Figure 4b, two velvet towels with an pile height within 6.4-6.6 were evaluated, and it was determined that the dimensional variation recorded in the weft side gave relatively higher values than that of the warp side, in contrast with un-cut pile towels. This discrepancy would appear to be due to the type of structure of these samples.
The variation of three samples with an pile height within 5.5-6.0 was considered in Figure 4c. The dimensional variation values measured in both the weft and warp sides of sample 14 are found to
Figure 3. The dimensional variation versus pile height; ● - shrinkage in warp side, ■ - shrinkage in weft side.
Figure 4. The dimensional variation vs. aerial density; ● - shrinkage in warp side, ■ - shrinkage in weft side.

FIBRES & TEXTILES in Eastern Europe April / Juni 2006, Vol. 14, No. 2 (56)68 69FIBRES & TEXTILES in Eastern Europe April / Juni 2006, Vol. 14, No. 2 (56)
be close to each other, whereas those of the other samples are considerably dif-ferent. This difference is thought to be because sample 14 was obtained as a velvet form.
General evaluationIn order to examine the relationship be-tween the pile height, aerial density and sinking time values of some of the refer-ence samples more clearly, the variations demonstrated in Figure 5 have been re-introduced. This figure illustrates the regression curves as well as the fitted ex-perimental data. Here, region I of the pile height within 4-7.4 corresponds to the measured sinking time values, whereas region II demonstrates the extended por-tion of the behaviour predicted by using the regression equations. As can be seen from region I, increasing pile height up to a certain value (7.4), increases the surface being contacted with water and hence decreases the sinking time for both aerial density intervals. After this certain value, sinking time starts to in-crease slightly (region II), meaning that
at these relatively higher pile height val-ues, the loops tend to be bent with their aerial density and consequently cover the surface of the fabric, which in turn restricts the water absorption [2]. From this figure, it is also easy to predict the sinking time values for any pile height and aerial density intervals. In addition to this, the variations exhibited in Figu-res 1 & 5 can be used as a model to pre-dict the behaviour of any towel in terms of sinking time.
Examining the variations illustrated in Figure 2, the production parameters have been found to have dominant ef-fects on the sinking time values. As seen in Figure 2 (b), the printing process nat-urally decreases the hydrophility degree of the towels due to creating a film layer on the surface of the fabric examined. On the other hand, the cationic soften-ers have been found to be inconveniant for towels, owing to the corresponding chemical structure (sample 11, Figure 2d). The sinking time value of sample 13 in Figure 3 (c) was found to be better
than that of the uncut pile towels; this is attributed to the twist loss of the pile warp being opened after cutting process, and hence causing a decrease in water absorption.
Since in this type of fabric, the piles are produced on the warp side, the hy-drophility degree and hence the dimen-sional variation on this side were found to be higher than that of the weft side (Figures 3 & 4). However, as can be seen from Figure 4b, the dimensional changes in the weft side of the velvet towels were found to be higher than that of the other side, due to the structural properties of velvet, i.e. as a cutting pile.
Figure 5. The variations of sink-ing time with pile height; ♦ - 500--550 g/m2, ■ - 412--435 g/m2.
Table 5. Statistical analysis of variance results for hydrophility and dimensional variation; * - F0.05, 3, 3 = 9.28, F0.05, 1, 3 = 10.1, ** - F0.05, 1, 4 = 7.71.
ParameterSinking time
(hydrophility degree)Dimensional variation
Weft side Warp side
F value % contri-bution F value % contri-
bution F value % contri-bution
Pile height 12.15 > 9.28*22.57
0.016 < 7.71**17.11
0.82 < 7.71**3.85Statistical
evaluation significant not significant not significantWeight 122.08 > 10.1*
75.57
14.8 > 7.71**
78.61
10 > 7.71**
71.79Statistical evaluation significant significant significant
Pile height x weight - 1.86 - 4.28 - 24.36
Table 6. The results of statistical analysis for the washing process; * - F0.05, 1, 20 = 4.35, ** - t0.95, 10 = 1.81.
ProcessSinking time
F value t value
Washing process 7.20 > 4.35* 2.92 > 1.81**
Statistical evaluation significant significant
Table 7. The results of the t-student test; * - t0.95, 6 = 2.447, ** - t0.95, 4 = 2.776.
ParameterSinking time
(hydrophility degree)Dimensional variation
Waft side Warp side
Weight 2.94 > 2.447* 3.95 > 2.776** 3.00 > 2.776**
Statistical evaluation significant significant significant
Statistical analysisThe experimental results have been statis-tically evaluated by using Design Expert Analysis of Variance (ANOVA) software with F values of the significance level of α=0.05, with the intention of finding out whether there was any statistically significant difference between the varia-tions obtained. The results of the analysis of variance are given in Table 5. It may be seen that there was a statistically sig-nificant difference for the sinking time of samples tested in terms of pile height and aerial density. In other words, the table shows that pile height, and aerial density have significant effects on the towel’s hydrophility degree. On the other hand, the differences in the dimensional variation of both sides of samples with a certain pile height were determined as in-significant. In addition to this, it was seen that there was a significant difference between the dimensional variation values for different aerial density values.
The data has also been evaluated to cover the relative importance of each source of variation in the ANOVA. The results obtained in this way are also given in Ta-ble 5. The effect of pile height accounted for 22.57% of total variation in ts, where-as the aerial density was a major factor

FIBRES & TEXTILES in Eastern Europe April / Juni 2006, Vol. 14, No. 2 (56)70
contributing to 75.57% of total variation. The percent contribution values of aerial density for dimensional variation of the weft and warp sides were determined as 78.61% and 71.79% respectively.
In order to determine the influence of washing process on the hydrophility de-gree of towels, a statistical analysis was also applied. In Table 6, a statistically sig-nificant difference between sinking time after and before washing was determined according to variance analysis and the t-test. Hence, it was inferred that the influ-ence of the washing process on hydrophil-ity degree was primarily important.
In addition to variance analysis, the t-Student test has also been applied, and the sinking time and dimensional varia-tion values of the weft and warp sides of the reference samples have been evalu-ated at two different aerial density inter-vals. As seen from Table 7, a significant difference was determined in this case for the significance level of α=0.05.
n ConclusionsWith the experimental study carried out for investigating the performance of tow-els with special reference to the effects of hydrophility degree and dimensional variation, the conclusions drawn are outlined below.
1. It was shown that the hydrophility de-gree and dimensional variation values of the towels after washing had pri-mary importance for the towels. The physical properties and the production parameters of the samples used in the experiments have also been found to be the most effective parameters in determining the performance of the towels, i.e. pile height, aerial density, softeners and the coloration process.
2. The experiments showed that the type of softener affects hydrophility degree to a great degree. The high-est hydrophility degree or the lowest sinking time was ensured with sili-cone softener, and the other softeners clearly decreased the hydrophility degree of towels.
3. Since a layer on the coloured surface of towel is formed during the print-ing process, the hydrophility degree of printed towels should have a low value. In addition to this, the sink-ing time of towels produced with
dyed yarns was higher than that of the towels dyed in fabric form. The hydrophility degree of the uncut pile towels was found to be better than that of the velvet towels.
4. In general, increasing the pile height decreases sinking time , which is inter-preted as increasing the hydrophility degree. However there must be a certain limit for the pile height value beyond which the hydrophility degree tends to be decreased. This limit de-pends on the yarn number, twist, type of raw material and density, and varies from towel to towel. Up to this limit, an increase in pile height is desired from the hydrophility degree point of view, although the undesirable case occurs with respect to softness degree, as the increase in pile height generally decreases the softness degree.
5. The washing process appeared to be an important parameter in defining sinking time or hydrophility degree in a towel, as the sinking time detected in washed towels became lower than that of the towels which did not undergo any washing process.
6. By using the results displayed in this paper, it is possible to predict the sink-ing time of any towel with aerial den-sity and pile height values. In other words, the variations exhibited in Fig-ure 5 can be used as a model to predict the behaviour of any towel in terms of sinking time.
7. From the experiments carried out, it has been seen that all the samples under investigation appeared to shrink after the washing process. In addition to this, in all samples apart from the velvet towels, the dimensional change in warp side was measured to be higher than the variation in the weft side and in general, increasing the pile height increases the percentage of dimensional variation, and increasing the aerial density decreases the dimen-sional variation of towels.
8. It may be seen from the results of the statistical analysis that there was a statistically significant difference for the sinking time values of the sam-ples tested in terms of pile height and aerial density. On the other hand, the differences in the dimensional varia-tion of both sides of samples with a certain pile height were determined as not being significant. It was also seen that there was a significant difference Received 15.04.2005 Reviewed 17.08.2005
between the dimensional variation values for different aerial density val-ues. Lastly, a statistically significant difference between sinking time as measured before and after washing was determined according to both the variance analysis and the t-test.
References 1. Koç E., Zervent B., Fibres & Textiles in
Eastern Europe, vol. 14, No. 1(55), pp. 39-46, 2006.
2. Aniş P., ‘Investigation to the Effect of Woven Structure on the Fabric Proper-ties with a Computer Model in Towel Fabrics’ (in Turkish), M.Sc. Thesis, Univ. of Uludag, Inst. Of Nat. and Appl. Sci., Dep. Of Text. Eng., Bursa, 1989.
3. Bozgeyik K., ‘A Quantitative Investigation about Towels (in Turkish), M.Sc. Thesis, Univ. of Ege, Inst. of Nat. and Appl. Sci., Dep. of Text. Eng., Izmir, 1991.
4. Funder A., Hoppe K., Heim H., Using and Cleaning Handle of Terry Fabrics (in Turkish), Tekstil Maraton Dergisi, Vol.1, pp.72-78, 1997.
5. Anon, Textile Chemist and Colourist, Vol. 4, No. 1, pp. 49-54, 1972.
6. Cary R. T., Sproles G. B., Text. Res. J., Vol. 49, No. 12, pp. 691-698, 1975.
7. Swani N. M., Hari P. K., Anandjiwala R., Indian J. Text. Res., vol. 9, No. 3, pp. 90-94, 1984.
8. Frontczak-Wasiak I., Snycerski M., Fibres & Textiles in Eastern Europe, Vol. 12, No. 1(45)2004.
9. Nostadt K., Zyschka R., Softeners in the Textile Finishing Industry , Colourage, pp. 53-58, 1997.
10. Zervent B., Koç E., J. Text. & Techn., pp. 188-198 (in Turkish), August, 2003.
11. Koç E., Zervent B., Text. & Techn., pp. 334-344 (in Turkish), October, 2003.
12. Zervent B., Towel Production and in-vestigation of the Parameters that Affect the Product Quality (in Turkish), M. Sc. Thesis, Univ. of Cukurova, Inst. of Nat. and Appl. Sci., Dep. of Text. Eng, Adana, 2002.
13. TS 866, Determination on Absorbency of Bleached Cotton Textile Materials (in Turkish), Turkish Stand. Inst., Ankara, 1985.
14. TS 629, Terry Towels and Terry Towelling (in Turkish), Turkish Stand. Inst., Ankara, 1991.
15. TS 392, Determ. Of Dimensional Change After Washing , Turkish Stand. Inst., An-kara, 1973.
16. ISO 5077, Textiles-Determination of Dimensional Change in Washing and Drying , Int. Org. for Stand., 1984.
17. ASTM D 5433-00, Stand. Perform. Spec. for Towel Products for Institutional and Household Use, Am. Soc. For Testing and Materials, Pennsylvania, 2000.