Embed Size (px)
Citation preview
©2018. This manuscript version is made available under the CC-BY-NC-ND 4.0 licensehttp://creativecommons.org/licenses/by-nc-nd/4.0/Published article can be found at: https://doi.org/10.1016/j.triboint.2017.01.005
An experimental approach for investigating scuffing initiation due tooverload cycles with a twin-disc test device
Matti Savolainen, Arto LehtovaaraGroup of Tribology and Machine Elements
Department of Materials Science, Tampere University of TechnologyPO BOX 589, 33101 Tampere, Finland
Abstract
This paper presents an investigation into the effect of unexpected overloading on scuffing initiation with a twin-disctest device. An existing twin-disc test device was modified to be suitable for applying overloading dynamically to thedisc contact. Three test series including three pairs of discs in each series were subjected to combined normal forceand rolling/sliding loading. First a base level for scuffing initiation was defined by increasing the normal load stepwiseuntil failure, while keeping the rolling and sliding between the discs constant. In the subsequent test series, theoverload cycles were applied at a significantly lower level in two different patterns leading to scuffing at both an earlierand later stage than was observed for the base level.
Keywords: Scuffing, twin-disc, overload, friction.
1. Introduction
Bevel gears in ship shafting lines often experience occasional overload cycles caused by propeller impacts on hardobstacles e.g. ice floes. The gear teeth have long been dimensioned against dynamic loads using load influence factors.However, occasional overload cycles are usually not noticed as a separate factor and therefore their role is neithervisible nor accounted for in gear dimensioning.
The exact initiating mechanism of scuffing failure is not fully understood, although there appears to be a closerelationship between a scuffing failure and lubricant film breakdown as noted in e.g. Ref. [1]. High surface pressure andsliding velocity with consequent frictional heating may affect the thickness of the lubrication film, whose decreasingviscosity leads to damaging asperity contact.
In addition, shear stresses play a key role in determining the film’s thickness in an EHL contact between the rollingsurfaces and the lubricant. However, a lubricant can only withstand a limited shear stress [2, 3]. If this limit is exceededand if the maximum allowable shear stress in the oil is more dependent on the oil’s temperature than viscosity, a thinneroil film may result because less oil is dragged into the contact area [4].
Another factor to consider is that a transient load rise instantly reduces the lubricant film thickness at the same timeincreasing the friction coefficient [5], which increases the potential for asperity contacts. It has also been reported that atemperature rise in the lubricant film profile occurs under heavy loading, due to the compression and the viscous friction[6, 7] increasing the risk for a scuffing failure.
The risk of scuffing is also known to be high during the initial settling of contacting surfaces often termed ‘running-in’,which is defined as the series of processes of wear rate and friction stabilisation for lubricated contacts [8]. In fact, thenature of scuffing is different than other gear failure modes in that it may be initiated after only a short period of severeload cycles in harsh conditions. Hence, rarely occurring occasional overload cycles may shorten the gear’s life timesignificantly through a scuffing failure.
The flash temperature method is a widely-used approach to calculate the risk of scuffing. It was originally proposed byBlok [9] in 1937 and further enhanced by Jaeger [10] and Archard [11]. The basis of the theory is in the calculation of
©2018. This manuscript version is made available under the CC-BY-NC-ND 4.0 licensehttp://creativecommons.org/licenses/by-nc-nd/4.0/Published article can be found at: https://doi.org/10.1016/j.triboint.2017.01.005
the maximum contact temperature tc, which is an indication of the risk for a scuffing failure. This temperature isconsidered to be the sum of the bulk temperature tb and the flash temperature tfmax generated in the contact as follows:
maxfbc ttt += (1)
One of the challenges with the above theory is the evaluation of the bulk temperature. In many cases this can be foundby measurement, but an analytical approach based on loading is presented in Ref. [12]. Also recently Xue et al. proposeda method for predicting scuffing failure in spur gear pairs by means of a transient thermal solver [7]. This includes atemperature rise formula based on transient heat flux and a transient thermal elastohydrodynamic lubrication (TEHL)model, which takes into account the dynamic loads.
The experimental approach for finding the scuffing load-carrying capacity of a lubricant-material pair is traditionallydefined by conducting FZG test procedures described in the standards [13]. Additionally, several scuffing studies havebeen performed with both the FZG device [1] and with bevel-gear-based test devices [14, 15]. The focus has been onvariating the used lubricant, the influence of the oil temperature and the applied loading, amount of the oil supplied andthe effect of a coating on the contact surface. Despite the stability of the results delivered, the possibilities forinvestigating a wider range of parameters is somewhat limited; often requiring a new design for the gear wheels. Inaddition, several scuffing studies have been performed by variating the above mentioned parameters, but observing thebehaviour of a piston ring and liner contact [16, 17, 18]. However, an obvious difference exists between the conditionsin comparison to a gear teeth contact.
A new approach to the scuffing test has recently been presented [19]. This utilises a ball-on-disc test device with contra-rotating surfaces to limit the EHD films. This arrangement enables the determination of the boundary lubricationconditions over a wide range of sliding speeds.
With the twin-disc test device, the elliptical pressure distribution, which is seen between the gear teeth in e.g. spiral bevelgears, can be reproduced [20, 21]. This is done through the precise definition of the discs’ geometries. Furthermore, thestructure of the device enables the actual loading of the contact to be highly adjustable. Over the years, the twin-disctest device has been used to study the behaviour of friction, pitting formation, wear prediction and the influence of surfaceroughness [22, 23, 24, 25]. The effect of different surface conditions on scuffing initiation has been also investigated[26]. However, there has not been much research focusing on the effect of variable loading on scuffing failures, whichis the main topic of this paper. The paper presents the first result of an investigation of the relationship between overloadcycles and the initiation of scuffing using a twin-disc test device.
2. Test equipment
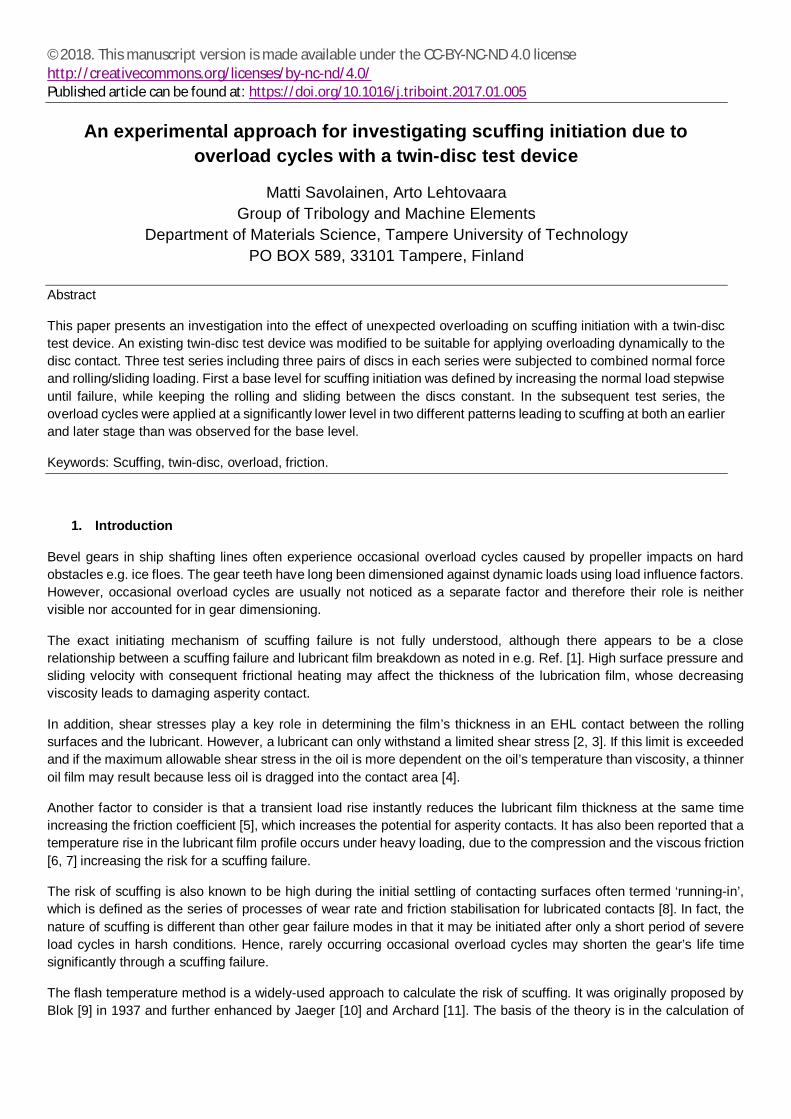
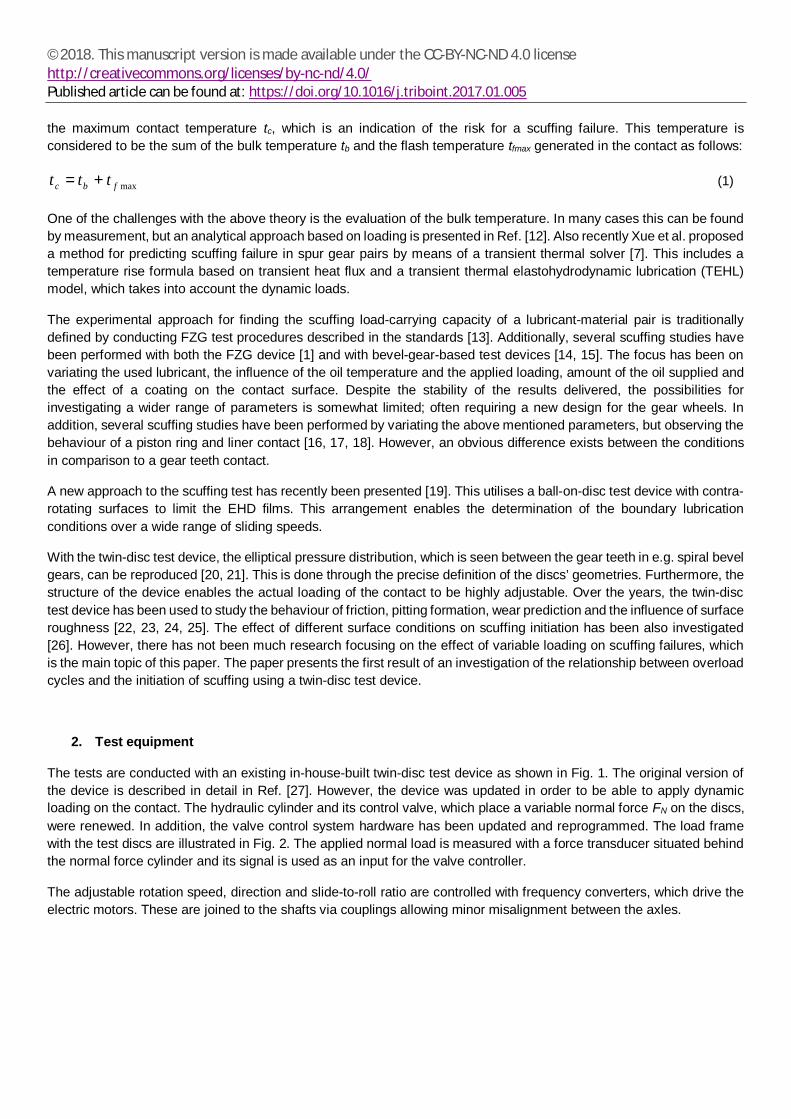
The tests are conducted with an existing in-house-built twin-disc test device as shown in Fig. 1. The original version ofthe device is described in detail in Ref. [27]. However, the device was updated in order to be able to apply dynamicloading on the contact. The hydraulic cylinder and its control valve, which place a variable normal force FN on the discs,were renewed. In addition, the valve control system hardware has been updated and reprogrammed. The load framewith the test discs are illustrated in Fig. 2. The applied normal load is measured with a force transducer situated behindthe normal force cylinder and its signal is used as an input for the valve controller.
The adjustable rotation speed, direction and slide-to-roll ratio are controlled with frequency converters, which drive theelectric motors. These are joined to the shafts via couplings allowing minor misalignment between the axles.
©2018. This manuscript version is made available under the CC-BY-NC-ND 4.0 licensehttp://creativecommons.org/licenses/by-nc-nd/4.0/Published article can be found at: https://doi.org/10.1016/j.triboint.2017.01.005
Fig. 1. The twin-disc test device.
Fig. 2. The load frame.
A separate hydraulic unit provides lubricant for the disc contact injected from the inlet side. The same unit also lubricatesthe support rolling bearings inside the test device. Stepless adjustment of the lubricant flow is provided by means of afrequency-converter-driven pump motor and manual valves. The lubricant inlet temperature is automatically controlledby a separate microcontroller unit.
©2018. This manuscript version is made available under the CC-BY-NC-ND 4.0 licensehttp://creativecommons.org/licenses/by-nc-nd/4.0/Published article can be found at: https://doi.org/10.1016/j.triboint.2017.01.005
The test device is highly adjustable and automated enabling the possibility for unmanned operation. Some of theperformance values are listed below:
· Rotation speed: Max 6000 RPM· Normal load: Max 50 kN· Lubricant temperature: 25…120 °C· Lubricant flow rate: 0.5…20 l/min
2.1. Measurements
The measurement system collects data on the above-mentioned normal force, lubricant flow and inlet temperature, aswell as the shaft rotation speeds and the torque on the slow shaft. In addition, the test disc bulk temperature on the fastshaft was recorded using a telemetry system and a thermocouple located approximately 3.5 mm underneath the surfaceat the disc contact.
The torque signal Tm measured by the torque transducer mounted on the slow shaft, can be separated into the torqueTr originating from the bearings and the shaft seals, and the torque Tc, which originates from the disc contact. These twovalues have to be separated in order to analyse the contact behaviour more precisely. The actual torque at the disccontact can be calculated with the following equation:
rmc TTT ±= (2)
The Tr value is negative, when measuring the braking torque on the slower shaft and positive in the opposite situation.
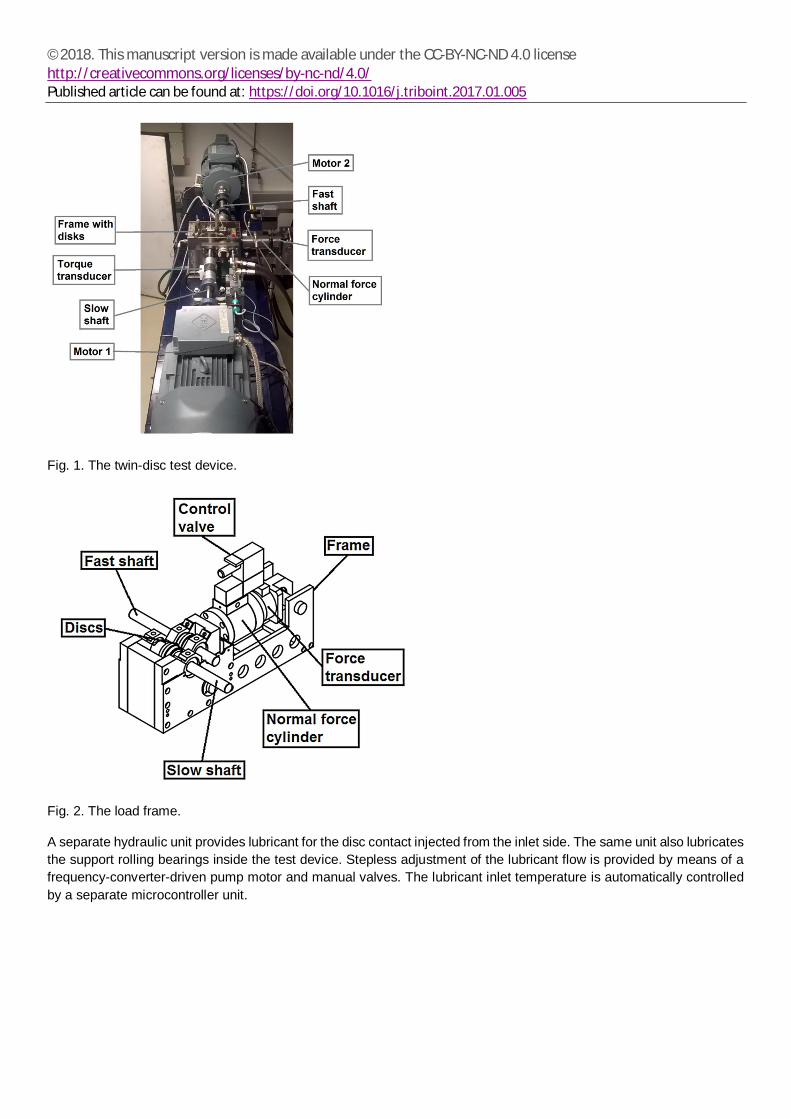
Typical values for the torque Tr were found by measuring the shaft torque as a function of the normal force. This wasdone by rotating the shafts with the same speeds 175.8 RPM, resulting in a pure rolling condition. The operatingtemperature was 60 °C and three different disc pairs were used. A load-dependent equation was fitted to the measuredvalues shown in Fig. 3:
( ) 0265.0ln0801.0 -×= Nr FT (3)
Fig. 3. Measured points of the torque Tr as a function of the normal force with a fitted curve according to Eq. 3.
The results, as illustrated in Fig. 3, show clear variation between an interesting normal force range of 5 to 12 kN. Hence,a sensitivity check was performed. This was done in two stages utilising the following equation:
©2018. This manuscript version is made available under the CC-BY-NC-ND 4.0 licensehttp://creativecommons.org/licenses/by-nc-nd/4.0/Published article can be found at: https://doi.org/10.1016/j.triboint.2017.01.005
Ndisc
rmc Fr
TT×+
=m (4)
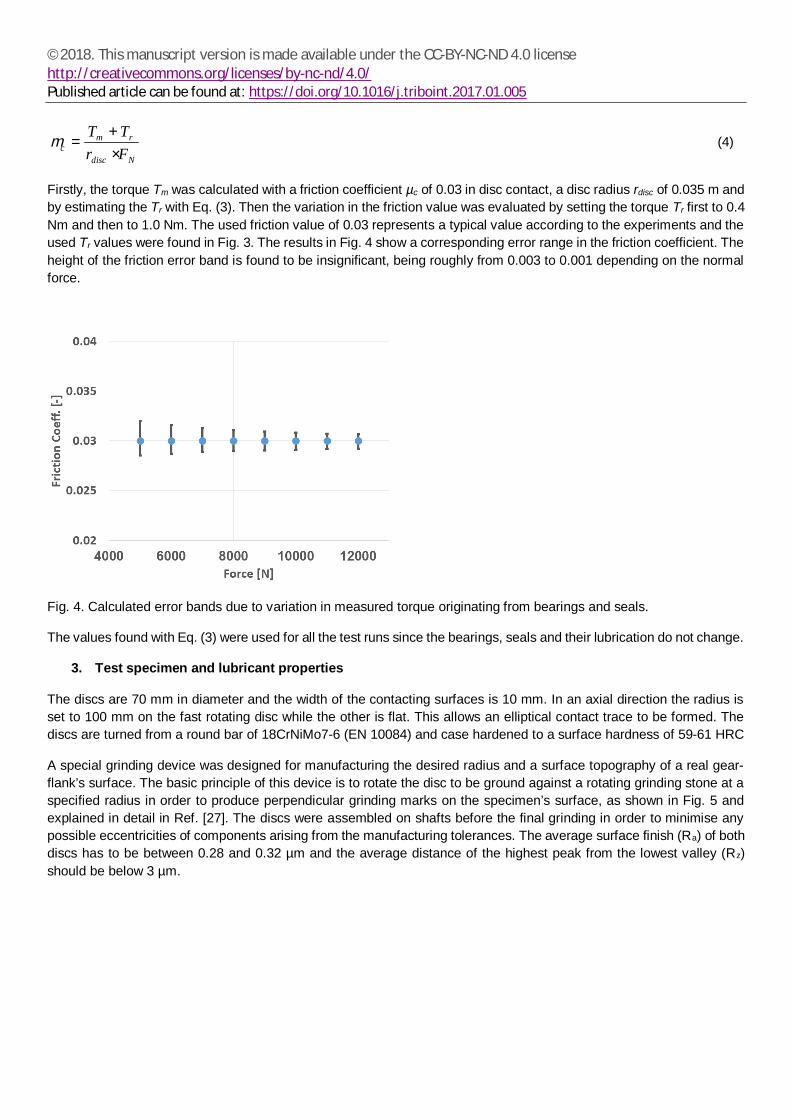
Firstly, the torque Tm was calculated with a friction coefficient µc of 0.03 in disc contact, a disc radius rdisc of 0.035 m andby estimating the Tr with Eq. (3). Then the variation in the friction value was evaluated by setting the torque Tr first to 0.4Nm and then to 1.0 Nm. The used friction value of 0.03 represents a typical value according to the experiments and theused Tr values were found in Fig. 3. The results in Fig. 4 show a corresponding error range in the friction coefficient. Theheight of the friction error band is found to be insignificant, being roughly from 0.003 to 0.001 depending on the normalforce.
Fig. 4. Calculated error bands due to variation in measured torque originating from bearings and seals.
The values found with Eq. (3) were used for all the test runs since the bearings, seals and their lubrication do not change.
3. Test specimen and lubricant properties
The discs are 70 mm in diameter and the width of the contacting surfaces is 10 mm. In an axial direction the radius isset to 100 mm on the fast rotating disc while the other is flat. This allows an elliptical contact trace to be formed. Thediscs are turned from a round bar of 18CrNiMo7-6 (EN 10084) and case hardened to a surface hardness of 59-61 HRC
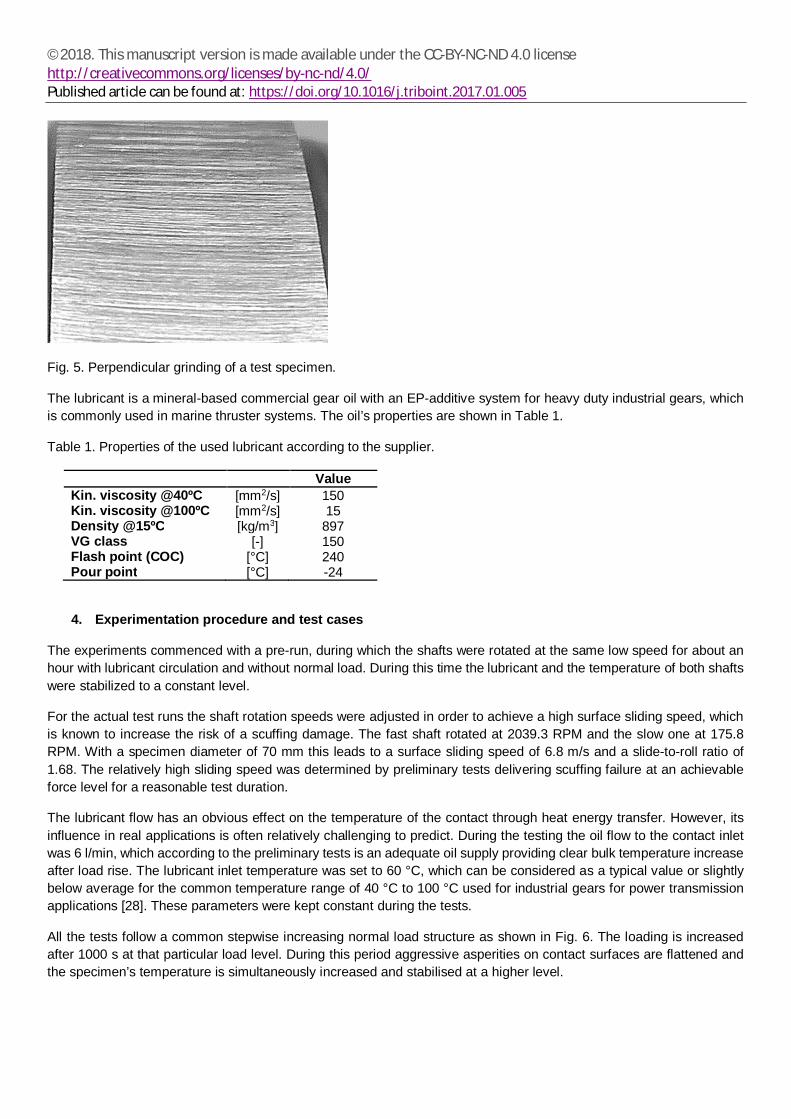
A special grinding device was designed for manufacturing the desired radius and a surface topography of a real gear-flank’s surface. The basic principle of this device is to rotate the disc to be ground against a rotating grinding stone at aspecified radius in order to produce perpendicular grinding marks on the specimen’s surface, as shown in Fig. 5 andexplained in detail in Ref. [27]. The discs were assembled on shafts before the final grinding in order to minimise anypossible eccentricities of components arising from the manufacturing tolerances. The average surface finish (Ra) of bothdiscs has to be between 0.28 and 0.32 µm and the average distance of the highest peak from the lowest valley (Rz)should be below 3 µm.
©2018. This manuscript version is made available under the CC-BY-NC-ND 4.0 licensehttp://creativecommons.org/licenses/by-nc-nd/4.0/Published article can be found at: https://doi.org/10.1016/j.triboint.2017.01.005
Fig. 5. Perpendicular grinding of a test specimen.
The lubricant is a mineral-based commercial gear oil with an EP-additive system for heavy duty industrial gears, whichis commonly used in marine thruster systems. The oil’s properties are shown in Table 1.
Table 1. Properties of the used lubricant according to the supplier.
ValueKin. viscosity @40ºC [mm2/s] 150Kin. viscosity @100ºC [mm2/s] 15Density @15ºC [kg/m3] 897VG class [-] 150Flash point (COC) [°C] 240Pour point [°C] -24
4. Experimentation procedure and test cases
The experiments commenced with a pre-run, during which the shafts were rotated at the same low speed for about anhour with lubricant circulation and without normal load. During this time the lubricant and the temperature of both shaftswere stabilized to a constant level.
For the actual test runs the shaft rotation speeds were adjusted in order to achieve a high surface sliding speed, whichis known to increase the risk of a scuffing damage. The fast shaft rotated at 2039.3 RPM and the slow one at 175.8RPM. With a specimen diameter of 70 mm this leads to a surface sliding speed of 6.8 m/s and a slide-to-roll ratio of1.68. The relatively high sliding speed was determined by preliminary tests delivering scuffing failure at an achievableforce level for a reasonable test duration.
The lubricant flow has an obvious effect on the temperature of the contact through heat energy transfer. However, itsinfluence in real applications is often relatively challenging to predict. During the testing the oil flow to the contact inletwas 6 l/min, which according to the preliminary tests is an adequate oil supply providing clear bulk temperature increaseafter load rise. The lubricant inlet temperature was set to 60 °C, which can be considered as a typical value or slightlybelow average for the common temperature range of 40 °C to 100 °C used for industrial gears for power transmissionapplications [28]. These parameters were kept constant during the tests.
All the tests follow a common stepwise increasing normal load structure as shown in Fig. 6. The loading is increasedafter 1000 s at that particular load level. During this period aggressive asperities on contact surfaces are flattened andthe specimen’s temperature is simultaneously increased and stabilised at a higher level.
©2018. This manuscript version is made available under the CC-BY-NC-ND 4.0 licensehttp://creativecommons.org/licenses/by-nc-nd/4.0/Published article can be found at: https://doi.org/10.1016/j.triboint.2017.01.005
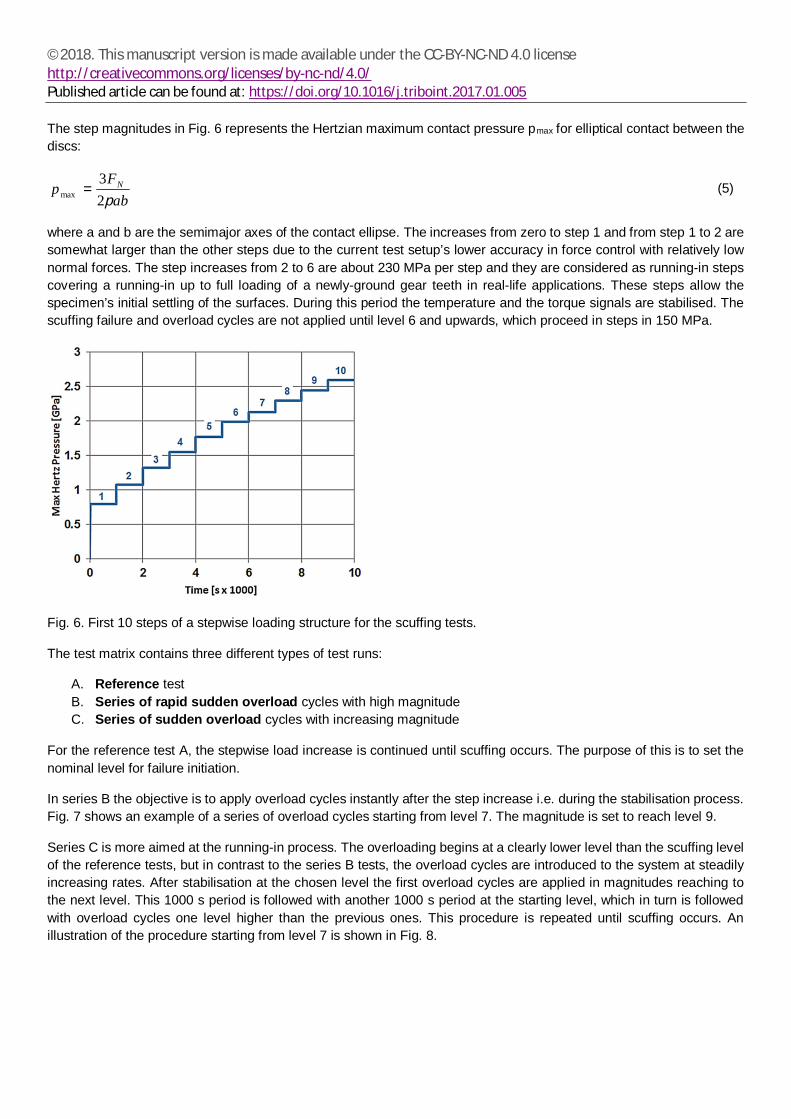
The step magnitudes in Fig. 6 represents the Hertzian maximum contact pressure pmax for elliptical contact between thediscs:
abF
p N
p23
max = (5)
where a and b are the semimajor axes of the contact ellipse. The increases from zero to step 1 and from step 1 to 2 aresomewhat larger than the other steps due to the current test setup’s lower accuracy in force control with relatively lownormal forces. The step increases from 2 to 6 are about 230 MPa per step and they are considered as running-in stepscovering a running-in up to full loading of a newly-ground gear teeth in real-life applications. These steps allow thespecimen’s initial settling of the surfaces. During this period the temperature and the torque signals are stabilised. Thescuffing failure and overload cycles are not applied until level 6 and upwards, which proceed in steps in 150 MPa.
Fig. 6. First 10 steps of a stepwise loading structure for the scuffing tests.
The test matrix contains three different types of test runs:
A. Reference testB. Series of rapid sudden overload cycles with high magnitudeC. Series of sudden overload cycles with increasing magnitude
For the reference test A, the stepwise load increase is continued until scuffing occurs. The purpose of this is to set thenominal level for failure initiation.
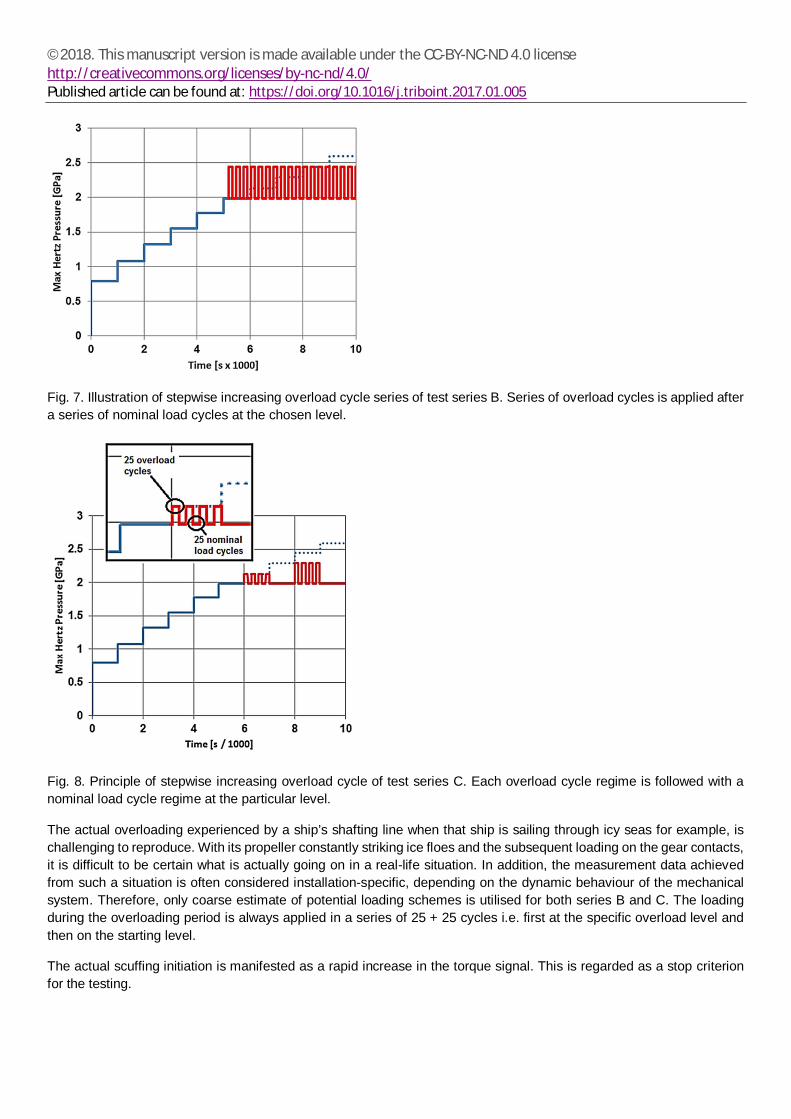
In series B the objective is to apply overload cycles instantly after the step increase i.e. during the stabilisation process.Fig. 7 shows an example of a series of overload cycles starting from level 7. The magnitude is set to reach level 9.
Series C is more aimed at the running-in process. The overloading begins at a clearly lower level than the scuffing levelof the reference tests, but in contrast to the series B tests, the overload cycles are introduced to the system at steadilyincreasing rates. After stabilisation at the chosen level the first overload cycles are applied in magnitudes reaching tothe next level. This 1000 s period is followed with another 1000 s period at the starting level, which in turn is followedwith overload cycles one level higher than the previous ones. This procedure is repeated until scuffing occurs. Anillustration of the procedure starting from level 7 is shown in Fig. 8.
©2018. This manuscript version is made available under the CC-BY-NC-ND 4.0 licensehttp://creativecommons.org/licenses/by-nc-nd/4.0/Published article can be found at: https://doi.org/10.1016/j.triboint.2017.01.005
Fig. 7. Illustration of stepwise increasing overload cycle series of test series B. Series of overload cycles is applied aftera series of nominal load cycles at the chosen level.
Fig. 8. Principle of stepwise increasing overload cycle of test series C. Each overload cycle regime is followed with anominal load cycle regime at the particular level.
The actual overloading experienced by a ship’s shafting line when that ship is sailing through icy seas for example, ischallenging to reproduce. With its propeller constantly striking ice floes and the subsequent loading on the gear contacts,it is difficult to be certain what is actually going on in a real-life situation. In addition, the measurement data achievedfrom such a situation is often considered installation-specific, depending on the dynamic behaviour of the mechanicalsystem. Therefore, only coarse estimate of potential loading schemes is utilised for both series B and C. The loadingduring the overloading period is always applied in a series of 25 + 25 cycles i.e. first at the specific overload level andthen on the starting level.
The actual scuffing initiation is manifested as a rapid increase in the torque signal. This is regarded as a stop criterionfor the testing.
©2018. This manuscript version is made available under the CC-BY-NC-ND 4.0 licensehttp://creativecommons.org/licenses/by-nc-nd/4.0/Published article can be found at: https://doi.org/10.1016/j.triboint.2017.01.005
5. Results and discussion
Each test was repeated three times with the same loading scheme. The lubricant temperature at the contact inletremained within the range of 60±1.5 ºC for all the tests.
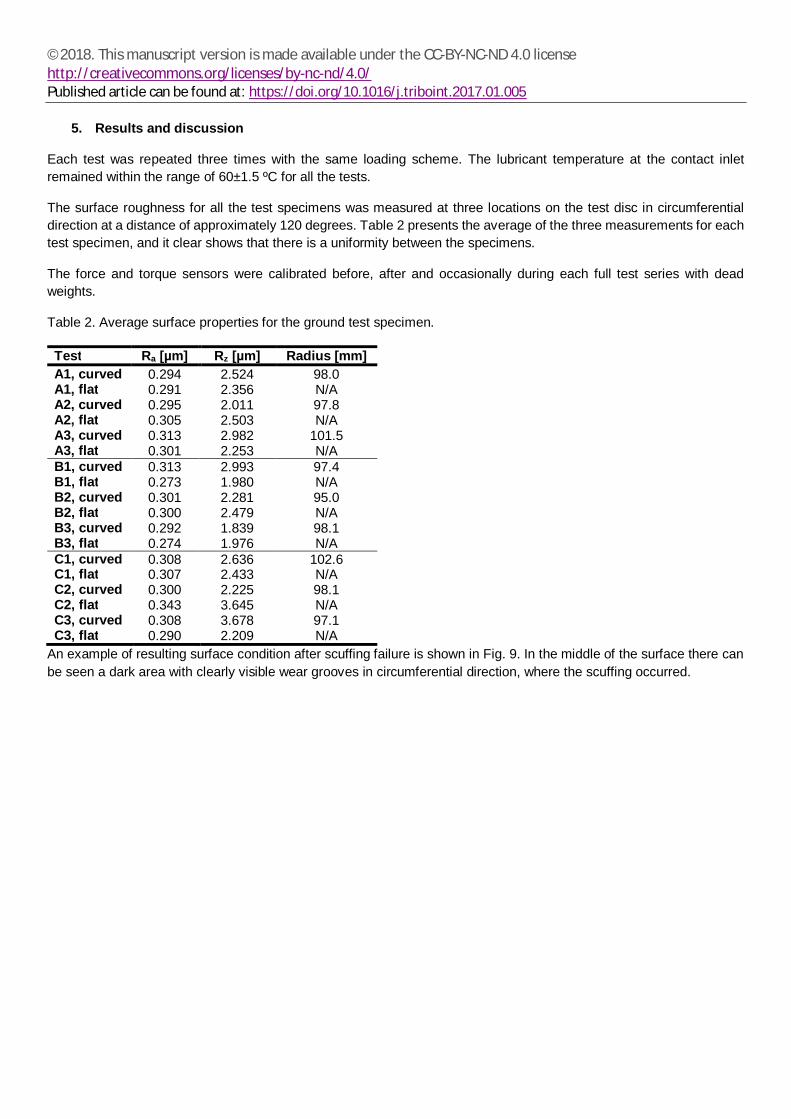
The surface roughness for all the test specimens was measured at three locations on the test disc in circumferentialdirection at a distance of approximately 120 degrees. Table 2 presents the average of the three measurements for eachtest specimen, and it clear shows that there is a uniformity between the specimens.
The force and torque sensors were calibrated before, after and occasionally during each full test series with deadweights.
Table 2. Average surface properties for the ground test specimen.
Test Ra [µm] Rz [µm] Radius [mm]A1, curved 0.294 2.524 98.0A1, flat 0.291 2.356 N/AA2, curved 0.295 2.011 97.8A2, flat 0.305 2.503 N/AA3, curved 0.313 2.982 101.5A3, flat 0.301 2.253 N/AB1, curved 0.313 2.993 97.4B1, flat 0.273 1.980 N/AB2, curved 0.301 2.281 95.0B2, flat 0.300 2.479 N/AB3, curved 0.292 1.839 98.1B3, flat 0.274 1.976 N/AC1, curved 0.308 2.636 102.6C1, flat 0.307 2.433 N/AC2, curved 0.300 2.225 98.1C2, flat 0.343 3.645 N/AC3, curved 0.308 3.678 97.1C3, flat 0.290 2.209 N/A
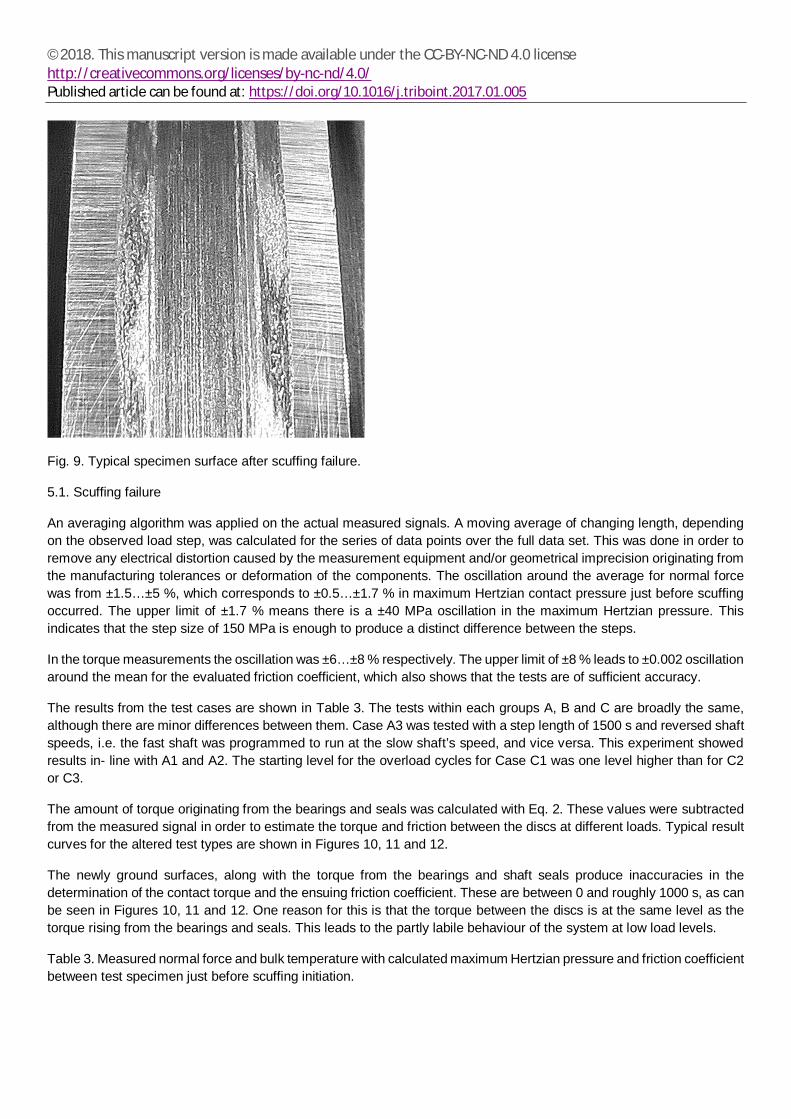
An example of resulting surface condition after scuffing failure is shown in Fig. 9. In the middle of the surface there canbe seen a dark area with clearly visible wear grooves in circumferential direction, where the scuffing occurred.
©2018. This manuscript version is made available under the CC-BY-NC-ND 4.0 licensehttp://creativecommons.org/licenses/by-nc-nd/4.0/Published article can be found at: https://doi.org/10.1016/j.triboint.2017.01.005
Fig. 9. Typical specimen surface after scuffing failure.
5.1. Scuffing failure
An averaging algorithm was applied on the actual measured signals. A moving average of changing length, dependingon the observed load step, was calculated for the series of data points over the full data set. This was done in order toremove any electrical distortion caused by the measurement equipment and/or geometrical imprecision originating fromthe manufacturing tolerances or deformation of the components. The oscillation around the average for normal forcewas from ±1.5…±5 %, which corresponds to ±0.5…±1.7 % in maximum Hertzian contact pressure just before scuffingoccurred. The upper limit of ±1.7 % means there is a ±40 MPa oscillation in the maximum Hertzian pressure. Thisindicates that the step size of 150 MPa is enough to produce a distinct difference between the steps.
In the torque measurements the oscillation was ±6…±8 % respectively. The upper limit of ±8 % leads to ±0.002 oscillationaround the mean for the evaluated friction coefficient, which also shows that the tests are of sufficient accuracy.
The results from the test cases are shown in Table 3. The tests within each groups A, B and C are broadly the same,although there are minor differences between them. Case A3 was tested with a step length of 1500 s and reversed shaftspeeds, i.e. the fast shaft was programmed to run at the slow shaft’s speed, and vice versa. This experiment showedresults in- line with A1 and A2. The starting level for the overload cycles for Case C1 was one level higher than for C2or C3.
The amount of torque originating from the bearings and seals was calculated with Eq. 2. These values were subtractedfrom the measured signal in order to estimate the torque and friction between the discs at different loads. Typical resultcurves for the altered test types are shown in Figures 10, 11 and 12.
The newly ground surfaces, along with the torque from the bearings and shaft seals produce inaccuracies in thedetermination of the contact torque and the ensuing friction coefficient. These are between 0 and roughly 1000 s, as canbe seen in Figures 10, 11 and 12. One reason for this is that the torque between the discs is at the same level as thetorque rising from the bearings and seals. This leads to the partly labile behaviour of the system at low load levels.
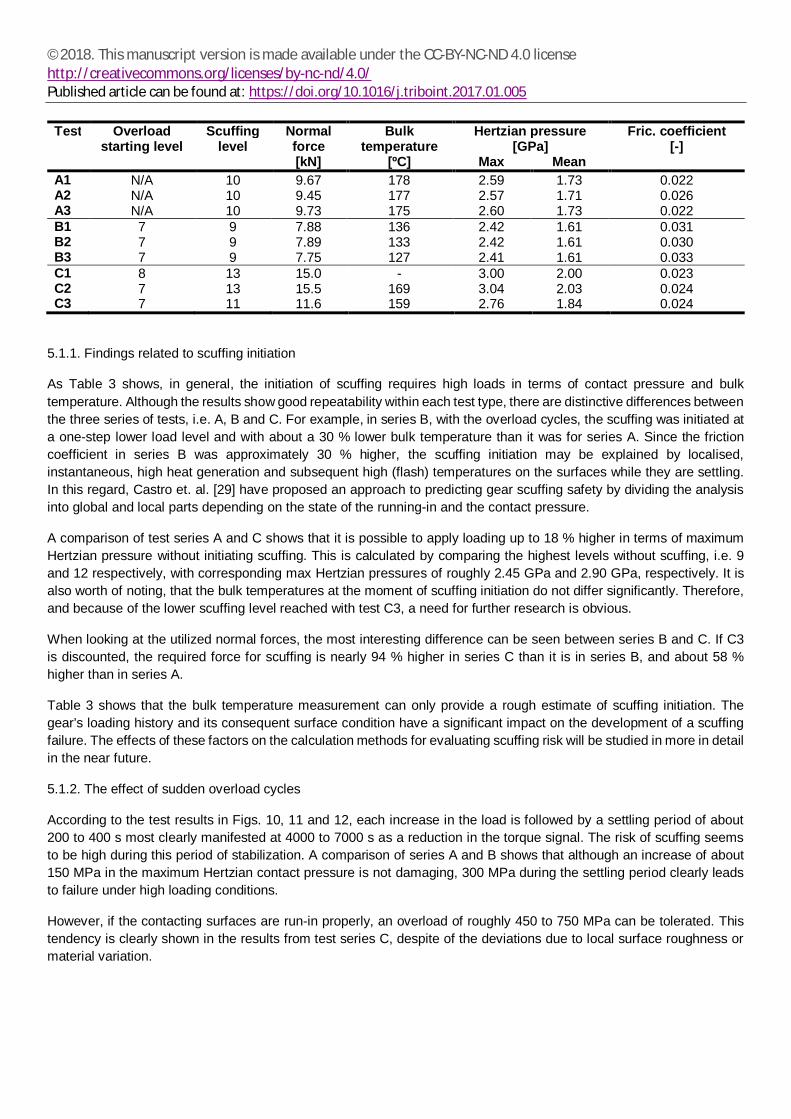
Table 3. Measured normal force and bulk temperature with calculated maximum Hertzian pressure and friction coefficientbetween test specimen just before scuffing initiation.
©2018. This manuscript version is made available under the CC-BY-NC-ND 4.0 licensehttp://creativecommons.org/licenses/by-nc-nd/4.0/Published article can be found at: https://doi.org/10.1016/j.triboint.2017.01.005
Test Overloadstarting level
Scuffinglevel
Normalforce
Bulktemperature
Hertzian pressure[GPa]
Fric. coefficient[-]
[kN] [ºC] Max MeanA1 N/A 10 9.67 178 2.59 1.73 0.022A2 N/A 10 9.45 177 2.57 1.71 0.026A3 N/A 10 9.73 175 2.60 1.73 0.022B1 7 9 7.88 136 2.42 1.61 0.031B2 7 9 7.89 133 2.42 1.61 0.030B3 7 9 7.75 127 2.41 1.61 0.033C1 8 13 15.0 - 3.00 2.00 0.023C2 7 13 15.5 169 3.04 2.03 0.024C3 7 11 11.6 159 2.76 1.84 0.024
5.1.1. Findings related to scuffing initiation
As Table 3 shows, in general, the initiation of scuffing requires high loads in terms of contact pressure and bulktemperature. Although the results show good repeatability within each test type, there are distinctive differences betweenthe three series of tests, i.e. A, B and C. For example, in series B, with the overload cycles, the scuffing was initiated ata one-step lower load level and with about a 30 % lower bulk temperature than it was for series A. Since the frictioncoefficient in series B was approximately 30 % higher, the scuffing initiation may be explained by localised,instantaneous, high heat generation and subsequent high (flash) temperatures on the surfaces while they are settling.In this regard, Castro et. al. [29] have proposed an approach to predicting gear scuffing safety by dividing the analysisinto global and local parts depending on the state of the running-in and the contact pressure.
A comparison of test series A and C shows that it is possible to apply loading up to 18 % higher in terms of maximumHertzian pressure without initiating scuffing. This is calculated by comparing the highest levels without scuffing, i.e. 9and 12 respectively, with corresponding max Hertzian pressures of roughly 2.45 GPa and 2.90 GPa, respectively. It isalso worth of noting, that the bulk temperatures at the moment of scuffing initiation do not differ significantly. Therefore,and because of the lower scuffing level reached with test C3, a need for further research is obvious.
When looking at the utilized normal forces, the most interesting difference can be seen between series B and C. If C3is discounted, the required force for scuffing is nearly 94 % higher in series C than it is in series B, and about 58 %higher than in series A.
Table 3 shows that the bulk temperature measurement can only provide a rough estimate of scuffing initiation. Thegear’s loading history and its consequent surface condition have a significant impact on the development of a scuffingfailure. The effects of these factors on the calculation methods for evaluating scuffing risk will be studied in more in detailin the near future.
5.1.2. The effect of sudden overload cycles
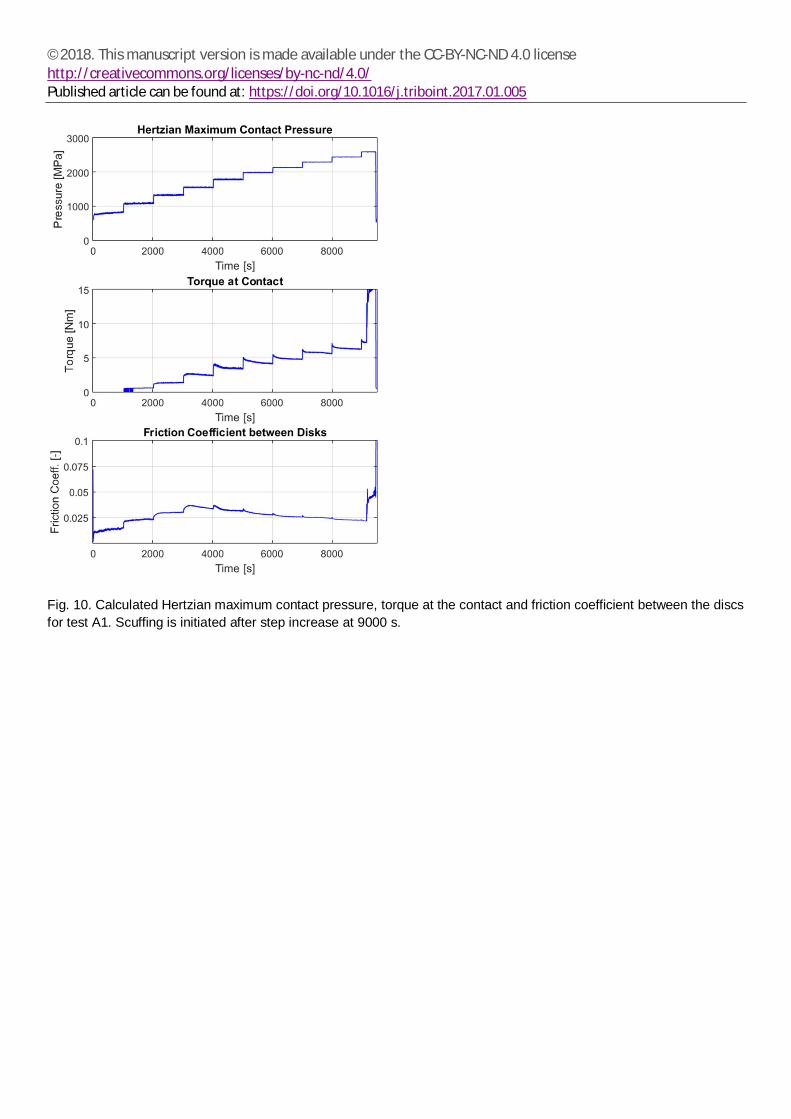
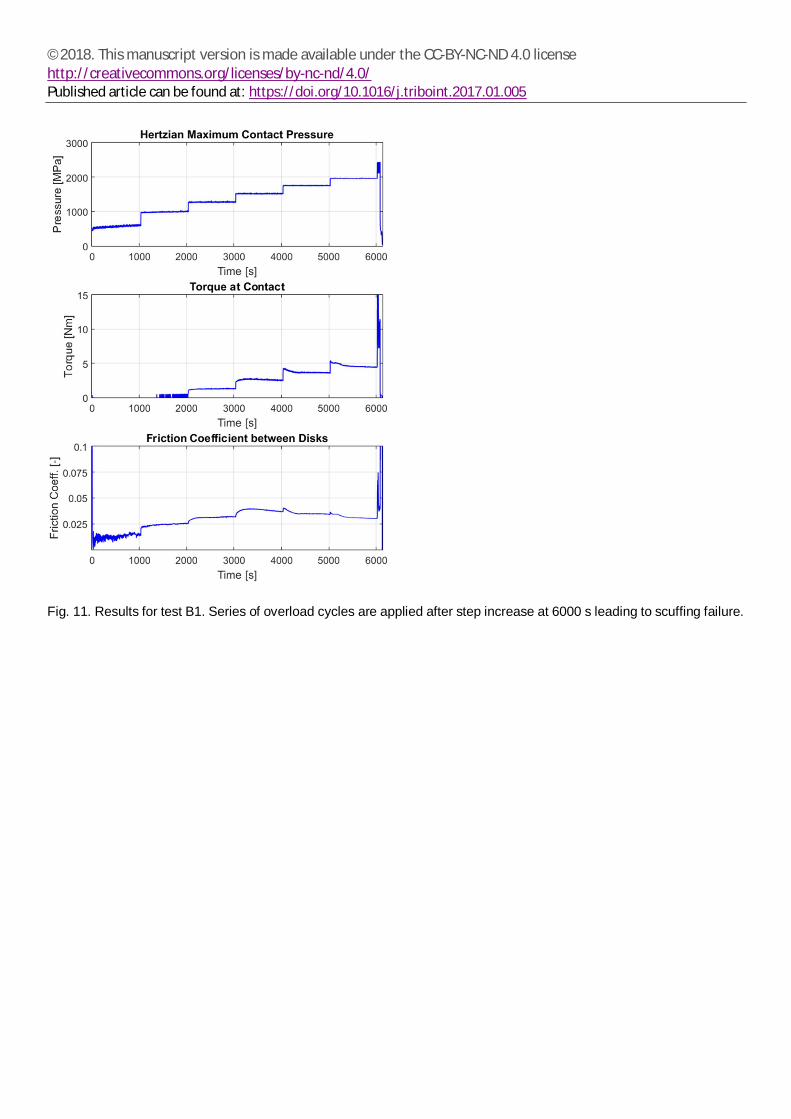
According to the test results in Figs. 10, 11 and 12, each increase in the load is followed by a settling period of about200 to 400 s most clearly manifested at 4000 to 7000 s as a reduction in the torque signal. The risk of scuffing seemsto be high during this period of stabilization. A comparison of series A and B shows that although an increase of about150 MPa in the maximum Hertzian contact pressure is not damaging, 300 MPa during the settling period clearly leadsto failure under high loading conditions.
However, if the contacting surfaces are run-in properly, an overload of roughly 450 to 750 MPa can be tolerated. Thistendency is clearly shown in the results from test series C, despite of the deviations due to local surface roughness ormaterial variation.
©2018. This manuscript version is made available under the CC-BY-NC-ND 4.0 licensehttp://creativecommons.org/licenses/by-nc-nd/4.0/Published article can be found at: https://doi.org/10.1016/j.triboint.2017.01.005
5.1.3. The evolution of friction
The friction coefficient rises along with the load from 1000 seconds until it reaches a turning point at between 3000 and4000 sec. Thereafter the friction begins to decline as shown in Figures 10, 11 and 12.
During the first period, the development of friction is dominated by increasing viscosity along with the loading as well asby asperity contacts in the mixed lubrication region as the flattening of the contacting surfaces progresses. Once thetest set-up is at the level of ~1550 MPa in maximum Hertzian contact pressure, there is a clear change in the processas the friction begins to decline. There are two possible scenarios, or combination of them, which could explain this. Thefirst is that at this point the aggressive asperities are considerably levelled and the system is moving towards an elasto-hydrodynamic lubrication regime, where the definition of the friction coefficient is dictated by the shear stresses in thelubricant. This period is characterised by the tendency of the friction coefficient to slightly drop along with increases inthe load. This produces a consequent reduction in the lubricant’s limiting shear stress along with the increasingtemperature, as noted in Ref. [30]. It is also noticeable that during this period the introducing of overload cycles has nosignificant effect on the friction coefficient. In the second scenario, the additive system of friction improvers in thelubricant become active, which would also have a strong influence on the system’s behaviour.
5.1.4. The evolution of the bulk temperature
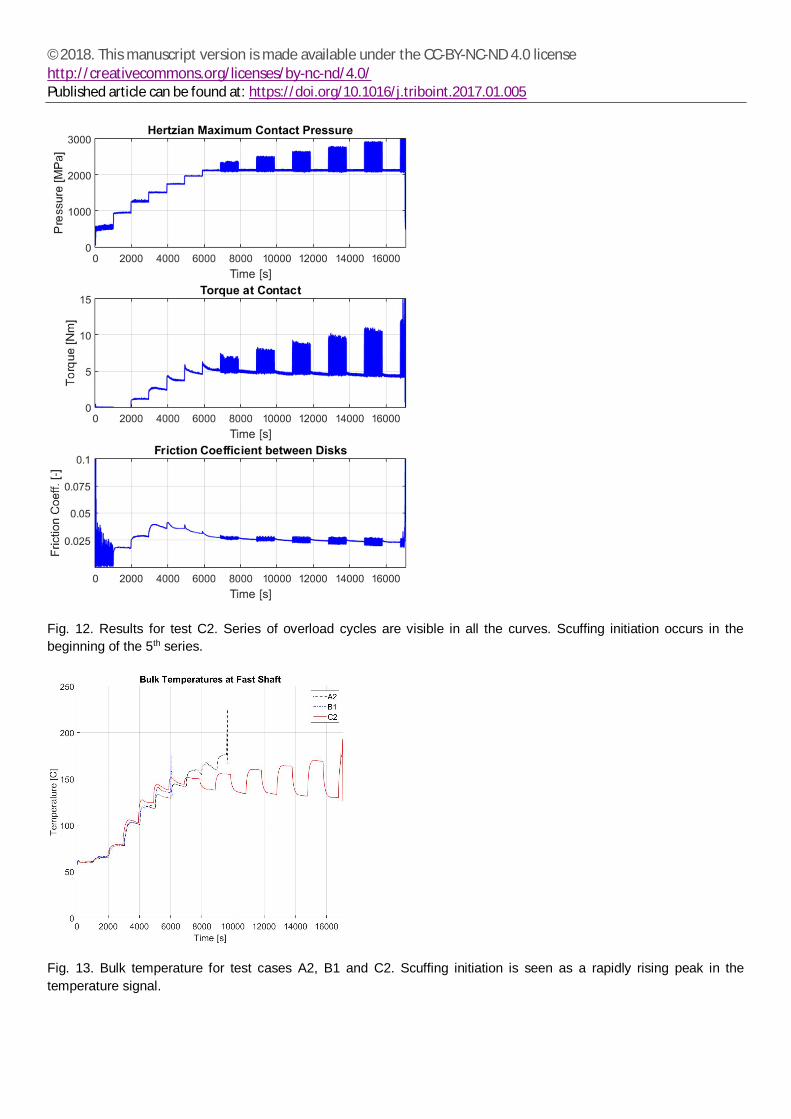
The bulk temperature climbs to a new level after each step-increase in the load, as shown in Fig. 13. This is due to anincrease in the generation of frictional heat in the contact. After reaching the local maximum, in roughly 300 seconds,the heat production and the cooling via the transfer of heat energy within the lubricant and to the surrounding structuresstabilizes. A small drop in the temperature can be observed, indicating a reduction of the friction coefficient. This is alsosupported by a simultaneous drop in the torque signal.
The comparison of the temperature curves for tests A1 and C3 in Fig. 13 show, that for example between 7000 and8000 s the overload-type of loading to one step upper level produces approximately half of the temperature rise that itdoes under full-time loading on this level. After stabilisation and return to full-time loading at the previous load level withthe overload procedure, the bulk temperature is observed to be declining, which indicates reduction in correspondingfriction. This trend seems to continue during the process of applying the overload cycles in series C. This suggests thatthe heat generation can be kept under control, decreasing the risk of scuffing, without losing the advantage gained fromthe surface flattening with this procedure.
©2018. This manuscript version is made available under the CC-BY-NC-ND 4.0 licensehttp://creativecommons.org/licenses/by-nc-nd/4.0/Published article can be found at: https://doi.org/10.1016/j.triboint.2017.01.005
Fig. 10. Calculated Hertzian maximum contact pressure, torque at the contact and friction coefficient between the discsfor test A1. Scuffing is initiated after step increase at 9000 s.
©2018. This manuscript version is made available under the CC-BY-NC-ND 4.0 licensehttp://creativecommons.org/licenses/by-nc-nd/4.0/Published article can be found at: https://doi.org/10.1016/j.triboint.2017.01.005
Fig. 11. Results for test B1. Series of overload cycles are applied after step increase at 6000 s leading to scuffing failure.
©2018. This manuscript version is made available under the CC-BY-NC-ND 4.0 licensehttp://creativecommons.org/licenses/by-nc-nd/4.0/Published article can be found at: https://doi.org/10.1016/j.triboint.2017.01.005
Fig. 12. Results for test C2. Series of overload cycles are visible in all the curves. Scuffing initiation occurs in thebeginning of the 5th series.
Fig. 13. Bulk temperature for test cases A2, B1 and C2. Scuffing initiation is seen as a rapidly rising peak in thetemperature signal.
©2018. This manuscript version is made available under the CC-BY-NC-ND 4.0 licensehttp://creativecommons.org/licenses/by-nc-nd/4.0/Published article can be found at: https://doi.org/10.1016/j.triboint.2017.01.005
6. Conclusions
This paper has presented the results of an approach to investigating scuffing initiation under overloading by means of atwin-disc test device. The main conclusions can be summarised as follows:
· The twin-disc test arrangement is well suited to study scuffing under dynamic loading.o The mechanical and thermal loads are efficiently controlled and their influence on the behaviour of the
lubrication film are well captured.o A wide range of applied loads and surface conditions as a result of running-in can be studied effectively.
· Scuffing initiation due to overloading is substantially dependent on the occurrence of the loading.o Overload cycles during the running-in period significantly increase the risk for scuffing.o The introduction of overload cycles in a controlled manner, taking into account the settling of the
surfaces and the increase in surface temperature, may improve the component’s resistance to scuffinginitiation under heavy loading.
o The load history of the gears and their subsequent surface condition caused by running-in have aconsiderable effect.
· Using the bulk temperature to predict the risk of scuffing in a material-lubricant pair only gives a rather coarseresult.
The improved performance against scuffing failure gained by introducing overloading is not only dependent on themagnitude of the applied load cycles or the sequence, but the prevalent temperature and the contact pressure. Inaddition, also other variables such as the gear’s material, its initial surface condition and the lubricant, which impactswere not studied within the tests, may have a clearly noticeable effect. Because of this complexity, further research isrequired to enable the results of these tests to be utilised in dimensioning and more precise calculation of the risk forscuffing. In practice the achieved knowledge could be also applied to, for example, running-in processes of gears inmarine applications.
7. Acknowledgements
This study is carried out under the auspices of the ArTEco (Arctic Thruster Ecosystem) project, which is part of theMaritime Technologies II Research Programme (MARTEC II) under the European Commission ERA-Net scheme. Theauthors wish to gratefully acknowledge financial support from Tekes and other partners in the project. The funders havehad no influence on the content of this paper.
References
[1] Castro J, Seabra J. Scuffing and lubricant film breakdown in FZG gears. Part I. Analytical and experimentalapproach. Wear 1998;215;104-13.
[2] Jacobson BO. On the lubrication of heavily loaded spherical surfaces considering surface deformations andsolidification of the lubricant. Acta polytechnic scandinavica, Me 54; Stockholm; 1970.
[3] Bair S, Winer WO. Lubricant shear response to large strain at high pressure. J. of Rheology 1980;6;936-7.[4] Jacobson BO. Rheology and elastohydrodynamic lubrication. Elsevier tribology series, 19; Amsterdam, The
Netherlands; Elsevier; 1991.[5] Mongkol M, Jesda P. Transient EHL of two surfaces under elliptical contact with non-Newtonian lubricant.
Advanced materials research 2012;452-453;1291-5.[6] Bobach L, Beilicke R, Bartel D, Ludger, D. Thermal elastohydrodynamic simulation of involute spur gears
incorporating mixed friction. Tribol Int 2012;48;191-206.
©2018. This manuscript version is made available under the CC-BY-NC-ND 4.0 licensehttp://creativecommons.org/licenses/by-nc-nd/4.0/Published article can be found at: https://doi.org/10.1016/j.triboint.2017.01.005
[7] Xue J-H, Li W, Qin C. The scuffing load capacity of involute spur gear systems based on dynamic loads andtransient thermal elastohydrodynamic lubrication. Tribol Int 2014;79;74-83.
[8] Hutchings IM. Tribology: Friction and wear of engineering materials. Butterworth-Heinemann; 1992.[9] Blok H. General discussion on lubrication. Inst of Mech Eng 1937;2; London.[10] Jaeger JC. Moving sources of heat and the temperature at sliding contacts. Proc Roy Soc N.S.W 76, 1942;
203-24.[11] Archard JF. The temperature of rubbing surfaces. Wear 1959;2;438-55.[12] Jiang QY, Barber GC. Experimental determination of bulk temperature and critical temperature in scuffing
resistance evaluation of gears. Tribology transactions 2000;43;21-6.[13] ISO 14635-1, -2, -3. Gears – FZG test procedures – Parts 1-3; 2012.[14] Tuszynski W, Kalbarczyk M, Michalak M, Michalczewski R, Wieczorek A. The Effect of WC/C Coating on the
Wear of Bevel Gears used in Coal Mines. Materials Science-Medziagotyra 2015; 21/3;358-63.[15] Conrado E, Höhn B, Michaelis K, Klein M. Influence of oil supply on the scuffing load-carrying capacity of
hypoid gears. Proceedings of the Institution of Mechanical Engineers 2007;221;851-8.[16] Olander P, Jacobson S. Scuffing Resistance Testing of Piston Ring Materials for Marine Two-Stroke Diesel
Engines and Mapping of the Operating Mechanisms. Wear 2015;330-331;42-8.[17] Olander P, Eskildsen SS, Fogh JW, Hollman P, Jacobson S. Testing Scuffing Resistance of Materials for
Marine 2-Stroke Engines - Difficulties with Lab Scale Testing of a Complex Phenomenon. Wear 2015;340-341;9-18.
[18] Obert P, Müller T, Füsser HJ, Barterl D. The influence of oil supply and cylinder liner temperature on friction,wear and scuffing behaviour of piston ring cylinder liner contacts – A new model test. Tribol Int 2016;94;306-14.
[19] Ingram M, Hamer C, Spikes H. A New Scuffing Test using Contra-Rotation. Wear 2015;328-329;229-40.[20] Kleemola J, Lehtovaara A. An approach for determination of lubricant properties at elliptical
elastohydrodynamic contacts using a twin-disc test device and a numerical traction model. Proceedings ofthe Institution of Mechanical Engineers 2008;222;797-806.
[21] Simon V. Load Distribution in Spiral Bevel Gears. ASME. J Mech Des 2006;129(2):201-9.http://dx.doi.org/10.1115/1.2406090.
[22] Kleemola J, Lehtovaara A. Experimental evaluation of friction between contacting discs for the simulation ofgear contact. TriboTest 2007;13(1);13-20.
[23] Johansson J. On the influence of gear oil properties on pitting life. Dissertation, Luleå University ofTechnology, Luleå Sweden; 2015.
[24] Tassini N, Quost X, Lewis R, Dwyer-Joyce R, Ariaudo C, Kuka N. A numerical model of twin disc testarrangement for the evaluation of railway wheel wear prediction methods. Wear 2010;268;660-7.
[25] Höhn B-R, Michaelis K, Kreil O. Influence of surface roughness on pressure distribution and film thicknessin EHL-contacts. Tribol Int 2006;39;1719-25.
[26] Snidle RW, Dhulipalla AK, Evans HP. Scuffing performance of a hard coating under EHL conditions at slidingspeeds up to 16 m/s and contact pressures up to 2.0 GPa. J of Tribology 2008;130.
[27] Kleemola J, Lehtovaara A. Development of a high pressure twin disc test device for the simulation of a gearcontact. Finnish Journal of Tribology 2006;25(2);8-17.
[28] AGMA 925-A03. Effect of lubrication on gear surface distress 2003.[29] Castro J, Seabra J. Global and local analysis of gear scuffing tests using a mixed film lubrication model.
Tribol Int 2008;41;244-55.[30] Spikes HA. Mixed lubrication: an overview. Lubrication Science 1997;9;221-53.