Embed Size (px)
Citation preview
AN EXPERIMENTAL AND FIELD STUDY OF CAVITATION DETECTION IN
PUMP
TAN CHEK ZIN
A thesis submitted in fulfilment of the
requirements for the award of the degree of
Master of Engineering (Mechanical)
Faculty of Mechanical Engineering
Universiti Teknologi Malaysia
APRIL 2007
iii
To Pa, late-Mum, and family for
their love and support.

iv
ACKNOWLEDGMENTS
I would like to express my hearties gratitude and sincere appreciation to my
thesis supervisor, Prof. Ir. Dr. Mohd Salman Leong for his supervision, encouragement,
knowledge and experience sharing, continued guidance and moral support throughout
my study. My gratitude is further offered to Institute of Noise & Vibration (INV) and
Serba Dinamik Sdn Bhd (Ir. Karim) for providing necessary funding and facilities. I am
also grateful to my colleagues, Abdelgadir Mohamed Mahmoud, Lim Meng Hee, Wong
Yi Kang, Guai Yew Kae, Mohammad Ali Hussin, Tan Teck Chin and Siti Rohana
Mustaffa for the valuable suggestions and support.
I would like to thank Lee Yuk Choi, Arnold Lee and Chiew Chin Hing, Ir. Soo
Wee Chong and Pahlawan Power Sdn Bhd for the assistance provided during the field
investigation work. I am grateful to Dr. Choon Sooi Tan from Massachusetts Institute of
Technology (MIT), who has contributed his valuable suggestions and guidance in my
research study during his visit to INV. Many thanks dedicated to Ondrej Flek (Rockwell
Corporation), Donald B. Jarrell (Pacific Northwest National Laboraoty), S.L. Abhyankar
and all the researchers and engineers around for their knowledge sharing and support.
Special thanks to Heng, Ying Sze, Pey Wen, Jasmine Lim, Wong Teck Soon,
Makara Ty, Mathieu Mirmont, Andreas Buettcher, Jorg Weigl, Inayati, Sofina, Ali
Zenfour, Sam Su Ting and my friends for their guidance, moral support, encouragement
and friendship. Last, but most importantly, I would like to thank my father, late mother,
all 3 sisters, auntie and bro-in-law for their love and unswerving support to me all these
years.

v
ABSTRACT
Cavitation represents one of the most common faults in pumps and could potentially lead to a series of failures in mechanical seal, impeller, bearing, shaft, motor, etc. In this work, an experimental rig was setup to investigate cavitation detection using vibration analysis method, and measured parameters including sound, pressure and flow rate for feasibility of cavitation detection. The experimental testing includes 3 operating points of the centrifugal pump (Best Efficiency Point, 90% of Best Efficiency Point and 80% of Best Efficiency Point). It was shown that the high frequencies random vibration in the fast fourier transform (FFT) spectrum was vital and applicable for cavitation diagnosis. Cavitation was found to have easily excited natural frequencies of the pump components. There was a significant vibration amplitude increase at the frequency of ½ of blade passing frequency (BPF) in the envelope spectrum during cavitation existence. High impulsive spikes were clearly evident in the vibration time signal of cavitation. A grinding sound synonymous with cavitation was clearly audible during cavitation. Margin ratio of net positive suction head (NPSH), suction energy, cavitation number and flow rate were proven to be a good indicator for detecting cavitation. The findings of the experimental results were consistent for all test conditions. The field investigation of two submerged vertical pumps with suspected cavitation and flow induced vibrations in a power plant are presented. Such pumps do not have an adequate pressure and flow instrumentation that could detect abnormal hydraulic operating conditions. These pumps had a history of catastrophic impeller failures and the failure modes showed cavitation erosion and a sheared impeller blade. High frequencies random vibration was a good indicator for flow excitation and cavitation in the field investigation. Evidence of an excessive clearance and/or sleeve bearing wear were also noted in the pump of concern. The field investigations confirmed concern relating to operations during low tide and combined pumps operated in parallel where inadequate submergence were identified as the likely causes to the impeller failures. The impeller of concern was identified as not being the root cause of the problem. The investigations implied a system design problem and pump operating conditions compounding the system design error that had resulted in frequent failures of the pumps.
vi
ABSTRAK
Kavitasi merupakan salah satu masalah yang kerap berlaku dalam pam dan boleh mengakibatkan kegagalan pada pengadang mekanikal, bilah, aci, bering, motor dan sebagainya. Dalam tesis ini, ujikaji telah disediakan untuk mengkaji teknik mengesan kavitasi dengan kaedah analisis getaran, serta parameter-parameter bunyi, tekanan dan kadar aliran. Kajian ini melibatkan 3 titik operasi pam empar (Titik operasi paling efisien, 90% daripada titik operasi paling efisien and 80% daripada titik operasi paling efisien). Hasil ujikaji menunjukkan getaran rambang yang berfrekuensi tinggi dalam spektrum FFT adalah penting serta sesuai untuk mengesan kavitasi. Kavitasi boleh merangsang frekuensi asli komponen pam dengan mudah. Semasa berlakunya kavitasi, diperhatikan terdapat peningkatan amplitud getaran yang nyata pada ½ daripada frekuensi bilah memusing dalam spektrum sepadan. Hentakan bertubi dapat dikesan dan jelas terbukti dalam isyarat masa getaran semasa kavitasi. Terdapat juga bunyi kisaran yang jelas kedengaran semasa kavitasi. Nisbah margin tekanan sedutan, tenaga sedutan, nombor kavitasi dan kadar aliran telah terbukti sebagai petunjuk yang baik untuk mengesan kavitasi. Penemuan keputusan ujikaji konsisten untuk semua keadaan yang telah diuji. Ujikaji dijalankan ke atas dua buah pam tegak terbenam di stesan jana kuasa eletrik yang bermasalah. Pam-pam tersebut tidak dilengkapi dengan instrumentasi tekanan dan kadar aliran yang dapat mengesan keadaan operasi hidraulik yang tidak normal. Pam-pam tersebut juga mempunyai latar belakang kegagalan bilah yang teruk di mana corak kegagalannya mencadangkan kavitasi kakisan dan bilah yang pecah dengan cendung. Getaran rambang yang berfrekuensi tinggi merupakan petunjuk yang baik untuk gangguan aliran dan kavitasi dalam ujikaji ini. Bering didapati mempunyai kelonggaran yang berlebihan pada pam yang bermasalah. Hasil ujikaji ini telah membuktikan bahawa punca sebenar kegagalan bilah adalah berasaskan keadaan operasi pam seperti laut surut dan kekurangan redaman bagi pam-pam yang beropreasi secara selari dan bukannya masalah bilah itu sendiri sahaja. Ujikaji ini juga menunjukkan masalah reka bentuk sistem telah menyebabkan kegagalan pam yang kerap, dan keadaan operasi pam telah memburukkan lagi kesilapan rekabentuk sistem tersebut.
vii
TABLE OF CONTENTS
CHAPTER TITLE PAGE
TITLE
DECLARATION OF ORIGINALITY ii
DEDICATION iii
ACKNOWLEDGEMENTS iv
ABSTRACT v
ABSTRAK vi
TABLE OF CONTENTS vii
LIST OF TABLES xii
LIST OF FIGURES xiii
LIST OF ABBREVIATIONS xxiii
LIST OF APPENDICES xxiv
1 INTRODUCTION 1
1.1 Overview 1
1.2 Problem Formulation 5
1.3 Objectives of the Study 6
1.4 Scopes of the Study 6
viii
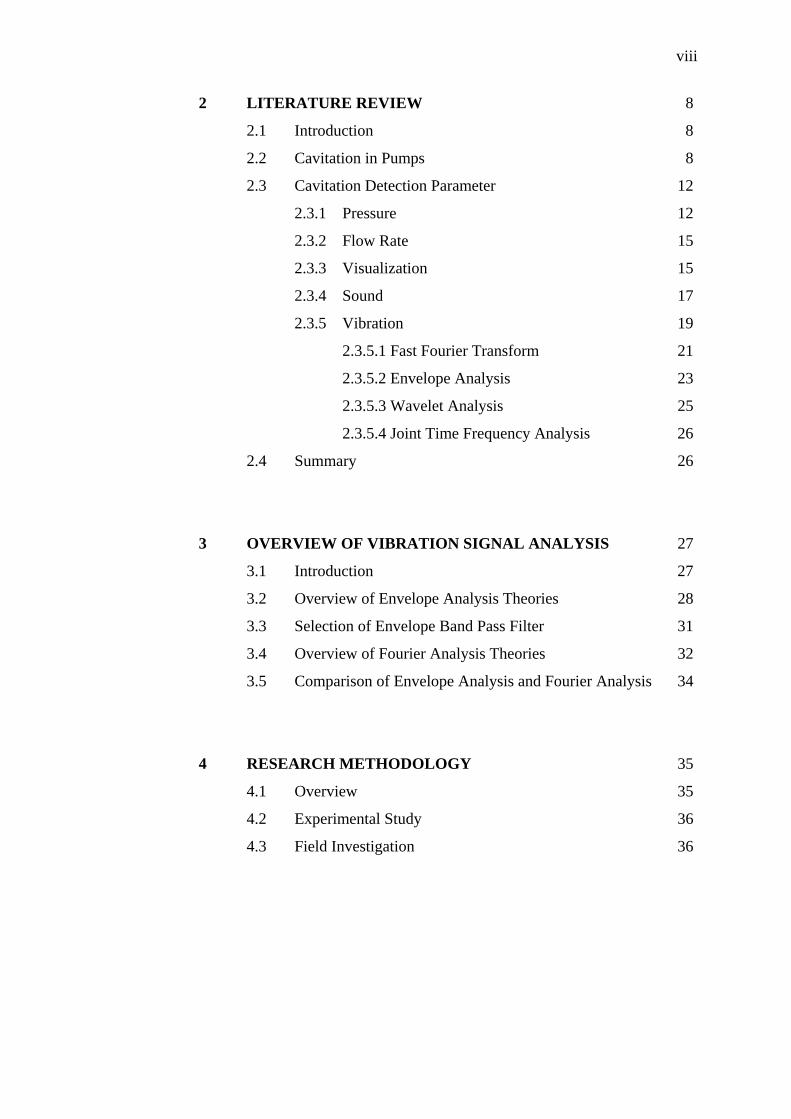
2 LITERATURE REVIEW 8
2.1 Introduction 8
2.2 Cavitation in Pumps 8
2.3 Cavitation Detection Parameter 12
2.3.1 Pressure 12
2.3.2 Flow Rate 15
2.3.3 Visualization 15
2.3.4 Sound 17
2.3.5 Vibration 19
2.3.5.1 Fast Fourier Transform 21
2.3.5.2 Envelope Analysis 23
2.3.5.3 Wavelet Analysis 25
2.3.5.4 Joint Time Frequency Analysis 26
2.4 Summary 26
3 OVERVIEW OF VIBRATION SIGNAL ANALYSIS 27
3.1 Introduction 27
3.2 Overview of Envelope Analysis Theories 28
3.3 Selection of Envelope Band Pass Filter 31
3.4 Overview of Fourier Analysis Theories 32
3.5 Comparison of Envelope Analysis and Fourier Analysis 34
4 RESEARCH METHODOLOGY 35
4.1 Overview 35
4.2 Experimental Study 36
4.3 Field Investigation 36
ix
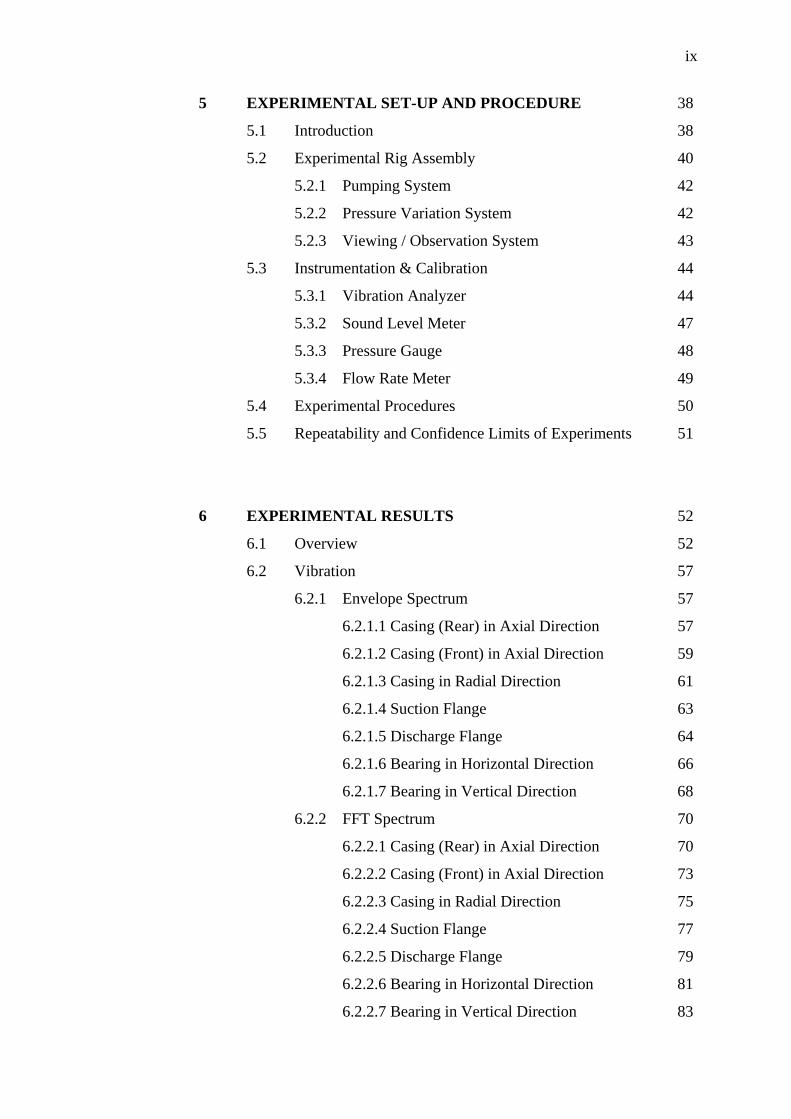
5 EXPERIMENTAL SET-UP AND PROCEDURE 38
5.1 Introduction 38
5.2 Experimental Rig Assembly 40
5.2.1 Pumping System 42
5.2.2 Pressure Variation System 42
5.2.3 Viewing / Observation System 43
5.3 Instrumentation & Calibration 44
5.3.1 Vibration Analyzer 44
5.3.2 Sound Level Meter 47
5.3.3 Pressure Gauge 48
5.3.4 Flow Rate Meter 49
5.4 Experimental Procedures 50
5.5 Repeatability and Confidence Limits of Experiments 51
6 EXPERIMENTAL RESULTS 52
6.1 Overview 52
6.2 Vibration 57
6.2.1 Envelope Spectrum 57
6.2.1.1 Casing (Rear) in Axial Direction 57
6.2.1.2 Casing (Front) in Axial Direction 59
6.2.1.3 Casing in Radial Direction 61
6.2.1.4 Suction Flange 63
6.2.1.5 Discharge Flange 64
6.2.1.6 Bearing in Horizontal Direction 66
6.2.1.7 Bearing in Vertical Direction 68
6.2.2 FFT Spectrum 70
6.2.2.1 Casing (Rear) in Axial Direction 70
6.2.2.2 Casing (Front) in Axial Direction 73
6.2.2.3 Casing in Radial Direction 75
6.2.2.4 Suction Flange 77
6.2.2.5 Discharge Flange 79
6.2.2.6 Bearing in Horizontal Direction 81
6.2.2.7 Bearing in Vertical Direction 83
x
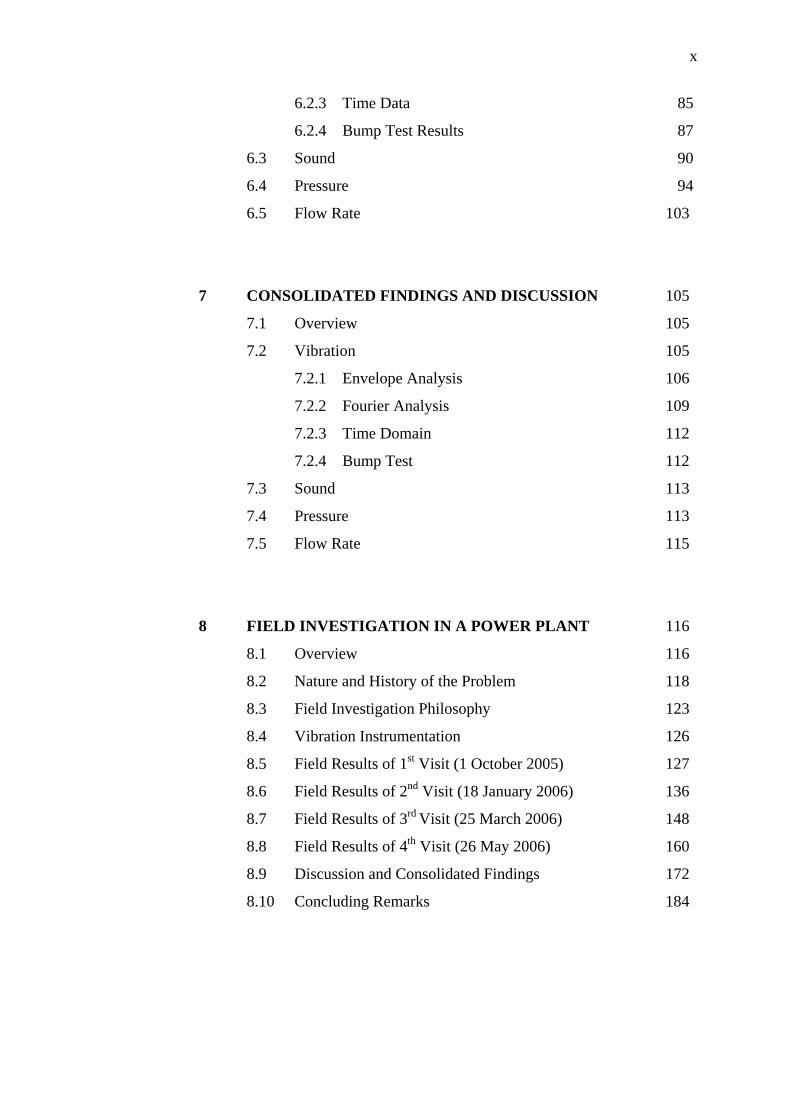
6.2.3 Time Data 85
6.2.4 Bump Test Results 87
6.3 Sound 90
6.4 Pressure 94
6.5 Flow Rate 103
7 CONSOLIDATED FINDINGS AND DISCUSSION 105
7.1 Overview 105
7.2 Vibration 105
7.2.1 Envelope Analysis 106
7.2.2 Fourier Analysis 109
7.2.3 Time Domain 112
7.2.4 Bump Test 112
7.3 Sound 113
7.4 Pressure 113
7.5 Flow Rate 115
8 FIELD INVESTIGATION IN A POWER PLANT 116
8.1 Overview 116
8.2 Nature and History of the Problem 118
8.3 Field Investigation Philosophy 123
8.4 Vibration Instrumentation 126
8.5 Field Results of 1st Visit (1 October 2005) 127
8.6 Field Results of 2nd Visit (18 January 2006) 136
8.7 Field Results of 3rd Visit (25 March 2006) 148
8.8 Field Results of 4th Visit (26 May 2006) 160
8.9 Discussion and Consolidated Findings 172
8.10 Concluding Remarks 184

xi
9 CONCLUSIONS AND FUTURE RECOMMENDATIONS 185
9.1 Conclusion for Experimental Study 185
9.2 Conclusion for Field Investigation 187
9.3 Future Recommendations for Experimental Study 188
9.4 Future Recommendations for Field Investigation 189
REREFENCES 190
Appendices A1-A8 196
xii
LIST OF TABLES
TABLE NO. TITLE PAGE
Table 1.1 Centrifugal pump application areas 2
Table 4.1 Band pass filter options 31
Table 6.1 Tabulation of controlled test conditions 53
Table 6.2 Experimental results of testing condition 1 54
Table 6.3 Experimental results of testing condition 2 55
Table 6.4 Experimental results of testing condition 3 56
Table 6.5 Locations of vibration measurements undertaken 57
Table 6.6 Tabulation of the natural frequencies at various locations 87
Table 6.7 Tabulation of SPL difference for testing condition 1 92
Table 6.8 Tabulation of SPL difference for testing condition 2 93
Table 6.9 Tabulation of SPL difference for testing condition 3 94
Table 7.1 Tabulation of suction energy for normal operating condition
and cavitation condition under 3 different testing conditions 114
Table 8.1 Summary of recent failures in pump, work done to the impeller
(Pump SVP1) and vibration investigations 124
xiii
LIST OF FIGURES
FIGURE NO. TITLE PAGE
Figure 1.1: Estimated new pumps market 2
Figure 2.1: Cavitation characteristic of a pump 13
Figure 2.2: Submerged vortex cavitation 16
Figure 3.1: Summary of Envelope Analysis Technique 29
Figure 3.2: Different signal types 33
Figure 4.1: Overview of research methodology 37
Figure 5.1: Schematic drawing of test rig 40
Figure 5.2: Photograph of the test rig facilities 41
Figure 5.3: Typical pressure profiles inside a pump 43
Figure 5.4: Viewing window at pump suction 44
Figure 5.5: SKF Vibration analyzer calibrated with vibration
exciter RION VE-10 46
Figure 5.6: HP 35670A Vibration Analyzer 46
Figure 5.7: Sound Level Meter was being calibrated 47
Figure 5.8: Pressure Indicator 48
Figure 5.9: Flow rate meter 49
Figure 6.1: Head vs flow of the centrifugal pump in the test rig 53
Figure 6.2: Envelope Spectrum of Cavitation and Normal Operating
Condition at Pump Casing (Rear) in Axial Direction for
Testing Condition 1. 58
Figure 6.3: Envelope Spectrum of Cavitation and Normal Operating
Condition at Pump Casing (Rear) in Axial Direction for
Testing Condition 2. 59
Figure 6.4: Envelope Spectrum of Cavitation and Normal Operating
Condition at Pump Casing (Rear) in Axial Direction for
Testing Condition 3. 59
xiv
Figure 6.5: Envelope Spectrum of Cavitation and Normal Operating
Condition at Pump Casing (Front) in Axial Direction for
Testing Condition 1. 60
Figure 6.6: Envelope Spectrum of Cavitation and Normal Operating
Condition at Pump Casing (Front) in Axial Direction for
Testing Condition 2. 60
Figure 6.7: Envelope Spectrum of Cavitation and Normal Operating
Condition at Pump Casing (Front) in Axial Direction for
Testing Condition 3. 61
Figure 6.8: Envelope Spectrum of Cavitation and Normal Operating
Condition at Pump Casing in Radial Direction for
Testing Condition 1. 62
Figure 6.9: Envelope Spectrum of Cavitation and Normal Operating
Condition at Pump Casing in Radial Direction for
Testing Condition 2. 62
Figure 6.10: Envelope Spectrum of Cavitation and Normal Operating
Condition at Pump Casing in Radial Direction for
Testing Condition 3. 62
Figure 6.11: Envelope Spectrum of Cavitation and Normal Operating
Condition at Pump Suction Flange in Axial Direction for
Testing Condition 1. 63
Figure 6.12: Envelope Spectrum of Cavitation and Normal Operating
Condition at Pump Suction Flange in Axial Direction for
Testing Condition 2. 63
Figure 6.13: Envelope Spectrum of Cavitation and Normal Operating
Condition at Pump Suction Flange in Axial Direction for
Testing Condition 3. 64
Figure 6.14: Envelope Spectrum of Cavitation and Normal Operating
Condition at Pump Discharge Flange in Vertical Direction for
Testing Condition 1. 65
Figure 6.15: Envelope Spectrums of Cavitation and Normal Operating
Condition at Pump Discharge Flange in Vertical Direction for
Testing Condition 2. 65
Figure 6.16: Envelope Spectrum of Cavitation and Normal Operating

xv
Condition at Pump Discharge Flange in Vertical Direction for
Testing Condition 3. 65
Figure 6.17: Envelope Spectrum of Cavitation and Normal Operating
Condition at Pump Bearing in Horizontal Direction for
Testing Condition 1. 67
Figure 6.18: Envelope Spectrums of Cavitation and Normal Operating
Condition at Pump Bearing in Horizontal Direction for
Testing Condition 2. 67
Figure 6.19: Envelope Spectrum of Cavitation and Normal Operating
Condition at Pump Bearing in Horizontal Direction for
Testing Condition 3. 67
Figure 6.20: Envelope Spectrum of Cavitation and Normal Operating
Condition at Pump Bearing in Vertical Direction for
Testing Condition 1. 69
Figure 6.21: Envelope Spectrum of Cavitation and Normal Operating
Condition at Pump Bearing in Vertical Direction for
Testing Condition 2. 70
Figure 6.22: Envelope Spectrum of Cavitation and Normal Operating
Condition at Pump Bearing in Vertical Direction for
Testing Condition 3. 70
Figure 6.23: FFT Spectrum of Cavitation and Normal Operating Condition
at Pump Casing (rear) in Axial Direction for Testing Condition 1. 72
Figure 6.24: FFT Spectrum of Cavitation and Normal Operating Condition at
Pump Casing (rear) in Axial Direction for Testing Condition 2. 72
Figure 6.25: FFT Spectrum of Cavitation and Normal Operating Condition at
Pump Casing (rear) in Axial Direction for Testing Condition 3. 72
Figure 6.26: FFT Spectrum of Cavitation and Normal Operating Condition at
Pump Casing (Front) in Axial Direction for Testing Condition 1. 74
Figure 6.27: FFT Spectrum of Cavitation and Normal Operating Condition at
Pump Casing (Front) in Axial Direction for Testing Condition 2. 74
Figure 6.28: FFT Spectrum of Cavitation and Normal Operating Condition at
Pump Casing (Front) in Axial Direction for Testing Condition 3. 74
Figure 6.29: FFT Spectrum of Cavitation and Normal Operating Condition at
Pump Casing in Radial Direction for Testing Condition 1. 76
xvi
Figure 6.30: FFT Spectrum of Cavitation and Normal Operating Condition at
Pump Casing in Radial Direction for Testing Condition 2. 76
Figure 6.31: FFT Spectrum of Cavitation and Normal Operating Condition at
Pump Casing in Radial Direction for Testing Condition 3. 76
Figure 6.32: FFT Spectrum of Cavitation and Normal Operating Condition at
Pump Suction Flange in Axial Direction for Testing Condition 1. 78
Figure 6.33: FFT Spectrum of Cavitation and Normal Operating Condition at
Pump Suction Flange in Axial Direction for Testing Condition 2. 78
Figure 6.34: FFT Spectrum of Cavitation and Normal Operating Condition at
Pump Suction Flange in Axial Direction for Testing Condition 3. 78
Figure 6.35: FFT Spectrum of Cavitation and Normal Operating Condition
at Pump Discharge Flange in Vertical Direction for Testing
Condition 1. 80
Figure 6.36: FFT Spectrum of Cavitation and Normal Operating Condition
at Pump Discharge Flange in Vertical Direction for Testing
Condition 2. 80
Figure 6.37: FFT Spectrum of Cavitation and Normal Operating Condition
at Pump Discharge Flange in Vertical Direction for Testing
Condition 3. 80
Figure 6.38: FFT Spectrum of Cavitation and Normal Operating Condition at
Pump Bearing in Horizontal Direction for Testing Condition 1. 82
Figure 6.39: FFT Spectrum of Cavitation and Normal Operating Condition at
Pump Bearing in Horizontal Direction for Testing Condition 2. 82
Figure 6.40: FFT Spectrum of Cavitation and Normal Operating Condition at
Pump Bearing in Horizontal Direction for Testing Condition 3. 82
Figure 6.41: FFT Spectrum of Cavitation and Normal Operating Condition at
Pump Bearing in Vertical Direction for Testing Condition 1. 84
Figure 6.42: FFT Spectrum of Cavitation and Normal Operating Condition at
Pump Bearing in Vertical Direction for Testing Condition 2. 84
Figure 6.43: FFT Spectrum of Cavitation and Normal Operating Condition at
Pump Bearing in Vertical Condition for Testing Condition 3. 84
Figure 6.44: Comparison between normal and cavitation condition in time
domain for Testing Condition 1 85
Figure 6.45: Comparison between normal and cavitation condition in time
xvii
domain for Testing Condition 2 86
Figure 6.46: Comparison between normal and cavitation condition in time
domain for Testing Condition 3 86
Figure 6.47: Bump test at rear side of centrifugal pump casing (axial direction) 87
Figure 6.48: Bump test at front side of centrifugal pump casing (axial direction) 88
Figure 6.49: Bump test at centrifugal pump casing (radial direction) 88
Figure 6.50: Bump test at suction flange (axial direction) 88
Figure 6.51: Bump test at discharge flange (vertical direction) 89
Figure 6.52: Bump test at bearing (horizontal direction) 89
Figure 6.53: Bump test at bearing (vertical direction) 89
Figure 6.54: Comparison in Sound Pressure Level for Cavitation and
Normal Operating Condition for Testing Condition 1. 91
Figure 6.55: Comparison in Sound Pressure Level for Cavitation and
Normal Operating Condition for Testing Condition 2. 91
Figure 6.56: Comparison in Sound Pressure Level for Cavitation and
Normal Operating Condition for Testing Condition 3. 92
Figure 6.57: TDH vs Suction Pressure for Testing Condition 1 96
Figure 6.58: TDH vs Suction Pressure for Testing Condition 2 96
Figure 6.59: TDH vs Suction Pressure for Testing Condition 3 96
Figure 6.60: TDH vs NPSHa for Testing Condition 1 98
Figure 6.61: TDH vs NPSHa for Testing Condition 2 98
Figure 6.62: TDH vs NPSHa for Testing Condition 3 98
Figure 6.63: TDH vs Cavitation Number for Testing Condition 1 100
Figure 6.64: TDH vs Cavitation Number for Testing Condition 2 100
Figure 6.65: TDH vs Cavitation Number for Testing Condition 3 100
Figure 6.66: Suction Energy vs Cavitation Number for Testing Condition 1 102
Figure 6.67: Suction Energy vs Cavitation Number for Testing Condition 2 102
Figure 6.68: Suction Energy vs Cavitation Number for Testing Condition 3 102
Figure 6.69: TDH vs Flow Rate for Testing Condition 1 104
Figure 6.70: TDH vs Flow Rate for Testing Condition 2 104
Figure 6.71: TDH vs Flow Rate for Testing Condition 3 104
Figure 7.1: Cascade of FFT spectrum undertaken at the pump casing while
the suction pressure being decreased (Point A1 – A7) 111
Figure 8.1(a): SVP1 (in green color) & SVP2 (in blue color) located adjacent

xviii
each other 117
Figure 8.1(b): Schematic drawing of pumping installation 118
Figure 8.2: Damaged impeller 121
Figure 8.3: Timeline showing history of SVP1 impeller and field
investigations 122
Figure 8.4: A new impeller with revised design from the pump OEM was
then installed in September 2005 122
Figure 8.5(a): Accelerometer mounted on pump discharge base and casing 125
Figure 8.5(b): Accelerometer mounted on pump mounted on mechanical seal
(axial direction) 125
Figure 8.5(c): Accelerometer mounted on the motor (axial direction) 125
Figure 8.6: Comparison of vibration for SVP 1 and SVP 2 (Casing Pump
Discharge in horizontal direction undertaken on 1 October 2005)
(a) Velocity Spectra (0 Hz to 500 Hz) 127
(b) Zoom Spectra (0 Hz to 100 Hz) 128
Figure 8.7: Bump test results on several pump components.
(a) Pump Discharge Casing (0Hz to 100Hz) 128
(b) Casing pump discharge (100 Hz to 500 Hz) 129
(c) Pump Discharge Base 129
(d) Inner tube of the riser casing 129
(e) Mechanical Seal 130
(f) Shaft 130
(g) Impeller 130
Figure 8.8: Comparison of vibration for SVP1 & SVP2 (Pump Discharge
Base in axial direction undertaken on 1 October 2005)
(a) Acceleration Spectra (0 Hz to 3000 Hz) 131
(b) Velocity Spectra (0 Hz to 500 Hz) 131
Figure 8.9: Comparison of vibration for SVP1 and SVP 2 (Mechanical
Seal in axial direction undertaken on 1 October 2005)
(a) Velocity Spectra (0 Hz to 500 Hz) 132
(b) Acceleration Spectra (0 Hz to 1000 Hz) 132
(c) Acceleration Spectra (1000 Hz to 3000 Hz) 133
Figure 8.10: Comparison of vibration for SVP1 and SVP2 (Motor Casing
in axial direction undertaken on 1 October 2005). 134

xix
Figure 8.11: Comparison of vibration for SVP1 and SVP2 (Motor Casing
in transverse direction undertaken on 1 October 2005). 134
Figure 8.12: Comparison of vibration for SVP1 and SVP2 (Motor Casing
in horizontal direction undertaken on 1 October 2005). 134
Figure 8.13: Comparison of vibration for SVP 1 and SVP 2 in time
domain (Motor Casing in axial direction) 135
Figure 8.14: Comparison of vibration for SVP 1 and SVP 2 in time
domain (Motor Casing in transverse direction) 135
Figure 8.15: Comparison of vibration for SVP 1 and SVP 2 in time
domain (Motor Casing in horizontal direction) 135
Figure 8.16: Water Level Indicator 137
Figure 8.17: Comparison of vibration for SVP 1 and SVP 2 (Casing Pump
Discharge in horizontal direction undertaken on 18 January 2006) 138
Figure 8.18: Comparison of vibration for SVP1 operating in combined mode
and single mode (Casing Pump Discharge in horizontal direction) 139
Figure 8.19: Comparison of vibration for SVP2 operating in combined mode
and single mode (Casing Pump Discharge in horizontal direction) 139
Figure 8.20: Comparison of vibration for SVP 1 and SVP 2 (Pump Discharge
Base in axial direction undertaken on 18 January 2006).
(a) Velocity Spectra (0 Hz to 500 Hz) 141
(b) Acceleration Spectra (0 Hz to 3000 Hz) 141
Figure 8.21: Comparison of vibration for SVP1 operating in combined mode
and single mode (Pump Discharge Base in axial direction)
(a) Velocity Spectra (0 Hz to 500 Hz) 142
(b) Acceleration Spectra (0 Hz to 3000 Hz) 142
Figure 8.22: Comparison of vibration for SVP2 operating in combined mode
and single mode (Pump Discharge Base in axial direction)
(a) Velocity Spectra (0 Hz to 500 Hz) 143
(b) Acceleration Spectra (0 Hz to 3000 Hz) 143
Figure 8.23: Comparison of vibration for SVP 1 and SVP 2 (Mechanical
Seal in axial direction undertaken on 18 January 2006).
(a) Velocity Spectra (0 Hz to 500 Hz) 145
(b) Acceleration Spectra (0 Hz to 1000 Hz) 145
(c) Acceleration Spectra (1000 Hz to 3000 Hz) 145

xx
Figure 8.24: Comparison of vibration for SVP1 operating in combined mode
and single mode (Mechanical Seal in axial direction)
(a) Velocity Spectra (0 Hz to 500 Hz) 146
(b) Acceleration Spectra (0 Hz to 1000 Hz) 146
(c) Acceleration Spectra (1000 Hz to 3000 Hz) 146
Figure 8.25: Comparison of vibration for SVP 2 operating in combined mode
and single mode (Mechanical Seal in axial direction)
(a) Velocity Spectra (0 Hz to 500 Hz) 147
(b) Acceleration Spectra (0 Hz to 1000 Hz) 147
(c) Acceleration Spectra (1000 Hz to 3000 Hz) 147
Figure 8.26: Comparison of vibration for SVP1 and SVP2 (Casing Pump
Discharge in horizontal direction undertaken on 25 March 2006). 149
Figure 8.27: Comparison of vibration for SVP1 fitted with new impeller of
revised design and refurbished impeller (Casing Pump Discharge
in horizontal direction) 150
Figure 8.28: Comparison of vibration for SVP2 fitted with original impeller
undertaken on 1st visit and 3rd visit (Casing Pump Discharge in
horizontal direction) 150
Figure 8.29: Comparison of vibration for SVP1 and SVP2 (Pump Discharge
Base in axial direction undertaken on 25 March 2006)
(a) Velocity Spectra (0 Hz to 500 Hz) 152
(b) Acceleration Spectra (0 Hz to 3000 Hz) 152
Figure 8.30: Comparison of vibration for SVP1 fitted with new impeller of
revised design and refurbished impeller of original design (Pump
Discharge Base in axial direction)
(a) Velocity Spectra (0 Hz to 500 Hz) 153
(b) Acceleration Spectra (0 Hz to 3000 Hz) 153
Figure 8.31: Comparison of vibration for SVP2 fitted with original impeller
undertaken on 1st visit and 3rd visit (Pump Discharge Base in
axial direction)
(a) Velocity Spectra (0 Hz to 500 Hz) 154
(b) Acceleration Spectra (0 Hz to 3000 Hz) 154
Figure 8.32: Comparison of vibration for SVP1 and SVP2 (Mechanical Seal
in axial direction undertaken on 25 March 2006)

xxi
(a) Velocity Spectra (0 Hz to 500 Hz) 157
(b) Acceleration Spectra (0 Hz to 1000 Hz) 157
(c) Acceleration Spectra (1000 Hz to 3000 Hz) 157
Figure 8.33: Comparison of vibration for SVP1 fitted with new impeller of
revised design and refurbished impeller (Mechanical Seal in
axial direction)
(a) Velocity Spectra (0 Hz to 500 Hz) 158
(b) Acceleration Spectra (0 Hz to 1000 Hz) 158
(c) Acceleration Spectra (1000 Hz to 3000 Hz) 158
Figure 8.34: Comparison of vibration for SVP2 fitted with original impeller
undertaken on 1st visit and 3rd visit (Mechanical Seal in axial
direction)
(a) Velocity Spectra (0 Hz to 500 Hz) 159
(b) Acceleration Spectra (0 Hz to 1000 Hz) 159
(c) Acceleration Spectra (1000 Hz to 3000 Hz) 159
Figure 8.35: Comparison of vibration of SVP1 and SVP2 (Casing Pump
Discharge in horizontal direction undertaken on 26 May 2006) 161
Figure 8.36: Comparison of vibration for SVP1 fitted with new impeller of
revised design and new impeller of original design (Casing
Pump Discharge in horizontal direction) 162
Figure 8.37: Comparison of vibration for SVP2 fitted with original impeller
undertaken on 1st visit and 4th visit (Casing Pump Discharge in
horizontal direction) 162
Figure 8.38: Comparison of vibration of SVP1 and SVP2 (Pump Discharge
Base in axial direction undertaken on 26 May 2006)
(a) Velocity Spectra (0 Hz to 500 Hz) 164
(b) Acceleration Spectra (0 Hz to 3000 Hz) 164
Figure 8.39: Comparison of vibration of SVP1 fitted with new impeller of
revised design and new impeller of original design (Pump
Discharge Base in horizontal direction)
(a) Velocity Spectra (0 Hz to 500 Hz) 165
(b) Acceleration Spectra (0 Hz to 3000 Hz) 165
Figure 8.40: Comparison of vibration for SVP2 fitted with original impeller
undertaken on 1st visit and 4th visit (Pump Discharge Base in

xxii
axial direction)
(a) Velocity Spectra (0 Hz to 500 Hz) 166
(b) Acceleration Spectra (0 Hz to 3000 Hz) 166
Figure 8.41: Comparison of vibration for SVP1 and SVP2 (Mechanical Seal
in axial direction undertaken on 26 May 2006)
(a) Velocity Spectra (0 Hz to 500 Hz) 169
(b) Acceleration Spectra (0 Hz to 1000 Hz) 169
(c) Acceleration Spectra (1000 Hz to 3000 Hz) 169
Figure 8.42: Comparison of vibration for SVP1 fitted with new impeller of
revised design and new impeller of original design (Mechanical
seal in axial direction)
(a) Velocity Spectra (0 Hz to 500 Hz) 170
(b) Acceleration Spectra (0 Hz to 1000 Hz) 170
(c) Acceleration Spectra (1000 Hz to 3000 Hz) 170
Figure 8.43: Comparison of vibration for SVP2 fitted with original impeller
undertaken on 1st visit and 4th visit (Mechanical Seal in axial
direction)
(a) Velocity Spectra (0 Hz to 500 Hz) 171
(b) Acceleration Spectra (0 Hz to 1000 Hz) 171
(c) Acceleration Spectra (1000 Hz to 3000 Hz) 171
Figure 8.44 (a): Impellers (new) of the SVP1 after 3 Weeks Operations 173
Figure 8.44 (b): Shaft 173
Figure 8.45: Pitting Found on The Blade After 3 Weeks Operations. 174
Figure 8.46: Minimum submergence required 176
Figure 8.47: Design performance curve for SVP1 & SVP2 178
Figure 8.48: Typical performance curves fro individual and pumps
operating in parallel 178
Figure 8.49: Pitting on the Impeller of SVP2 during March 2006 179

xxiii
LIST OF ABBREVIATIONS
B.E.P - Best Efficiency Point
BPF - Blade Passing Frequency
BPFI - Inner Ball Passing Frequency
BPFO - Outer Ball Passing Frequency
CFD - Computational Fluid Dynamics
CHF - In currencies, this is the abbreviation for the Swiss Franc.
FFT - Fast Fourier Transform
GVF - Guide Vane Frequency
HPI - Hydrocarbon Processing Industry
NPSH - Net Positive Suction Head
NPSHa - Available Net Positive Suction Head
NPSHr - Required Net Positive Suction Head
SPL - Sound Pressure Level
SVP1 - Submerged Vertical Pump 1
SVP2 - Submerged Vertical Pump 2
TDH - Total Delivery Head
VDMA - German Engineering Federation (Verband Deutscher
Maschinen- und Anlagenbau)
xxiv
LIST OF APPENDICES
APPENDIX TITLE PAGE
A1 H-II Launch Vehicle Flight #8 196
A2 Theoretical Background 198
A3 Envelope Analysis Theories 206
A4 Application Note: Envelope Analysis 207
A5 Example Calculation for Testing Condition 1 215
A6 Photographs of Vibration Measurement Location 218
A7 Pump Curve of the Centrifugal Pump 222
A8 Bearing Frequency Calculator 223

CHAPTER 1
INTRODUCTION
1.1 Overview
Imagine a world without pumps. It is hard as pumps are everywhere.
Modernization had changed the life style, of the human mankind where mechanical
equipments such as pumps plays a vital role in various industries. These industries
include water, oil and gas, petrochemical, power generation, etc. The common usage and
application area of centrifugal pump are tabulated in Table 1.1. This work was
undertaken to investigate a problem that often affect the reliabilities of a pump.
From the estimation of new pump market done by Sulzer Pumps (2006) as
shown in Figure 1.1, centrifugal pump consists more than 70% of the estimated new
pump market with a financial cost of 16 billions CHF. It is therefore not surprising that
continuous extensive research & development for pump manufacturers and operators
had been undertaken.

2
Centrifugal Pump Application Areas Energy • Feedwater Circuit
• Condensate Circuit • Cooling Water Circuit • Auxiliary Circuits
Oil • Water Injection • Oil Pipeline Pumps • Petrochemicals
Water • Seawater Transport • Drinking Water Supplies • Irrigation • Drainage • Sewage
Industry • Mine Drainage • Sugar Refining • Paper Production • Marine Duties • Hydraulic Conveyance of Solids • Flue-gas desulphurization • Seawater desalination
Table 1.1 Centrifugal pump application areas • Energy Recovery
Figure 1.1: Estimated new pumps market (extracted from Sulzer Pumps)
3
A study done by Yates (1996) showed that pumps consume approximately 25%
of the national electricity of United Kingdom. This was consistent with finding of Bloch
and Budris (2005) that centrifugal pumps represent the most frequently utilized machine
on the earth. It has estimated that over 100,000,000,000 of them are in use worldwide,
consuming approximately 20% of the world’s energy demand. Various research and
studies have shown that improvements to pumping plant performance would save 12.5%
and improvements in pumping systems and operation could save a further 37.5%
(Yates). To conserve energy, pumps need to operate at high efficiency. An efficiency
drop would imply more power input for the same flow. Selection and design do affect
the efficiency and reliability of a pumping system. Although an appropriate selection
may be done, the operating parameters in real industry do vary over the time. The plant
maintenance personnel strive to enhance the reliability of machinery.
Various faults can occur in the centrifugal pump that results in low efficiency
operation of centrifugal pump. The survey carried out on behalf of the VDMA showed
that 80% of the pump failures in the chemical and process industries were from
cavitation, dry run, gas containing liquids, externally excited vibrations, imbalance, wear
of bearing and blockage (pressure side and/or suction side gate valve closed). It was
found that cavitation is however the most common faults.
Cavitation-related phenomena include such diverse occurrence such as erosion of
ship propellers, ultrasonic cleaning, detection of high energy particles, fragmentation of
biological cells, etc (Young, 1999). Cavitation also occurs in the body of a human-being.
While flying, a rapid drop in the cabin pressure at high altitude will cause cavitation in
the blood. When a diver comes to the surface too fast after a deep dive, cavitation also
will occur. Cavitation may cause damage to heart valves, and at the junction of arteries
may cause to heart valves. Artificial mechanical pump could be damaged due to
cavitation. A useful medical application of cavitation is however ultrasound. The
cavitation induced at the tip of this probe creates the desired effect when it is placed

4
close to the tissue or solid material. One of the earliest uses of an ultrasonic probe was in
dentistry, where ultrasonic probes are now commonly used to clean teeth. Another
interesting use of cavitation in blood systems is the removal of a thrombus consisting of
a quantity of coagulated blood that blocks the blood vessel, by inserting a hollow ultra
sonic waveguide of small diameter into the blood vessel.
While cavitation can have useful application, cavitations in the industry are often
with serious consequence. On 15 November 1999, H-II Flight #8 was officially launched
from Tanegashima Space Center, Japan (which is appended in Appendix). The first
stage engine suddenly failed after 3 minutes and 59 seconds upon launching.
Investigation showed that cavitation in the turbo pump was the root cause. The blade in
the turbo pump and inlet of the liquid hydrogen turbo pump broke, resulting in a
stoppage of the supply of the propellant. This resulted in a sudden failure of the engine.
A more common occurrence covering the entire industry is relates to cavitation
in pumps and hydraulic machines in general. In this work, cavitation detection study
focused primarily on pumps. Experimental studies were carried out to detect cavitation
in a centrifugal pump using vibration analysis. Background studies were undertaken and
an experimental test rig was fabricated for cavitation induced investigations. Sound,
pressure, flow rate were measured for both cavitation and normal operating conditions.
Field investigation was undertaken, with vibration measurements on vertical submerged
pumps in a power generation plant with suspected cavitation failures. Cavitation and
flow excited vibration on the pump was successfully detected with vibration diagnosis.

5
1.2 Problem Formulation
In the Malaysian industry, pumps have often been blamed as the source of the
problem when cavitation related damages occur even though the source of a problem
may be in the work process or system design. Some end-users are reluctant to accept the
fact that changes in their process has indeed upset the pumping condition and causing
the cavitation to be more severe. The detection of cavitation in centrifugal pump is then
an important task in the industry.
It is often possible that changes in the process have been evolving which may
result in conditions conducive to cavitation. Pump performance such as efficiency, flow
rate or head (pressure) deteriorate over the time. Another common cause of cavitation in
pump relates to the system design error. If the cavitation detection is not carried out,
remedial work may not be initiated. The failure of pump could potential repeat.
Unscheduled downtime will inevitably result in production loss and disruptions to the
entire plant. Having the ability to detect the fault could reduce downtime and prevents
catastrophic failure.
While cavitation can often be detected with pressure measurements, it had been
noted that many pumps in the industry do not come adequately installed with pressure or
flow sensors. Even if such sensors are installed, it is common that such measurement
devices are not functional over time. As a result, pressure or flow drop during cavitation
could not be detected even though the net positive suction head available (NPSHa) is
lower than net positive suction head required (NPSHr), where cavitation would be
expected to occur. Vibration analysis is hereby investigated as an indicator and detector
of cavitation over and above its conventional use in mechanical severity assessment.

6
Cavitation often results in failure of the impellers, which is often preceded by
premature failures of the mechanical seals. Failure of the impeller has serious
consequential damage to the pump. Cavitation occurrence in the pump also results
performance degradation of the pumps and this is usually not desirable. The detection of
cavitation is obviously necessary, and a simple and robust technique using vibration
analysis warrants the work reported herein.
1.3 Objectives of the Study
The objective of this work was to investigate vibration analysis in the detection
of cavitation in centrifugal pumps using a laboratory test rig where cavitation would be
induced under controlled condition. The vibration analysis technique shall then be used
in a case study of actual pumps in an industrial facility.
1.4 Scopes of the Study
The scope of work involved the following.
1. A test facility involving a centrifugal pump where cavitation could be induced
had to be fabricated. Suitable pressure and flow measurement devices were
installed such that parameters affecting cavitation could be correlated. Both
vibration and sound were measured.
7
2. Characteristic of cavitation experienced in the centrifugal pump under different
operating points was studied. Comparison of cavitation and normal running
condition are made. Fourier Analysis and Envelope Analysis have been carried
out for vibration data. Analysis on sound pressure level, pressure and flow have
been done
3. Field measurements were undertaken at an Independent Power Producer (power
generation plant) to investigate a suspected cavitation and flow excited vibrations
failure in the submerged vertical pumps.


![[Adventure] [9586] A Paladin in Hell](https://img.pdfslide.us/doc/110x75/553dadf14a7959c6368b473a/adventure-9586-a-paladin-in-hell.jpg)