Embed Size (px)
Citation preview
Who’s Favored by Evaluative Voting? AnExperiment Conducted During the 2012
French Presidential Election∗
Antoinette Baujard†,Frédéric Gavrel‡,
Herrade Igersheim§,Jean-François Laslier¶,
Isabelle Lebon‖
February 9, 2013
Abstract
Under evaluative voting, the voter freely grades each candidate ona numerical scale, with the winning candidate being determined bythe sum of the grades they receive. This paper compares evaluativevoting with the two-round system, reporting on an experiment whichused various evaluation scales, conducted during the first round ofthe 2012 French presidential election. Invitations to participate in thestudy were extended to around 5,000 voters in three cities, and theexperiment attracted 2,340 participants. Basing our argument on the
∗We extend grateful thanks to all the members of the Community Councils,all the participants, and all the volunteers who helped us on April 22. (Seehttp://www.gate.cnrs.fr/spip.php?rubrique94#Merci).†GATE L-SE (UMR CNRS 5824), University Jean Monnet, 42 000 Saint-Etienne,
France, [email protected]‡CREM (UMR CNRS 6211), University of Caen Basse-Normandie, 14 000 Caen,
France, [email protected]§CNRS and Beta (UMR CNRS 7522), University of Strasbourg, 67 085 Stras-
bourg,France, [email protected]¶PREG (UMR CNRS 7176), Ecole polytechnique, 91 128 Palaiseau, France, jean-
[email protected]‖CREM (UMR CNRS 6211), University of Caen Basse-Normandie, 14 000 Caen, France
1
ranks, relative scores, and grade profiles of candidates, we show thatthe two-round system favors “exclusive” candidates, that is candidateswho elicit strong feelings, while evaluative rules favor “inclusive” can-didates, that is candidates who attract the support of a large span ofthe electorate. These differences are explained by two complementaryreasons: the opportunity for the voter to support several candidatesunder evaluative voting rules, and the specific pattern of strategic vot-ing under the official, two-round voting rule.
Classification JEL: D72, C93Keywords: Voting, In Situ Experiment, Evaluative Voting, Ap-
proval Voting, Two-round system
2
A voting rule is supposed to be able to determine the candidate most
favored by a community of voters. However, it is a well-established conclusion
of social choice theory that voting by itself is mathematically incapable of
picking the single and uncontroversial winner of an election (Arrow 1957).
For a given set of electoral preferences, different voting rules may elect or
favor distinct candidates (Forsythe et al. 1996; Van der Straeten et al. 2010;
Baujard and Igersheim 2011a, 2011b). However, little research has thus far
been conducted on the kinds of winners, or the different types of rankings,
which are induced by different voting rules. This article contributes to this
gap in the literature by providing a comparative study of which candidates
are favored by different modalities of evaluative voting rules as compared to
those favored by the two-round system.
By “evaluative voting,” we refer to voting rules in which the voter freely
grades each candidate on a pre-defined numerical scale. The same grade may
be given to several candidates. The sum of the grades a candidate received
is her score, and the candidate who gets the highest score is elected. Evalua-
tive voting, also called utilitarian voting, or range voting, is historically and
conceptually linked to the utilitarian paradigm (Bentham 1822; Dhillon and
Mertens 1999; Hillinger 2005). While the principle of additive evaluation is
widely used in practice (schools, sports, market research, feeling thermome-
ters, etc.), the idea seems to be absent from the political science literature,
and social choice theory has, until recently, paid only limited attention to it
as a voting mechanism (see, however, Hillinger 2004a, 2004b; Smaoui 2007;
Gaertner and Xu 2012; Núñez and Laslier 2012).
Approval Voting is a particular case of evaluative voting which employs
3
the minimal scale {0, 1}; thus, under this rule the voter may simply approve
or disapprove each candidate. The score of each candidate is the number of
approvals she receives, and the candidate with the largest score is elected.
Brams and Fishburn introduced this rule to the academic literature in the late
seventies (Brams and Fishburn 1978), and by now it has become a standard
voting rule, widely studied by theorists (see notably Brams and Fishburn
2005, Laslier and Sanver 2010).
To our knowledge, none of these evaluative voting rules is currently in
use for any national presidential elections (nor indeed for any other official
elections). Run-off systems are the most common rules used for direct pres-
idential elections (Blais et al. 1997). In France, since 1962, the presidential
elections are direct and the voting rule is the following two-round system:
if no candidate receives a majority of votes in the first round of voting, the
two highest-scoring candidates arrive at a run-off. A question thus naturally
arises: What would happen if presidential voting was conducted according
to an evaluative rule? In this paper, we aim to shed light on the properties
of evaluative voting. In particular, we offer new insights in answer to the fol-
lowing questions: Could evaluative voting rules be used for official elections?
and, Would different results then be obtained?
Our investigation is based on experimental data collected in April 2012
during the first round of the French presidential elections. Experiments on
voting rules during actual political elections have been taking place in various
localities since 2002.1 Grofman proposed the term In Situ experiments to
describe this method, according to which voters are offered an opportunity,
at the time and place of a real election, to express how they would have
4
voted under alternative voting rules (Grofman, Dolez and Laurent 2011)2.
On April 22nd, 2012, during the first round of the 2012 presidential elections
in France, we tested alternative rules in five voting stations. Invitations
to participate were extended to more than 5,000 voters, with 2,340 people
eventually taking part. The rules under test were approval voting (henceforth
AV), and other variants of evaluative voting (henceforth EV), using the scales
{0, 1, 2}, {−1, 0,+1}, and {0, 1, ..., 20}. Henceforth we refer to these voting
rules respectively as EV(0,1,2), EV(-1,0,+1), and EV(0,...,20).
The state of the art with respect to previous experiments on AV can
be summarized as follows (see Baujard and Igersheim, 2010 for more de-
tails). (i) Such experiments are feasible, and most voters welcome the idea of
experimenting with voting rules. (ii) The principles of AV or EV are easily
understood; voters are particularly favorable to EV. (iii) Within the observed
political context, AV and EV modify the overall ranking of candidates com-
pared to the official first round voting rule, and might indeed yield different
outcomes.
The 2012 experiment confirms these results and allows us to go further
in the comparison of the properties of the variants of evaluative voting and
the two-round system. In this paper, we focus in particular on the analysis
of their influence with respect to the fate of the candidates: who wins, who
loses, and why?
To do so, we here develop two symmetric notions based on the kind of
relationship the candidates have with the voters. Candidates who arouse
strong feelings, whether positive or negative, among voters, are called “exclu-
sive” candidates; while candidates who are liked by a large number of voters,
5
but not necessarily strongly liked, nor in a way that excludes support for
others, are called “inclusive” candidates.
After a quick presentation of the experimental protocol, we first show that
these alternative rules favor “inclusive” candidates, while the official French
system,i.e., the two-round system, favors “exclusive” candidates. Next, we
argue that this property is caused by two factors: a mechanical factor which
concerns the greater potential for expression offered by evaluative voting
rules; and a behavioral factor which concerns the specific patterns of strategic
voting which voters adopt under the two-round system. While the mechanical
factor favors inclusive candidates under evaluative voting, the behavioral
factor advantages exclusive candidates under the two-round system.
Experimental design and adjusted data
Before setting out our analysis it is first necessary to explain the exper-
imental design and the principles upon which the subsequent adjustment
of the data was based. Further details regarding the experimental protocol
(information on voters, progress, and experimental ballots) and the results
(participation and expression rates, raw results, data adjustment techniques)
are provided in the Supporting Information.
During the first round of the 2012 French presidential elections, certain
voters were invited to take part in our experiment and test two other vot-
ing rules, once they had voted in the official ballot. Five voting stations,
located in three different cities, were selected to host the experiment: the
two voting stations of the village of Louvigny, Normandy; one voting sta-
6
tion in the city of Saint-Etienne, Rhône-Alpes; and two voting stations in
the city of Strasbourg, Alsace. Among the 5,371 voters registered for these
five voting stations,3 all 4,319 voters who actually showed up for the offi-
cial elections were invited to join the experiment. Of these, 2,340 agreed to
participate. Participants in Saint-Etienne, Louvigny, and Strasbourg tested
both approval voting (AV) and evaluative voting (EV) – EV(0,1,2), EV(-
1,0,+1), and EV(0,1,...,20), respectively. By the end of the day, each voter
had voted three times: once officially with the first round of the two-round
plurality vote, a second time with approval voting, and a third time with one
of the other variants of evaluative voting. We obtained distinct rankings and
scores for the candidates for each of the rules, as displayed in the Supporting
Information.
We cannot, however, use this raw data to make a direct comparison of the
scores and rankings for the different rules. This is for two reasons. Firstly, the
experimental protocol did not permit us to set up a control group, since the
invitation to participate, on a voluntary and anonymous basis, was extended
to all voters who took part in the official election in the voting stations in
question. In spite of a relatively high participation rate – an average of 54%
of the registered voters who showed up for the official election also cast an
experimental vote –, we face a participation bias. Not only are the voters
who voted experimentally fewer in number than the official voters, but they
also vote differently: the proportion of votes for certain candidates seemed
higher (or lower) among the participants of the experiment than among the
wider set of voters in the official election. Hence we need to correct for
the participation bias in order to compare rankings and scores between the
7
official and the various tested rules. Secondly, the electorate for each of
the tested voting stations is different, such that comparisons between the
different variants of evaluative voting, as applied to different cities, would
not make sense. What is more, this geographical bias means that we cannot
interpret the results as holding at the national level. Hence we corrected for
the geographical bias in order to compare all rankings together and to allow
the experimental results, suitably adjusted, to be meaningful at the national
level.
In 2012, we asked participants to answer a questionnaire, reproduced on
the ballot, which invited them to reveal their official vote. We obtained 1, 294
useful answers to this question – i.e. 55%. We chose to restrict our attention
to these voters’ ballots only. For each of them, we know both the voter’s
official vote and her experimental votes. For instance, we note that 41.11% of
the experimental participants declared that they voted for François Hollande,
while only 33.16% of the actual voters did so in the official corresponding
voting stations – a difference which is due to the participation bias –, and
only 28.63% France-wide – a difference which is due to the geographical bias.
These differences allow us to compute a weighting for this candidate, or more
accurately a weighting for the experimental ballots of the participants who
declared they officially voted for him. This can be done for each of the ten
candidates. We may thus correct both biases and compute the adjusted data
for AV, and for the three variants of EV. All the remaining analyses are
based on these adjusted data. An extensive explanation of this treatment is
provided in the Supporting Information.
8
Who is favored by which voting rule?
The differences observed between the results according to the voting rules
allow us to characterize and categorize the candidates.
Comparing the ranks of candidates
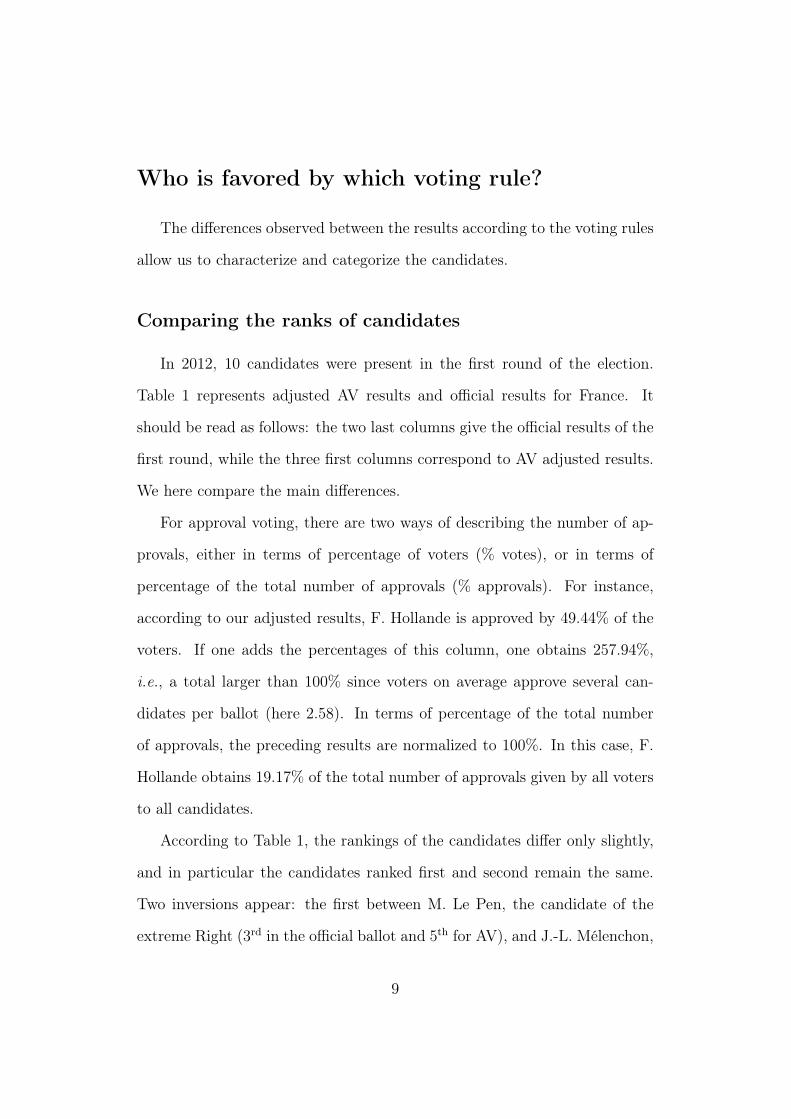
In 2012, 10 candidates were present in the first round of the election.
Table 1 represents adjusted AV results and official results for France. It
should be read as follows: the two last columns give the official results of the
first round, while the three first columns correspond to AV adjusted results.
We here compare the main differences.
For approval voting, there are two ways of describing the number of ap-
provals, either in terms of percentage of voters (% votes), or in terms of
percentage of the total number of approvals (% approvals). For instance,
according to our adjusted results, F. Hollande is approved by 49.44% of the
voters. If one adds the percentages of this column, one obtains 257.94%,
i.e., a total larger than 100% since voters on average approve several can-
didates per ballot (here 2.58). In terms of percentage of the total number
of approvals, the preceding results are normalized to 100%. In this case, F.
Hollande obtains 19.17% of the total number of approvals given by all voters
to all candidates.
According to Table 1, the rankings of the candidates differ only slightly,
and in particular the candidates ranked first and second remain the same.
Two inversions appear: the first between M. Le Pen, the candidate of the
extreme Right (3rd in the official ballot and 5th for AV), and J.-L. Mélenchon,
9
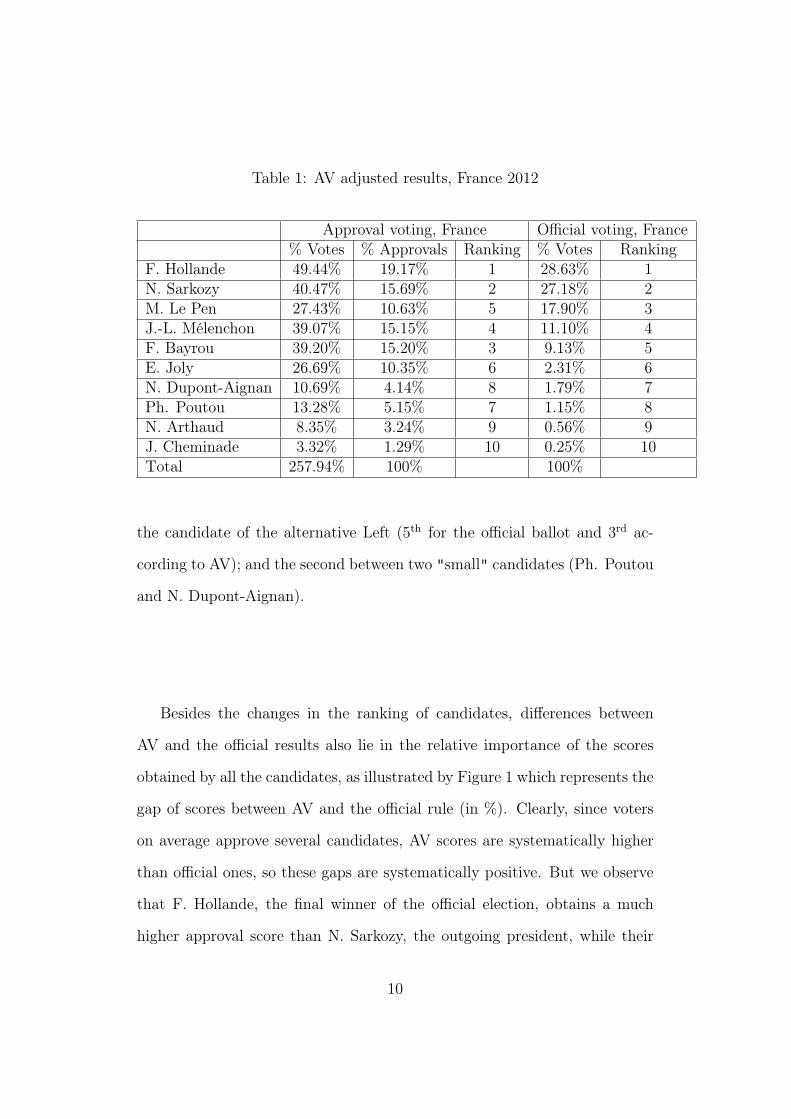
Table 1: AV adjusted results, France 2012
Approval voting, France Official voting, France% Votes % Approvals Ranking % Votes Ranking
F. Hollande 49.44% 19.17% 1 28.63% 1N. Sarkozy 40.47% 15.69% 2 27.18% 2M. Le Pen 27.43% 10.63% 5 17.90% 3J.-L. Mélenchon 39.07% 15.15% 4 11.10% 4F. Bayrou 39.20% 15.20% 3 9.13% 5E. Joly 26.69% 10.35% 6 2.31% 6N. Dupont-Aignan 10.69% 4.14% 8 1.79% 7Ph. Poutou 13.28% 5.15% 7 1.15% 8N. Arthaud 8.35% 3.24% 9 0.56% 9J. Cheminade 3.32% 1.29% 10 0.25% 10Total 257.94% 100% 100%
the candidate of the alternative Left (5th for the official ballot and 3rd ac-
cording to AV); and the second between two "small" candidates (Ph. Poutou
and N. Dupont-Aignan).
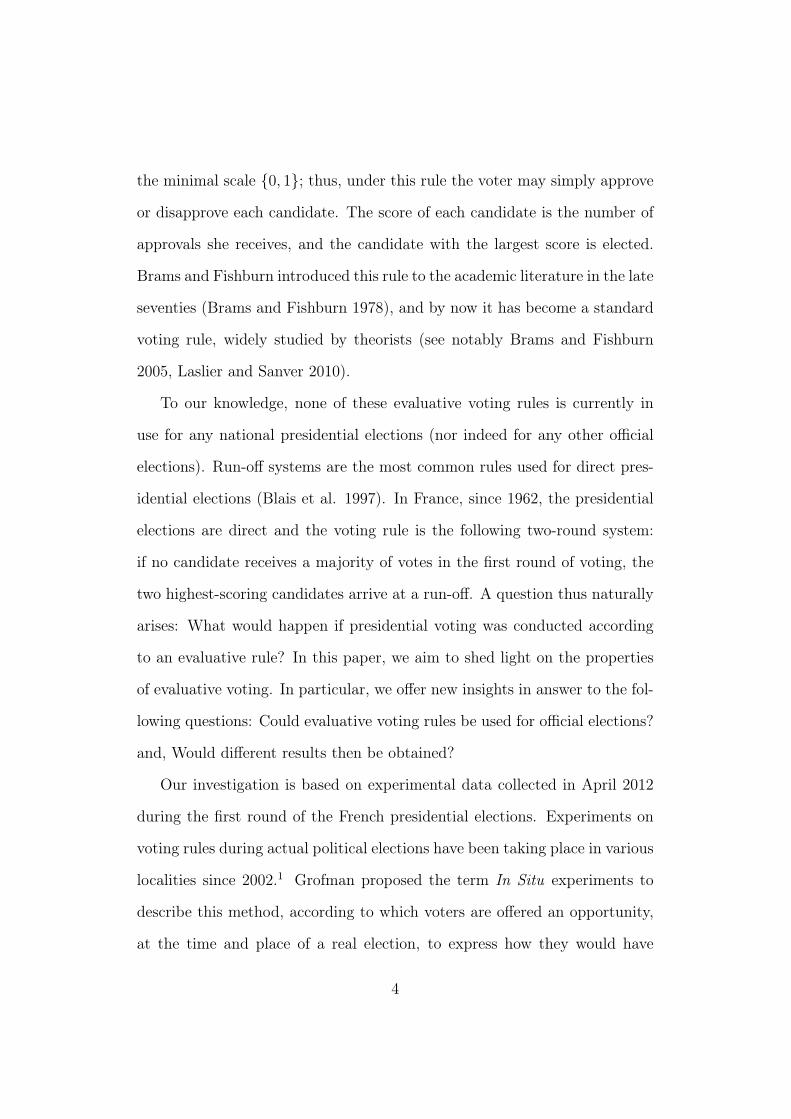
Besides the changes in the ranking of candidates, differences between
AV and the official results also lie in the relative importance of the scores
obtained by all the candidates, as illustrated by Figure 1 which represents the
gap of scores between AV and the official rule (in %). Clearly, since voters
on average approve several candidates, AV scores are systematically higher
than official ones, so these gaps are systematically positive. But we observe
that F. Hollande, the final winner of the official election, obtains a much
higher approval score than N. Sarkozy, the outgoing president, while their
10
Figure 1: Gaps of scores between AV and official results, France 2012
official scores are rather similar. Further, F. Bayrou, a centrist candidate and
presumably the Condorcet winner in 2007 and 2012,4 and J.-L. Mélenchon,
the leader of the alternative Left, obtain comparable approval scores, which
are completely discordant with the official results and bring them close to
N. Sarkozy. E. Joly, the Green candidate, generally ignored by the official
method, is now comparable to M. Le Pen, the candidate of the extreme Right,
who on the contrary gains relatively fewer votes as we pass from official voting
to AV.
In brief, and as show in Figure 1, some candidates seem to benefit from
the move from a two-round system to AV (F. Hollande, J.-L. Mélenchon,
F. Bayrou, E. Joly), while others seem either to lose or to remain relatively
stable (N. Sarkozy, M. Le Pen). One should note further that for some
"small" candidates – characterized by the fact that they are little known, or
11
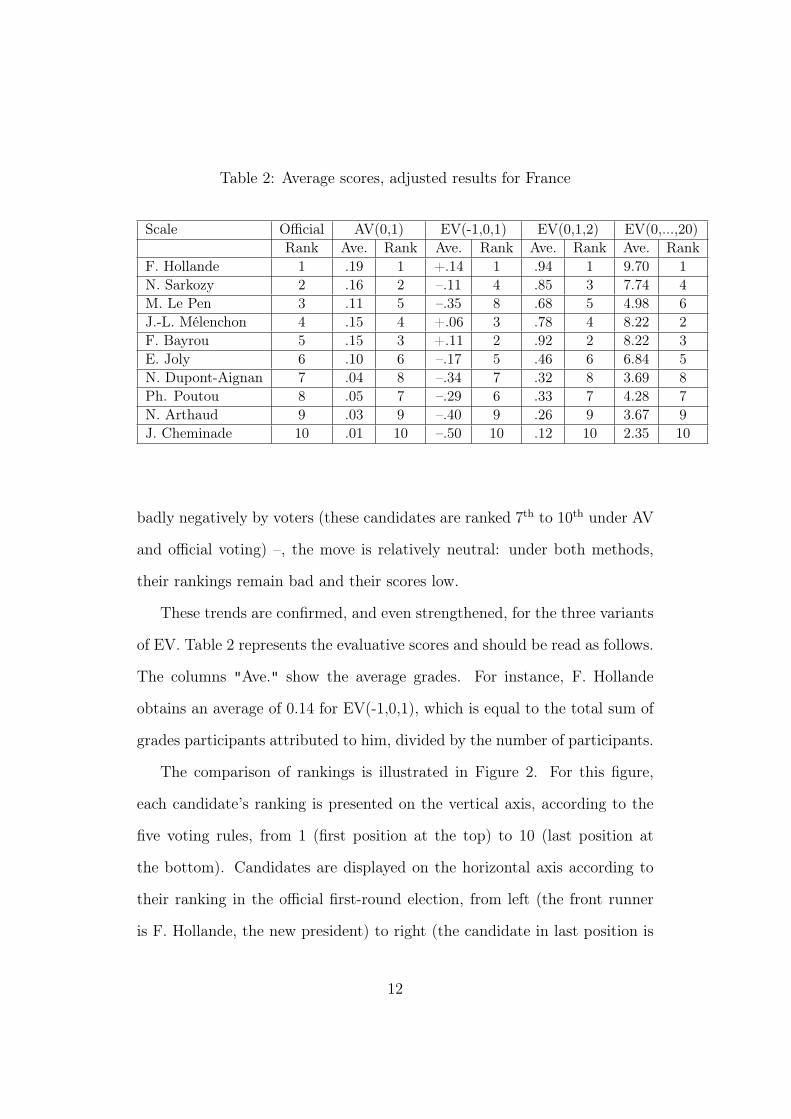
Table 2: Average scores, adjusted results for France
Scale Official AV(0,1) EV(-1,0,1) EV(0,1,2) EV(0,...,20)Rank Ave. Rank Ave. Rank Ave. Rank Ave. Rank
F. Hollande 1 .19 1 +.14 1 .94 1 9.70 1N. Sarkozy 2 .16 2 –.11 4 .85 3 7.74 4M. Le Pen 3 .11 5 –.35 8 .68 5 4.98 6J.-L. Mélenchon 4 .15 4 +.06 3 .78 4 8.22 2F. Bayrou 5 .15 3 +.11 2 .92 2 8.22 3E. Joly 6 .10 6 –.17 5 .46 6 6.84 5N. Dupont-Aignan 7 .04 8 –.34 7 .32 8 3.69 8Ph. Poutou 8 .05 7 –.29 6 .33 7 4.28 7N. Arthaud 9 .03 9 –.40 9 .26 9 3.67 9J. Cheminade 10 .01 10 –.50 10 .12 10 2.35 10
badly negatively by voters (these candidates are ranked 7th to 10th under AV
and official voting) –, the move is relatively neutral: under both methods,
their rankings remain bad and their scores low.
These trends are confirmed, and even strengthened, for the three variants
of EV. Table 2 represents the evaluative scores and should be read as follows.
The columns "Ave." show the average grades. For instance, F. Hollande
obtains an average of 0.14 for EV(-1,0,1), which is equal to the total sum of
grades participants attributed to him, divided by the number of participants.
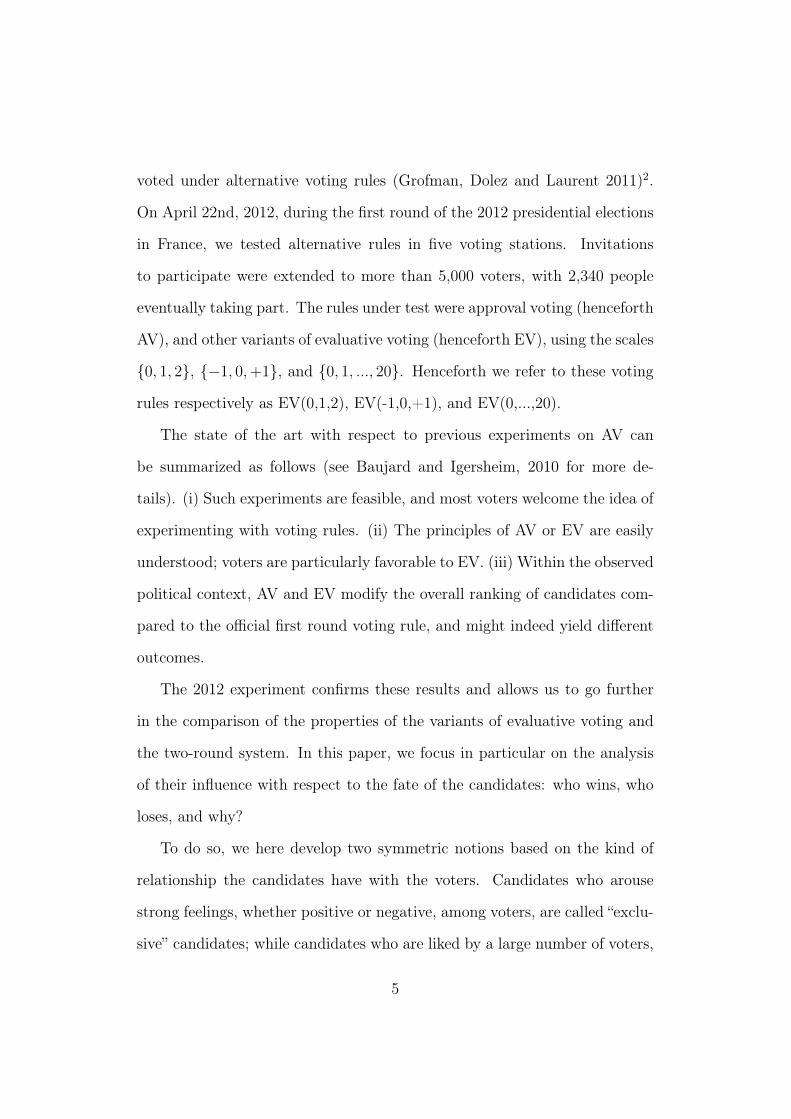
The comparison of rankings is illustrated in Figure 2. For this figure,
each candidate’s ranking is presented on the vertical axis, according to the
five voting rules, from 1 (first position at the top) to 10 (last position at
the bottom). Candidates are displayed on the horizontal axis according to
their ranking in the official first-round election, from left (the front runner
is F. Hollande, the new president) to right (the candidate in last position is
12
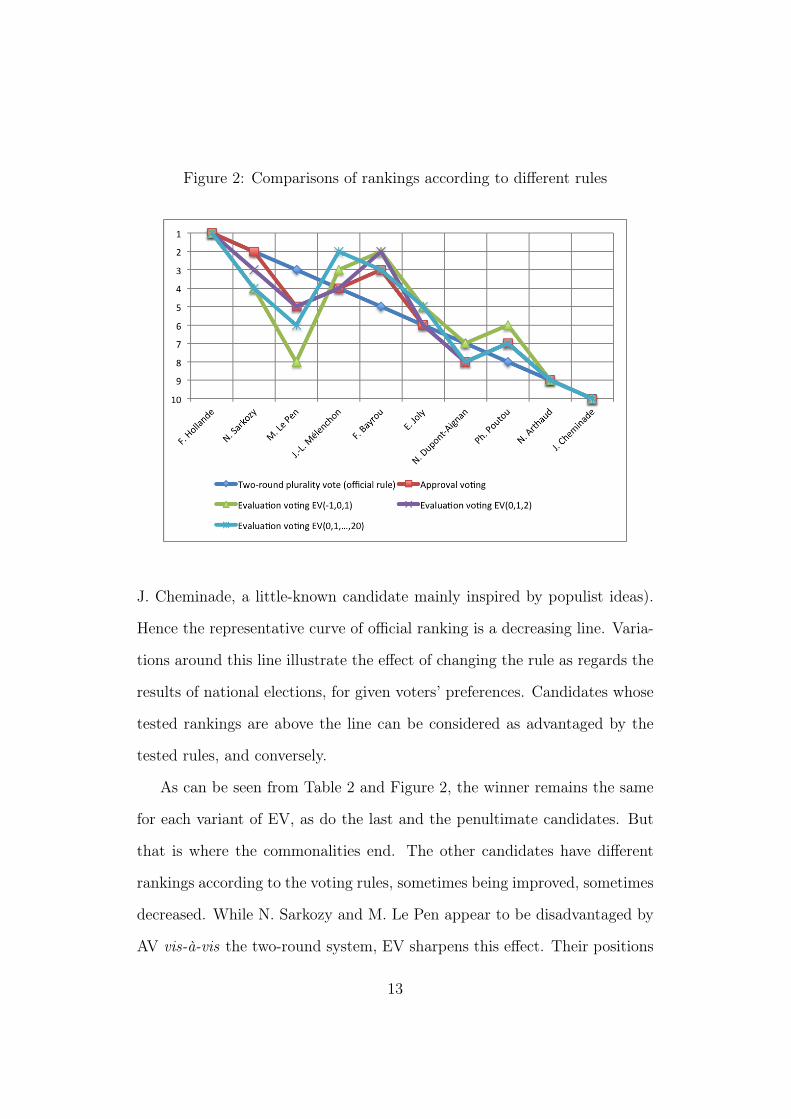
Figure 2: Comparisons of rankings according to different rules
J. Cheminade, a little-known candidate mainly inspired by populist ideas).
Hence the representative curve of official ranking is a decreasing line. Varia-
tions around this line illustrate the effect of changing the rule as regards the
results of national elections, for given voters’ preferences. Candidates whose
tested rankings are above the line can be considered as advantaged by the
tested rules, and conversely.
As can be seen from Table 2 and Figure 2, the winner remains the same
for each variant of EV, as do the last and the penultimate candidates. But
that is where the commonalities end. The other candidates have different
rankings according to the voting rules, sometimes being improved, sometimes
decreased. While N. Sarkozy and M. Le Pen appear to be disadvantaged by
AV vis-à-vis the two-round system, EV sharpens this effect. Their positions
13
are systematically worse with approval ranking than with the official two-
round ranking, and even worse with EV rankings. Indeed, N. Sarkozy remains
second with AV, but goes down to the third and fourth positions with EV.
The extreme-right candidate M. Le Pen, who is ranked third according to
the official rule, drops to fifth position with AV and with EV(0,1,2), to sixth
position with EV(0,...,20), and eighth position with EV(-1,0,1). With EV(-
1,0,1), a voting rule which seems particularly disadvantageous for her, M.
Le Pen falls to the level of the small candidates. Conversely, going from
official voting to AV is advantageous for candidates such as J.-L. Mélenchon,
F. Bayrou, or E. Joly. The same remark holds symmetrically for them: their
positions are systematically better or equal in moving from the official two-
round to AV, and from AV to EV. The fact that E. Joly’s, F. Bayrou’s,
and J.-L. Mélenchon’s rankings increase significantly with the experimental
votes mean that they benefit from an important degree of voter adherence –
something which, at first sight, the official rule fails to capture. For instance,
more than 39 % of voters are likely to approve F. Bayrou and J.-L. Mélenchon,
and almost 27% E. Joly. By contrast, their official scores do not exceed 10%,
12%, and 3% respectively. Finally, four candidates who come last under all
the tested rules as well as the official rule can definitely be considered as
small (N. Arthaud, J. Cheminade, N. Dupont-Aignan, Ph. Poutou).
The AV and EV results provide a basis on which we may pursue our reflec-
tions on the properties of the various voting rules. It has been stressed that
the rankings and scores of the candidates are very different as between the
official rule and the four tested rules; yet while certain scales may strengthen
the gaps, the different evaluative rules that we tested do generate similar
14
trends. Evaluative voting rules seem to advantage some candidates and to
disadvantage others. In the rest of this section, we attempt to identify the
types of candidates these rules favor (or, respectively, disfavor).
Comparing the relative approval scores of candidates
Let us investigate the nature of the candidates using the AV adjusted
data (we shall turn to the EV data in the next subsection).
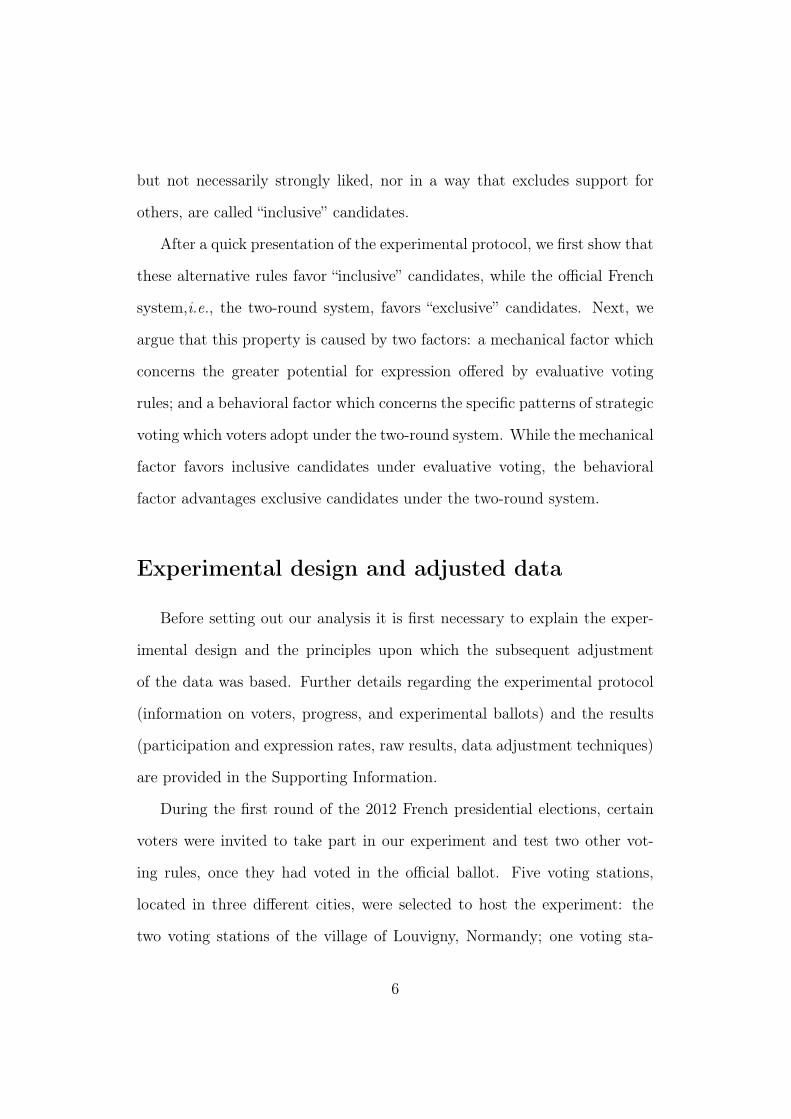
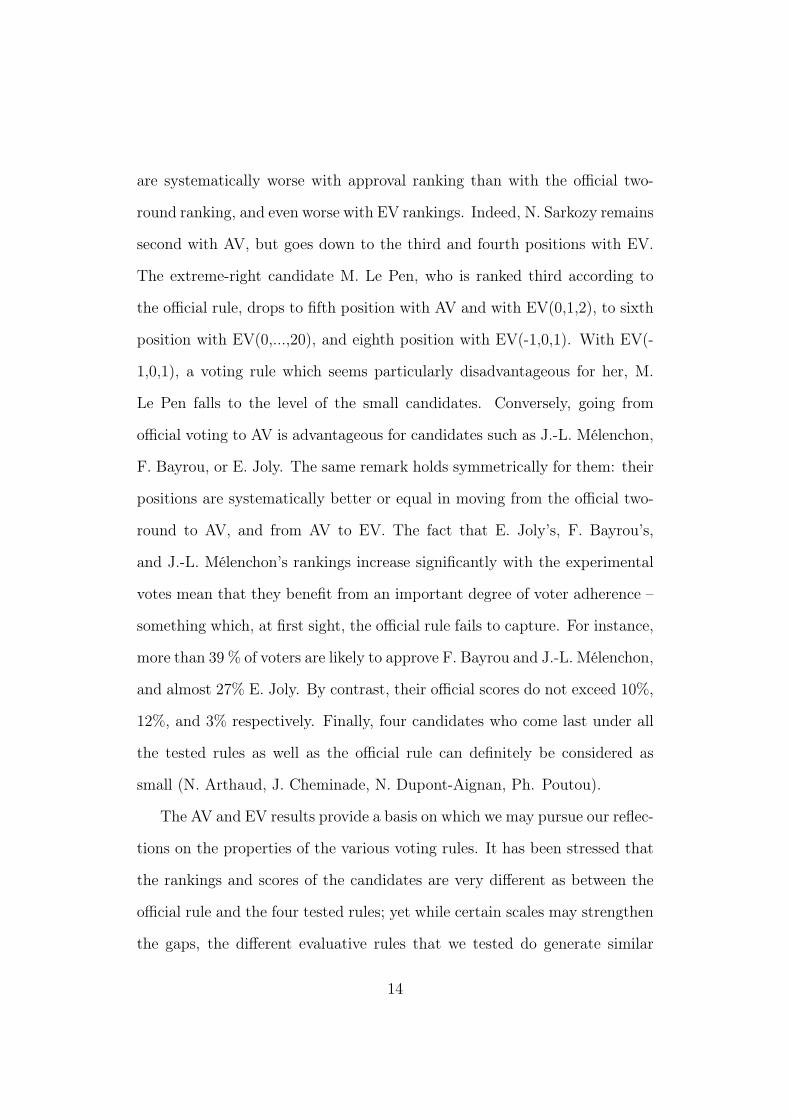
Figure 3 is based on the columns % of approvals (for AV) and % votes
(for official voting) of Table 1. It should be noted that point-wise compar-
ison is not meaningful here since the “% approvals” represents a percentage
relative to the total number of approvals, while the “% votes” corresponds
to a percentage relative to voters. But it remains interesting to compare the
general aspect of these curves. It should be stressed in particular that they
intersect with each other just once. Tables 3a and 3b represent two other
statistics based on our AV adjusted data with respect to voters’ official vote.
Table 3a provides the average number of approvals according to the voters’
official vote. For instance, the voters who declared an official vote in favor
of F. Hollande gave on average 2.77 approvals per ballot.5 Table 3b, mean-
while, describes the extent to which a candidate is approved by voters who
did not vote for him/her officially; it shows the percentage of voters who gave
an approval to a candidate from among those who did not give them their
official vote. Here we see that only 19% of voters who did not officially vote
for N. Sarkozy gave him an approval, while 31% did so for J.-L. Mélenchon.
Three characteristics of the official voting method vis-à-vis AV emerge
15
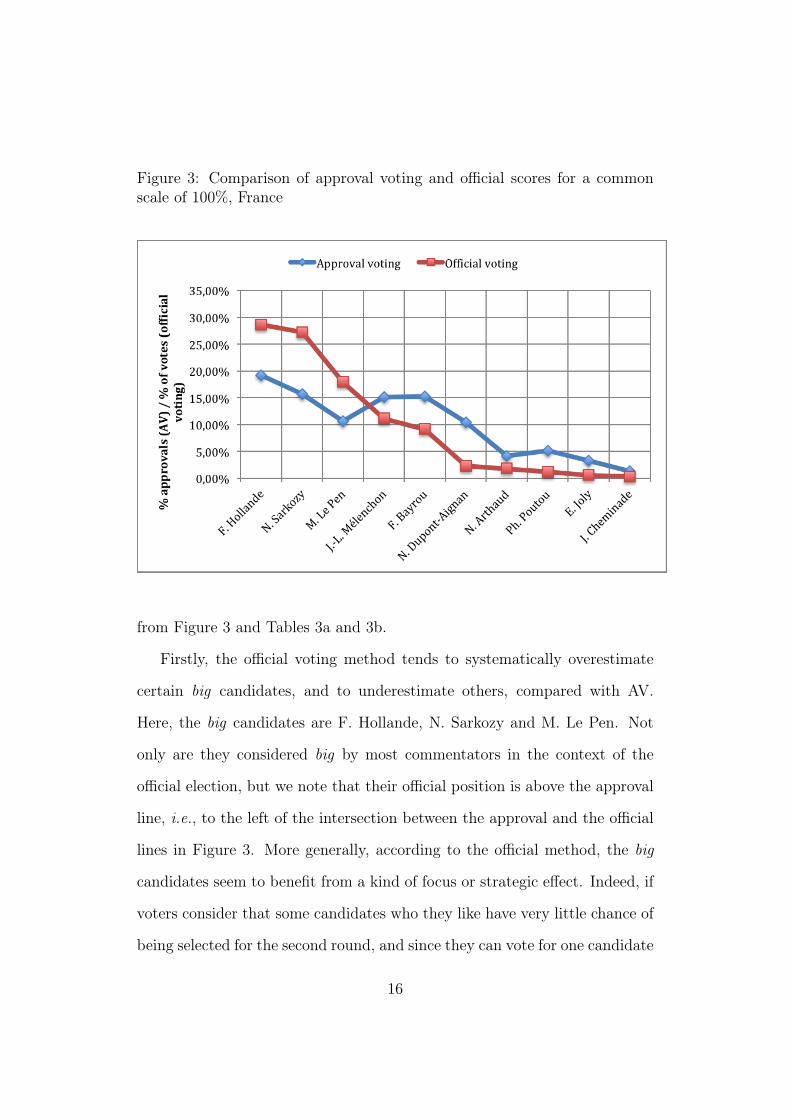
Figure 3: Comparison of approval voting and official scores for a commonscale of 100%, France
from Figure 3 and Tables 3a and 3b.
Firstly, the official voting method tends to systematically overestimate
certain big candidates, and to underestimate others, compared with AV.
Here, the big candidates are F. Hollande, N. Sarkozy and M. Le Pen. Not
only are they considered big by most commentators in the context of the
official election, but we note that their official position is above the approval
line, i.e., to the left of the intersection between the approval and the official
lines in Figure 3. More generally, according to the official method, the big
candidates seem to benefit from a kind of focus or strategic effect. Indeed, if
voters consider that some candidates who they like have very little chance of
being selected for the second round, and since they can vote for one candidate
16
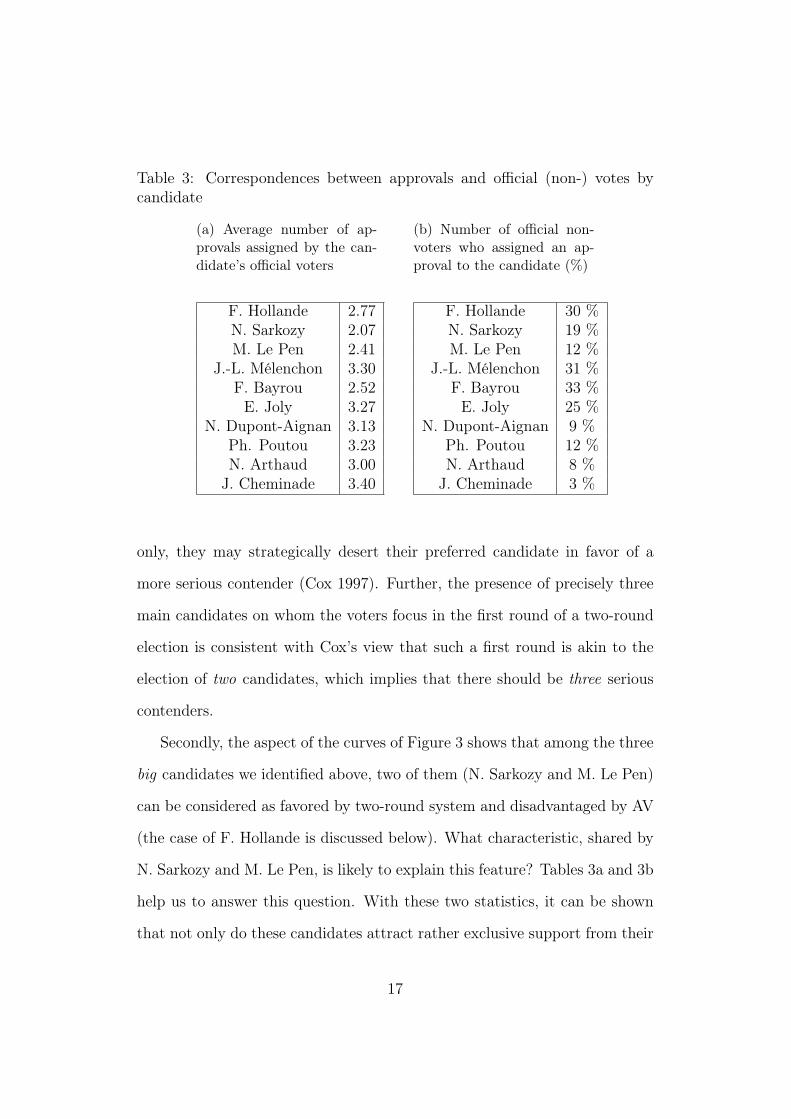
Table 3: Correspondences between approvals and official (non-) votes bycandidate
(a) Average number of ap-provals assigned by the can-didate’s official voters
F. Hollande 2.77N. Sarkozy 2.07M. Le Pen 2.41
J.-L. Mélenchon 3.30F. Bayrou 2.52E. Joly 3.27
N. Dupont-Aignan 3.13Ph. Poutou 3.23N. Arthaud 3.00J. Cheminade 3.40
(b) Number of official non-voters who assigned an ap-proval to the candidate (%)
F. Hollande 30 %N. Sarkozy 19 %M. Le Pen 12 %
J.-L. Mélenchon 31 %F. Bayrou 33 %E. Joly 25 %
N. Dupont-Aignan 9 %Ph. Poutou 12 %N. Arthaud 8 %J. Cheminade 3 %
only, they may strategically desert their preferred candidate in favor of a
more serious contender (Cox 1997). Further, the presence of precisely three
main candidates on whom the voters focus in the first round of a two-round
election is consistent with Cox’s view that such a first round is akin to the
election of two candidates, which implies that there should be three serious
contenders.
Secondly, the aspect of the curves of Figure 3 shows that among the three
big candidates we identified above, two of them (N. Sarkozy and M. Le Pen)
can be considered as favored by two-round system and disadvantaged by AV
(the case of F. Hollande is discussed below). What characteristic, shared by
N. Sarkozy and M. Le Pen, is likely to explain this feature? Tables 3a and 3b
help us to answer this question. With these two statistics, it can be shown
that not only do these candidates attract rather exclusive support from their
17
voter base, but that they also elicit clear rejection by other voters. First,
we see that those who gave their official vote to N. Sarkozy or M. Le Pen
gave few approvals to other candidates. Table 3a reports the lowest averages
of approved candidates among those who voted for N. Sarkozy (2.41) and
M. Le Pen (2.07). This proves that those who support these two candidates
under the official rule stay focused on them even when presented with a
plurinominal rule such as approval voting.
Second, Table 3b shows that voters who did not officially vote for N.
Sarkozy or M. Le Pen almost never gave them an approval. Apart from the
candidates identified as small (that is, N. Dupont-Aignan, Ph. Poutou, N.
Arthaud, J. Cheminade), N. Sarkozy and M. Le Pen obtained the weakest
scores according to this second group of statistics (19% for N. Sarkozy and
12% for M. Le Pen). Since N. Sarkozy and M. Le Pen are (i) supported by
voters who gave very few approvals otherwise, and (ii) almost never supported
by the rest, they can therefore be considered exclusive candidates in the sense
that they arouse positive feelings from a specific segment of the voters, and
are rejected by the rest.
Thirdly, pursuing the line of reasoning in the previous point, the aspect
of the curves in Figure 3 shows that AV tends especially to favor some of the
“secondary” candidates, notably F. Bayrou and J.-L. Mélenchon. With AV,
the scores of these candidates exceed that of M. Le Pen, and almost reach
that of N. Sarkozy. How can we explain the evolution of the importance of
these two candidates relative to the big ones? To address this question, we
refer once again to Tables 3a and 3b. Symmetrical arguments may hold for
F. Bayrou and J.-L. Mélenchon. First, compared with N. Sarkozy and M.
18
Le Pen, F. Bayrou and J.-L. Mélenchon obtained higher average numbers of
approvals from their voters, as shown on Table 3a. This means that their
voters approve of more candidates besides them – i.e. they do not focus
exclusively on them, as N. Sarkozy and M. Le Pen ’s voters do. Second, and
as shown in Table 3b, the most decisive factor as regards F. Bayrou and J.-L.
Mélenchon is that both are often approved of by voters who do not vote for
them officially (33% for F. Bayrou and 31% for J.-L. Mélenchon). Indeed,
in the case of J.-L. Mélenchon, polls revealed that interest in this candidate
extended beyond the realm of the extreme left.
F. Bayrou and J.-L. Mélenchon on the one hand, and N. Sarkozy and M.
Le Pen on the other, manifest diametrically opposed characteristics, since
F. Bayrou and J.-L. Mélenchon are (i) supported by voters who gave many
approvals otherwise, and (ii) often supported by the rest. F. Bayrou and
J.-L. Mélechon can thus be seen as inclusive candidates, in the sense that
they seem to be appreciated by a large set of voters who nevertheless do not
show exclusive attachment to their candidacy. Note that E. Joly’s candidacy
is of the same kind.
In brief, beside the usual distinction between the “big” candidates and
the others, we have introduced two new notions to qualify types of candi-
dates: exclusivity and inclusivity. An exclusive candidate is one who induces
strong views, whether positive or negative, and whose support comes from
one specific part of a fragmented society. An inclusive candidate is a uni-
fying candidate, viewed positively by a large proportion of the voters, but
whose support is not necessarily strong enough for them to receive an official
vote. This does not mean that an inclusive candidate gathers support from
19
all segments of the society, but rather that he or she is able to obtain some
support from the electorates of different candidates.
Our conjecture is that, at first sight, inclusive candidates seem to be fa-
vored by the alternative rules, while exclusive candidates seem to be favored
by the two-round system. But although this conjecture seems to be confirmed
by the AV data as set out above, it cannot yet be considered a definitive con-
clusion. It first needs to be tested against all the other candidates, including
the small ones, as well as with the winner of the official vote, F. Hollande.
Note in particular that its application to the latter case is not straightfor-
ward. Although F. Hollande is obviously a “big” candidate, as are N. Sarkozy
and M. Le Pen, it would be hard to claim that he is as disadvantaged by AV
as they are, since he wins under both rules. Besides, according to Figure 1
it seems that he could be considered an inclusive candidate since he gains
in the move from the official vote to AV; and even though the gap in scores
is less significant than those of E. Joly, J.-L. Mélenchon or F. Bayrou, it is
much higher than those of N. Sarkozy and M. Le Pen. Further, according to
Table 3a, the average number of approvals given by his voters is 2.77, a little
more than F. Bayrou’s 2.52, while according to 3b, 30% of voters who did
not vote for him nevertheless gave him an approval: after J.-L. Mélenchon
and F. Bayrou, this is the third highest percentage among the ten candidates
and the most important feature of an inclusive candidate. We thus need to
check whether our provisional conclusion applies for the case of F. Hollande
as well as for all other candidates. In doing this, we will have the opportunity
to refine the notions of exclusive and inclusive candidates, as well as to look
more closely at the relative importance of the different scales of evaluative
20
voting. This task is undertaken in the following subsection.
Comparing the grade profiles of candidates
We now focus on the frequencies of use of the different grades in the
three rating scales of evaluative voting that were offered to the voters; we
refer to these frequencies as the “grade profiles” of candidates. To make the
comparison easier, the 21 grades of EV(0,...,20) have been divided into three
intervals: from 0 to 6 for the lower grades – to be compared with the lower
bound of EV(0,1,2) and EV(-1,0,1) –, from 7 to 13 – for the middle grades
– , and from 14 to 20 – for the higher grades.6
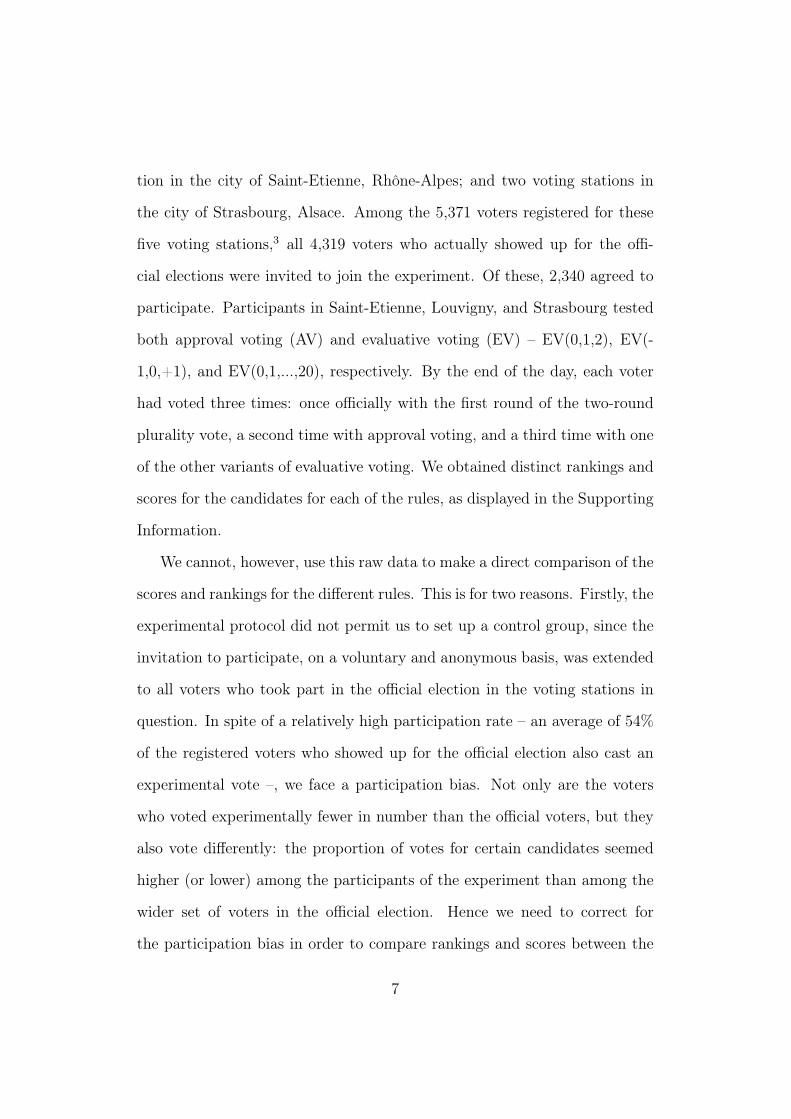
Let us firstly consider all those candidates who have not yet been identi-
fied as big, or as either exclusive or inclusive. We refer to these as the small
candidates: N. Arthaud, J. Cheminade, N. Dupont-Aignan, Ph. Poutou,
and, though to a lesser extent, E. Joly. Figures 4b and 4c confirm their
status. Their grade profile is clearly decreasing: we see very high frequen-
cies of lower grades (around 60% to 80%), low frequencies of middle grades
(around 20%), and almost no high grades: even those voters who approved
small candidates often prefer to give them the middle grade rather than the
higher. Figures 4b and 4c also show that the extension of the grading scale
from {0, 1, 2} to {0, ..., 20} does not substantially change the distribution of
the grades given by voters for the small candidates.
However, the shape of the grade profiles for the small candidates is rather
different for EV(-1,0,1), as represented in Figure 4a: here it is increasing until
the average grade, then decreasing. The neutral or indifferent grade is 0 for
21
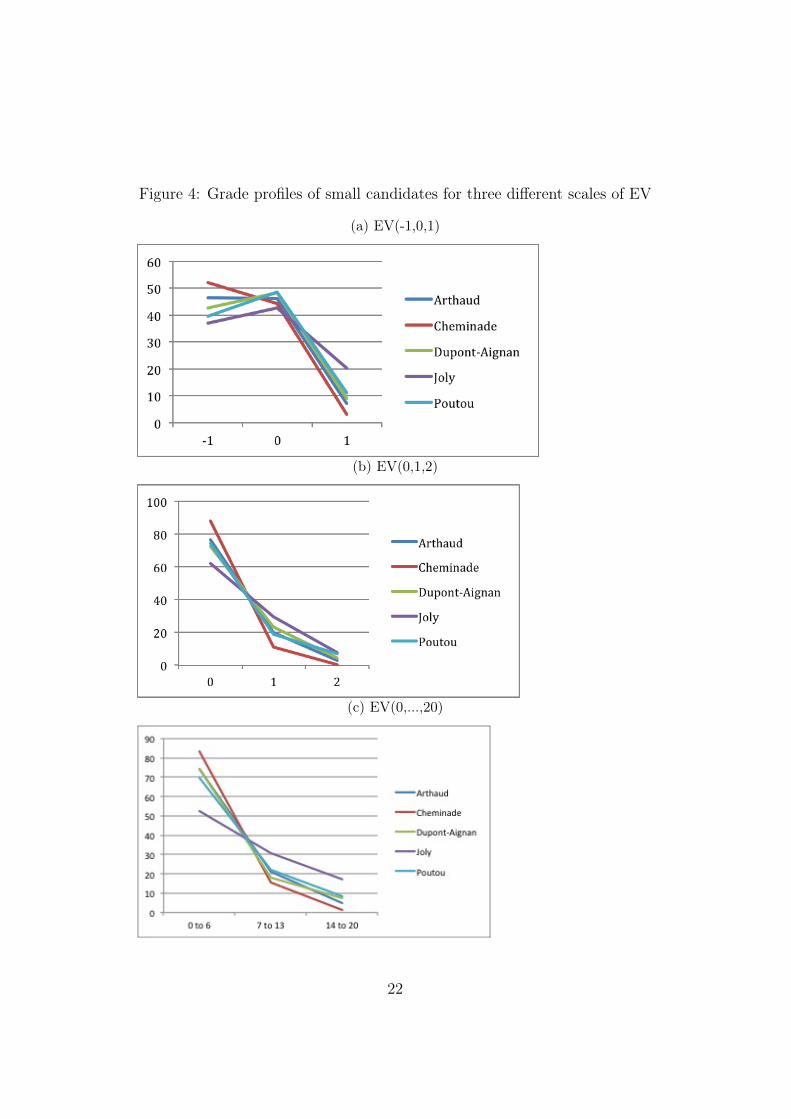
Figure 4: Grade profiles of small candidates for three different scales of EV
(a) EV(-1,0,1)
(b) EV(0,1,2)
(c) EV(0,...,20)
22
the three modalities of EV. Yet, for EV(-1,0,1), and unlike EV(0,1,2) and
EV(0,...,20), it does not correspond to the lower grade. Therefore it seems
natural to suppose that small candidates, who may be generally unknown
to voters, would receive more 0s, whereas well-known candidates may risk
being judged negatively on average. This leaves open the possibility that a
system with negative grades could elect a largely unknown candidate.7 In
view of our results, however, it seems clear that this situation was not likely
to have come about in 2012. Indeed, a striking feature of Figure ?? is that
the middle grade, which is 0 with EV(-1,0,1) and is positive with the other
scales, attracts more voters under EV (-1,0,1) than with the other scales.
But this phenomenon is not sufficient to significantly raise the final scores of
the small candidates because these candidates also receive a large number of
the negative grade under EV(-1,0,1), sufficient to counterbalance their better
performance in the mid-range. One might well imagine that participants in
the 2012 experiment took into account the risk of contributing to the election
of one of these candidates by a kind of abstention, and we cannot definitively
reject the possibility that such a result could arise in other circumstances.
Figures 4a, 4b and 4c thus require us to reject the principle that a change
in the rating scale does not affect voters’ behavior. Obviously, these three
scales were not perceived as equivalent by participants.
Let us now examine the grade profiles of the candidates we previously
called exclusive: N. Sarkozy and M. Le Pen.
One observes from Figures 5a to 5c that the grade profiles for both can-
didates are broadly the same: the lines of the grades profiles are decreasing
then increasing. This corresponds to a rather high frequency of lower grades
23
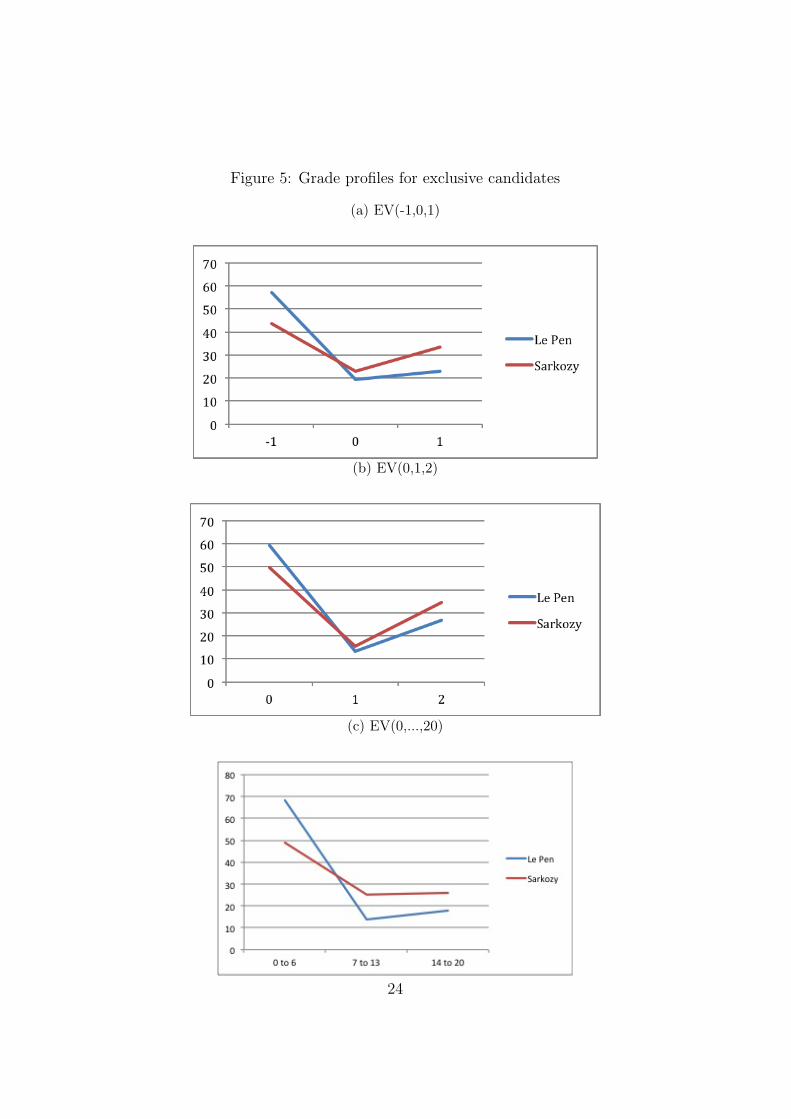
Figure 5: Grade profiles for exclusive candidates
(a) EV(-1,0,1)
(b) EV(0,1,2)
(c) EV(0,...,20)
24
(around 50%), a low frequency of middle grades (around 15% to 20%), while
higher grades are more frequent than the middle ones. Contrary to the small
candidates, the shapes of the grade profiles of these exclusive (and big) candi-
dates are preserved whatever the scales of grades. It should be stressed that
these grade profiles match in every respect the definition we proposed for
exclusive candidates, namely candidates who induce strong views, whether
positive or negative. Their high frequency of lower grades – and thus of re-
jection – explains why these two candidates, 2nd and 3rd in the official vote,
fall so many ranks with evaluative voting.
Hence we have confirmed that AV and all the other variants of EV tend
to be unfavorable to exclusive candidates, unlike the two-round system.
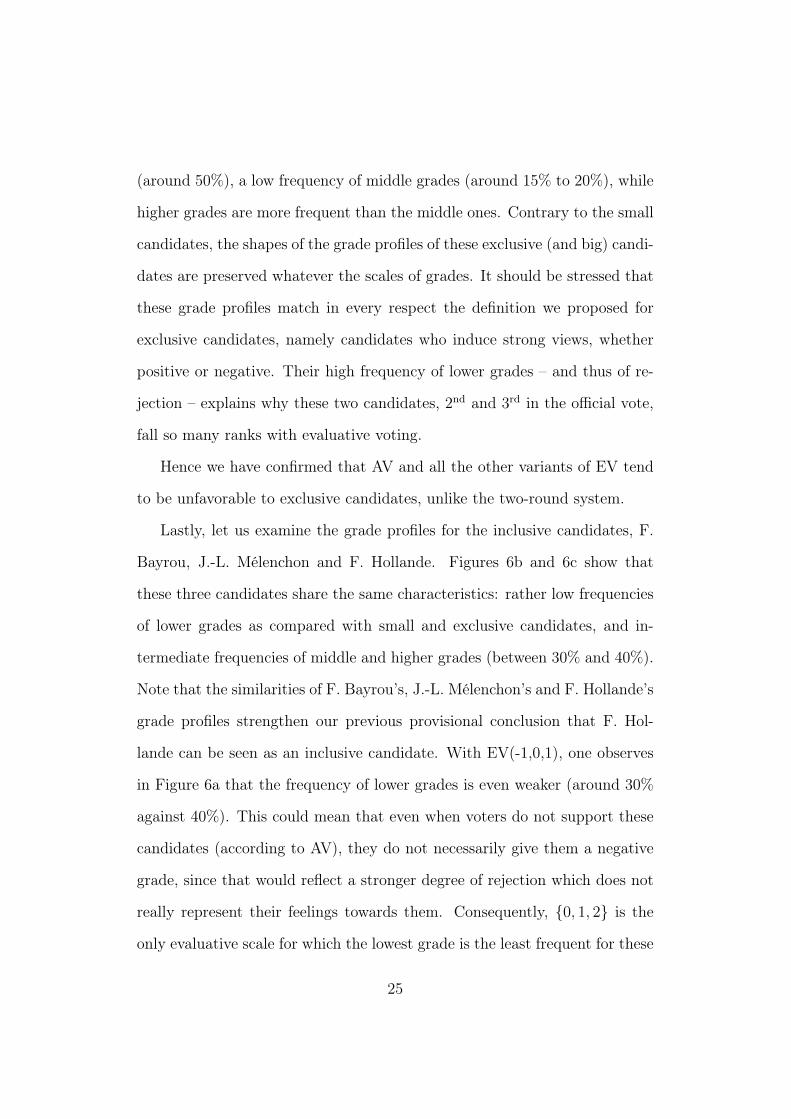
Lastly, let us examine the grade profiles for the inclusive candidates, F.
Bayrou, J.-L. Mélenchon and F. Hollande. Figures 6b and 6c show that
these three candidates share the same characteristics: rather low frequencies
of lower grades as compared with small and exclusive candidates, and in-
termediate frequencies of middle and higher grades (between 30% and 40%).
Note that the similarities of F. Bayrou’s, J.-L. Mélenchon’s and F. Hollande’s
grade profiles strengthen our previous provisional conclusion that F. Hol-
lande can be seen as an inclusive candidate. With EV(-1,0,1), one observes
in Figure 6a that the frequency of lower grades is even weaker (around 30%
against 40%). This could mean that even when voters do not support these
candidates (according to AV), they do not necessarily give them a negative
grade, since that would reflect a stronger degree of rejection which does not
really represent their feelings towards them. Consequently, {0, 1, 2} is the
only evaluative scale for which the lowest grade is the least frequent for these
25
Figure 6: Grades profiles for inclusive candidates
(a) EV(-1,0,1)
(b) EV(0,1,2)
(c) EV(0,...,20)
26
three candidates. Whatever the scale is, EV then improves the rank of these
inclusive candidates with respect to AV (except of course F. Hollande who
remains the winner in every case). All these observations corroborate our
definition of inclusive candidates. Hence we have confirmed that AV and all
the other variants of EV tend to favor inclusive candidates.
We may thus draw the interim conclusion that AV and all the other
variants of EV tend to favor inclusive candidates and are unfavorable to
exclusive candidates. If we want to complete the proof of our conjecture, we
need to identify the mechanisms that are at work here. It is to this that we
now turn.
Why do different rules induce different results?
We have shown that approval voting and evaluative voting favor inclusive
candidates and disfavor exclusive ones, contrary to the two-round system. A
new question therefore arises: Why do different voting rules induce these
different kinds of results? We have already made the preliminary proposal
that the differences may be explained by two mechanisms. On the one hand,
there is a mechanical effect due to the plurinominal nature of approval voting
and evaluative voting as compared to a uninominal rule such as the first
round of the two-round system. On the other hand, there is a behavioral
effect, since different rules induce different patterns of strategic and expressive
voting (Baujard and Igersheim, 2011b). This section aims at confirming and
making more precise these assertions in the specific case of this experiment.
This further scrutiny will permits us to confirm our conjecture.
27
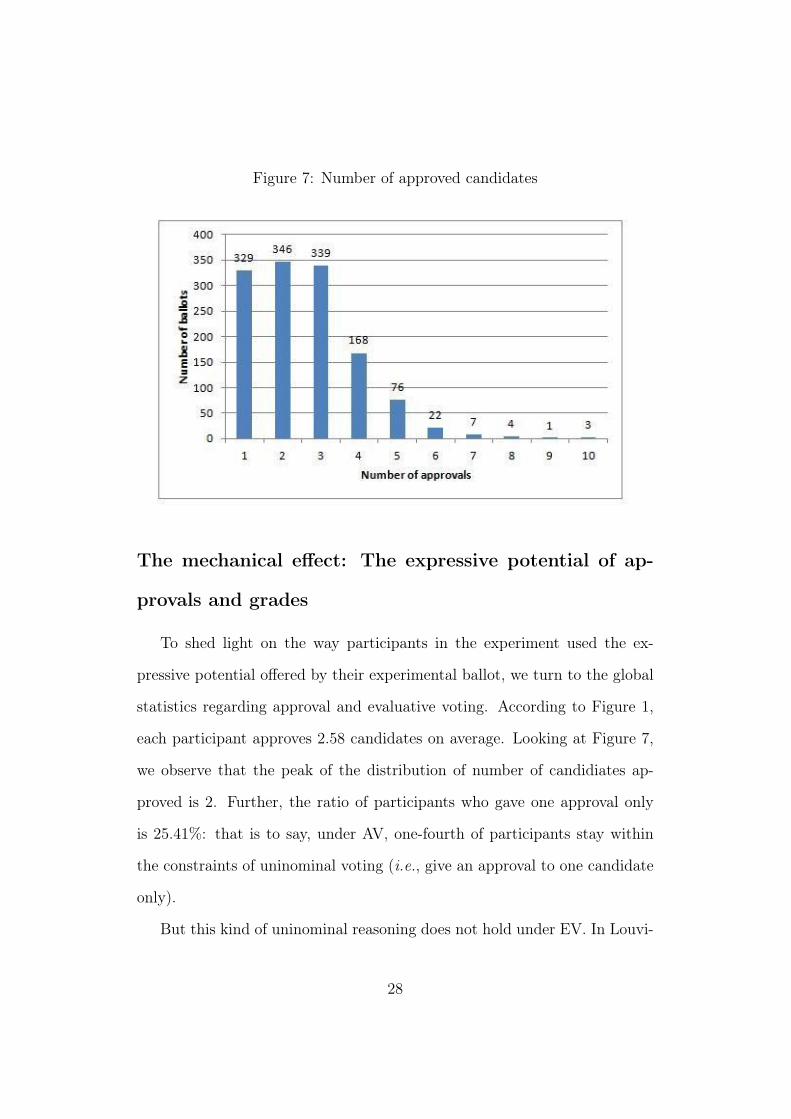
Figure 7: Number of approved candidates
The mechanical effect: The expressive potential of ap-
provals and grades
To shed light on the way participants in the experiment used the ex-
pressive potential offered by their experimental ballot, we turn to the global
statistics regarding approval and evaluative voting. According to Figure 1,
each participant approves 2.58 candidates on average. Looking at Figure 7,
we observe that the peak of the distribution of number of candidiates ap-
proved is 2. Further, the ratio of participants who gave one approval only
is 25.41%: that is to say, under AV, one-fourth of participants stay within
the constraints of uninominal voting (i.e., give an approval to one candidate
only).
But this kind of uninominal reasoning does not hold under EV. In Louvi-
28
gny, 2.19% of voters gave the grade +1 to one candidate only and -1 to all the
others; in Saint-Etienne, 6.46% of voters gave the grade 2 to one candidate
only and 0 to all the others; and in Strasbourg, 3.93% gave a grade 20 to
one candidate and 0 for all the others. All these elements clearly show that
even though some voters continue to reason in a uninominal fashion under
AV, they make a definite break with it under EV, and thus seem to be more
willing to change the mode of expression of their political preferences.
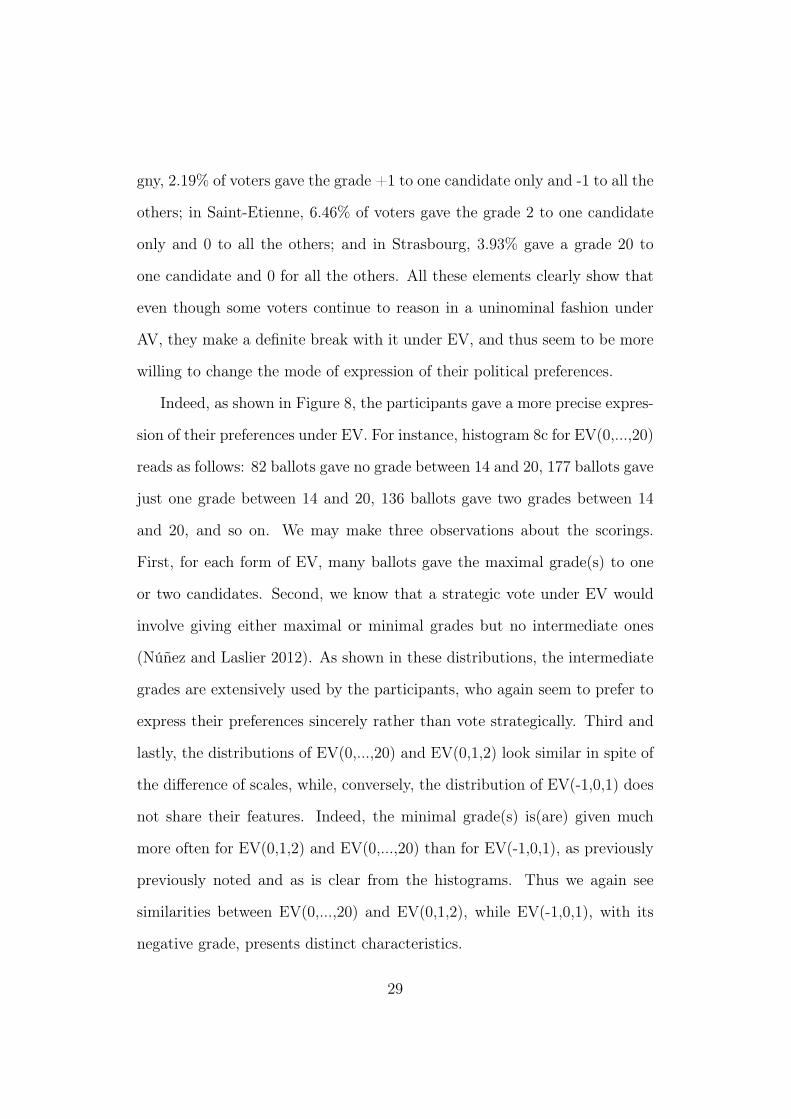
Indeed, as shown in Figure 8, the participants gave a more precise expres-
sion of their preferences under EV. For instance, histogram 8c for EV(0,...,20)
reads as follows: 82 ballots gave no grade between 14 and 20, 177 ballots gave
just one grade between 14 and 20, 136 ballots gave two grades between 14
and 20, and so on. We may make three observations about the scorings.
First, for each form of EV, many ballots gave the maximal grade(s) to one
or two candidates. Second, we know that a strategic vote under EV would
involve giving either maximal or minimal grades but no intermediate ones
(Núñez and Laslier 2012). As shown in these distributions, the intermediate
grades are extensively used by the participants, who again seem to prefer to
express their preferences sincerely rather than vote strategically. Third and
lastly, the distributions of EV(0,...,20) and EV(0,1,2) look similar in spite of
the difference of scales, while, conversely, the distribution of EV(-1,0,1) does
not share their features. Indeed, the minimal grade(s) is(are) given much
more often for EV(0,1,2) and EV(0,...,20) than for EV(-1,0,1), as previously
previously noted and as is clear from the histograms. Thus we again see
similarities between EV(0,...,20) and EV(0,1,2), while EV(-1,0,1), with its
negative grade, presents distinct characteristics.
29
Figure 8: Distribution of grades, for EV
(a) EV(-1,0,1)
(b) EV(0,1,2)
(c) EV(0,...,20)
30
In this sub-section we have stressed that voters do use the alternative
voting rules to express their electoral preferences in a more extensive fashion,
and particularly under EV. Under the rules we have considered, where grades
are simply summed to find the winner, this extra potential for expression
obviously plays in favor of the inclusive candidates.
The behavioral effect: Strategic voting under the two-
round system
According to the questionnaire attached to the experimental ballots, the
majority of voters took account of various strategic considerations in deciding
who to vote for in the official election. This high figure should not come as
a surprise, since the French two-round system and the number of candidates
in the first round of the presidential election (10 in 2012) mean that issues
concerned with strategic and sincere voting have a high public profile (in
French, strategic voting is often referred to as ‘vote utile’, meaning ‘useful
vote’). Blais (2003) and Van der Straeten, Laslier and Blais (2012) report
similar findings.
In what follows we provide an assessment of the effects of strategic voting
under the two-round system.8 As already mentioned, our study is based on
ballots for which participants have declared their official vote. By comparison
of their official vote with the preferences expressed through their experimental
vote – and more specifically with their evaluative vote –, we are able to guage
the impact of strategic voting on the results of the official vote. To do this,
we compared the chosen candidate under the official vote with the grades
31
assigned to the ten candidates.
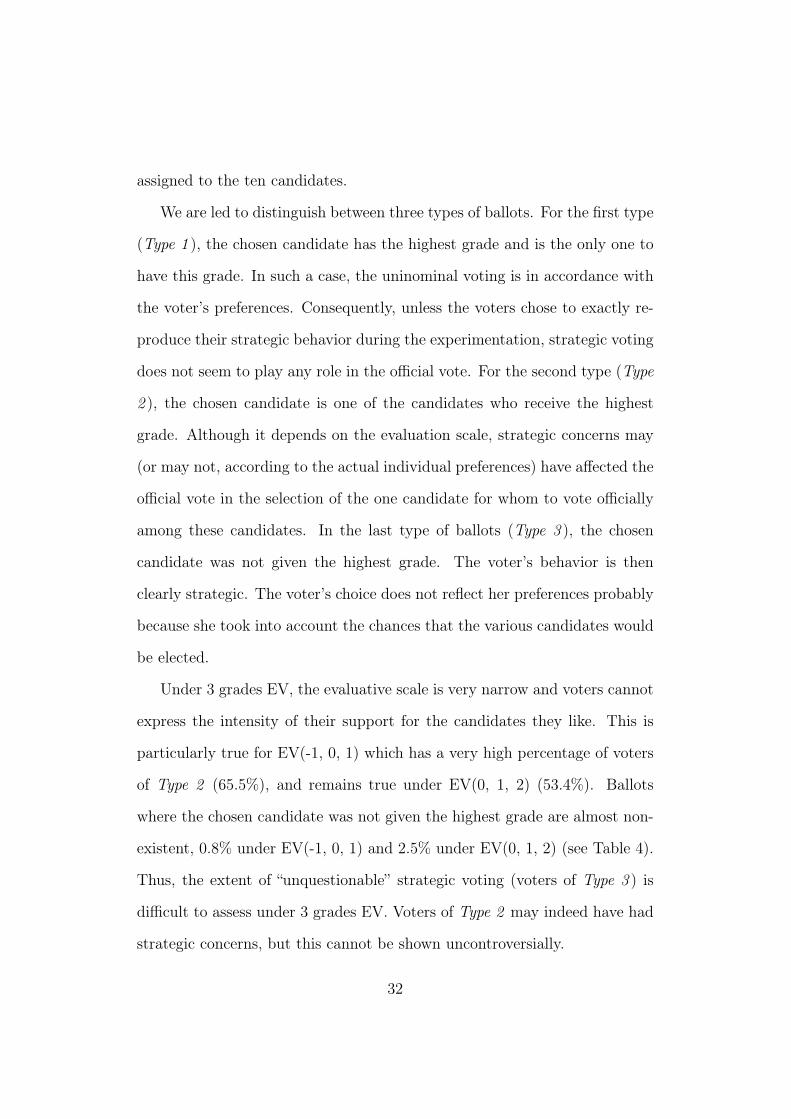
We are led to distinguish between three types of ballots. For the first type
(Type 1 ), the chosen candidate has the highest grade and is the only one to
have this grade. In such a case, the uninominal voting is in accordance with
the voter’s preferences. Consequently, unless the voters chose to exactly re-
produce their strategic behavior during the experimentation, strategic voting
does not seem to play any role in the official vote. For the second type (Type
2 ), the chosen candidate is one of the candidates who receive the highest
grade. Although it depends on the evaluation scale, strategic concerns may
(or may not, according to the actual individual preferences) have affected the
official vote in the selection of the one candidate for whom to vote officially
among these candidates. In the last type of ballots (Type 3 ), the chosen
candidate was not given the highest grade. The voter’s behavior is then
clearly strategic. The voter’s choice does not reflect her preferences probably
because she took into account the chances that the various candidates would
be elected.
Under 3 grades EV, the evaluative scale is very narrow and voters cannot
express the intensity of their support for the candidates they like. This is
particularly true for EV(-1, 0, 1) which has a very high percentage of voters
of Type 2 (65.5%), and remains true under EV(0, 1, 2) (53.4%). Ballots
where the chosen candidate was not given the highest grade are almost non-
existent, 0.8% under EV(-1, 0, 1) and 2.5% under EV(0, 1, 2) (see Table 4).
Thus, the extent of “unquestionable” strategic voting (voters of Type 3 ) is
difficult to assess under 3 grades EV. Voters of Type 2 may indeed have had
strategic concerns, but this cannot be shown uncontroversially.
32
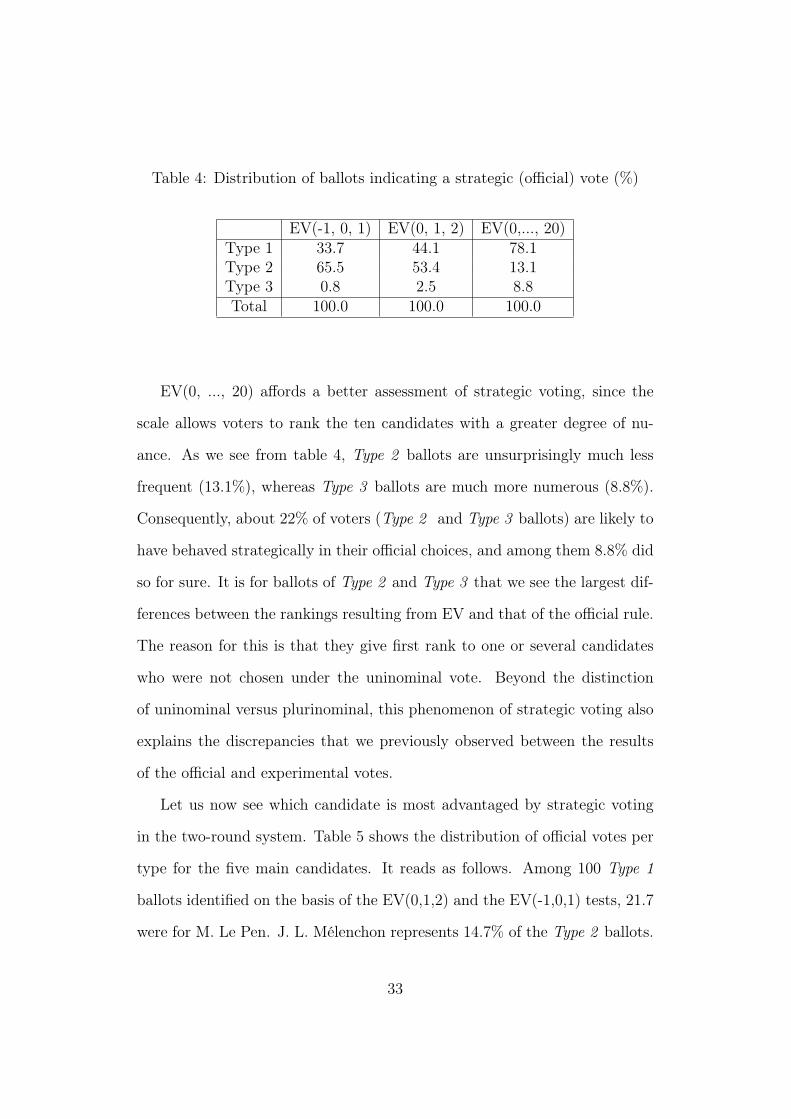
Table 4: Distribution of ballots indicating a strategic (official) vote (%)
EV(-1, 0, 1) EV(0, 1, 2) EV(0,..., 20)Type 1 33.7 44.1 78.1Type 2 65.5 53.4 13.1Type 3 0.8 2.5 8.8Total 100.0 100.0 100.0
EV(0, ..., 20) affords a better assessment of strategic voting, since the
scale allows voters to rank the ten candidates with a greater degree of nu-
ance. As we see from table 4, Type 2 ballots are unsurprisingly much less
frequent (13.1%), whereas Type 3 ballots are much more numerous (8.8%).
Consequently, about 22% of voters (Type 2 and Type 3 ballots) are likely to
have behaved strategically in their official choices, and among them 8.8% did
so for sure. It is for ballots of Type 2 and Type 3 that we see the largest dif-
ferences between the rankings resulting from EV and that of the official rule.
The reason for this is that they give first rank to one or several candidates
who were not chosen under the uninominal vote. Beyond the distinction
of uninominal versus plurinominal, this phenomenon of strategic voting also
explains the discrepancies that we previously observed between the results
of the official and experimental votes.
Let us now see which candidate is most advantaged by strategic voting
in the two-round system. Table 5 shows the distribution of official votes per
type for the five main candidates. It reads as follows. Among 100 Type 1
ballots identified on the basis of the EV(0,1,2) and the EV(-1,0,1) tests, 21.7
were for M. Le Pen. J. L. Mélenchon represents 14.7% of the Type 2 ballots.
33
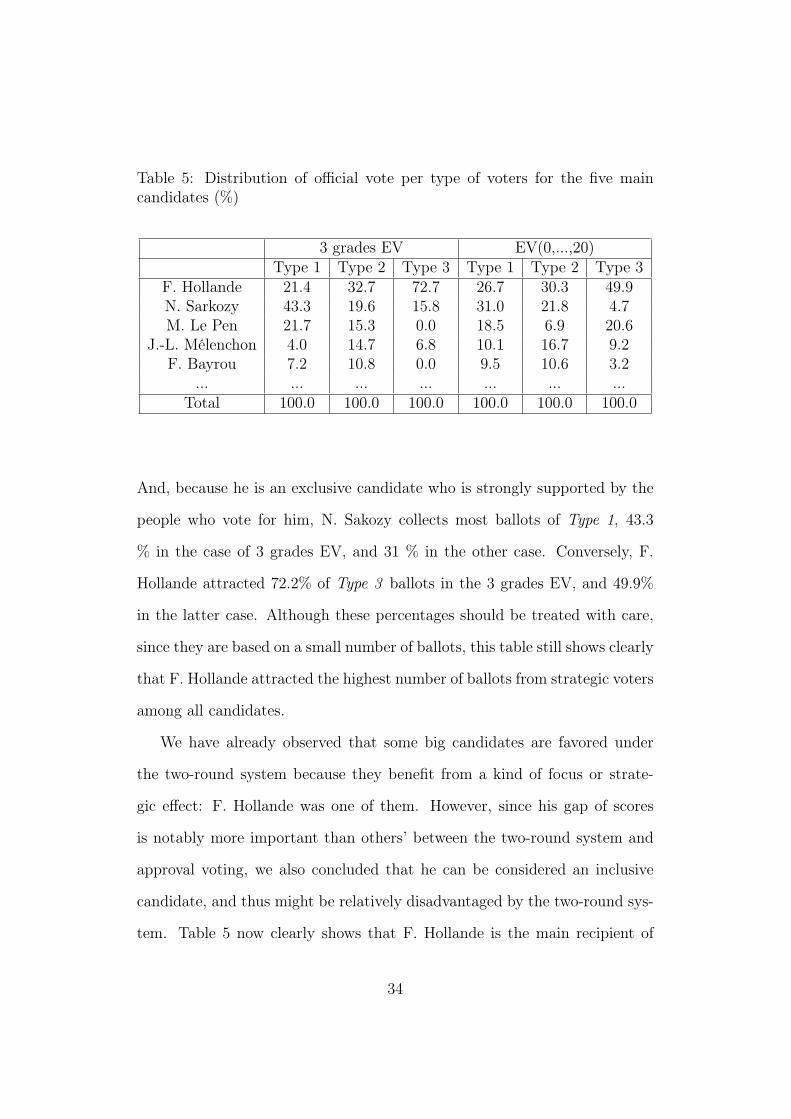
Table 5: Distribution of official vote per type of voters for the five maincandidates (%)
3 grades EV EV(0,...,20)Type 1 Type 2 Type 3 Type 1 Type 2 Type 3
F. Hollande 21.4 32.7 72.7 26.7 30.3 49.9N. Sarkozy 43.3 19.6 15.8 31.0 21.8 4.7M. Le Pen 21.7 15.3 0.0 18.5 6.9 20.6
J.-L. Mélenchon 4.0 14.7 6.8 10.1 16.7 9.2F. Bayrou 7.2 10.8 0.0 9.5 10.6 3.2
... ... ... ... ... ... ...Total 100.0 100.0 100.0 100.0 100.0 100.0
And, because he is an exclusive candidate who is strongly supported by the
people who vote for him, N. Sakozy collects most ballots of Type 1, 43.3
% in the case of 3 grades EV, and 31 % in the other case. Conversely, F.
Hollande attracted 72.2% of Type 3 ballots in the 3 grades EV, and 49.9%
in the latter case. Although these percentages should be treated with care,
since they are based on a small number of ballots, this table still shows clearly
that F. Hollande attracted the highest number of ballots from strategic voters
among all candidates.
We have already observed that some big candidates are favored under
the two-round system because they benefit from a kind of focus or strate-
gic effect: F. Hollande was one of them. However, since his gap of scores
is notably more important than others’ between the two-round system and
approval voting, we also concluded that he can be considered an inclusive
candidate, and thus might be relatively disadvantaged by the two-round sys-
tem. Table 5 now clearly shows that F. Hollande is the main recipient of
34
strategic voting. Indeed, he benefited from the clear majority of Type 3
ballots which unambiguously reflect strategic behavior.
Consequently, it is not surprising that F. Hollande was both the winner
of the first round of the two-round system, and the winner of the alternative
plurinominal rules we tested: he drew benefit from both of the factors we
have cited, the mechanical and the behavioral. As an inclusive candidate, he
is favored by the plurinominality of approval voting and evaluative voting.
As a big candidate, he is favored by strategic voting under the two-round
system.
Concluding remarks
An intrinsic limitation of the kind of experiment proposed here is that it
takes as given the political supply. The number of parties, and the platforms
they adopt, might indeed be different under a different voting method; and
thus not only the voters but also the candidates would make different choices,
and the whole political landscape would be changed (Dellis 2009, Laslier and
Maniquet 2010, Baujard, Igersheim, and Senné 2011). This study thus does
not attempt to “predict" what would have happened in France in 2012 if
the rule had been different. It compares, for given electoral preferences, how
differences in results and rankings are induced by the rules. This should be
considered as only one brick in the analysis of voting rules.
With this proviso, the material exposed in this paper clearly points in one
direction. Evaluative voting rules, including the particular case of approval
voting, favor inclusive candidates who are able to gather numerous approvals,
35
or relatively good grades from large segments of the electorate. At the same
time, these rules disadvantage exclusive candidates who receive almost no
support or high grades from outside their electorate. The reason for both
phenomena lies in two factors. First, a mechanical factor, which concerns the
extended potential of expression given by evaluative voting rules and the fact
that the grades obtained by a candidate are aggregated by simple sum. This
factor means that inclusive candidates are more favored under evaluative
voting rules than under the two-round system. Second, a behavioral factor
which concerns strategic thinking under the two-round system. This second
factor favors the exclusive candidates under the two-round system.
We have observed that, just like in real elections, voters in these experi-
ments seem to be motivated both by a desire for personal expression and by
considerations pertaining to collective choice. Indeed, both the mechanical
and the strategic effects of uninominal voting rules create a gap between the
individual electoral preference and the way people are induced to express it
in the collective context of an election. They may have a desire to express
themselves plainly and honestly, but they are aware that the rule encourages
them to take into account how the mechanism of collective choice works in
practice. This double intention means that the results of evaluative voting
elections reflect two distinct yet relevant types of information: what the vot-
ers think of the candidates, and which candidate they wish to see elected.
The use of evaluative voting ballots instead of single-name ones does not
dissipate the fundamental double nature of democratic elections, but it may
nevertheless facilitate the resolution of the voting question at the individual
level since it enables the voters to disentangle these issues.
36
Notes
1 Approval Voting was tested in France in 2002 (Balinski, Laslier and Van der Straeten
2002; Balinski, Laraki, Laslier and Van der Straeten 2003; Laslier and Van der Straeten
2004, 2008). In 2007, other rules were also tested: EV with grades {0, 1, 2} (Baujard and
Igersheim 2007, 2010; Baujard, Igersheim and Senné 2011), majority judgment (Balinski
and Laraki 2011), and single transferable vote (Farvaque, Jayet and Ragot 2011). Similar
experiments on AV have taken place in Germany (Alós-Ferrer and Granić 2010) and in
Benin (Kabre, Laslier and Van der Straeten 2012).
2 As well as these, two voting experiments were conducted via the Internet during
the 2012 French presidential elections. The site Voteaupluriel.org was set up under
the supervision of Blais, Laslier, and Van der Straeten, following a similar experiment
conducted alongside the Canadian elections in 2011 (threeontariovotes.org). The site
Votedevaleur.org was managed by a French association for the promotion of evaluative
voting. These Internet events were independent, but partly coordinated with the exper-
iments on which we report in the present paper. Their results are complementary (see Van
der Straeten, Laslier and Blais, 2013 and http://doc.votedevaleur.org/exp2012/compteRenduPreliminaire/web/co/synthese.html)
and we shall occasionally refer to them in this paper.
3About 85% of the French population over 18 is registered (Rieg 2011).
4On this issue, see Baujard and Igersheim 2007, and Van der Straeten, Laslier and
Blais 2012.
5The number of voters who declared an official vote in favor of a candidate but who
did not give him/her an approval is close to zero.
6It should be stressed that other intervals have been tested as well, but that they all
led to the same kind of conclusions. We therefore chose to use the most balanced ones,
i.e., with an equal number of grades in each category.
7 Here we may add an important point: the participants in our experiment were clearly
informed that a blank line for a candidate would correspond to the grade 0. This informa-
tion was all the more significant in the polling stations of Louvigny, where EV(-1,0,1) was
tested. We can verify that this rule was understood by the participants since for almost
37
all experimental ballots, whatever the EV-scale, the boxes which correspond to grade 0
are almost never crossed.
8We fully acknowledge that approval voting and evaluative voting can lead to other
patterns of strategic voting; but for the purposes of this section we will refer to the EV
ballots as the main indicator of voters’ true electoral preferences. As we have observed
above, the fact that there was extensive use of intermediate grades indicates that full
strategic voting was not at all common in the case of EV(0,...,20) or the other scales. As
well as this, larger (more finely gradated) ratings scales allow for more reliable comparisons
for the purpose of the study of strategic voting under the two-round system. Since the
scale of AV (two grades) is narrower than EV(0,1,2) and EV(-1,0,1) (three grades), it is
a more delicate matter to assess strategic voting under the two round-system using AV
data than that of EV: according to the typology developed above, the total percentage of
voters of Type 3 is almost non-existent, while the total percentage of voters of Type 2 is
higher than 70% (we develop the definitions of Types 1, 2 and 3 in the rest of the section).
38
References
Alós-Ferrer, Carlos, and Ðura Georg Granic. 2010. “Approval voting in
Germany: description of a field experiment.” In Handbook on Approval Vot-
ing, eds. Jean-François Laslier, and Remzi Sanver. Heidelberg: Springer-
Verlag, Chapter 16: 397–411.
Arrow, Kenneth. 1951, 2nd ed., 1963. Social Choice and Individual Val-
ues, Yale University Press.
Balinski, Michel, and Rida Laraki. 2011. “Election by majority judgement:
Experimental evidence.” In In situ and Laboratory Experiments on Electoral
Law Reform: French Presidential Elections, eds. Bernard Grofman, Bernard
Dolez, and Annie Laurent. Heidelberg: Springer, Chapter 2: 13–54.
Balinski, Michel, Rida Laraki, Jean-François Laslier, and Karine Van
der Straeten. 2003. “Le vote par assentiment: une expérience.” Cahiers du
Laboratoire d’Econométrie de l’Ecole Polytechnique, n°2003-13.
Balinski, Michel, Jean-François Laslier, and Karine van der Straeten.
2002. “Compte-rendu de l’expérience de vote du 23 janvier 2002 à l’IEP.”
Working Paper, March.
Baujard, Antoinette, and Herrade Igersheim. 2007. Expérimentation du
vote par note et du vote par approbation lors des élections présidentielles
françaises du 22 avril 2007. Rapport au Centre d’Analyse Stratégique. Paris.
Baujard, Antoinette, and Herrade Igersheim. 2010. “Framed-field experi-
ments on approval voting. Lessons from the 2002 and 2007 French Presiden-
39
tial elections.” In Handbook of Approval Voting, eds. Jean-François Laslier
and Remzi Sanver. Heidelberg: Springer, Chapter 15: 357–395.
Baujard, Antoinette, and Herrade Igersheim. 2011a. “A Framed-field ex-
periment on Approval voting and Evaluation voting.” In In situ and Lab-
oratory Experiments on Electoral Law Reform: French Presidential Elec-
tions, eds. Bernard Grofman, Bernard Dolez, and Annie Laurent. Heidel-
berg: Springer, Chapter 4: 69–89.
Baujard, Antoinette, and Herrade Igersheim. 2011b. “Reconstructing pref-
erences in a voting context. Some clues from experimental data on approval
and evaluation voting.” In Freedom and Happiness in Economic Thought
and Philosophy : From Clash to Reconciliation, eds. Ragip Ege and Her-
rade Igersheim. London: Routledge, Chapter 17: 273–291.
Baujard, Antoinette, Herrade Igersheim, and Thomas Senné. 2011. “An
analysis of the political supply in the 2007 French Presidential election based
on framed-field experimental data.” Les Annales d’Economie et Statistiques
(101-102): 149–186.
Bentham, Jeremy 1822. First Principles Preparatory to the Constitutional
Code. Reprinted in: The Work of Jeremy Bentham, Volume IX. Elibron
Classics, Adamant Media Corporation (2005).
Blais, André. 2003. “Strategic Voting in the 2002 French Presidential Elec-
tion.” In: The French Voter: Before and After the 2002 Elections, Michael
Lewis-Beck (ed.). Hampshire: Palgrave.
40
Blais, André, Louis Massicotte, and Agnieszka Dobrzynska. 1997. “Direct
Presidential Elections: A World Summary.” Electoral Studies 16: 441–455.
Brams, Steven J., and Peter C. Fishburn. 1978. “Approval voting.” Amer-
ican Political Science Review 72: 831–847.
Brams, Steven J., and Peter C. Fishburn. 2005. “Going from theory to
practice: The mixed success of approval voting.” Social Choice and Welfare
25 (2-3): 457–474.
Cox, G. 1997. Making Votes Count: Strategic coordination in the world’s
electoral system. Cambridge: Cambridge University Press.
Dellis, Arnaud. 2009. “Would letting people vote for multiple candidates
yield policy moderation? Journal of Economic Theory 144: 722–801.
Dhillon, Amrita, and Jean-François Mertens. 1997. “Relative utilitarian-
ism.” Econometrica 67 (3): 471–498.
Farvaque, Etienne, Hubert Jayet, and Lionel Ragot. 2011. “French presi-
dential elections: A field experiment on the single transferable vote.” In In
Situ and Laboratory Experiments on Electoral Law Reform: French Presi-
dential Elections, eds. Bernard Grofman, Bernard Dolez, and Annie Lau-
rent. Heidelberg: Springer, Chapter 3: 55–68.
Forstythe RT, Rietz A, Myerson RB and Weber RJ (1996) “An Experi-
mental Study of Voting Rules and Polls in Three-Way Elections” Interna-
tional Journal of Game Theory, 25: 355–383.
41
Gaertner, Wulf, and Yongsheng Xu. 2012. “A general scoring rule.” Math-
ematical Social Sciences 63 (3): 193–196.
Grofman, Bernard, Bernard Dolez, and Annie Laurent. 2011. In Situ and
Laboratory Experiments on Electoral Law Reform: French Presidential Elec-
tions. Heidelberg: Springer.
Hillinger, Claude. 2004a. “On the possibility of democracy and rational
collective choice.” Discussion Paper, n° 2004-21, University of Munich.
Hillinger, Claude. 2004b. “Voting and the cardinal aggregation of judg-
ments.” Discussion Paper, n° 2004-09, University of Munich.
Hillinger, Claude. 2005. “The case for utilitarian voting.” Homo Oeco-
nomicus 23, 295–321.
Kabre, Alda, Jean-François Laslier, and Karine Van der Straeten. 2012.
“A propos de la polarisation politique en Afrique.” Working Paper, Ecole
Polytechnique, Paris.
Laslier, Jean-François. 2011. “Lessons from in situ tests during French
elections.” In In Situ and Laboratory Experiments on Electoral Law Reform:
French Presidential Elections, eds. Bernard Dolez and Bernard Grofman and
Annie Laurent. Heidelberg: Springer, Chapter 5: 90–104.
Laslier, Jean-François, and François Maniquet. 2010. “Classical electoral
competion under approval voting.” In Handbook of Approval Voting, eds.
Jean-François Laslier and Remzi Sanver. Heidelberg: Springer, Chapter 17:
415–430.
42
Laslier, Jean-François, and Remzi Sanver. 2010. Handbook on Approval
Voting. Heidelberg: Springer-Verlag.
Laslier, Jean-François, and Karine van der Straeten. 2004. “Election prési-
dentielle : une expérience pour un autre mode de scrutin.” Revue Française
de Science Politique 54: 99–130.
Laslier, Jean-François, and Karine van der Straeten. 2008. “Approval vot-
ing in the French 2002 presidential election: A live experiment.” Experimen-
tal Economics 11: 97–195.
Núñez, Matias, and Jean-François Laslier. 2012. “Preference intensity rep-
resentation: Strategic overstating in large elections.” Working paper, Ecole
Polytechnique, Paris.
Rieg, Christelle. 2011. “43 millions d’électeurs en France” INSEE Première
no. 1369.
Smaoui, Hatem. 2007. “Le système de vote par note à trois niveaux :
étude axiomatique.” Working Paper BETA-CREM.
Van der Straeten, Karine, Jean-François Laslier, Nicolas Sauger, and An-
dré Blais. 2010. “Strategic, sincere, and heuristic voting under four election
rules: an experimental study.” Social Choice and Welfare 35: 435-472.
Van der Straeten, Karine, Jean-François Laslier, and André Blais. 2013.
“Vote au pluriel: How do people vote when offered to vote under different
rules?” PS: Political Science and Politics, forthcoming.
43
Supporting Information
Design and description of the 2012 experiment
Five voting stations in three localities were selected to host the experi-
ment: the two voting stations of the village of Louvigny, Normandy (where
one of the 2007 experiments had already taken place); one voting station (Bu-
reau de la Terrasse) in the city of Saint-Etienne, Rhône-Alpes; and two voting
stations (Bureaux de la salle de la Bourse) in the city of Strasbourg, Alsace.
On April 22nd, 2012, i.e., during the first round of the French presidential
elections, the voters were invited to test two other voting rules, approval vot-
ing (AV) and one modality of evaluative voting: EV(0,1,2) in Saint-Etienne,
EV(-1,0,2) in Louvigny, and EV(0,...,20) in Strasbourg.
Two weeks before the voting day, each registered voter received a letter
by post, informing her or him of the existence of the experiment, and of the
principle of the two tested rules. Just before the actual election, voters were
also informed by brief notices in the local press and on the radio, as well as
posters around the voting stations. In Louvigny, an information meeting was
organized two weeks prior, where voters could come and ask questions.
On April 22nd, as illustrated in figure 9, the experiment was run as follows.
Volunteers welcomed the registered voters who showed up in their respective
official voting stations, and informed them about the experiment when they
entered the building. After (and conditional upon) their participation in the
official vote, they were invited to head to the experimental voting stations;
these were located in the same building, either in another room (Louvigny
and Saint-Etienne), or in the same room (Strasbourg). At the experimental
44

Figure 9: Official and experimental voting stations, Saint-Etienne la Terrasse,April 22nd, 2012
45
voting station the participants find the experimental ballot papers, envelopes,
voting booths, a transparent ballot box, and sign-off sheets. Assessors were
present to provide information on the tested rules and, as in the official vote,
to organize the process of the ballot. Then voters could “vote experimentally,”
that is, participate in the test of two alternative voting rules. It was stated
clearly that the experimental votes would, of course, have no influence on
the actual outcome of the presidential election.
Experimental ballots
The voter receives an A4 folded sheet, making four pages. On page 1 is an
overall presentation of the experiment, designed to emphasize its “scientific”
purpose.
The two experimental ballots are on the central pages, as presented in
figure 10. On the left was Approval Voting (AV), and on the right was the
version of Evaluative Voting (EV) tested in the city. These voting rules are
simple enough that only a few sentences are required to completely describe
them. The list of candidates was always given according to the official list
(randomly) drawn by the French Constitutional council for this election.
Hence the order of appearance of names was the same for the official and the
experimental rules. The scale for EV was {0, 1, 2} in Saint-Etienne; this had
already been used there in 2007. It was {−1, 0,+1} in Louvigny. We were
curious to see how the voters would use the negative values. Lastly, the scale
for EV was {0, ..., 20} in Strasbourg; this wider scale is the common scale of
grades in the French school system.
46

Figure 10: AV, EV3(0,1,2), EV3(-1,0,1), EV21 experimental ballots. April22nd, 2012
47
Finally, page 4 contained the short optional questionnaire that each voter
could fill in. We do not report, in the present paper, on the detailed analysis
of the questionnaire.
Participation and expression rates
As mentioned above, 4,319 persons showed up in their respective offi-
cial voting stations, representing an average turnout of 80.41%, as compared
with the general turnout of 79.48% at the national level. Among these vot-
ers, 2,340 agreed to take part in the experiment, i.e., 54.18% over the five
voting stations. Details on turnout and participation rates are presented in
Table 6. The experimental participation rate is the ratio of the number of
voters who agreed to take part in the experiment to the number of registered
voters who did vote in their respective official voting station, as only voters
could participate in the experiment. 85.85% of the voters who participated
the experiment answered the questionnaires. Among the responses gathered
there, it is notable that 55% of the participants were female; 39% were 35
years old or less; 23% were over 55; and 67% of people who answered the
corresponding question declared themselves to have an occupation.
Table 7 reports the expression rates for AV and the three variants of EV.
An experimental ballot paper is “null" when there are annotations that are
not in accordance with the rules of AV or EVs. It is “blank" when it is en-
tirely empty. One notices that the total votes cast for AV is quite satisfying
(96.03%), and they are also high for the three EV. But it should be pointed
out that the expression rates in Louvigny and Saint-Etienne are higher than
48
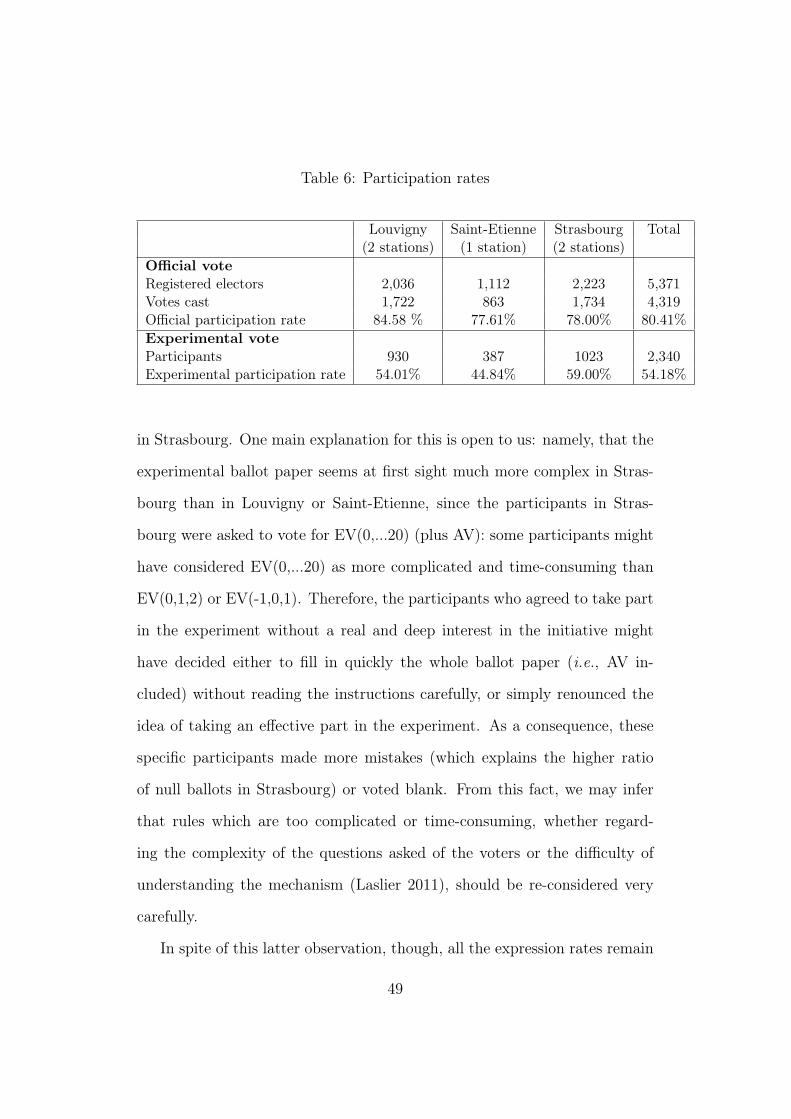
Table 6: Participation rates
Louvigny Saint-Etienne Strasbourg Total(2 stations) (1 station) (2 stations)
Official voteRegistered electors 2,036 1,112 2,223 5,371Votes cast 1,722 863 1,734 4,319Official participation rate 84.58 % 77.61% 78.00% 80.41%Experimental voteParticipants 930 387 1023 2,340Experimental participation rate 54.01% 44.84% 59.00% 54.18%
in Strasbourg. One main explanation for this is open to us: namely, that the
experimental ballot paper seems at first sight much more complex in Stras-
bourg than in Louvigny or Saint-Etienne, since the participants in Stras-
bourg were asked to vote for EV(0,...20) (plus AV): some participants might
have considered EV(0,...20) as more complicated and time-consuming than
EV(0,1,2) or EV(-1,0,1). Therefore, the participants who agreed to take part
in the experiment without a real and deep interest in the initiative might
have decided either to fill in quickly the whole ballot paper (i.e., AV in-
cluded) without reading the instructions carefully, or simply renounced the
idea of taking an effective part in the experiment. As a consequence, these
specific participants made more mistakes (which explains the higher ratio
of null ballots in Strasbourg) or voted blank. From this fact, we may infer
that rules which are too complicated or time-consuming, whether regard-
ing the complexity of the questions asked of the voters or the difficulty of
understanding the mechanism (Laslier 2011), should be re-considered very
carefully.
In spite of this latter observation, though, all the expression rates remain
49
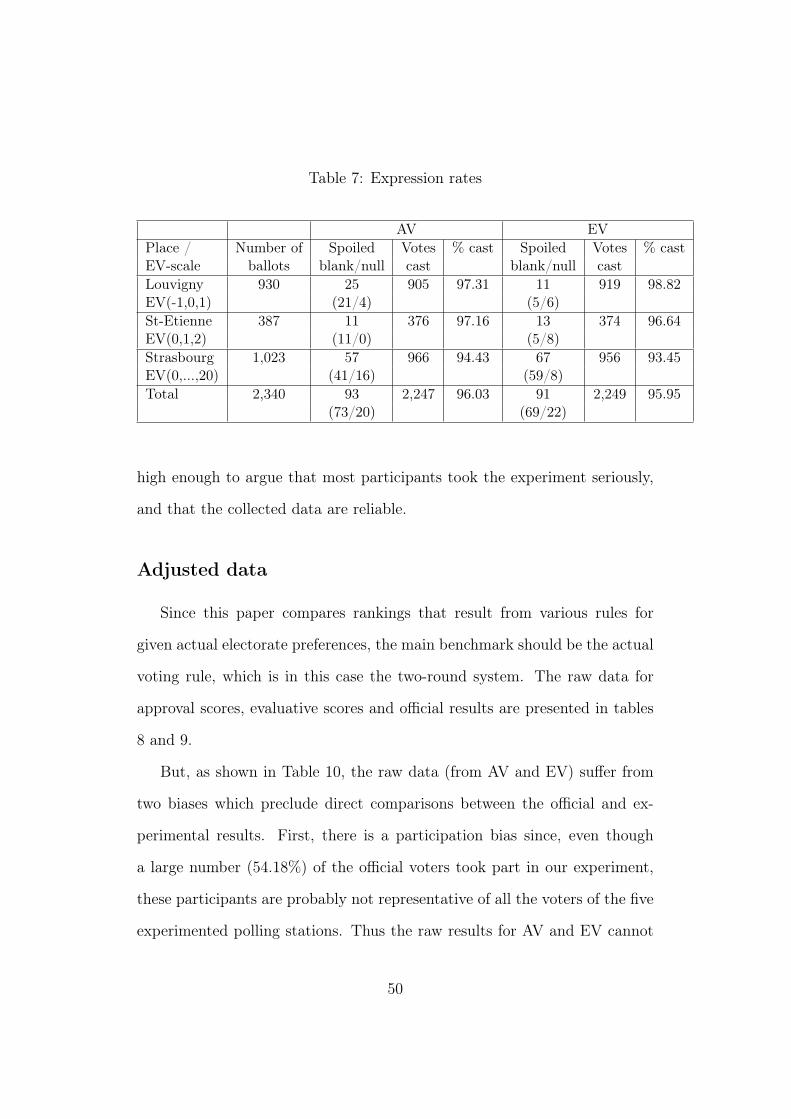
Table 7: Expression rates
AV EVPlace / Number of Spoiled Votes % cast Spoiled Votes % castEV-scale ballots blank/null cast blank/null castLouvigny 930 25 905 97.31 11 919 98.82EV(-1,0,1) (21/4) (5/6)St-Etienne 387 11 376 97.16 13 374 96.64EV(0,1,2) (11/0) (5/8)Strasbourg 1,023 57 966 94.43 67 956 93.45EV(0,...,20) (41/16) (59/8)Total 2,340 93 2,247 96.03 91 2,249 95.95
(73/20) (69/22)
high enough to argue that most participants took the experiment seriously,
and that the collected data are reliable.
Adjusted data
Since this paper compares rankings that result from various rules for
given actual electorate preferences, the main benchmark should be the actual
voting rule, which is in this case the two-round system. The raw data for
approval scores, evaluative scores and official results are presented in tables
8 and 9.
But, as shown in Table 10, the raw data (from AV and EV) suffer from
two biases which preclude direct comparisons between the official and ex-
perimental results. First, there is a participation bias since, even though
a large number (54.18%) of the official voters took part in our experiment,
these participants are probably not representative of all the voters of the five
experimented polling stations. Thus the raw results for AV and EV cannot
50
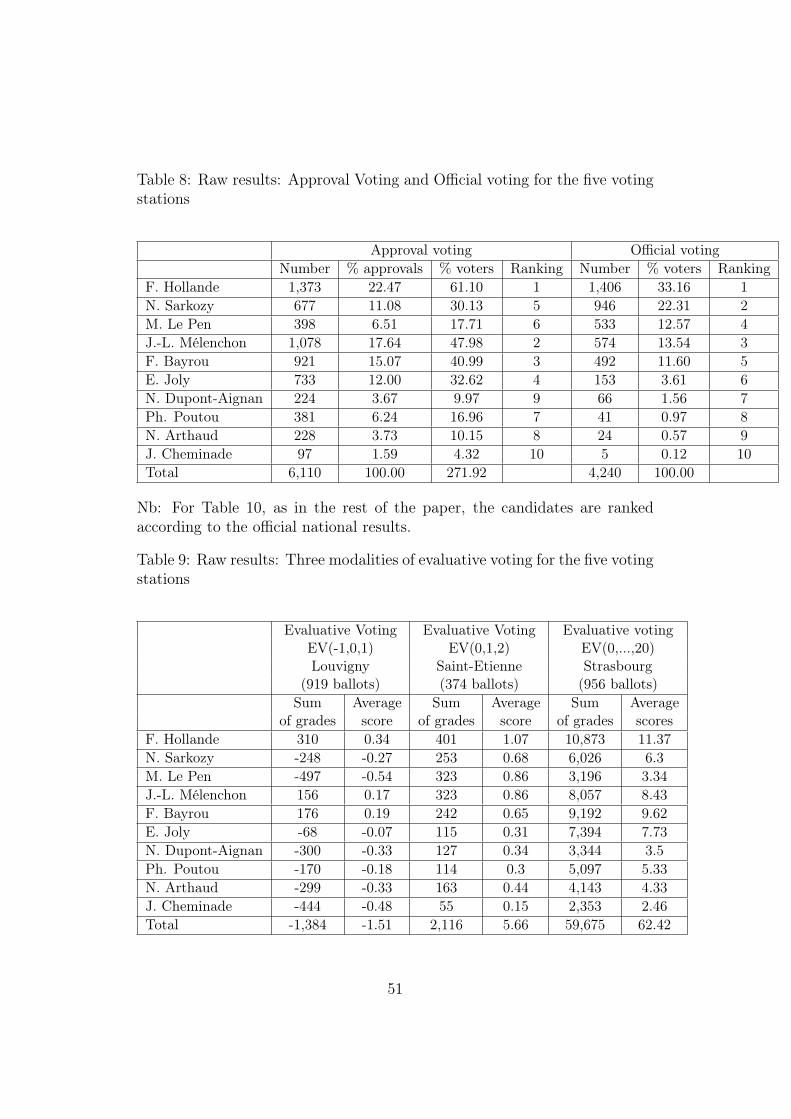
Table 8: Raw results: Approval Voting and Official voting for the five votingstations
Approval voting Official votingNumber % approvals % voters Ranking Number % voters Ranking
F. Hollande 1,373 22.47 61.10 1 1,406 33.16 1N. Sarkozy 677 11.08 30.13 5 946 22.31 2M. Le Pen 398 6.51 17.71 6 533 12.57 4J.-L. Mélenchon 1,078 17.64 47.98 2 574 13.54 3F. Bayrou 921 15.07 40.99 3 492 11.60 5E. Joly 733 12.00 32.62 4 153 3.61 6N. Dupont-Aignan 224 3.67 9.97 9 66 1.56 7Ph. Poutou 381 6.24 16.96 7 41 0.97 8N. Arthaud 228 3.73 10.15 8 24 0.57 9J. Cheminade 97 1.59 4.32 10 5 0.12 10Total 6,110 100.00 271.92 4,240 100.00
Nb: For Table 10, as in the rest of the paper, the candidates are rankedaccording to the official national results.
Table 9: Raw results: Three modalities of evaluative voting for the five votingstations
Evaluative Voting Evaluative Voting Evaluative votingEV(-1,0,1) EV(0,1,2) EV(0,...,20)Louvigny Saint-Etienne Strasbourg
(919 ballots) (374 ballots) (956 ballots)Sum Average Sum Average Sum Average
of grades score of grades score of grades scoresF. Hollande 310 0.34 401 1.07 10,873 11.37N. Sarkozy -248 -0.27 253 0.68 6,026 6.3M. Le Pen -497 -0.54 323 0.86 3,196 3.34J.-L. Mélenchon 156 0.17 323 0.86 8,057 8.43F. Bayrou 176 0.19 242 0.65 9,192 9.62E. Joly -68 -0.07 115 0.31 7,394 7.73N. Dupont-Aignan -300 -0.33 127 0.34 3,344 3.5Ph. Poutou -170 -0.18 114 0.3 5,097 5.33N. Arthaud -299 -0.33 163 0.44 4,143 4.33J. Cheminade -444 -0.48 55 0.15 2,353 2.46Total -1,384 -1.51 2,116 5.66 59,675 62.42
51
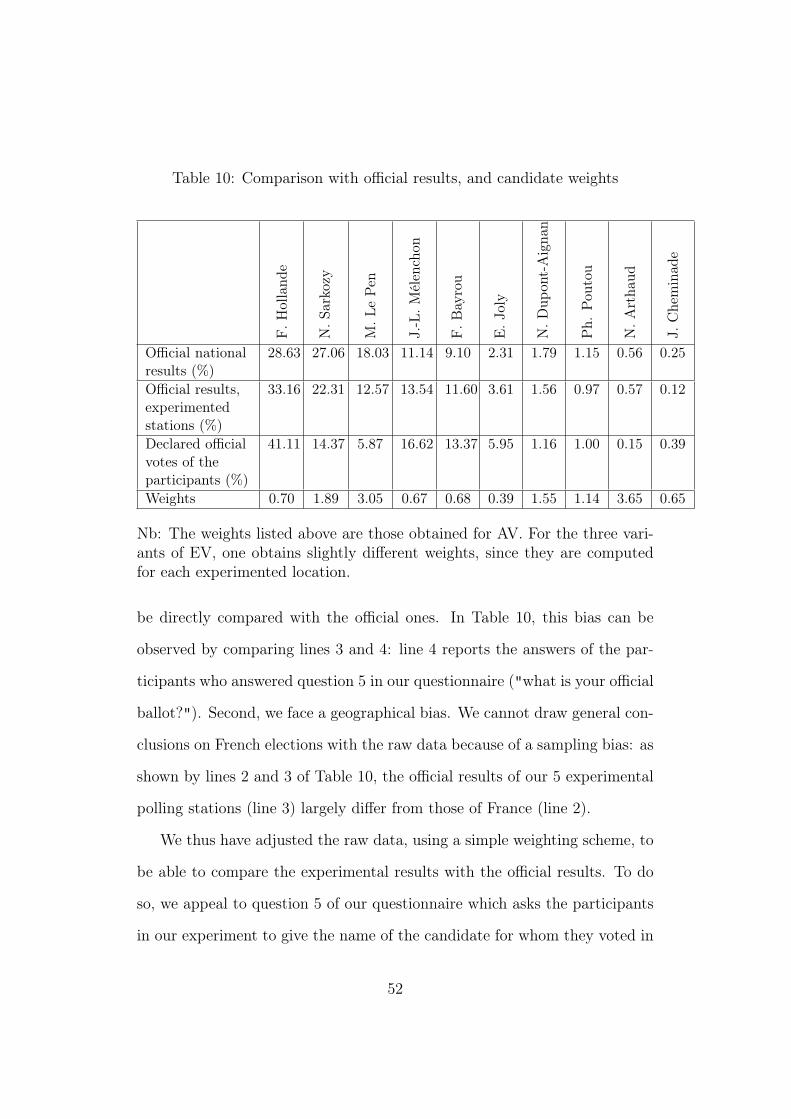
Table 10: Comparison with official results, and candidate weights
F.H
olland
e
N.S
arko
zy
M.L
ePen
J.-L.M
élen
chon
F.B
ayrou
E.J
oly
N.D
upon
t-Aigna
n
Ph.
Pou
tou
N.A
rtha
ud
J.Cheminad
e
Official nationalresults (%)
28.63 27.06 18.03 11.14 9.10 2.31 1.79 1.15 0.56 0.25
Official results,experimentedstations (%)
33.16 22.31 12.57 13.54 11.60 3.61 1.56 0.97 0.57 0.12
Declared officialvotes of theparticipants (%)
41.11 14.37 5.87 16.62 13.37 5.95 1.16 1.00 0.15 0.39
Weights 0.70 1.89 3.05 0.67 0.68 0.39 1.55 1.14 3.65 0.65
Nb: The weights listed above are those obtained for AV. For the three vari-ants of EV, one obtains slightly different weights, since they are computedfor each experimented location.
be directly compared with the official ones. In Table 10, this bias can be
observed by comparing lines 3 and 4: line 4 reports the answers of the par-
ticipants who answered question 5 in our questionnaire ("what is your official
ballot?"). Second, we face a geographical bias. We cannot draw general con-
clusions on French elections with the raw data because of a sampling bias: as
shown by lines 2 and 3 of Table 10, the official results of our 5 experimental
polling stations (line 3) largely differ from those of France (line 2).
We thus have adjusted the raw data, using a simple weighting scheme, to
be able to compare the experimental results with the official results. To do
so, we appeal to question 5 of our questionnaire which asks the participants
in our experiment to give the name of the candidate for whom they voted in
52
the official vote – 57% of the participants (67% of those who answered the
questionnaires) answered that question. Then, we apply to the participant in
our experiment who declared an official vote for candidate x a weight equal
to the ratio between the official score of candidate x and his experimental
score for the official ballot. For instance, according to the last line of Table
10, a participant who declared a vote in favor of E. Joly, the Green candidate,
has a weight of 0.39 (i.e., 2.31/5.95), while a participant who voted for M. Le
Pen, the candidate of the extreme Right, has a weight of 3.05 (17.90/5.87). In
other words, in our experiment the voters for E. Joly were over-represented,
while the voters for M. Le Pen were under-represented. After adjustment,
these voters are properly represented.
53