Embed Size (px)
Citation preview
An expanded model ofvariety-seeking behaviour in food
product choicesOliver Meixner and Viktoria Knoll
Institute of Marketing and Innovation, Department of Economic and SocialSciences, University of Natural Resources and Life Sciences Vienna,
Vienna, Austria
Abstract
Purpose – The aim of this paper is to introduce and evaluate an expanded model approximatingvariety-seeking behaviour (VSB), which is defined as the phenomenon that consumers switch betweenbrands because of the utility gained from the switch itself.
Design/methodology/approach – As a theoretical basis, two existing approaches, the switch (S)and the successive switch (SS) models, were examined and adjusted. The integration of bothapproaches led to the expanded “switch of brands” (SB) model. SB was tested empirically using paneldata for a highly developed food market (the Austrian food market for three product categories,i.e. fruit juice, fruit yoghurt, and chocolate, with data for 2007 and 2008).
Findings – The integration of S and SS into the expanded SB model succeeded. Based on an annualcomparison, the reliability of the SB model was tested. Since the results can be reproduced, it can bedetermined that the SB model is reliable. To test the explanatory power, a variable assessing brandloyalty (“brand purchase frequency”) was introduced. Correlation analyses showed that the expandedvariety-seeking model is more appropriate for approximating VSB than either S or SS.
Research limitations/implications – The SB model is still very basic, integrating only threevariables. Other influencing variables have to be considered to further improve the significance of theSB model.
Practical implications – The expanded VSB model can be applied in all product categories andmarkets where panel data are available. It helps to analyse panel data in view of consumers’ varietyseeking and brand switching behavior.
Originality/value – The expanded variety-seeking model (SB) is easy to implement and gives validinformation on VSB. It can be used for marketing decisions, especially in connection to brandmanagement.
Keywords Consumer behaviour, Brand loyalty, Consumer choice, Food consumption,Brand management
Paper type Research paper
1. IntroductionConsumers in highly developed food markets are confronted with a wide range ofalternatives (van Trijp and Steenkamp, 1990). Many reasons could incite consumers toswitch between products and brands (Lattin, 1987; Berne et al., 2001; Inman, 2001).
The current issue and full text archive of this journal is available at
www.emeraldinsight.com/0007-070X.htm
The authors would like to thank the Austrian National Bank, which promoted this study withfunds from the “ONB Jubilaumsfonds”, and Tobias Schediwy from GfK Austria, who made itpossible for the authors to work with the original consumer tracking panel data. Furthermore,the authors want to thank the anonymous reviewers for helping to improve the quality of thearticle significantly.
Model ofvariety-seeking
behaviour
1571
Received 17 March 2011Revised 17 July 2011
Accepted 10 August 2011
British Food JournalVol. 114 No. 11, 2012
pp. 1571-1586q Emerald Group Publishing Limited
0007-070XDOI 10.1108/00070701211273045
Switching behaviour has been categorised as derived or direct variation inproduct/brand choice (McAlister and Pessemier, 1982). Derived switchingcomprehends variation in purchase behaviour as a result of external motivation, suchas a change in the marketing mix of specific products or a change in the consumer’staste. Direct variation is argued to imply that the consumer seeks variety inproduct/brand choice motivated by the change itself. This article will concentrate on thisdirect, intrapersonal motive to switch between products (McAlister and Pessemier, 1982).In general, this motive is called “variety-seeking behaviour” (VSB). As consumers maketheir purchase decisions based on intrinsic and extrinsic reasons, it is important to knowthat in the context of food purchases “the most common extrinsic quality cues are theprice of the product, the store in which the product is bought, advertising claims aboutthe product, and the brand” (Grunert, 2002). In addition, this motivation seems to reflectthe consumers’ assumption of the food products’ quality (Banovic et al., 2010). Furtherworks (e.g. Bredahl, 2003) have shown that the brand is the predominant criterion forconsumers’ product choices (Bredahl, 2003, investigated beef). Another argument for thehigh relevance of analysing brand switching tendencies can be seen in its effect ondemand elasticities and the extent of competition in the market (Chintagunta et al., 2001),whereby the highly competitive nature of the food market can be discerned.
Based on these arguments, our study will describe VSB in the context of brandswitching (direct variation). Two core approaches to measuring VSB will be explained.The main advantages of these models are simplicity, convenience, and, consequently,practicability. However, these approaches can be considered simplification models,measuring VSB on a very rough basis. Consequently, an improved, expanded VSBmodel will be presented, combining both approaches in order to raise the explanatorypower of the VSB model in that sense that the predictive power of the expanded VSBmodel will be improved. The model will be tested with real world household scannerpanel data (product categories: fruit yoghurt, fruit juice, and chocolate; panel data from2007 to 2008 provided by GfK Austria for the Austrian food market). The evaluation inthree different product categories will help to better evaluate the validity of theexpanded VSB model in comparison to the existing ones.
2. Theoretical background of VSB2.1 A basic typology of VSBMany approaches on measuring VSB are available. On the one hand, self-reportmeasures mainly focus on the subjective measurement of VSB (e.g. VARSEEK-scale;van Trijp and Steenkamp, 1992). Experiments on certain aspects in the context of VSBcan be added to these approaches as well (e.g. purchase quantity and timing, Simonson,1990; price promotions, Kahn and Raju, 1991; shape arrays, Maimaran and Wheeler,2008). On the other hand there are approaches available using actual behaviour such aspanel data analysis (e.g. Givon, 1984; Kahn et al., 1986; Helmig, 1997; Tang and Chin,2007). The most important advantages of household scanner panel data are the largenumber of observations on a household level that provide representative data about theconsumer markets and data availability for different product categories (Bawa, 1990).Panel data measure real shopping behaviour. Based on that, the regular use of paneldata in market research is not surprising. Panel data for specific food products willhelp to test our VSB model and to provide better understanding of real worldpurchasing behaviour in specific food markets.
BFJ114,11
1572
Baumgartner (2002) elaborated a basic typology of purchase behaviour. In general,Baumgartner (2002) distinguishes between spontaneous purchases and deliberatepurchases. For our purpose, the so-called exploratory purchase behaviour – asub-category of spontaneous purchases – is of high relevance: it is considered to coverspontaneous, emotional purchases with high purchase involvement. In other words, VSBis especially present when the purchase was not necessarily planned but completedfollowing a more psychological than functional motive, but with a high extent of care.
Foxall (1993) supports the assumption that variety-seeking consumers are highlyinvolved with the product category. Confirming Meixner (2005) the tendency towardsVSB is less likely with staple foods such as eggs, butter, or milk. Typical varietyseeking products are for example desserts, fruit yoghurt, and fruit juices. Therefore,the analysis of VSB is also relevant in food product categories that are usually subjectto routine purchase decisions but can occasionally become highly involved (Barharrelland Denison, 1995).
2.2 VSB – theories and applicationIn general, variation of behaviour can have different reasons, which, among others, hasbeen categorised by McAlister and Pessemier (1982). VSB is – according to theirtaxonomy – behaviour that arises directly from intrapersonal motives. Intrinsicallymotivated varied behaviour, namely, a switch occurring because of the utility of theswitch itself (Givon, 1984), is called true variety-seeking behaviour (van Trijp et al.,1996). VSB does not include switches based on marketing mix variables or otherexternal influences. An important psychological paradigm for VSB is the so-calledoptimum stimulation level (OSL), which was introduced by Leuba (1955), indicating alevel of stimulation an individual attempts to reach (Raju, 1980). Based on that concept,a person seeks stimulation if the actual stimulation level is below the optimum. Beyonda specific level higher than the optimum stimulation level, stimulation is avoided.Zuckerman et al. (1964) postulated the first sensation-seeking scale (SSS) based on thisparadigm; more current knowledge on the OSL and different measurements ofsensation seeking are given by Zuckerman (1994). A further extension is the impulsivesensation seeking scale (ImpSS) by McDaniel and Mahan (2008) which includes the SSSand a subscale measuring the impulsivity, i.e. the tendency to act without thinking orplanning. Many authors have analysed the relationship between OSL and exploratorybehaviour (e.g. Raju, 1980; Steenkamp and Baumgartner, 1992) because it indicatesthat certain consumers (those with a higher OSL) tend to seek variety more than others(van Trijp et al., 1996). In the context of food consumption, a significant correlationbetween OSL and variety-seeking was found (Steenkamp and Baumgartner, 1992).
Another hypothetical concept focusing on exploratory behaviour and stimulationlevel is the so-called “variety drive” (Faison, 1977). The change of behaviour resultsfrom boredom with satisfying stimuli following usual patterns. This is a fundamentalbehavioural principle. Even if a consumer is completely satisfied with the purchasedproducts, she/he will at least occasionally purchase another brand just to gain a changeof pace. According to Menon and Kahn (1995), a switch to something different or newincreases the stimulation in the purchase situation. This change does not necessarilymean that the consumer purchases a totally unfamiliar product but something differentthan their regular choice ( Johnson et al., 1995). Accordingly, Lattin and McAlister(1985) assume that consumers switch between products of a certain portfolio.
Model ofvariety-seeking
behaviour
1573
Many authors emphasise the importance of the brand for consumers’ purchasedecision of food and beverage products (Cerjak et al., 2010; Grunert, 2002; Bredahl,2003). In general, brand switching is highly relevant when analysing food consumptionpatterns (Chintagunta et al., 2001); therefore the main focus should lie on the analysis ofbrand switching as a specific expression of VSB. This implies that VSB is seen as thereflected switching to another brand (Kahn et al., 1986) based on the gained utility ofthe change itself irrespective of the purchased brands (Givon, 1984) and the lack ofutility provided by repetitive purchases (Bawa, 1990).
In particular, VSB is relevant for brand managers who need to know whetherconsumers tend to switch brand or not (Chintagunta, 1998). If a product is associatedwith variety-seeking, some of the stock will carry over into the next period, and theconsumer will be more likely to purchase a substitute (Adamowicz, 1994). As analternating behaviour (Borgers et al., 1989), VSB can be identified when consumersmove away from their favourite brand even if a repeat purchase would offer morepleasure (Ratner et al., 1999). Givon (1984) estimated the effect of VSB in the followingtendency: decreasing probability of switching to a high preference brand in favour of alow preference brand. As a result, follower brands gain an opportunity to break into amarket or product category (Roehm and Roehm, 2004) as variety-seeking consumersare permanently looking for brand alternatives. In addition, van Trijp et al. (1996)emphasise the relevance of VSB for brand managers in developing strategies toincrease their market share.
However, because of VSB, brands lose their regular consumers (a competitive assetfor a brand; Dekimpe et al., 1997); brand loyalty decreases. Feinberg et al. (1994) foundthat changing the positioning strategy of a brand can improve its market share forvariety-seeking consumers. Another possibility is to change the patterns of pricepromotions corresponding to consumers’ intrinsic purchasing patterns (Kahn andLouie, 1990). Brand managers may encourage variety-seeking consumers to try theirproducts (Faison, 1977). Properly understanding and valid measuring of VSB (usingadequate VSB models) is therefore a strategic imperative influencing decisions ofbrand managers.
2.3 Theoretical model and research hypothesisBrand utility is often supposed to be a linear function of marketing variables andhousehold characteristics (Chintagunta et al., 2001). Various approaches toapproximating VSB have been based on the assumption that preferences for brandsremain constant while choice probabilities depending on prior choices change inrelation to variety-seeking tendencies (Givon, 1984; Lattin and McAlister, 1985; Kahnet al., 1986; Feinberg et al., 1994; Menon and Kahn, 1995). The assumption of constantpreferences for brands and varying choice probabilities will be maintained for thisstudy as well.
According to Givon (1984), the next choice of a brand solely depends on the lastchoice, which implies a first order Markov process. Thus, a switch is defined as adifferent choice than the immediately preceding one. Deviating from this assumption,Menon and Kahn (1995) define a switch as the choice of a brand which has not beenchosen at any time before in the shopping history of the consumer. In other words, it isassumed that the VSB increases when the number of different brands purchased by ahousehold increases (van Trijp and Steenkamp, 1990).
BFJ114,11
1574
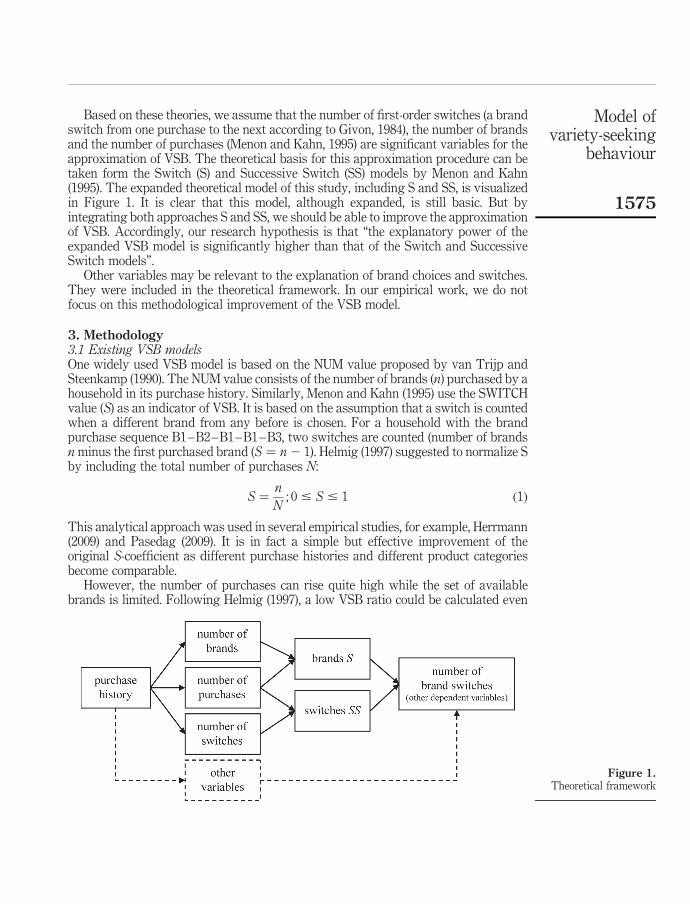
Based on these theories, we assume that the number of first-order switches (a brandswitch from one purchase to the next according to Givon, 1984), the number of brandsand the number of purchases (Menon and Kahn, 1995) are significant variables for theapproximation of VSB. The theoretical basis for this approximation procedure can betaken form the Switch (S) and Successive Switch (SS) models by Menon and Kahn(1995). The expanded theoretical model of this study, including S and SS, is visualizedin Figure 1. It is clear that this model, although expanded, is still basic. But byintegrating both approaches S and SS, we should be able to improve the approximationof VSB. Accordingly, our research hypothesis is that “the explanatory power of theexpanded VSB model is significantly higher than that of the Switch and SuccessiveSwitch models”.
Other variables may be relevant to the explanation of brand choices and switches.They were included in the theoretical framework. In our empirical work, we do notfocus on this methodological improvement of the VSB model.
3. Methodology3.1 Existing VSB modelsOne widely used VSB model is based on the NUM value proposed by van Trijp andSteenkamp (1990). The NUM value consists of the number of brands (n) purchased by ahousehold in its purchase history. Similarly, Menon and Kahn (1995) use the SWITCHvalue (S) as an indicator of VSB. It is based on the assumption that a switch is countedwhen a different brand from any before is chosen. For a household with the brandpurchase sequence B1–B2–B1–B1–B3, two switches are counted (number of brandsn minus the first purchased brand (S ¼ n 2 1). Helmig (1997) suggested to normalize Sby including the total number of purchases N:
S ¼n
N; 0 # S # 1 ð1Þ
This analytical approach was used in several empirical studies, for example, Herrmann(2009) and Pasedag (2009). It is in fact a simple but effective improvement of theoriginal S-coefficient as different purchase histories and different product categoriesbecome comparable.
However, the number of purchases can rise quite high while the set of availablebrands is limited. Following Helmig (1997), a low VSB ratio could be calculated even
Figure 1.Theoretical framework
Model ofvariety-seeking
behaviour
1575
though a high number of brands can be found in the households’ shopping basket; forexample, for N ¼ 100 and n ¼ 20 S ¼ 0:2. Indicating a rather low VSB, the ratiodelivers the wrong information. For most product categories, 20 purchased brands are,in fact, a lot. The interpretation as a variety-seeker seems to be more appropriate.Therefore, we suggest to modify S by using the relation between the total number ofswitches (n 2 1) and the maximum number of switches within the panel sample:
Smax ¼n 2 1
maxmk¼1 nkð Þ2 1
; 0 # Smax # 1 ð2Þ
with m representing the total number of all households in the panel. For our examplewith a maximum number of purchased brands maxm
k¼1 nkð Þ ¼ 25, Smax ¼ 0:8; themetric size of Smax then suggests to classify the household as variety-seeking, whichcomes closer to reality.
The simplified mathematical formulation of VSB via Smax does not include thesequence of brand switches (successive switches) and the total number of purchases.For this purpose, we incorporate the following second important model into ourconsiderations, the successive switch model (SS), where a switch is defined as adifferent choice after the preceding choice (Menon and Kahn, 1995); SS is the number ofswitches between brands on a first-order Markov basis. For each household, anabsolute SS coefficient is calculated as modelled by Menon and Kahn (1995). For theabove-mentioned purchase sequence of the example household, the metric number 3will be calculated. An improvement of the SS coefficient is possible by setting theoriginal indicator in relation to the number of purchases per household (Helmig, 1997).The number of (direct) successive switches of each household nij is divided by N,excluding the first purchase (Tscheulin and Helmig, 2007):
SS ¼nij
N 2 1ð Þ; 0 # SS # 1 ð3Þ
An empirical example using this approach can be taken from Herrmann (2009) andPasedag (2009). Another but similar formulation of this approach is the switching ratioposited by Papatla and Krishnamurthi (1992). In summary, it can be said that Smax informula 2 captures the choices depending on the number of purchased brands inrelation to the maximum number of purchased brands while SS in formula 3 capturesall alternations from item to item, independently of the number of brands in the choiceset (Menon and Kahn, 1995).
3.2 An expanded VSB modelAs Faison (1977) points out, there is “some optimal amount of cognitive tension”, whichcan be reached by alternating from item to item. A consumer with a highvariety-seeking tendency can be satisfied by switching between brands on eachoccasion or between two brands – depending on his/her preferences. Accordingly, it ispreferable to define a coefficient measuring VSB that includes the number of brands aswell as the number of first order switches between them. Technically, we have to find asolution for the general formula f(n,nij, N, b) with n as the number of brands, nij as thenumber of successive switches, N as the total number of all purchases and brepresenting all other relevant input variables. These input variables could beassociated with:
BFJ114,11
1576
. marketing, e.g. price promotions (Kahn and Louie, 1990; Kahn and Raju, 1991),handout of samples (Helmig, 1999), or the product display format (Simonson andWiner, 1992);
. the purchase situation, e.g. a purchase for oneself or a purchase as a gift foranother person (Choi et al., 2006), the time of the day (Roehm and Roehm, 2004);
. the purchase quantity (Simonson, 1990; Simonson and Winer, 1992); and
. the individual consumer, e.g. gender (Mitchell and Walsh, 2004), age (Nicklaus et al.2005; Novak and Mather, 2007), or culture (Briley et al., 2000; Kim and Drolet, 2003).
We will not include b into our further considerations; however, it is probable that otherimportant factors have to be included in the formulation of a valid mathematical modelto obtain a true picture of real purchase behaviours concerning VSB. This shall be donein future research activities.
A methodological approach to obtain the mathematical formulation of f(n,nij, N, b)could be found by combining the Smax and SS coefficient formulated above (where allvariables are included except for b). The basic possibilities for integrating all inputvariables into the approximation of this expanded VSB coefficient are:
. the additive; and
. the multiplicative combination of Smax and SS.
Of course, in both cases we would have to normalize as was done in the case of Smax
and SS (additive combination: division by 2; multiplicative combination: square root).In fact, we then use a well-known statistical tool to combine Smax and SS, the mean(arithmetic or geometric). In general, for aggregating ratios or percentage changes, thegeometric mean is applied (Costa, n.d.; Dandamudi, 2003), especially if these ratios arenormalized (Lilja, 2000). In our case, the geometric mean will be applied to combineboth coefficients. Two ratios should be combined to obtain a single key index for VSB.Besides meeting the criteria “validity”, this index should be clearly interpretable, easyto understand for marketing purposes (e.g. a ratio from 0 to 1 like Smax and SS), and themetric size of the ratio must be “unidirectional”: it can be interpreted in only onedirection. These conditions are only fulfilled if we use the geometric mean (instead ofthe arithmetic mean) to aggregate Smax and SS. If we used the arithmetic mean, theinterpretation would be ambiguous. A metric value of, for example, 0.5 could becalculated because the household makes a lot of successive switches (SS ! 1) butonly buys a limited number of brands (Smax ! 0). The classification of this householdas variety-seeking is problematic. The limited set of brands signals that the householdwants some kind of variation but is satisfied with the purchase of only few brands. Theinterpretation as rather brand loyal seems more appropriate. In contrast, theinterpretation of the ratio based on the geometric mean is much clearer: if one of thetwo interesting coefficients is low, the expanded VSB index will also stay rather low.
Based on this argumentation, the expanded coefficient is computed with formula 4.Consequently, we will use the abbreviation for switches “S” of brands “B” (SB):
SB ¼
ffiffiffiffiffiffiffiffiffiffiffiffiffiffiffiffiffiffiffiffiffiffiffiffiffiffiffiffiffiffiffiffiffiffiffiffiffiffiffiffiffiffiffiffiffiffiffiffiffiffiffiffiffiffiðn 2 1Þ · nij
Maxmk¼1 nkð Þ2 1
� �· N 2 1ð Þ
s; 0 # SB # 1 ð4Þ
Model ofvariety-seeking
behaviour
1577
where n ¼ number of brand switches, nij ¼ number of successive switches, N ¼ thetotal number of purchases, and m ¼ the total size of the sample. Again, the ratio willrange from 0 (absolute variety 2 avoidance, full brand loyalty) to 1 (absolutevariety 2 seeking on each occasion): 0 # SB # 1.
The interpretation of the expanded coefficient is simple: the more switches occurand the more brands are represented in the purchase history, the higher is the metricvalue (up to the maximum of 1) and the more appropriate is the classification as avariety 2 seeking household. In contrast to that, if both coefficients Smax and SS arelow (near 0), a rather high variety 2 avoiding tendency can be assumed. Thesehouseholds do not switch a lot between brands, have a limited set of brands and can beconsidered brand loyal. The more difficult to interpret are all values between theseextremes of VSB (either very high or very low VSB). In general, a lower metric value ofthe coefficient is a distinct signal that the household is rather variety 2 avoiding,whereas a higher metric value is a clear signal that this household is seeking variety.But some “fuzzy areas” still remain where a definite classification is not possible. Itmay be assumed that the households with intermediary values should not be classifiedas significant variety 2 seekers or variety 2 avoiders. Their behaviour is probablydefined by a more or less unsteady, occasional VSB. Furthermore, we assume that thisgroup of consumers includes the majority of all households. The analysis of real datashould give us a more accurate assessment in that regard.
4. Empirical analyses4.1 Empirical dataTo evaluate the validity of SB in comparison to Smax and SS, real world panel data for aspecific market are taken. The household scanner panel data on three productcategories were provided by GfK Austria, collected from 2007 to 2008. The panels forfruit juice, fruit yoghurt, and chocolate include in total 4,015, 3,922 and 3,981households, respectively. However, not all of these households are relevant to ourresearch goal. In particular, households with a minimum product purchase frequencyhad to be identified. Many authors stress the importance of heavy users for a brand’ssurvival (Kelley and Jugenheimer, 2006). These households interact more with brandsand have stronger feelings toward brands (Jewell and Unnava, 2004). Thus, consumerswith a high purchase frequency tend to develop a habitual, routine buying behaviourand in that brand loyalty (Bennett et al., 2005). We assume that a certain number ofpurchases must be observed to obtain valid approximations. The inclusion of allbuyers is not really useful. Households with a low purchase frequency of specific foodproducts are in fact not relevant for the analysis of VSB. The time lag between twopurchases is usually too long to be able to evaluate the sequence of purchased brands.Therefore, only heavy users will be included in the further analysis showing that VSBalso occurs in the heavy user segment where brand loyalty can primarily beexpected.The definition of heavy users is often based on the Pareto principle (20 percent of the consumers are responsible for 80 per cent of the purchases; Kelley andJugenheimer, 2006). Another approach instead observes the consumer group thataccounts for a large part of the sales (the “heavy half”; Evans and Berman, 1994). Sharp(2010) states that 20 per cent of the consumers account for 60 per cent of the purchases.Similarly, Hiebig et al. (2004) define their “heavy 2 user segment if approximately onethird or less of the consumers account for approximately two thirds or more of the
BFJ114,11
1578
purchases” (Hiebig et al., 2004, p. 42). Moreover, the so 2 called “relatively heavyusers” are above the usage median (Foxall, 1981). We concentrated on the lastdefinition, using the median of the number of purchases to generate the subsets.Consequently, the subsets included only those households that purchased fruit juices43 þ times, fruit yoghurts 68 þ times, or chocolates 44 þ times. Based on theselimits, the subsets include 625, 616, and 600 households, respectively. This 15 per centof all households are responsible for about 50 per cent of the total sales volume whichsupports the assumptions of Sharp (2010) and Hiebig et al. (2004). In fact, the definitionof heavy users (15 per cent, 20 per cent or one 2 third of all consumers responsible fora major part of all sales) is relatively irrelevant for the evaluation of our expanded VSBmodel. The following calculations could be done with any segment of buyers with aminimum buying frequency.
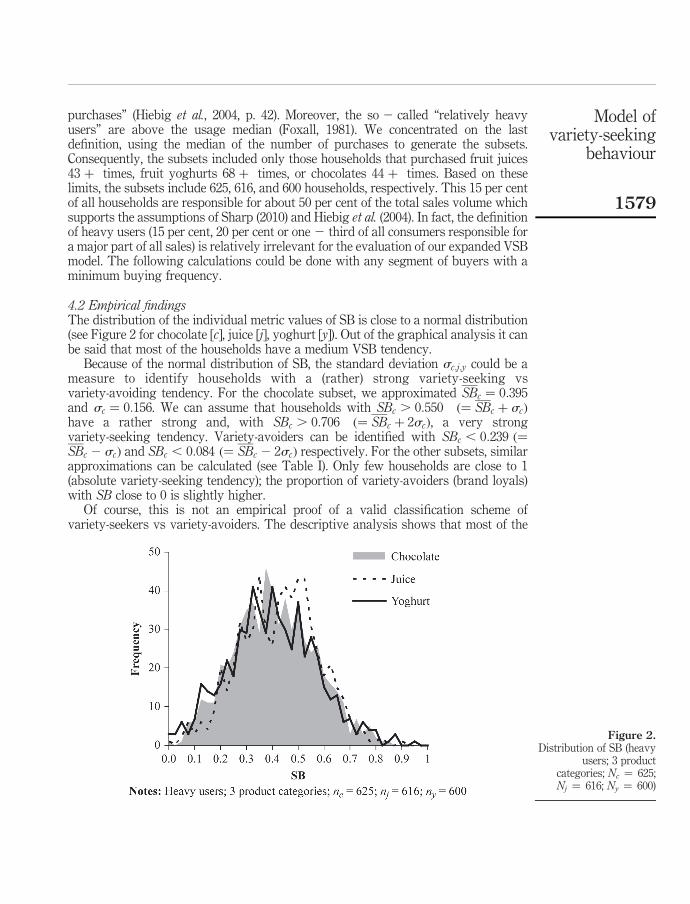
4.2 Empirical findingsThe distribution of the individual metric values of SB is close to a normal distribution(see Figure 2 for chocolate [c], juice [j], yoghurt [y]). Out of the graphical analysis it canbe said that most of the households have a medium VSB tendency.
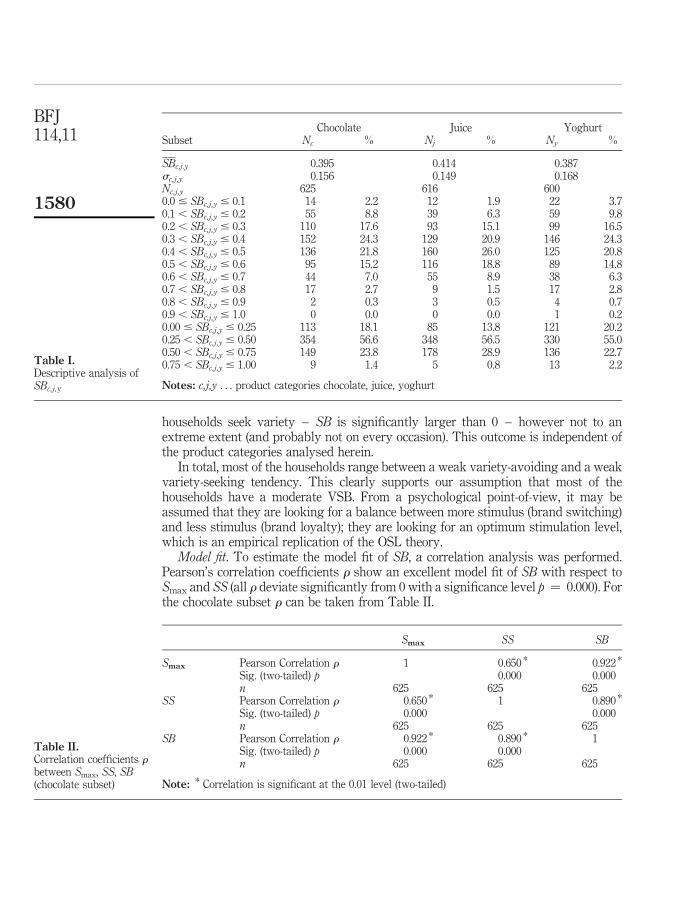
Because of the normal distribution of SB, the standard deviation sc;j;y could be ameasure to identify households with a (rather) strong variety-seeking vsvariety-avoiding tendency. For the chocolate subset, we approximated SBc ¼ 0:395and sc ¼ 0:156. We can assume that households with SBc . 0:550 ð¼ SBc þ scÞhave a rather strong and, with SBc . 0:706 ð¼ SBc þ 2scÞ, a very strongvariety-seeking tendency. Variety-avoiders can be identified with SBc , 0:239 ð¼SBc 2 scÞ and SBc , 0:084 ð¼ SBc 2 2scÞ respectively. For the other subsets, similarapproximations can be calculated (see Table I). Only few households are close to 1(absolute variety-seeking tendency); the proportion of variety-avoiders (brand loyals)with SB close to 0 is slightly higher.
Of course, this is not an empirical proof of a valid classification scheme ofvariety-seekers vs variety-avoiders. The descriptive analysis shows that most of the
Figure 2.Distribution of SB (heavy
users; 3 productcategories; Nc ¼ 625;Nj ¼ 616; Ny ¼ 600)
Model ofvariety-seeking
behaviour
1579
households seek variety – SB is significantly larger than 0 – however not to anextreme extent (and probably not on every occasion). This outcome is independent ofthe product categories analysed herein.
In total, most of the households range between a weak variety-avoiding and a weakvariety-seeking tendency. This clearly supports our assumption that most of thehouseholds have a moderate VSB. From a psychological point-of-view, it may beassumed that they are looking for a balance between more stimulus (brand switching)and less stimulus (brand loyalty); they are looking for an optimum stimulation level,which is an empirical replication of the OSL theory.
Model fit. To estimate the model fit of SB, a correlation analysis was performed.Pearson’s correlation coefficients r show an excellent model fit of SB with respect toSmax and SS (all r deviate significantly from 0 with a significance level p ¼ 0.000). Forthe chocolate subset r can be taken from Table II.
Chocolate Juice YoghurtSubset Nc % Nj % Ny %
SBc;j;y 0.395 0.414 0.387sc,j,y 0.156 0.149 0.168Nc,j,y 625 616 6000.0 # SBc,j,y # 0.1 14 2.2 12 1.9 22 3.70.1 , SBc,j,y # 0.2 55 8.8 39 6.3 59 9.80.2 , SBc,j,y # 0.3 110 17.6 93 15.1 99 16.50.3 , SBc,j,y # 0.4 152 24.3 129 20.9 146 24.30.4 , SBc,j,y # 0.5 136 21.8 160 26.0 125 20.80.5 , SBc,j,y # 0.6 95 15.2 116 18.8 89 14.80.6 , SBc,j,y # 0.7 44 7.0 55 8.9 38 6.30.7 , SBc,j,y # 0.8 17 2.7 9 1.5 17 2.80.8 , SBc,j,y # 0.9 2 0.3 3 0.5 4 0.70.9 , SBc,j,y # 1.0 0 0.0 0 0.0 1 0.20.00 # SBc,j,y # 0.25 113 18.1 85 13.8 121 20.20.25 , SBc,j,y # 0.50 354 56.6 348 56.5 330 55.00.50 , SBc,j,y # 0.75 149 23.8 178 28.9 136 22.70.75 , SBc,j,y # 1.00 9 1.4 5 0.8 13 2.2
Notes: c,j,y . . . product categories chocolate, juice, yoghurt
Table I.Descriptive analysis ofSBc,j,y
Smax SS SB
Smax Pearson Correlation r 1 0.650 * 0.922 *
Sig. (two-tailed) p 0.000 0.000n 625 625 625
SS Pearson Correlation r 0.650 * 1 0.890 *
Sig. (two-tailed) p 0.000 0.000n 625 625 625
SB Pearson Correlation r 0.922 * 0.890 * 1Sig. (two-tailed) p 0.000 0.000n 625 625 625
Note: * Correlation is significant at the 0.01 level (two-tailed)
Table II.Correlation coefficients rbetween Smax, SS, SB(chocolate subset)
BFJ114,11
1580
Correlation analysis in the other product categories delivered similar results for fruitjuice: r(SB,Smax) ¼ 0.939, r(SB,SS) ¼ 0.868 and for fruit yoghurt:r(SB,Smax) ¼ 0.930, r(SB,SS) ¼ 0.864. This result is not surprising: SB is defined asthe multiplicative combination of Smax and SS. However, Table II shows that thecorrelation coefficients between SB and Smax, SS are much higher than the correlationcoefficient between SS and Smax (in all product categories). Therefore, it can beassumed that the integration of Smax and SS into one key indicator SB succeeded; SBindeed covers both.
Reliability. The test of reliability was performed with the help of an annualcomparison. The subsets were limited to those households which took part in the panelin both years and completed at least 21 fruit juice, 34 fruit yoghurt, or 22 chocolatepurchases each year (half of the number of purchases required for the classification asheavy users). Consequently, correlation analyses of the product categories included377, 364, and 382 households respectively. In the chocolate subset the correlationcoefficients between the years 2007 and 2008 amount to rðSB07; SB08Þ ¼ 0:683. Incomparison, the correlation coefficients of Smax and SS between the years are lowerwith rðSmax07; Smax08Þ ¼ 0:645, rðSS07; SS08Þ ¼ 0:654. Computations in the otherproduct categories delivered similar results for fruit juice: rðSB07; SB08Þ ¼ 0:661,rðSmax07; Smax08Þ ¼ 0:642, rðSS07; SS08Þ ¼ 0:568 and for fruit yoghurt:rðSB07; SB08Þ ¼ 0:770, rðSmax07; Smax08Þ ¼ 0:715, rðSS07; SS08Þ ¼ 0:721. Thesefindings indicate that the reliability of SB in any product category is higher thanthat of Smax and SS. As consumer behaviour might change with time and initiated bythe participation in a consumer panel (panel bias), it is clear that a correlationcoefficient close to 1 is not realistic. The high correlation however shows that a fairlystable VSB tendency exists within the group of heavy users. The results are therefore“reproducible”; the set of measurements of SB in both years is consistent. Thereliability of the expanded SB model is high.
Explanatory power. For testing the explanatory (predictive) power of SS, we will usea dependent variable approximating brand loyalty, namely, the average frequency ofpurchasing acts before another brand is bought (“brand purchase frequency”, BPF).Formally, BPF is calculated by dividing the total number of purchases N by thenumber of purchased brands n:
BPF ¼N
nð5Þ
The higher the metric size of BPF is, the higher the brand loyalty of the relevanthousehold can be assumed.
The results in Table III show that Smax has the lowest explanatory power, while SBdemonstrates the highest correlations in the fruit juice and fruit yoghurt subset. For thechocolate subset, the correlation coefficients r between BPF and SS and SB amount toalmost the same metric size. This result supports our research hypothesis: SB has ahigher explanatory power than the more simplified coefficients Smax and SS. The VSBmodel could be improved; the expanded VSB model seems to be more adequate formeasuring variety-seeking than the other models. The correlation of Smax with SS isconsistent with Helmig’s (1997) results, where a correlation coefficient of 0.654 betweenS (calculated confirming formula 1) and SS in a chocolate bar panel had beencomputed.
Model ofvariety-seeking
behaviour
1581
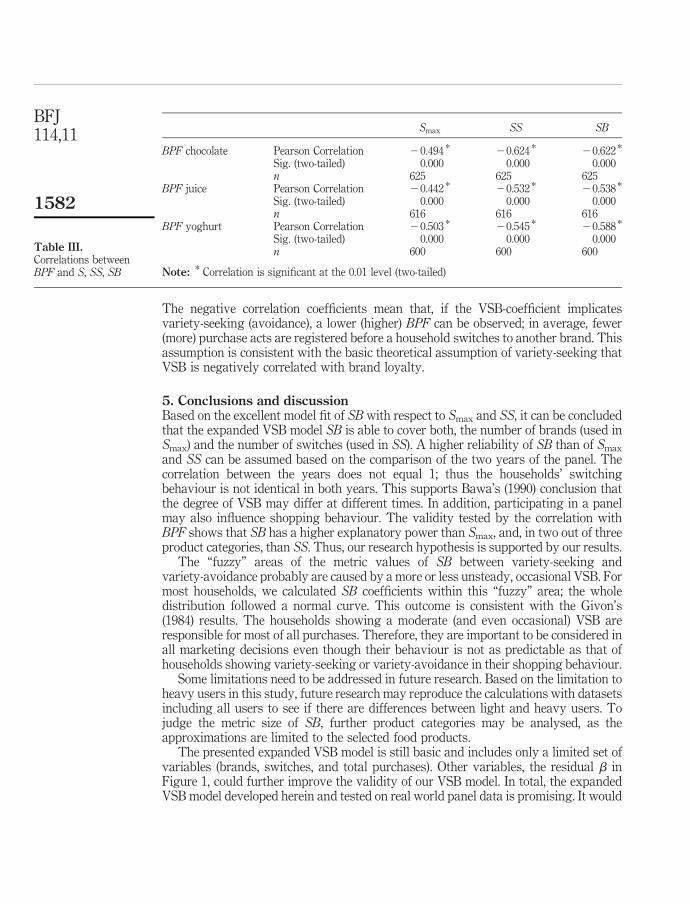
The negative correlation coefficients mean that, if the VSB-coefficient implicatesvariety-seeking (avoidance), a lower (higher) BPF can be observed; in average, fewer(more) purchase acts are registered before a household switches to another brand. Thisassumption is consistent with the basic theoretical assumption of variety-seeking thatVSB is negatively correlated with brand loyalty.
5. Conclusions and discussionBased on the excellent model fit of SB with respect to Smax and SS, it can be concludedthat the expanded VSB model SB is able to cover both, the number of brands (used inSmax) and the number of switches (used in SS). A higher reliability of SB than of Smax
and SS can be assumed based on the comparison of the two years of the panel. Thecorrelation between the years does not equal 1; thus the households’ switchingbehaviour is not identical in both years. This supports Bawa’s (1990) conclusion thatthe degree of VSB may differ at different times. In addition, participating in a panelmay also influence shopping behaviour. The validity tested by the correlation withBPF shows that SB has a higher explanatory power than Smax, and, in two out of threeproduct categories, than SS. Thus, our research hypothesis is supported by our results.
The “fuzzy” areas of the metric values of SB between variety-seeking andvariety-avoidance probably are caused by a more or less unsteady, occasional VSB. Formost households, we calculated SB coefficients within this “fuzzy” area; the wholedistribution followed a normal curve. This outcome is consistent with the Givon’s(1984) results. The households showing a moderate (and even occasional) VSB areresponsible for most of all purchases. Therefore, they are important to be considered inall marketing decisions even though their behaviour is not as predictable as that ofhouseholds showing variety-seeking or variety-avoidance in their shopping behaviour.
Some limitations need to be addressed in future research. Based on the limitation toheavy users in this study, future research may reproduce the calculations with datasetsincluding all users to see if there are differences between light and heavy users. Tojudge the metric size of SB, further product categories may be analysed, as theapproximations are limited to the selected food products.
The presented expanded VSB model is still basic and includes only a limited set ofvariables (brands, switches, and total purchases). Other variables, the residual b inFigure 1, could further improve the validity of our VSB model. In total, the expandedVSB model developed herein and tested on real world panel data is promising. It would
Smax SS SB
BPF chocolate Pearson Correlation 20.494 * 20.624 * 20.622 *
Sig. (two-tailed) 0.000 0.000 0.000n 625 625 625
BPF juice Pearson Correlation 20.442 * 20.532 * 20.538 *
Sig. (two-tailed) 0.000 0.000 0.000n 616 616 616
BPF yoghurt Pearson Correlation 20.503 * 20.545 * 20.588 *
Sig. (two-tailed) 0.000 0.000 0.000n 600 600 600
Note: * Correlation is significant at the 0.01 level (two-tailed)
Table III.Correlations betweenBPF and S, SS, SB
BFJ114,11
1582
be interesting to improve this approach by including marketing variables (price,promotion, display, etc.) as well as personal psychographic variables (e.g. attitudes,values) or socio-demographic variables. While the first type of variables andsocio-demographic variables are included in scanner household panel data,psychographic variables are less available in such, especially since they areperson-specific while panel data are gathered on a household level. This might be animportant issue for future research activities. In summary, the simplicity andpracticability of the expanded VSB model in connection with validity (with respect tobrand loyalty) and reliability are the main advantages over other VSB models.Accordingly, it can be applied in all product categories and markets where panel dataare available. Thus, SB is a significant improvement of the existing models used inmarket research. SB provides an estimation of VSB as the switching between brandsbased on the utility of switching, and independent of consumer satisfaction. The outputof SB can be used to estimate purchase probabilities. A follow-up model includingother variables shall be developed in future research to assess true VSB effectively.
References
Adamowicz, W.L. (1994), “Habit formation and variety seeking in a discrete choice model ofrecreation demand”, Journal of Agricultural and Resource Economics, Vol. 19 No. 1, pp. 19-31.
Banovic, M., Grunert, K.G., Barreira, M.M. and Fontes, M.A. (2010), “Consumers’ qualityperception of national branded, national store branded and imported store branded beef”,Meat Science, Vol. 84 No. 1, pp. 54-65.
Barharrell, B. and Denison, T.J. (1995), “Involvement in a routine food shopping context”, BritishFood Journal, Vol. 97 No. 4, pp. 24-9.
Baumgartner, H. (2002), “Toward a personology of the consumer”, Journal of ConsumerResearch, Vol. 29 No. 2, pp. 286-92.
Bawa, K. (1990), “Modeling inertia and variety seeking tendencies in brand choice behavior”,Marketing Science, Vol. 9 No. 3, pp. 263-78.
Bennett, R., Hartel, C.E.J. and McColl-Kennedy, J.R. (2005), “Experience as a moderator ofinvolvement and satisfaction on brand loyalty in a business-to-business setting 02-314R”,Industrial Marketing Management, Vol. 34, pp. 97-107.
Berne, C., Mugica, J.M. and Yague, M.J. (2001), “The effect of variety-seeking on customerretention in services”, Journal of Retailing and Consumer Services, Vol. 8 No. 6, pp. 335-45.
Borgers, A.W.J., van der Heijden, R.E.C.M. and Timmermans, H.J.P. (1989), “A variety seekingmodel of spatial choice-behaviour”, Environment and Planning A, Vol. 21 No. 8, pp. 1037-48.
Bredahl, L. (2003), “Cue utilisation and quality perception with regard to branded beef“”, FoodQuality and Preference, Vol. 15 No. 1, pp. 65-75.
Briley, D.A., Morris, M.W. and Simonson, I. (2000), “Reasons as carriers of culture: dynamicversus dispositional models of cultural influence on decision making”, Journal ofConsumer Research, Vol. 27, pp. 157-78.
Cerjak, M., Haas, R. and Kovacic, D. (2010), “Brand familiarity and tasting in conjoint analysis”,British Food Journal, Vol. 112 No. 6, pp. 561-79.
Chintagunta, P., Kyriazidou, E. and Perktold, J. (2001), “Panel data analysis of household brandchoices”, Journal of Econometrics, Vol. 103 Nos 1/2, pp. 111-53.
Model ofvariety-seeking
behaviour
1583
Chintagunta, P.K. (1998), “Inertia and variety seeking in a model of brand-purchase timing – timeafter time: state dependence in a model of brand switching and purchase timing behavior”,Marketing Science, Vol. 17 No. 3, pp. 253-70.
Choi, J., Kim, B.K., Choi, I. and Yi, Y. (2006), “Variety-seeking tendency in choice for others:interpersonal and intrapersonal causes”, Journal of Consumer Research, Vol. 32 No. 4, pp. 590-5.
Costa, J. (n.d.), “Buzzards Bay National Estuary Program. Calculating geometric means”,available at: www.buzzardsbay.org/geomean.htm (accessed 16 March 2011).
Dandamudi, S.P. (2003), Fundamentals of Computer Organization and Design, Springer,New York, NY.
Dekimpe, M.G., Steenkamp, J.-B.E.M., Mellens, M. and Abeele, P.V. (1997), “Decline andvariability in brand loyalty”, International Journal of Research in Marketing, Vol. 14 No. 5,pp. 405-20.
Evans, J.R. and Berman, B. (1994), Marketing, Macmillan, New York, NY.
Faison, E.W.J. (1977), “The neglected variety drive: a useful concept for consumer behavior”,Journal of Consumer Research, Vol. 4 No. 3, pp. 172-5.
Feinberg, F.M., Kahn, B.E. and McAlister, L. (1994), “Implications and relative fit of severalfirst-order Markov models of consumer variety seeking”, European Journal of OperationalResearch, Vol. 76 No. 2, pp. 309-20.
Foxall, G.R. (1981), Strategic Marketing Management, Biddles, Guildford.
Foxall, G.R. (1993), “The influence of cognitive style on consumers’ variety seeking among foodinnovations”, British Food Journal, Vol. 95 No. 9, pp. 32-6.
Givon, M. (1984), “Variety seeking through brand switching”, Marketing Science, Vol. 3 No. 1,pp. 1-22.
Grunert, K.G. (2002), “Current issues in the understanding of consumer food choice”, Trends inFood Science and Technology, Vol. 13 No. 8, pp. 275-85.
Helmig, B. (1997), Variety-seeking-behavior im Konsumguterbereich: Beeinflussungsmoglichkeitendurch Marketinginstrumente, Gabler, Wiesbaden.
Helmig, B. (1999), “Der Einfluß der Ausgabe unentgeltlicher Produktproben auf das‘variety-seekingbehavior’”, Marketing ZFP, Vol. 21 No. 2, pp. 105-20.
Herrmann, L. (2009), Empfehlungsmarketing als Instrument der Kundenbindung, Igel Verlag,Hamburg.
Hiebig, R.G., Hiebig, R. and Cooper, S.W. (2004), The One-day Marketing Plan: Organizing andCompleting a Plan that Works, McGraw-Hill, New York, NY.
Inman, J.J. (2001), “The role of sensory-specific satiety in attribute-level variety seeking”, Journalof Consumer Research, Vol. 28 No. 1, pp. 105-20.
Jewell, R.D. and Unnava, H.R. (2004), “Exploring differences in attitudes between light and heavybrand users”, Journal of Consumer Psychology, Vol. 14 Nos 1/2, pp. 75-80.
Johnson, M.D., Herrmann, A. and Gutsche, J. (1995), “A within-attribute model of variety-seekingbehaviour”, Marketing Letters, Vol. 6 No. 3, pp. 235-43.
Kahn, B.E. and Louie, T.A. (1990), “Effects of retraction of price promotions on brand choicebehavior for variety seeking and last-purchase-loyal consumers”, Journal of MarketingResearch, Vol. 27, pp. 279-89.
Kahn, B.E. and Raju, J.S. (1991), “Effects of price promotions on variety-seeking andreinforcement behavior”, Marketing Science, Vol. 10 No. 4, pp. 316-37.
Kahn, B.E., Kalwani, M.U. and Morrison, D.G. (1986), “Measuring variety-seeking and reinforcementbehaviors using panel data”, Journal of Marketing Research, Vol. 23, pp. 89-100.
BFJ114,11
1584
Kelley, L.D. and Jugenheimer, D.W. (2006), Advertising Account Planning: A Practical Guide,M.E. Sharpe, New York, NY.
Kim, H.S. and Drolet, A. (2003), “Choice and self-expression: a cultural analysis ofvariety-seeking”, Journal of Personality and Social Psychology, Vol. 85 No. 2, pp. 373-82.
Lattin, J.M. (1987), “A model of balances choice behavior”, Marketing Science, Vol. 6 No. 1,pp. 48-65.
Lattin, J.M. and McAlister, L. (1985), “Using a variety-seeking model to identify substitute andcomplementary relationships among competing products”, Journal of Marketing Research,Vol. 22, pp. 330-9.
Leuba, C. (1955), “Toward some integration of learning theories: the concept of optimumstimulation”, Psychological Reports, Vol. 1, pp. 27-33.
Lilja, D.J. (2000), Measuring Computer Performance: A Practitioner’s Guide, CambridgeUniversity Press, New York, NY.
McAlister, L. and Pessemier, E. (1982), “Variety seeking behavior: an interdisciplinary review”,Journal of Consumer Research, Vol. 9 No. 3, pp. 311-22.
McDaniel, S.R. and Mahan, J.E. (2008), “An examination of the ImpSS scale as a valid and reliablealternative to the SSS-V in optimum stimulation level research”, Personality and IndividualDifferences, Vol. 44 No. 7, pp. 1528-38.
Maimaran, M. and Wheeler, S.C. (2008), “Circles, squares and choices: the effect of shape arrays onuniqueness and variety seeking”, Journal of Marketing Research, Vol. 45 No. 6, pp. 731-40.
Meixner, O. (2005), “Variety Seeking Behavior – ein kausales Erklarungsmodell zumMarkenwechselverhalten der Konsumenten im Lebensmittelbereich”, in Wytrzens, H.K.(Ed.), Agrarokonomie zwischen Vision und Realitat, Jahrbuch der OGA, Band 10,Osterreichische Gesellschaft fur Agrarokonomie, Vienna, pp. 47-56.
Menon, S. and Kahn, B.E. (1995), “The impact of context on variety seeking in product choices”,Journal of Consumer Research, Vol. 22, pp. 285-95.
Mitchell, V.-W. and Walsh, G. (2004), “Gender differences in German consumer decision-makingstyles”, Journal of Consumer Behaviour, Vol. 3 No. 4, pp. 331-46.
Nicklaus, S., Boggio, V., Chabanet, C. and Issanchou, S. (2005), “A prospective study of foodvariety seeking in childhood, adolescence and early adult life”, Appetite, Vol. 44 No. 3,pp. 289-97.
Novak, D.L. and Mather, M. (2007), “Aging and variety seeking”, Psychology and Aging, Vol. 22No. 4, pp. 728-37.
Papatla, P. and Krishnamurthi, L. (1992), “A probit model of choice dynamics”, MarketingScience, Vol. 11 No. 2, pp. 189-206.
Pasedag, S. (2009), “Variety-seeking-behavior im Anbieter- und Nachfragerverhaltnis: Darstellungdes state-of-the-art”, diploma thesis, Ernst-Moritz-Arndt-Universitat, Greifswald.
Raju, P.S. (1980), “Optimum stimulation level: its relationship to personality, demographics, andexploratory behavior”, Journal of Consumer Research, Vol. 7, pp. 272-82.
Ratner, R.K., Kahn, B.E. and Kahneman, D. (1999), “Choosing less-preferred experiences for thesake of variety”, Journal of Consumer Research, Vol. 26 No. 1, pp. 1-15.
Roehm, H.A.J. and Roehm, M.L. (2004), “Variety-seeking and time of day: why leader brandshope young adults shop in the afternoon, but follower brands hope for morning”,Marketing Letters, Vol. 15 No. 4, pp. 213-21.
Sharp, B. (2010), How Brands Grow: What Marketers Don’t Know, Oxford University PressAustralia, Melbourne.
Model ofvariety-seeking
behaviour
1585
Simonson, I. (1990), “The effect of purchase quantity and timing on variety-seeking behavior”,Journal of Marketing Research, Vol. 27 No. 2, pp. 150-62.
Simonson, I. and Winer, R.S. (1992), “The influence o purchase quantity and display format onconsumer preference for variety”, Journal of Consumer Research, Vol. 19, pp. 133-8.
Steenkamp, J.-B.E.M. and Baumgartner, H. (1992), “The role of optimum stimulation level inexploratory consumer behavior”, Journal of Consumer Research, Vol. 19 No. 3, pp. 434-48.
Tang, E.P.Y. and Chin, I.O.K. (2007), “Analysing variety seeking behavior using panel data”,Journal of International Consumer Marketing, Vol. 19 No. 4, pp. 7-31.
Tscheulin, D.K. and Helmig, B. (2007), “Markentreue, Wiederkauf- und Wechselverhalten”,in Albers, S. and Herrmann, A. (Eds), Produktmanagement, 1st ed., Gabler, Wiesbaden.
van Trijp, H.C.M. and Steenkamp, J.-B.E.M. (1990), “An investigation into the validity ofmeasures for variation in consumption used in economics and marketing”, EuropeanReview of Agricultural Economics, Vol. 17 No. 1, pp. 19-41.
van Trijp, H.C.M. and Steenkamp, J.-B.E.M. (1992), “Consumers’ variety seeking tendency withrespect to foods: measurement and managerial implications”, European Review ofAgricultural Economics, Vol. 19 No. 2, pp. 181-95.
van Trijp, H.C.M., Hoyer, W.D. and Inman, J.J. (1996), “Why switch? Product category-levelexplanation for true variety seeking behavior”, Journal of Marketing Research, Vol. 33No. 3, pp. 281-92.
Zuckerman, M. (1994), Behavioral Expressions and Biosocial Bases of Sensation Seeking,Cambridge University Press, Cambridge.
Zuckerman, M., Kolin, E.A., Price, L. and Zoob, I. (1964), “Development of a sensation-seekingscale”, Journal of Consulting Psychology, Vol. 28 No. 6, pp. 477-82.
About the authorsProfessor Oliver Meixner is a graduate of the University of Economics, Vienna. He was awardeda Doctorate in 1998 for his research about consumer behaviour, and his Habilitation (veniadocendi ) in Business Administration in 2004. He is Associate Professor at the Institute ofMarketing and Innovation, Department of Economic and Social Sciences. He is reviewer for IMAJournal of Management Mathematics, European Journal of Operations Research, AppliedEconomics, Journal on Food System Dynamics, Austrian Journal of Agricultural Research, and theAustrian Society of Agricultural Economics. He has published as author, co-author or editorseveral books and a large number of articles. He is a member of the European Association ofAgricultural Economists, the American Marketing Association, and the Austrian Society forOperations Research. Since 2007 he has been a Scientific Advisor for the International EuropeanForum on System Dynamics and Innovation in Bonn, Germany, and since 2010 he has been aMember of the Scientific Board of the International Symposium on the Analytic HierarchyProcess. His research focus is on consumer behaviour and new product development in theagricultural and food value chain, decision making (with special emphasis on the analytichierarchy process), management in the agricultural and food value chain (specific focus oncorporate social responsibility and sustainability), and trust and risk in B2B relationships in thefood value chain. Oliver Meixner is the corresponding author and can be contacted at:[email protected]
Viktoria Knoll is project staff at the University of Natural Resources and Life SciencesVienna. Her research focuses on consumer behaviour, with a special emphasis on variety seekingbehaviour.
BFJ114,11
1586
To purchase reprints of this article please e-mail: [email protected] visit our web site for further details: www.emeraldinsight.com/reprints