Embed Size (px)
Citation preview

i
AN EXAMINATION OF THE RELATIONSHIP BETWEEN FINANCIAL
MANAGEMENT PRACTICES AND STOCK RETURNS OF LISTED COMPANIES
IN THE NAIROBI SECURITIES EXCHANGE
BY
KEPHAR KURIA GACHUCHA
REG.NO:D63/75744/2012
A RESEARCH PROJECT SUBMITTED IN PARTIAL FULFILMENT OF THE
REQUIREMENTS FOR THE AWARD OF MASTER OF SCIENCE IN FINANCE,
SCHOOL OF BUSINESS, UNIVERSITY OF NAIROBI
OCTOBER 2014

ii
DECLARATION
This research project is my original work and has not been presented to any other institution
or examination whatsoever
………………………………… ……………………………..
Kephar Kuria Gachucha. Date
D63/75744/2012
This research project is presented with the approval of my supervisor
…………………………… ………………
Dr. Josiah Aduda. Date
Dean School of Business
University of Nairobi

iii
DEDICATION
The project is solely dedicated to my parents for their relentless effort to ensure i attain the
best education at the prevailing conditions.

iv
ACKNOWLEDGEMENT
I wish to express my sincere gratitude and appreciation to my supervisor Dr. Josiah Aduda
for his valued assistance, guidance and contribution towards the success of this research.
I thank my colleagues for their encouragement and motivation .Besides, owe thanks to my
family for their encouragement and financial support that enabled this work to be
accomplished.
Above all, thanks to Almighty God for the good health, knowledge and grace that has been
sufficient during my study.

v
TABLE OF CONTENTS
Declaration……………………………………………………………………….……..ii
Dedication………………………………………………………………………………iii
Acknowledgement……………………………………………………………….… …..iv
Abstract………………………………………………………………………… ….…..x
List of abbreviations …………………………………………………………...……...viii
List of tables………………………………………………………………………...….ix
CHAPTER ONE
1.0 Introduction………………………………………………….……………….…….1
1.1Background to the study…………………………….…………………………..…..1
1.1.1Financial Management Practices…….…………….………………………...……2
1.1.2 Stock Returns………………………………………..………………………....…4
1.1.3 Financial Management Practices and Stock Returns………………..…….……...5
1.1.4 Nairobi Securities Exchange………………………………………….…….....….5
1.2 Research Problem………………………………………..……………………..…..7
1.3 Objectives of the study………………………………………..………………...…..8
1.3.1 General objectives………………………………………………………...8
1.3.2 Specific objectives……………………………………………….........….8
1.4 Value of the study………………………………...…………………….……….…9
CHAPTER TWO
2.1 Introduction………………………………………………………………..….…...10
2.2 Review of Theories………………………………………………………….……...10
2.2.1 Portfolio Theory……………………………………………………………….…10
2.2.2 Capital Markets Theory………………………………………………..…………11
2.2.3 Efficient Markets Hypothesis………………………………………………….….12

vi
2.3 Empirical Studies………………………………………………………….……….13
2.4 Financial Management Practices………………….…………………..……….……16
2.4.1 Investment Decisions………………………………………….…………….…….16
2.4.2 Financing Decisions……………………………………………………..…..……17
2.4.3 Dividend Policies……………………………………………….…………..….…19
2.4.4 Liquidity Management………………………………………………….………...19
2.5 Determinants of Stock Returns…………………………………..……………....…20
2.6 Chapter Summary…………………………………………………………………..21
CHAPTER THREE
3.0 Research Methodology……………………………………………….……....……23
3.1 Introduction…………………………………………………………………….…..23
3.2 Research Design……………………………………………………………………23
3.3 Target Population……………………………………………………….……..…...23
3.4 Sample Design…...……………………………………………………….….....…..24
3.4.1 Sample Frame………………………………………………………….…..……..24
3.4.2 Sample Technique………………………………….………………….….….…..24
3.5 Data Collection Instruments and Procedures………………………..….……..…...24
3.6 Data Analysis…………………………………………………………….……..…..24
3.7 Data validity and Reliability…………………………………………..……..….….25
CHAPTER FOUR
4.1Introduction…………..……………………………………………………....……26
4.2 Data Presentation………………………………………………………….…..…..26
4.2.1 Return on Investment………………………………………………………...….26
4.2.2 Dividend per Share…………………………………………………….………..26

vii
4.2.3 Debt/Equity ratio………………………….…………………………….….…...27
4.2.4 Current Ratio…………………………………………………………..………..27
4.2.5 Stock Returns…………….…………………………………………..………….27
4.3 Summary and Interpretation of Findings………………………………….………31
CHAPTER FIVE
5.1 Summary…………..……………………………………………….………...…...32
5.2 Conclusions………………………………………………..………………….…..33
5.3 Policy Recommendations…………….……………………….………..……...….34
5.4 Limitations of the study………………..………………………….………..….…35
5.5 Suggestions for further studies………...…………………………….……...….…35
References…………………………………………………………………....……….36 Appendices
Appendix I………………………………………………Listed firms as at 31.12.2013
Appendix II…………………………………………………….…Data in a Spreadsheet

viii
LIST OF ABBREVIATIONS
ANOVA-Analysis of Variance
APT-Arbitrage pricing Model
CAPM-Capital Assets Pricing Model
CMA-Capital Market Authority
Current ratio-Current assets/Current liabilities
D/E ratio-Debt/Equity ratio
EMH- Efficient market hypothesis
DPS-Dividend per share
IOU-I owe you
NSE-Nairobi Securities Exchange
ROI-Return on Investment
ROA-Return on Assets

ix
LIST OF TABLES
Pearson correlations………………………………………………………………….22
Results of Variance Inflation Factor (VIF)………………………………………..…22
Results of Coefficients of Multiple Linear Regression (B) between the all the independent
variables together and between the dependent variable (Y)…………………. ………23
Testing Using F Table………………………………………………………………...30

x
ABSTRACT
This study aims at identifying the relationship between financial management practices which are and stock returns of listed companies in Nairobi Securities Exchange. To achieve the study’s objectives, the researchers reviewed the annual reports of the public companies listed in Nairobi Securities Exchange, and also reviewed the Nairobi Securities Exchange’s statistical bulletins for the years 2008-2012 to get the accounting variables and the stocks’ closing prices. The study consisted of (61) listed companies as at 31 December 2012. The study concluded that financial management practices (investing decisions, Dividend policies, financing activities and the liquidity management) explained (64.80%) of the volatility in stock return while (35.20%) of the volatility in stock returns referred to other reasons. The results of the study also showed that there was an important strong positive correlation between dividend per share (76.40%), Current ratio (39.10%), Return on investment (18.90%) and weak positive correlation with debt/equity ratio (3.10%) and volatility in stock returns. The researcher recommended that a further research be conducted to establish other factors explaining the volatility in stock returns in the Nairobi Stock Exchange and other jurisdictions.
1
CHAPTER ONE
INTRODUCTION
1.1 Background to the study
Financial management is that managerial activity which is concerned with the planning and
controlling of the firm’s financial resources. Practicing managers are interested in this subject
because among the crucial decisions of the firm are those which relate to finance
.Understanding of the theory of financial management provides finance managers with
conceptual and analytical insights to make decisions skillfully(Pandey,2004).
Study on the relationship between organizational performance and financial management
practices like capital structure decision, dividend policy, investment appraisal techniques,
working capital management and financial performance assessment in Pakistani corporate
sector depicted a positive and significant relationship between financial management
practices and organizational performance in Pakistani corporate sector (Butt et al, 2010).
Myres (1984) asserts that capital structure has a greater impact on the economic systems and
managers should identify the ideal corporate structure of the company (pinegar, 1989). Li
(2001) pointed that enterprise's capital structure reflected the power base of corporate
governance subject; reasonable capital structure can decide the performance of the
enterprise's management and effectiveness of company's governance to an extent.
The value of dividend decision is critical (Modigliani, 1961) and believes that without market
imperfections like transaction costs and taxes, dividend policy could bring no changes to the
value of the firm. This has given rise to unstoppable discussions on the dividend policy and
value of the firm (Black, 1976).Financing strategies and investments moves by the firm result
in the performance of any firm. Whenever a firm focuses on the maximization of

2
shareholders’ wealth, always get proper care of its financing and investments (Mc Connel and
Servaes, 1990).
Working capital policy is primarily based on a day to day cash inflows and outflows, thus
managing the surplus and interest rates. Companies should find out coordination between
cash inflows and cash outflows to reduce potential liquidity problems and to have backup
credit support for the adjustment of short term adjustments (Butt et al, 2010).
The study review the core finance functions and outlines capital structure decision, dividend
policy, investment appraisal techniques, working capital as the most common financial
management practices in Kenya corporate sector.
1.1.1 Financial Management Practices
The financial management’s practices are classified into four main functions:
Investment decision or capital budgeting involves the decision of allocation of capital or
commitment of funds to long-term assets that would yield benefits in the future. Finance
theory asserts that only investments with positive Net present Value should be under taken
only regardless of whether internal or external funds are used to finance the investments
(Myers and Majluf, 1984).
The financial manager must strive to obtain the best financing mix or the optimum capital
structure for his or her firm. The firm’s capital structure is considered to be optimum when
the market value of shares is maximized. The use of debt affects the return and risk of
shareholders; it may increase the return on equity funds but it always increases risk. A proper
balance will have to be struck between return and risk. When the shareholders’ return is
maximized with minimum risk, the market value per share will be maximized and the firm’s
capital structure would be considered optimum. Once the financial manager is able to

3
determine the best combination of debt and equity, he or she must raise the appropriate
amount through the best available sources. In practice, a firm considers many other factors
such as control, flexibility loan convenience, legal aspects etc. in deciding its capital structure
(Pandey, 2004).
The financial manager must decide whether the firm should distribute all profits, or retain
them, or distribute a portion and retain the balance. Like the debt policy, the dividend policy
should be determined in terms of its impact on the shareholders’ value. The optimum
dividend policy is one that maximizes the market value of the firm’s shares. The financial
manager should also consider the questions of dividend stability, bonus shares and cash
dividends in practice. Most profitable companies pay cash dividends regularly. Periodically,
additional shares, called bonus share (or stock dividend), are also issued to the existing
shareholders in addition to the cash dividend.
A conflict exists between profitability and liquidity while managing current assets. If the firm
does not invest sufficient funds in current assets, it may become illiquid. But it would lose
profitability, as idle current assets would not earn anything. Thus, a proper trade-off must be
achieved between profitability and liquidity. In order to ensure that neither insufficient nor
unnecessary funds are invested in current assets, the financial manager should develop sound
techniques of managing current assets. Finance functions may affect the size, growth,
profitability and risk of the firm, and ultimately, the value of the firm. The function of
financial management is to review and control decisions to commit or recommit funds to new
or ongoing uses. Thus, in addition to raising funds, financial management is directly
concerned with production, marketing and other functions, within an enterprise whenever
decisions are about the acquisition or distribution of assets (Solomon, 1969).

4
1.1.2 Stock Returns
This refers to the price the share is fetching at the Nairobi Securities Exchange. Stock return
is the appreciation in the price (capital gain) plus any dividends yield. The market price per
share is also called the intrinsic value of a share of stock or the actual value based on the
actual variables taken from the company's financial statements. The current trading price is
based on investor buying and selling behavior. If investors are paying more than the intrinsic
value, then the stock is overvalued. If investors are paying less than the intrinsic, then the
stock is undervalued and is a good buy. Empirical study conducted by O’Hara (2000) has
proven that stock returns are directly related to the earnings of the firm as well as to the
dividends declared by the firm (www.nse.com).
The stock return is determined by demand and supply of shares .As shares of a particular
company increases in capital gains and profits many investors will be willing to invest in the
company, where the company will have more confidence and issues more shares in order to
raise more capital. It therefore issues its share at a higher price while various investors will
engage in buying shares (www.nse.com).
When the political stability of a country is conducive it creates confidence of the investors
according to Nairobi Stock exchange survey conducted during 1992, 1997, 2002 and 2007
showed that the price of shares is very low during Elections periods .This has negative effects
as both foreign and domestic investors are not willing to invest as the uncertainty of the
future of the country (www.nse.com).

5
1.1.3 Financial Management Practices and Stock Returns
Walter (1963) has asserted that the choice of dividend policy affect the value of the firm and
thus financial management policies should be made with proper caution so as to maximize
shareholder’s wealth.
The study on the changes in stock returns as predictors of accounting earnings implied a
correlation between the events that affect accounting earnings and changes in stock returns
(Kamuruci, 2003). Further a research on the relationship between financial variables and
stock returns, case study of Iran Khodro’s company (A listed firm in Iran Stock Exchange)
concluded that there was a positive relationship between (EPS) and stock price, a negative
relationship between Dividends per Share (DPS) and Iran Khodro’s stock returns and a
negative relationship between Price to Earnings ratio and stock price (Hossein et al, 2012).
1.1.4 The Nairobi Securities Exchange
The stock market is a market, which deals in the exchange of shares of publicly quoted
companies, and government, corporate and municipal bonds among other instruments. The
Nairobi Stock Exchange, which was formed in 1954 as a voluntary organization of
stockbrokers, is now one of the most active markets in Africa. As a capital market institution,
the Stock Exchange plays an important role in the process of economic development: It helps
mobilize domestic savings thereby bringing about reallocation of financial resources from
dormant to active agents. Long-term investments are made liquid, as the transfer of securities
(shares and bonds) among the participating public is facilitated, The Exchange has also
enabled companies to engage local participation in their shares ownership thereby giving
Kenyans a chance to own shares of reputable firms, Companies can also raise extra finance
essential for expansion and development. To raise funds, a company (issuer) issues extra
shares; an issuer publishes a prospectus, which gives all pertinent details about the operations
and future prospects of a company, while at the same time stating the price per share of the

6
issue also enhances the inflow of international capital and facilitate government’s
privatization programmes.
Shares are financial instrument where one acquires ownership stakes of a company. Returns
are neither fixed nor guaranteed one acquires voting rights and benefits from exceptional
performance. Bonds on the other hand are financial instruments that serve as an IOU; an
investor loans an issuer, and returns are fixed and guaranteed, no voting rights and no
benefits from exceptional performance by a company. One can acquire shares or bonds in the
primary market (when the company is issuing them) or in the secondary market (which is
more common) –by buying from an investor who has bought them. Much of what is
predominant at the Nairobi stock exchange is the latter. When one buys a share he/she owns a
fraction of the company; while when ones buy a bond he/she becomes a creditor of the
company. While the shareholder is allocated a fraction of the profits in terms of dividends,
bond holders will be paid a percentage interest on their bond value in agreed interval until the
bond reaches maturity when the principal will also be paid back by the company.
When selecting a company to invest in, one should make sure the company is in a strong
industry, and/or that it is strong or growing. There are many different methods to enable wise
investment these include: Fundamental analysis; which study the company's current
management and position in the market. Technical analysis which is totally based on charts,
identify trends in the company and invest accordingly. Investor’s look for the following when
selecting securities: reason for which they are investing in securities; state of management in
the company. The Board of Directors and other key management personnel in the company
ought to be people of repute to run the company honestly and successfully, to be considered
also is the nature of the product dealt in and its market share.
7
The marketability/liquidity of the shares/bonds is another important consideration. One has to
find out whether the shares from a particular company can readily be sold or bought. There
are some slow-moving shares and there are some fast-selling ones too. There is hardly a point
for an investor to hold shares which cannot sell should it become necessary to dispose them
off. Other considerations will be the company's trading partners both local and abroad,
competitors and possible changes in people's life styles. A good company to invest in is one,
which shows signs of progress and readiness to meet rowing future demand. Hence, the
company's development and expansion programmes should be looked into. If a company has
the capacity for future growth, then it is a good company to invest in.
1.2 Research Problem
It is expected that sound financial management practices: optimal capital structure and
dividend policies, viable investments and proper liquidity level, will culminate to profitability
of the company and ultimately affect share movements at the bourse. Walter’s Model asserts
that choice of dividend policy affect the value of the firm (Walter, 1963). Capital Assets
Pricing Model Capital implies that share prices reflect all available information and
individual investors are not able to affect the prices of securities (Sharpe et al, 2004).
According to the random walk hypothesis, stock market prices evolve according to a random
walk and thus cannot be predicted in any model. Musee (2013) asserts that accounting
variables (Gross Profit Margin, Return on assets, Asset Turnover) could not explain stock
returns because all public information was reflected in a semi-strong efficient market.
A study on the effects of accounting variables on profitability and stock returns of firms listed
at NSE depicted a positive relationship between accounting variables and stock returns
(Ngunze, 2013) and further a research on fundamental accounting variables and stock returns
showed a positive relationship (Mwangi, 2007).

8
Various researches done by Sasa (2013) on the relationship between capital structure and
stock prices volatility at the Nairobi Securities Exchange, Muriuki (2010) study on the
relationship between dividends policies and share prices for companies listed at the Nairobi
Securities Exchange, Kihara (2011) study on the relationship between dividend
announcements and return on investments: a case study of companies quoted at the Nairobi
Securities Exchange, Mwangi (1999) study on whether P/E ratio was an investment
performance indicator on listed companies in the Nairobi Securities Exchange and lastly the
study on the trading behavior and its effect on stock prices movements at Nairobi Securities
Exchange (Mburu, 2007) looked on separate function of financial management in isolation of
the other function thus no single research have combined all the major functions (investing,
financing, liquidity and capital functions).
From the literature above, most of the research paper has dealt with a single function of
financial management and stock returns. It’s apparent that a research on relationship between
financial management practices and stock returns need to be carried out to cover all major
functions of financial management and thus fill the gap.
1.3 Objectives of the study
1.3.1 General objective
To determine relationship between financial management practices and stock returns of listed
companies in Nairobi Securities Exchange.
1.3.2 Specific objectives
The objective of the research is to determine the following:
(a) To establish the relationship between working capital management (liquidity) and
stock returns of the firms

9
(b) To establish relationship between dividend policies and stock returns.
(c) To determine the relationship between investment decisions and stock returns of listed
companies.
(d) To determine the relationship between the financing decisions and stock returns of
listed firms.
1.4 Value of the study
The outcome of the research will be beneficial to management of the listed companies to
evaluate financial management policies in order to achieve better stock returns and create
wealth for shareholders.
It’s believed research findings will enable existing investors evaluate their portfolios. The
research will be a yardstick for future researches relating to financial management practices
of companies listed in Nairobi Securities Exchange.
Research finding will assist directors of the listed companies when evaluating company’s
investment and thus sanction viable projects to the benefits of the shareholders. Besides, the
study will aid formulation of fiscal policies especially capital gains tax.

10
CHAPTER TWO
LITERATURE REVIEW
2.1 Introduction
The chapter analyses theoretical and empirical studies to the study of the relationship
between financial management practices and the stock returns of listed firms at Nairobi
Securities Exchange.
2.2 Review of Theories.
2.2.1 Portfolio Theory
A portfolio is a bundle or a combination of individual assets or securities. The portfolio
theory provides a normative approach to investors to make decisions when investing in assets
or securities at risk. Portfolio suggests that investors can limit volatility of their portfolio
while improving its performance by spreading the risk among different type of securities that
do not behave in the same way. It is based on the assumption that investors are risk averse.
This implies that investors hold well diversified portfolios instead of investing their entire
wealth in a single or a few assets.
Portfolio theory asserts that if investors hold well diversified assets their main concern is the
expected rate of return and the risk of portfolio rather than individual assets and the
contribution of individual asset to the portfolio and assumption that returns of assets are
normally distributed. This means that the expected value and variance or standard deviation
analysis is the foundation of the portfolio decisions. Further, portfolio is extended to device
models (Capital Assets Pricing Model and Arbitrage Pricing Model) for valuing risky assets.
All the efficient portfolios which represent the highest level of return in a given level of risk
are chosen to form the portfolio (Markoviz, 1959).A single asset portfolio is considered to be
efficient if no other asset or portfolio of assets offers higher expected returns with the same
11
(lower) risk or lower (or higher) expected returns(Brown & Riley,2009)
2.2.2 Capital Markets Theory
The capital markets theory builds on the portfolio theory in that it extends by developing a
model for pricing all risky assets. The capital market theory depends on existence of risk free
assets which in turn leads to the designation of market portfolio (Brown & Riley, 2009)
Market portfolio combines riskless and risky assets to form a portfolio. Risk is measured by
the beta co-efficient which calculates the level of systematic risk compared to that of the
market. The relationship between the expected return and beta is the Capital Assets Pricing
Model (Sharpe et al, 2004).
Capital market theory assume: market efficiency -which implies that share prices reflect all
available information and individual investors are not able to affect the prices of securities
this means there are large numbers of investors holding small amount of wealth. Investors are
risk averse and mean –variance optimization, investors evaluate security’s return and risk in
terms of the expected return and variance optimizers and they form efficient portfolio.
Investors have homogeneous expectations and decisions are based on a single time period.
Meaning investors have same expectations about the expected returns and risky of securities.
In addition can lend and borrow at a risk free rate of interest and form portfolios from
publicly traded securities like shares and bond
The CAPM is not able to account for the difference in assets’ return using he beta, this paved
way for the development of an alternative approach.APT does not assume investors employ
mean-variance analysis for their investment decisions. In CAPM beta is considered important
in capturing the systematic risk of the assets whereas the latter uses other industry-specific
and macro economics factors that affect security returns (Ross, 1976).
12
2.2.3 The Efficient Market Hypothesis (EMH)
The efficient market hypothesis (EMH) maintains that all stocks are perfectly priced
according to their inherent investment properties, the knowledge of which all market
participants possess equally. At first glance, it may be easy to see a number of deficiencies in
the efficient market theory, EMH assumes, first the efficient market hypothesis assumes that
all investors perceive all available information in precisely the same manner. The numerous
methods for analyzing and valuing stocks pose some problems for the validity of the EMH. If
one investor looks for undervalued market opportunities while another investor evaluates a
stock on the basis of its growth potential, these two investors will already have arrived at a
different assessment of the stock’s fair market value. Therefore, one argument against the
EMH points out that, since investors’ value stocks differently, it is impossible to ascertain
what a stock should be worth under an efficient market.
Under the efficient market hypothesis, no single investor is ever able to attain greater
profitability than another with the same amount of invested funds: their equal possession of
information means they can only achieve identical returns. But consider the wide range
of investment returns attained by the entire universe of investors, investment funds and so
forth. If no investor had any clear advantage over another, would there be a range of yearly
returns in the mutual fund industry from significant losses to 50% profits, or more?
According to the EMH, if one investor is profitable, it means the entire universe of investors
is profitable. In reality, this is not necessarily the case.
Strong efficiency states that all information in a market, whether public or private, is
accounted for in a stock price and insider information could not give an investor an
advantage, Semi-strong efficiency implies that all public information is calculated into a
stock's current share price. Neither fundamental nor technical analysis can be used to achieve

13
superior gains and Weak efficiency implies that all past prices of a stock are reflected in
today's stock price. Therefore, technical analysis cannot be used to predict and beat a market
(Fama, 1991).
2.3 Empirical Studies
The study by Kamuruci (2003) on the changes in share prices as predictors of accounting
earnings implied a correlation between the events that affect accounting earnings and changes
in stock prices. He noted that years the earnings were positive, the stock prices were positive
and vice versa.
Musee (2013) study on the effects accounting variables on profitability and stock returns of
firms listed at NSE established that the accounting variables explained the profitability and
had positive relationship with profitability. Lee Chin and Lee Weng Hong (2008) analysis of
dividend yield as predictor of stock return concluded that dividend yield was able to predict
stock return in the Malaysian stock market.
Nyamai (2012) study on the effects of cash management and firm’s liquidity on share prices
of companies listed at the NSE concluded that liquidity has a positive influence on share
performance. He recommended further research since liquidity influenced 4.6% of total
variations in share performance thus the need for further research to analyze other variables
that affected the share performance. The study on the trading behavior and its effect on stock
prices movements at NSE indicated that trading volumes do not play significance in driving
stock prices (Mburu, 2007).
Sasa (2013) examined the relationship between capital structure and stock prices volatility at
the Nairobi Stock Exchange and noted that debt-equity ratio had a positive impact on the
stock prices. Muriuki (2010) study on the relationship between dividends policies and share
prices for companies listed at the NSE concluded that dividend policies had great effects on

14
the share prices and thus such policies should be implemented with great caution so as to
avoid dilution of shareholders’ wealth.
Karani (2009) analyzed the debt –equity ratio and expected common stock returns: Empirical
evidence from NSE noted that there was no relationship found explaining the relationship
between expected stock returns and the debt-equity ratio in the capital market. Maina(2009)
study on the empirical investigation of stock returns reaction around earnings announcement
for quoted companies at NSE showed that stock returns and trading activity react to earnings
announcements.
Kihara (2011) study on the relationship between dividend announcements and return on
investments: a case study of companies quoted at the NSE found that there is no strong
evidence that stock prices react significantly on the announcement of dividend. Also, noted a
positive correlation between cash flows and the earnings. Odongo (2008) investigated the
effects of liquidity level on stock returns at the NSE found no evidence to link share prices to
liquidity of the firms listed. Mwangi (1999) tested whether P/E ratio was an investment
performance indicator and concluded that P/E ratio had a positive relationship to Earning
growth and thus a viable tool to improve portfolios.
A study on impact of selected financial variables on share price of publicly listed firms in the
Philippines concluded that EPS has a strong positive impact on share price. In short, he
disregarded the possible effect of short-term changes in share price and EPS itself. If we were
to predict share price given the model, we could assume that for every percentage change in
EPS, there would be an average increase in share price by about 1.431%.As for ROA, for
every percentage increase of the said variable, share price would decrease by an average of
0.178%. Return on Assets (ROA) is negatively correlated with share price. At first glance,
this might be extraordinary because a high ROA would mean higher profitability of the firm.
15
It is a common notion that if the firm is profitable, its share price would increase. Based on
past studies, however, it has been documented that there is a strong negative relationship
between asset growth and the firm’s stock return (Cooper, et al, 2009). This simply means
that the growth in assets will not necessarily lead to increase in net income. And if net income
remains unchanged but assets increase, ROA decreases. The result of this study may not be
appropriate for prediction because it used one year data only. To make a good prediction on
share price, a longer period of time is needed in order to capture fully its volatile nature.
What this study had accomplished was to confirm that EPS have significant impact on share
price. ROA, if ever used, would be a weak negative predictor and may be replaced with other
appropriate financial or economic variables. They recommended that if financial statements
are to be used in the research, the yearly data should be used instead of quarterly or monthly
data but for a longer period of time. A ten-year data should prove adequate. One advantage of
yearly data is that financial statement errors are very much minimized in annual financial
statements because they are subject to audit. This also makes the data less volatile and more
reliable (Placido, 2012).
The analysis of the impact of financial variables on stock prices on Tehran Stock Exchange
companies tested three hypotheses. The first hypothesis examines the effect of ROI on the
stock price, most researchers in their research concluded that there is a significant positive
relationship between these two variables and in this study, the results of the regression model
showed that in 95% confidence level there is a significant relationship between ROI and
stock price, this relationship is positive. The second hypothesis, the study examined the effect
of gross margin of profit on stock price. In the study, statistical tests based on regression
model indicate that there is no significant relationship between gross profit margin and stock
price. The third hypothesis of this research is based on sales volume and stock price is
accepted. Most studies that have examined the relationship between this variables, have

16
reached the significant negative relationship between these two variables. Also the results of
the regression model showed that in 95% confidence level there is a significant relationship
between sales volume and market risk, this relationship is negative. According to the results,
it seems that the stock price of the companies listed in Tehran Stock Exchange is a function
of ROI and sales volume, indeed ROI, and sales volume, play an important role in stock
price. But Gross profit margin does not influence the stock price.
They recommended the research be done internationally since the population chosen was
from Iran Stock Exchange to obtain more reliable results. The period of this study was years
between 2005 -2009, therefore it was suggested that this research performed in different years
and since the study was performed generally without differentiation between different
industries. It is recommended that the research done to discriminate between different
industries (Hossein et al, 2012).
2.4 Financial Management Practices
Financial management is that managerial activity which is concerned with the planning and
controlling of the firm’s financial resources.
2.4.1 Investment Decisions
Investment decision or capital budgeting involves the decision of allocation of capital or
commitment of funds to long-term assets that would yield benefits in the future. Two
important aspects of the investment decision are: evaluation of the prospective profitability of
new investments, and measurement of a cut-off rate against that the prospective return of new
investments could be compared.
Future benefits of investments are difficult to measure and cannot be predicted with certainty.
Because of the uncertain future, investment decisions involve risk. Investment proposals
17
should, therefore, be evaluated in terms of both expected return and risk. Besides the decision
for investment managers do see where to commit funds when an asset becomes less
productive or non-profitable. There is a broad agreement that the correct cut-off rate is the
required rate of return or the opportunity cost of capital. However, there are problems in
computing the opportunity cost of capital in practice from the available data and information.
A decision maker should be aware of capital in practice from the available data and
information. A decision maker should be aware of these problems (Pandey, 2004).
Investments moves by the firm result in the performance of any firm. Whenever a firm
focuses on the maximization of shareholders’ wealth, always get proper care of its financing
and investments (Mc Connel and Servaes, 1990).
2.4.2 Financing Decisions
Business financing method is the specific form of enterprise raising funds. Divided into three
categories according to different criteria: internal source of financing and external source of
financing, direct financing and indirect financing, and equity financing and debt financing.
Internal source of financing is the funds generated from company's operating activities,
namely transforming their own savings (including retained earnings, depreciation and fixed
liabilities) into investment. With features of being original, autonomous, low cost and risk
resistant for capital formation of enterprises, it is essential for the survival and development
of an enterprise and external source of financing is enterprises raising money from some
other economic entities (Xiya, 2011).
There are many influencing factors on financing decisions. From a large perspective, there
are national factors, macroeconomic factors, industry factors and firm characteristics factors.

18
We focus on the firm characteristics factors and its relationship with the financial leverage.
On the whole, firm characteristic factors include asset composition and uniqueness.
Asset composition: capital structure theory argues that the security of tangible assets can
reduce the agency costs of debt to a certain extent. In terms of pecking order theory,
companies with fewer intangible assets are more sensitive to information asymmetry, and
when in need of external financing, these companies will issue debt rather than equity.
Therefore, tangible assets and leverage are positively related.
Uniqueness: According to stakeholder theory, in companies producing unique products,
customers, suppliers and workers suffer from higher costs, and customer service
replacements are more difficult to find. in line with agency costs, the search for employees
who do popular work are expected to cost less than the search for that who implement
dedicated work. Therefore, when other conditions are equal, the agency costs related to
humans are higher for the companies providing specialized products and services.
Uniqueness should be negatively related with leverage (Xiya, 2011).
The mix of debt and equity is known as the firm’s capital structure. The financial manager
must strive to obtain the best financing mix or the optimum capital structure for his or her
firm. The firm’s capital structure is considered to be optimum when the market value of
shares is maximized. The use of debt affects the return and risk of shareholders; it may
increase the return on equity funds but it always increases risk. A proper balance will have to
be struck between return and risk. When the shareholders’ return is maximized with
minimum risk, the market value per share will be maximized and the firm’s capital structure
would be considered optimum (Pandey, 2004).Myres (1984) asserts that capital structure has
a greater impact on the economic systems and managers should identify the ideal corporate
structure of the company (Pinegar, 1989).
19
2.4.3 Dividend Decisions
The financial manager must decide whether the firm should distribute all profits, or retain
them, or distribute a portion and retain the balance. Like the debt policy, the dividend policy
should be determined in terms of its impact on the shareholders’ value. The optimum
dividend policy is one that maximizes the market value of the firm’s shares. Thus if
shareholders are not indifferent to the firm’s dividend policy, the financial manager must
determine the optimum dividend – payout ratio. The payout ratio is equal to the percentage of
dividends to earnings available to shareholders. The financial manager should also consider
the questions of dividend stability, bonus shares and cash dividends in practice. Most
profitable companies pay cash dividends regularly. Periodically, additional shares, called
bonus share (or stock dividend), are also issued to the existing shareholders in addition to the
cash dividend (Pandey, 2004).
The value of dividend decision is critical (Modigliani, 1961) and believes that without market
imperfections like transaction costs and taxes, dividend policy could bring no changes to the
value of the firm. This has given rise to unstoppable discussions on the dividend policy and
value of the firm (Black, 1976).
2.4.4 Liquidity Decisions
Current assets management that affects a firm’s liquidity is yet another important finances
function, in addition to the management of long-term assets. Current assets should be
managed efficiently for safeguarding the firm against the dangers of illiquidity and
insolvency. Investment in current assets affects the firm’s profitability.
Chordia,Sarkar and Subrahmanyam(2002) found that improvements in stock market liquidity
are associated with monetary expansions and that fluctuations in liquidity are correlated
across stocks and bond markets .Eisfeldt (2002) developed a model that endogenous

20
fluctuations are correlated with real fundamentals such as productivity and investments.
Lustig (2001) developed a model in which solvency constraints give rise to liquidity risk
factor.
A conflict exists between profitability and liquidity while managing current assets. If the firm
does not invest sufficient funds in current assets, it may become illiquid. But it would lose
profitability, as idle current assets would not earn anything. Thus, a proper trade-off must be
achieved between profitability and liquidity. In order to ensure that neither insufficient nor
unnecessary funds are invested in current assets, the financial manager should develop sound
techniques of managing current assets. He or she should estimate firm’s needs for current
assets and make sure that funds would be made available when needed. It would thus be clear
that financial decisions directly concern the firm’s decision to acquire or dispose off assets
and require commitment or recommitment of funds on a continuous basis.
It is in this context that finance functions are said to influence production, marketing and
other functions of the firm. This, in consequence, finance functions may affect the size,
growth, profitability and risk of the firm, and ultimately, the value of the firm
(Pandey, 2004).
2.5 Determinants of Stock Returns
The stock returns is determined by demand and supply of shares .As shares of a particular
company increases in capital gains and profits many investor will be willing to invest in the
company, where the company will have more confidence and it issues more shares in order to
raise more capital. It therefore issues its share at a higher price while various investors will
engage in buying shares. As a result of company price share and the number of shares bought
by investors determines the e equilibrium price of share
21
When the political stability of a country is conducive it creates confidence of the investors
according to Nairobi Stock exchange survey conducted during 1992, 1997, 2002 and 2007
showed that the price of shares is very low during Elections periods .This has negative effects
as both foreign and domestic investors are not willing to invest as the uncertainty of the
future of the country. Many businesses tends to collapse during elections or when the country
is experiencing tension as no investors is willing to risk in loss generating ventures.
As the investors goals are to increase gains and profit from their investments they speculate
the chances of a company ability to expand its operations in the global in order to increase
their profitability. A company with the probability to gain in future its shares have high
demand while a company with low capability to expand its share experiences low demand
hence lower stock returns of its company .Ability of a company to expand creates confidence
of an investor.
2.6 Chapter Summary
The chapter has reviewed the underlying theories (Portfolio theory, Capital markets theory
and Efficient Market Hypothesis), past studies in the field of financial management, major
finance functions (investing, financing ,liquidity and dividend decisions) and determinants of
stock returns.
From the literature review it’s apparent that the empirical studies done on the NSE have been
based on a single facet of financial management practices :Nyamai (2012) study on the
effects of cash management and firm’s liquidity on share prices of companies listed at the
Nairobi Securities Exchange, Sasa (2013) study on relationship between capital structure and
stock prices volatility at the Nairobi Stock Exchange, Muriuki (2010) study on the
relationship between dividends policies and share prices for companies listed at the NSE,

22
Karani (2009) analysing the debt –equity ratio and expected common stock returns: Empirical
evidence from NSE , Maina(2009) study on the empirical investigation of stock returns
reaction around earnings announcement for quoted companies at NSE, Kihara (2011) study
on the relationship between dividend announcements and return on investments: a case study
of companies quoted at the NSE , Odongo (2008) study on the effects of liquidity level on
stock returns at the NSE and Mwangi (1999) study on whether P/E ratio was an investment
performance indicator .
The research on the relationship between financial management practices and stock returns
will cover all major facets of the financial management and will result in multivariate models
which will be more reliable than univariate models and feasible to predict stock returns.

23
CHAPTER THREE
RESEARCH METHODOLOGY
3.1 Introduction
This study aims at determining the relationship between financial management practices and
stock returns of listed companies at the Nairobi Securities Exchange. The chapter outlines the
research methodology that was used to carry out the study. This includes: the study design,
population, data collection methods, research procedures, data analysis and presentation
methods and chapter summary.
3.2 Research Design
The research problem posed was studied using descriptive design (standard deviation,
variance, ANOVA, correlation and other statistics). secondary data was obtained from listed
companies’ financial statements and Nairobi Securities Exchange financial bulletins for the
years 2008-2012. The measurements for financial management practices were represented by
Dividend per Share, Return on Investment, Debt-Equity ratio and liquidity ratios. A sample
was selected from 61 listed companies using stratified sampling and simple random where
companies were classified as per the services offered i.e. telecommunication and technology,
manufacturing and allied, investment, insurance, banking, automobiles and accessories,
commercial and services, agricultural, energy and petroleum, construction and allied. 29
companies were selected for analysis after qualify the following criteria: complete set of five
years data and ease of computation of the above measurements. Banking and insurance firms
were excluded due to the fact that computations of liquidity ratios proved futile.
3.3 Target Population
Population refers to the total collection of elements about which we wish to make some
inferences (Cooper &Schindler, 2003).A large set of observation is called a population while
24
a smaller set is called the sample. If the population is extremely large, a sample is often
examined to make conclusions about the large population (Hayer, 1997).The target
population were 61 listed companies in Kenya as at 31 December 2013.
3.4 Sample Design
3.4.1 Sample Frame
Cooper and Schindler (2003) define a sample as a list of elements from which the sample is
actually drawn and is closely related to the population. The sample frame was drawn from the
list of listed companies as at 31 December 2013.
3.4.2 Sampling Technique
The sampling technique used was stratified and simple random sampling. The sample was
obtained from each category stratified as per the services offered.
3.5 Data Collection Instruments and Procedures
Data collection involves quantitative data from listed companies’ financial statements and
Nairobi Securities Exchange bulletins for the years 2008-2012. The data is validated for
accuracy, completeness and reliability. A sample on 29 listed companies will be analyzed
except firms with incomplete data, banks and insurance companies were impossible to obtain
current ratio.
3.6 Data Analysis
Data was analyzed using the statistical package for social sciences (SPSS) software to give
descriptive statistics needed such as standard deviation, variance, ANOVA, correlation and
other statistics. The data will be presented by using tables, charts and figures.

25
The regression model used
y = β0 + β1x1 + β2x2 + β3x3 + β4x4 + u
Y-stock returns represented by dividend yield and capital gain
X1 -denotes the ROI representing investing activities=PBT/Investment
X2- denotes the dividend per share representing dividend policies
X3 -denotes the Debt/Equity ratio representing financing decisions
X4-denotes the current ratio representing liquidity decisions
u - denotes the error term
β0, β1, β2, β3 and β4-beta coefficients
3.7 Data Validity and Reliability.
Mugenda and Mugenda (2003) asserted that, the accuracy of data largely depend on the data
collection instruments in terms of validity and reliability.
Validity as noted by Robinson (2002) is the degree to which result obtained from analysis of
the data actually represents the phenomenon under study. Validity was achieved by having
objective data and pre-testing a sample of the information used.
Reliability on the other hand refers to a measure of the degree to which research instruments
yield consistent results (Mugenda & Mugenda, 2003).In this study reliability was achieved by
selecting a sample and testing it for accuracy from data from respective company website.

26
CHAPTER FOUR
DATA ANALYSIS AND PRESENTATION OF FINDINGS
4.1 Introduction
4.2 Data Presentation
The data was analyzed using spreadsheet (attached in the appendix II).
Return on investment = Profit before tax and extraordinary events
--------------------------------------------------
Investment t1-Investment t0
Dividend per share = Profit after Tax
--------------------
No. of Ordinary Shareholders
Debt/Equity ratio = Long term borrowings
-------------------------
Share capital +Revenue reserves
Current ratio = Current Assets
--------------------
Current Liabilities
4.2.1 Return on investment
The data for the year 2008-2012 was calculated as follows
=Profit before tax and extraordinary events/ (investment t1-investment t0)
4.2.2 Dividend per share
The dividend paid in the year 2008-2012 was analyzed in a spread sheet (Appendix II).
27
4.2.3 Debt/Equity ratio
The long term borrowing was divided by the Equity capital for the year 2008-2012
4.2.4 Current ratio
This data was analyzed by dividing Current Assets/Current liabilities for the year 2008-2012
4.2.5 Stock returns
The stock return for the 2008-2012 was analyzed in a spread sheet (Appendix II).
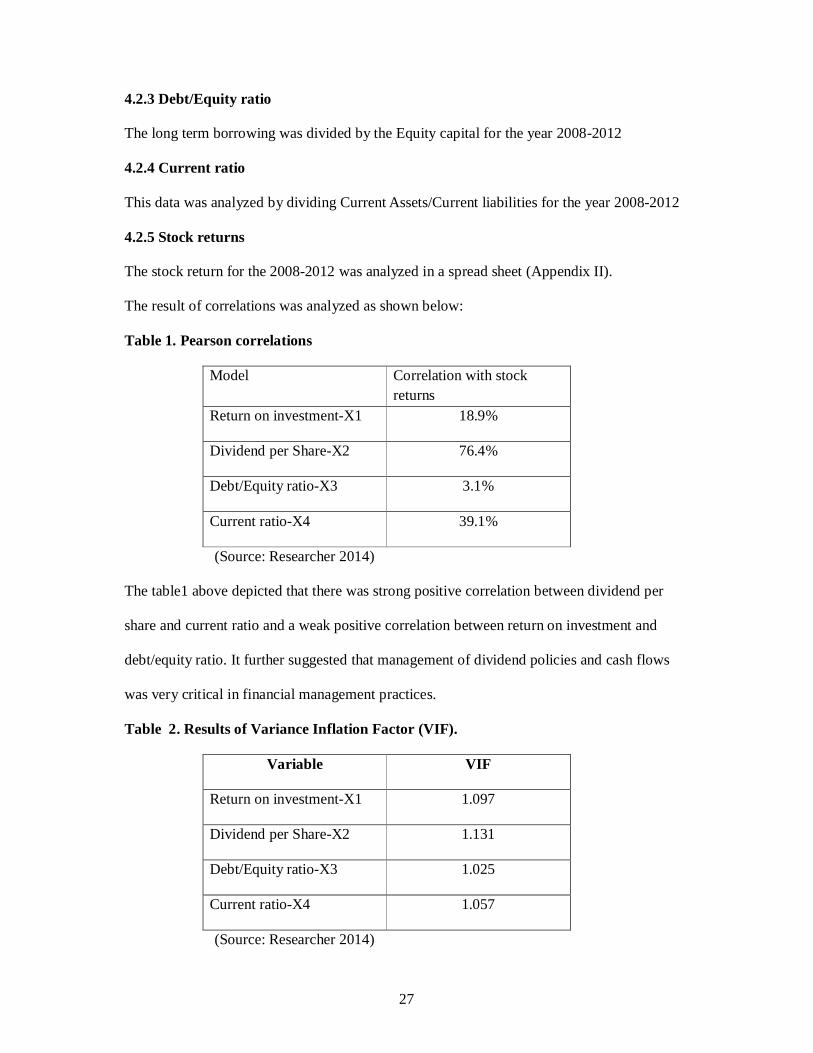
The result of correlations was analyzed as shown below:
Table 1. Pearson correlations
Model Correlation with stock returns
Return on investment-X1 18.9%
Dividend per Share-X2 76.4%
Debt/Equity ratio-X3 3.1%
Current ratio-X4 39.1%
(Source: Researcher 2014)
The table1 above depicted that there was strong positive correlation between dividend per
share and current ratio and a weak positive correlation between return on investment and
debt/equity ratio. It further suggested that management of dividend policies and cash flows
was very critical in financial management practices.
Table 2. Results of Variance Inflation Factor (VIF).
Variable VIF
Return on investment-X1 1.097
Dividend per Share-X2 1.131
Debt/Equity ratio-X3 1.025
Current ratio-X4 1.057
(Source: Researcher 2014)

28
To check lack of multicollinearity problems between the variables, results of Variance
Inflation Factor (VIF) test was used and criterion was if the sample of the study is small and
the value of VIF equals 10 or more, this means that there is a multicollinearity problem
between the independent variables of the study whereas if the sample of the study is large and
the value of VIF equals 5 or more, this indicates a multicollinearity problem between the
independent variables (Sekaran and Bougie, 2009).
Table (2) showed that the values of the independent variables were less than 5 and therefore it
indicated lack of multicollinearity between the independent variables.
Table 3: Results of Coefficients of Multiple Linear Regression (B) between the all the
independent variables together and between the dependent variable (Y)
Model Un standardized
Coefficients
Standardized
Coefficients
t Sig. B Std. Error Beta
Constant 5.367 10.729 0.500 0.618
x1-ROI -0.117 0.186 -0.040 -0.629 0.531
x2-DPS 12.780 1.124 0.732 11.369 0.000
x3-Debt/Equity 22.743 11.868 0.118 1.916 0.058
x4-Current ratio 9.678 2.204 0.273 4.390 0.000
a. Dependent Variable: y
(Source: Researcher 2014)
29
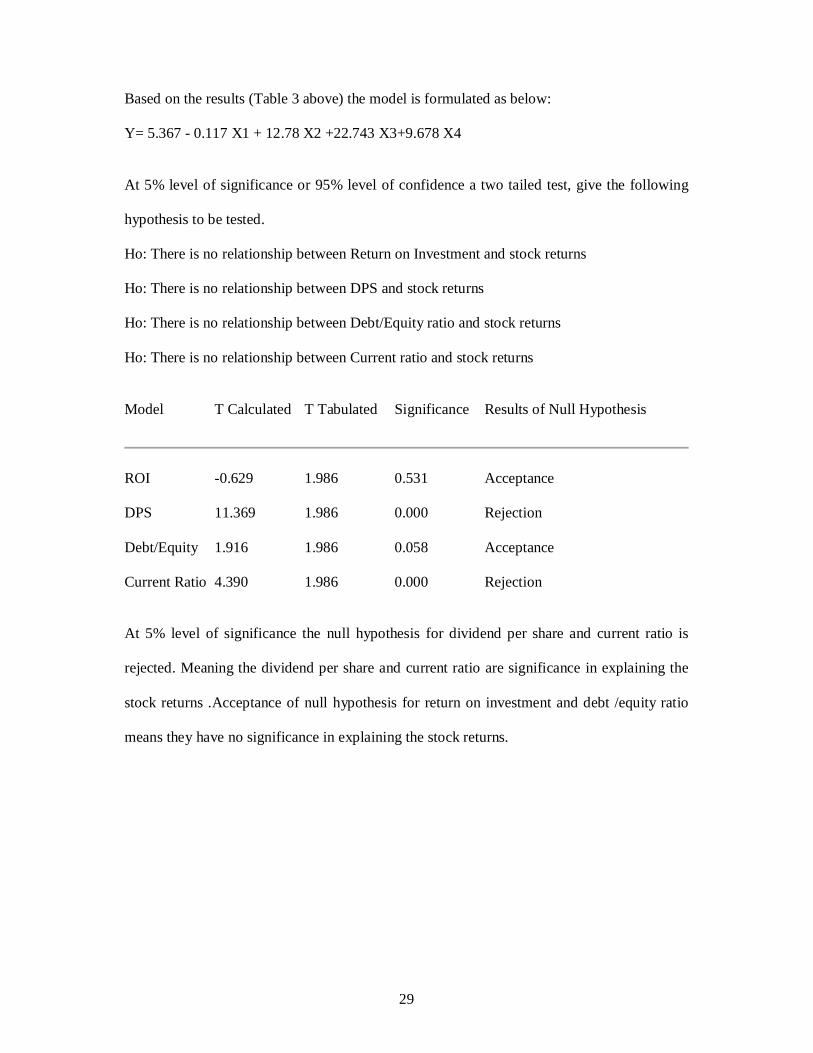
Based on the results (Table 3 above) the model is formulated as below:
Y= 5.367 - 0.117 X1 + 12.78 X2 +22.743 X3+9.678 X4
At 5% level of significance or 95% level of confidence a two tailed test, give the following
hypothesis to be tested.
Ho: There is no relationship between Return on Investment and stock returns
Ho: There is no relationship between DPS and stock returns
Ho: There is no relationship between Debt/Equity ratio and stock returns
Ho: There is no relationship between Current ratio and stock returns
Model T Calculated T Tabulated Significance Results of Null Hypothesis
ROI -0.629 1.986 0.531 Acceptance
DPS 11.369 1.986 0.000 Rejection
Debt/Equity 1.916 1.986 0.058 Acceptance
Current Ratio 4.390 1.986 0.000 Rejection
At 5% level of significance the null hypothesis for dividend per share and current ratio is
rejected. Meaning the dividend per share and current ratio are significance in explaining the
stock returns .Acceptance of null hypothesis for return on investment and debt /equity ratio
means they have no significance in explaining the stock returns.

30
Table 4: Testing Using F Table Model Sum of
Squares
Degrees of
freedom
Mean
Square F Sig.
Regression 648157.844 4 162039.46 45.148 .000a
Residual 330192.733 92 3589.05
Total 978350.577 96
a. Predictors: (Constant), x4, x1, x3, x2)
b. Dependent Variable: y
(Source: Researcher 2014)
At 5% level of significance or 95% level of confidence the following hypothesis is tested.
Ho: There is no relationship between financial management practices and stock returns.
HA: There is relationship between financial management practices and stock returns.
F Calculated F Tabulated Significance Results of Null Hypothesis R R(squared)
45.15 2.47 0.000 Rejection 0.814 0.663
The F critical at 5% level of significance was 2.47. Since F calculated (value=45.148) is
greater than the F critical (value = 2.47), this shows that the overall model was significant in
explaining the stock returns.
31
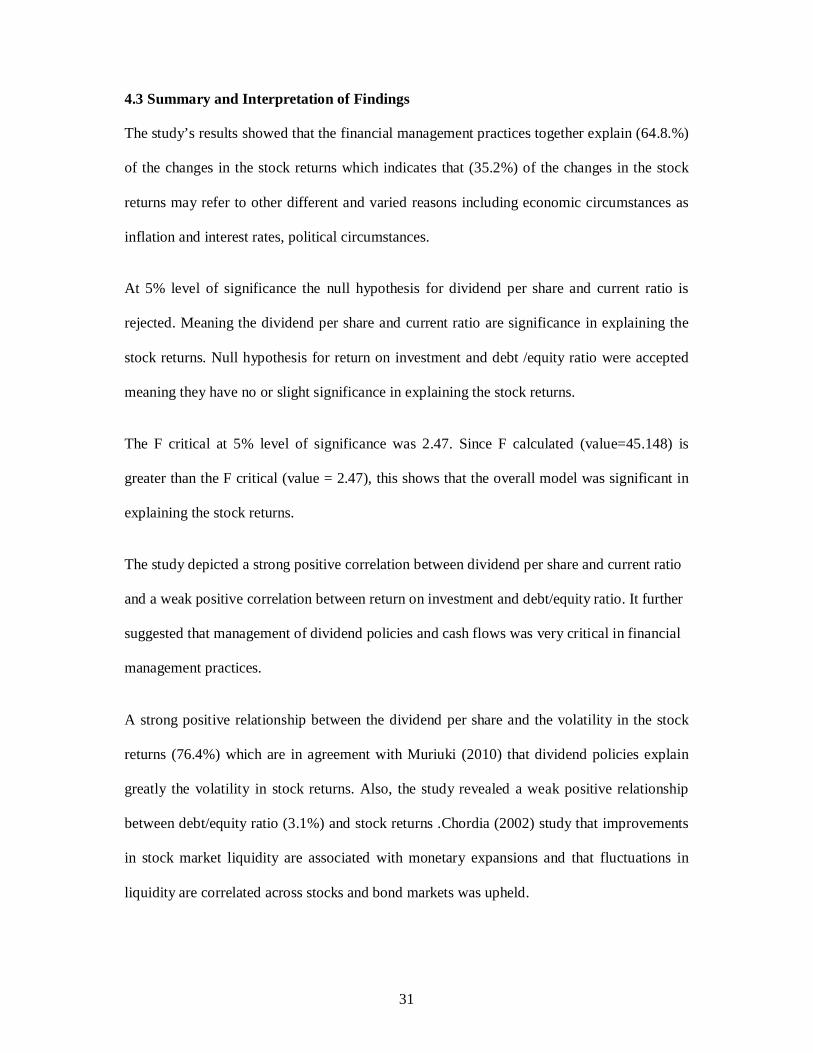
4.3 Summary and Interpretation of Findings
The study’s results showed that the financial management practices together explain (64.8.%)
of the changes in the stock returns which indicates that (35.2%) of the changes in the stock
returns may refer to other different and varied reasons including economic circumstances as
inflation and interest rates, political circumstances.
At 5% level of significance the null hypothesis for dividend per share and current ratio is
rejected. Meaning the dividend per share and current ratio are significance in explaining the
stock returns. Null hypothesis for return on investment and debt /equity ratio were accepted
meaning they have no or slight significance in explaining the stock returns.
The F critical at 5% level of significance was 2.47. Since F calculated (value=45.148) is
greater than the F critical (value = 2.47), this shows that the overall model was significant in
explaining the stock returns.
The study depicted a strong positive correlation between dividend per share and current ratio
and a weak positive correlation between return on investment and debt/equity ratio. It further
suggested that management of dividend policies and cash flows was very critical in financial
management practices.
A strong positive relationship between the dividend per share and the volatility in the stock
returns (76.4%) which are in agreement with Muriuki (2010) that dividend policies explain
greatly the volatility in stock returns. Also, the study revealed a weak positive relationship
between debt/equity ratio (3.1%) and stock returns .Chordia (2002) study that improvements
in stock market liquidity are associated with monetary expansions and that fluctuations in
liquidity are correlated across stocks and bond markets was upheld.

32
CHAPTER FIVE
SUMMARY, CONCLUSIONS AND RECOMMENDATIONS
5.1 Summary
This study aims at identifying the relationship between financial management practices which
are (Return on investment, Dividend per Share, Debt/Equity ratio and the current ratio) and
stock returns of listed companies in Nairobi Securities Exchange during the years 2008 to
2012. To achieve the study’s objectives, the researchers reviewed the annual reports of the
public companies listed in Nairobi Securities Exchange, and also reviewed the Nairobi
Securities Exchange’s statistical bulletins for the years 2008-2012 to get the accounting
variables and the stocks’ closing prices. The study consisted of (61) listed companies as at 31
December 2012.
Multiple regression model was used to test the independent variables’ ability in explaining
the variance in the dependent variable (Volatility in stock returns).The study concluded that
financial management practices (Return on investment, Dividend per Share, Debt/Equity ratio
and the current ratio) explained (64.80%) of the volatility in stock return while (35.20%) of
the volatility in stock returns referred to other reasons.
The results of the study also showed that there was an important strong positive correlation
between Dividend per Share (76.40%), Current ratio (39.10%), Return on investment
(18.90%) and weak positive correlation with Debt/Equity ratio (3.10%) and volatility in stock
returns.
The dividend per share and current ratio was found to be significant in explaining the stock
returns. Return on investment and debt /equity ratio was found to have no significance in
explaining the stock returns.
33
5.2 Conclusions
The study concludes that dividend per share is highly correlated with stock returns thus
management should take caution when deciding the optimal dividend policy for the company.
The management should endeavor to relay positive signals to the market so as to create
wealth for the shareholders.
The study further concludes that dividend per share and current ratio was found to be
significant in explaining the stock returns. Dividend policy is the set of guidelines a company
uses to decide how much of its earnings it will pay out to shareholders. There are three main
approaches to dividends: residual, stability or a hybrid of the two: Residual dividend policy, Companies choose to rely on internally generated equity to finance
any new projects. As a result, dividend payments can come out of the residual or leftover
equity only after all project capital requirements are met.
Dividend Stability Policy: With the stability policy, quarterly dividends are set at a fraction of
yearly earnings. This policy reduces uncertainty for investors and provides them with income.
Hybrid dividend policies indicate residual and stable dividend policies are combined.
The firm should strive to set optimal dividend policy which will maximize the share returns
and reduce share volatility.
The current ratio is an indication of a firm's market liquidity and ability to meet creditor's
demands. Acceptable current ratios must be maintained always .If a company's current ratio
is in this range (1.5 and above), then it generally indicate good short-term financial strength.
If current liabilities exceed current assets (the current ratio is below 1), then the company
may have problems meeting its short-term obligations. If the current ratio is too high, then the
company may not be efficiently using its current assets or its short-term financing facilities.
This may also indicate problems in working capital management.

34
Return on investment and debt /equity ratio was found to have no/slight significance in
explaining the stock returns and management should put their priorities right in financial
management. Finally the study concludes that financial management practices explained
(64.80%) of volatility and further research be carried out to obtain the reasons behind 35.2%
volatility.
5.3 Policy Recommendations
The researcher suggests the following recommendations that may minimize the stock returns
volatility and help the stock market dealers to identify factors that explain the price volatility
in Nairobi Securities Exchange. Prevention and limitation of monopoly’s phenomenon of
information which Nairobi Securities Exchange received and which are controlled by some
specific groups and people leading to unusual and immoral gains causing imbalance in the
financial market.
Increase the investors’ awareness through increasing the ability of the financial analysis and
linking between the variables that affect the stock return and to find the causes for this.
Supporting the transparency and equal opportunities by making the information available to
everyone who would like to deal with the financial market Conducting further studies
concerning volatility of stock returns taking into account other variables that are expected to
affect the changes of the stock returns in other jurisdiction and at different periods of time
The institute of certified public accountants of Kenya should ensure accountants are trained
through mandatory continuous practice education to ensure accountants produce
internationally acceptable financial reports and thus ease sharing of information.
It’s highly recommendable that International Financial reporting standards be implemented in
full to all listed companies in Kenya. Introduction of IFRS will make it possible to bench
mark performance of the local companies and international best performing companies.

35
5.4 Limitation of the study
The accuracy of the data obtained could not be ascertained as it was assumed data obtained
from Nairobi securities exchange was genuine and free of errors. However, data was
corroborated with available data in the websites of the various companies.
It was impossible to calculate measurements for current ratio for all listed banks and
insurance industries. This was due to the fact that it’s impossible to delineate between current
assets and current liabilities. Some listed companies such as Home Africa and Olympia
Capital Holdings ltd had been listed for less than five years thus could not be included in the
analysis. The funding for the research was limited thus a smaller period of timing (five years)
was analyzed.
5.5 Suggestion for further studies
Researcher suggest further studies concerning volatility of stock returns taking into account
other factors that are expected to affect the volatility of the stock returns. The only stock
exchange in this study population was Nairobi Securities Exchange. While taking stock of
foreign countries and provides the possibility to compare results obtained from the Stock
Exchange of countries studied, the more reliable the results will. It is recommended that
research be done internationally as well. The period of this study is the years between 2008 -
2012, therefore it is suggested that this research performed in different years. The study
performed generally without differentiation between different industries. It is recommended
that the research done to discriminate between different industries. The study should be
conducted to non listed companies so as to augment the credibility of the models produced
when analyzing listed companies.

36
REFERENCES
Archer,S.M .,& D’Ambrosio: SA,(1966).Business finance :theory and practice ,Macmillan,
Chapter 1
Butt, B., Ahmed, I., & Rehman, K. (2010): Financial management practices and their impact
on organizational performance. Published in: World Applied Sciences Journal, Vol.
9, No. 9 (2010): pp. 997-1002
Black,F.(1976).The dividend puzzle . Portfolio management journal 2:72-77.
Chin, L. & Lee W. H. (2008).Can financial ratios predict the Malaysian stock return?
Integration and dissemination.
Chordia,T.,Roll.R.,& Subrahmanyam.A.(2000).Commonality in liquidity. Journal of
Financial Economics 56:3-28
Dall, K., & Brown, P. (1968). An empirical evaluation of accounting numbers. Journal of
accounting research, autumn. pp159-129.
Eisfeldt,A.I.(2002).Endogenous liquidity in asset markets. Working
paper.Evanston,III,Northwestern University.
Fama, E. F. (1991). .Efficient capital market: II, Journal of Finance, 46, pp.1575-617
Gordon, M. J. (1962). The investment, financing and valuation of corporation
American International Journal of Contemporary Research Vol. 2 No. 9; September
2012,102 2
Hossein, R. D. A, Saeed F., & Mahmoud A. (2012).The impact of financial variables on

37
stock prices of Tehran Stock Exchange companies. Interdisciplinary journal of
contemporary research in business research (March 2012),Vol 3, no 11.
James, C.T. (1969). Quantitative analysis of financial decisions. Macmillan, p.4
Kamuruci, B. (2003).Changes in share prices as predictors of accounting earnings.
Unpublished MBA project, University of Nairobi
Karani , P.K.(2009).Debt-Equity ratio and expected common stock returns : Empirical
evidence from NSE. Unpublished MBA project, University of Nairobi.
Kihara,D.G.(2011).The relationship between dividends announcements and return on
investments: case study of companies quoted at Nairobi Securities Exchange.
Unpublished MBA project, University of Nairobi.
Linter, J. (1965). The valuation of risky assets and the selection of risky investments in Stock
portfolio and capital budgets, Review of Economics and statistics, vol.47, pp.425-45
Lustig,H.(2001).The market price of aggregate:Risk and the wealth distribution.Working
paper .Stanford,Calif :Stanford University
Li, W.(2001). Modern corporate governance. China renmin,University press.
Maina,J.(2009).An empirical investigation of stock returns reaction around earnings
announcements for quoted companies at Nairobi Securities Exchange.
Unpublished MBA project,University of Nairobi.
Mc Connel,J., &Servaes,H.(1990).Additional evidence on equity ownership and valuation
: An emphirical analysis. Financial economics journal 20:293-315
38
Mugenda,O.M., & Mugenda,A.G.(2003).Research methods: Quantitative and qualitative
approaches. Acts press. Nairobi.
Muriuki,P.M.(2010).Relationship between dividend policies and share prices for companies
quoted at the Nairobi Securities Exchange. Unpublished MBA Project, University of
Nairobi
Markoviz, H. H., & John W. (1959).Portfolio selection: Efficient diversification of
Investments
Modigliani,F.,& Miller,M.(1961).Dividend policy, growth and the valuation of shares.
Journal of business 34:411-433
Mwangi, P.N. (1999).Testing whether P/E ratio is an indicator of investment performance of
ordinary shares on the stock exchange. Unpublished MBA project, University of
Nairobi.
Musee, G. N. (2013).Effects of accounting variables on profitability and stock returns of
Firms listed at the Nairobi Stock Exchange. Unpublished Msc Finance
project,University of Nairobi
Mwangi, M. P. (2007). Fundamental accounting variables and stock return: Evidence from
Nairobi Stock Exchange. Unpublished MBA Project, University of Nairobi
Myers,S.C. & Majluf, N.S.(1984).Stock issues and investment policy when firms have
Information that investors do not have. Financial economics journal 2:187-221
NSE hand book, 2007 & 2013.Published by Nairobi Securities Exchange
Nyamai, C. N. (2012). The effects of cash management and firm’s liquidity on share prices of

39
companies listed at the Nairobi Securities Exchange. Unpublished MBA project,
University of Nairobi
Odongo, P.W. (2008).The effects of liquidity level on stock returns: The Nairobi Securities
Exchange evidence. Unpublished MBA project, University of Nairobi.
O’Hara, T., Lazdowski, C., Moldovean, C., & Samuelson, S. (2000). Financial indicators of
stock performance. West Haven: American Business Review
Pandey, I. M. (2004). Financial management. Ninth edition. New Delhi: Vikas publishing.pp
1-5
Placido, M. M. (2012). Impact of selected financial variables on share price of publicly listed
firms in the Philippines. American international journal of contemporary research
(September 2012), Vol. 2 No. 9
Pinegar,J.& Wilbrincht, L.(1989).What managers think of capital structure theory. Financial
Management 18:82-91.
Robichek, A, (1967).Financial research and management decision, John Willy, p.6.
Ross, R. A. (1976). The Arbitrage Theory of capital Asset Pricing, journal of economic
Theory, vol.13, No.3
Robinson, S. (2002). Research methodology. National Academies press. Washington DC.
Sasa, A.M.(2013).The relationship between capital structure and stock price volatility at the
Nairobi Securities Exchange. Unpublished MBA project, University of Nairobi.
Solomon, E. (1969). The theory of financial management. Columbia university press, p.3

40
Sekaran.U. & Bougie R. (2011). Research Methods’ For Business .A skill-Buil ding
approach, Fifth edition, John Wiley and sons Inc.
Schindler, P.S., & Cooper D, R.(2003). Business research methods. Eighth edition, McGraw
Hill
Sharpe, W.F. (1964). Capital Assets Prices: a theory of market equilibrium under Conditions
of risk, journal of finance, vol.19, pp 425-42
Walter, J. E. (1963). Dividend policy: its influence on the value of the value of Enterprise.
Journal of finance, p 280-291
Xiya, L. (2011).Study on the financing methods of China's listed companies. 3rd
International Conference on Information and Financial Engineering. IPEDR vol.12.
IACSIT Press, Singapore

41
APPENDIX I
LISTED COMPANIES AS AT 31 DECEMBER 2013
Construction and allied
1. Athi River Mining
2. Bamburi Cement Ltd
3. Crown Berger Ltd
4. E.A.Cables Ltd
Energy and petroleum
5. KenolKobil Ltd
6. Total Kenya Ltd
7. KenGen Ltd
Agricultural
8. Kapchorua Tea Co. Ltd
9. Kakuzi
10. Limuru Tea Co. Ltd
11. Rea Vipingo Plantations Ltd
12. Sasini Ltd
13. Williamson Tea Kenya Ltd
Commercial and services
14. Express Ltd
15. Kenya Airways Ltd
16. Nation Media Group
17. Standard Group Ltd
18. TPS Eastern Africa (Serena) Ltd

42
19. Scangroup Ltd
Telecommunication and Technology
20. Safaricom Ltd
21. Access kenya
Automobiles and Accessories
22. Marshalls (E.A.) Ltd
Investment
23. Centum Investment Co Ltd
Manufacturing and Allied
24. B.O.C Kenya Ltd
25. British American Tobacco Kenya Ltd
26. Carbacid Investments Ltd
27. East African Breweries Ltd
28. Mumias Sugar Co. Ltd
29. Unga Group Ltd
43
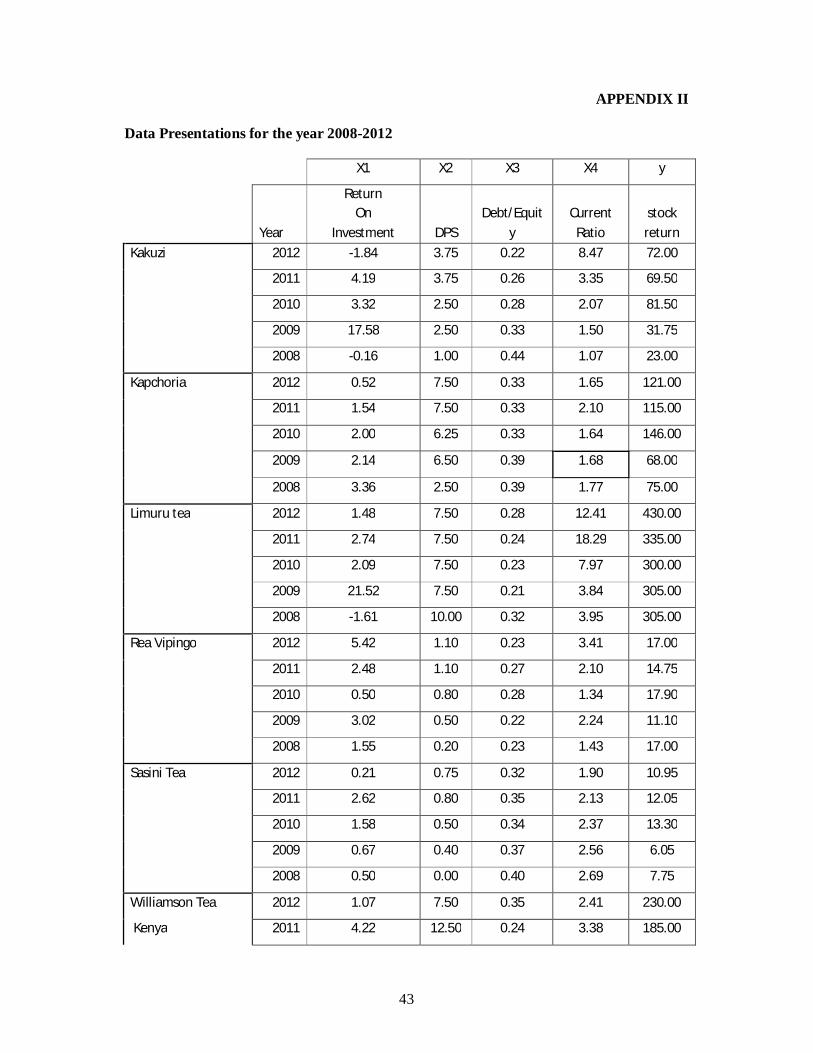
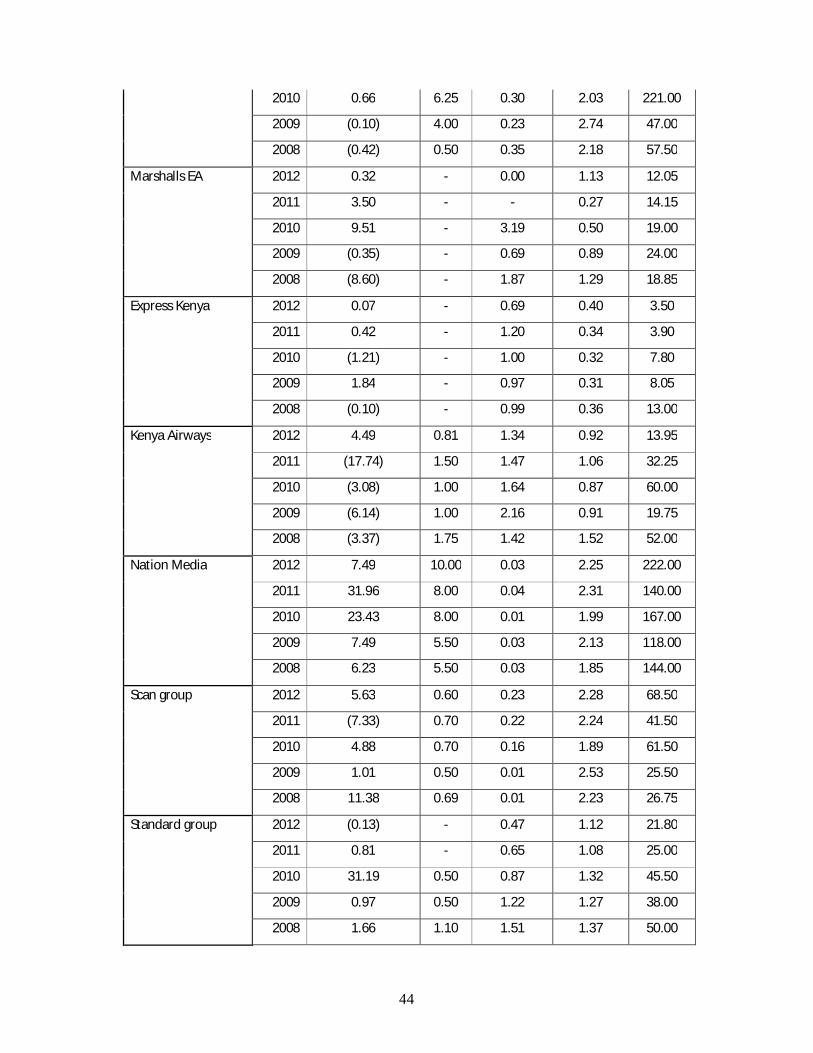
APPENDIX II
Data Presentations for the year 2008-2012
X1 X2 X3 X4 y
Year
Return On
Investment DPS Debt/Equit
y Current
Ratio stock
return Kakuzi 2012 -1.84 3.75 0.22 8.47 72.00
2011 4.19 3.75 0.26 3.35 69.50
2010 3.32 2.50 0.28 2.07 81.50
2009 17.58 2.50 0.33 1.50 31.75
2008 -0.16 1.00 0.44 1.07 23.00
Kapchoria 2012 0.52 7.50 0.33 1.65 121.00
2011 1.54 7.50 0.33 2.10 115.00
2010 2.00 6.25 0.33 1.64 146.00
2009 2.14 6.50 0.39 1.68 68.00
2008 3.36 2.50 0.39 1.77 75.00
Limuru tea 2012 1.48 7.50 0.28 12.41 430.00
2011 2.74 7.50 0.24 18.29 335.00
2010 2.09 7.50 0.23 7.97 300.00
2009 21.52 7.50 0.21 3.84 305.00
2008 -1.61 10.00 0.32 3.95 305.00
Rea Vipingo 2012 5.42 1.10 0.23 3.41 17.00
2011 2.48 1.10 0.27 2.10 14.75
2010 0.50 0.80 0.28 1.34 17.90
2009 3.02 0.50 0.22 2.24 11.10
2008 1.55 0.20 0.23 1.43 17.00
Sasini Tea 2012 0.21 0.75 0.32 1.90 10.95
2011 2.62 0.80 0.35 2.13 12.05
2010 1.58 0.50 0.34 2.37 13.30
2009 0.67 0.40 0.37 2.56 6.05
2008 0.50 0.00 0.40 2.69 7.75
Williamson Tea 2012 1.07 7.50 0.35 2.41 230.00
Kenya 2011 4.22 12.50 0.24 3.38 185.00
44
2010 0.66 6.25 0.30 2.03 221.00
2009 (0.10) 4.00 0.23 2.74 47.00
2008 (0.42) 0.50 0.35 2.18 57.50
Marshalls EA 2012 0.32 - 0.00 1.13 12.05
2011 3.50 - - 0.27 14.15
2010 9.51 - 3.19 0.50 19.00
2009 (0.35) - 0.69 0.89 24.00
2008 (8.60) - 1.87 1.29 18.85
Express Kenya 2012 0.07 - 0.69 0.40 3.50
2011 0.42 - 1.20 0.34 3.90
2010 (1.21) - 1.00 0.32 7.80
2009 1.84 - 0.97 0.31 8.05
2008 (0.10) - 0.99 0.36 13.00
Kenya Airways 2012 4.49 0.81 1.34 0.92 13.95
2011 (17.74) 1.50 1.47 1.06 32.25
2010 (3.08) 1.00 1.64 0.87 60.00
2009 (6.14) 1.00 2.16 0.91 19.75
2008 (3.37) 1.75 1.42 1.52 52.00
Nation Media 2012 7.49 10.00 0.03 2.25 222.00
2011 31.96 8.00 0.04 2.31 140.00
2010 23.43 8.00 0.01 1.99 167.00
2009 7.49 5.50 0.03 2.13 118.00
2008 6.23 5.50 0.03 1.85 144.00
Scan group 2012 5.63 0.60 0.23 2.28 68.50
2011 (7.33) 0.70 0.22 2.24 41.50
2010 4.88 0.70 0.16 1.89 61.50
2009 1.01 0.50 0.01 2.53 25.50
2008 11.38 0.69 0.01 2.23 26.75
Standard group 2012 (0.13) - 0.47 1.12 21.80
2011 0.81 - 0.65 1.08 25.00
2010 31.19 0.50 0.87 1.32 45.50
2009 0.97 0.50 1.22 1.27 38.00
2008 1.66 1.10 1.51 1.37 50.00
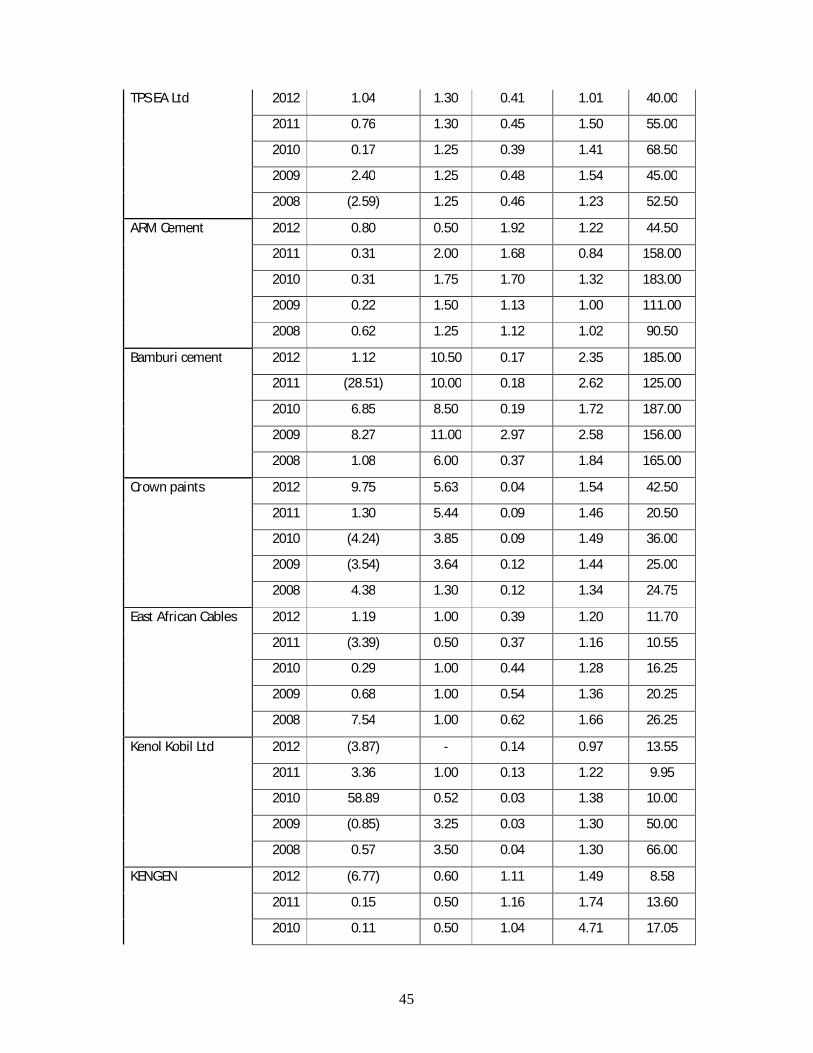
45
TPS EA Ltd 2012 1.04 1.30 0.41 1.01 40.00
2011 0.76 1.30 0.45 1.50 55.00
2010 0.17 1.25 0.39 1.41 68.50
2009 2.40 1.25 0.48 1.54 45.00
2008 (2.59) 1.25 0.46 1.23 52.50
ARM Cement 2012 0.80 0.50 1.92 1.22 44.50
2011 0.31 2.00 1.68 0.84 158.00
2010 0.31 1.75 1.70 1.32 183.00
2009 0.22 1.50 1.13 1.00 111.00
2008 0.62 1.25 1.12 1.02 90.50
Bamburi cement 2012 1.12 10.50 0.17 2.35 185.00
2011 (28.51) 10.00 0.18 2.62 125.00
2010 6.85 8.50 0.19 1.72 187.00
2009 8.27 11.00 2.97 2.58 156.00
2008 1.08 6.00 0.37 1.84 165.00
Crown paints 2012 9.75 5.63 0.04 1.54 42.50
2011 1.30 5.44 0.09 1.46 20.50
2010 (4.24) 3.85 0.09 1.49 36.00
2009 (3.54) 3.64 0.12 1.44 25.00
2008 4.38 1.30 0.12 1.34 24.75
East African Cables 2012 1.19 1.00 0.39 1.20 11.70
2011 (3.39) 0.50 0.37 1.16 10.55
2010 0.29 1.00 0.44 1.28 16.25
2009 0.68 1.00 0.54 1.36 20.25
2008 7.54 1.00 0.62 1.66 26.25
Kenol Kobil Ltd 2012 (3.87) - 0.14 0.97 13.55
2011 3.36 1.00 0.13 1.22 9.95
2010 58.89 0.52 0.03 1.38 10.00
2009 (0.85) 3.25 0.03 1.30 50.00
2008 0.57 3.50 0.04 1.30 66.00
KENGEN 2012 (6.77) 0.60 1.11 1.49 8.58
2011 0.15 0.50 1.16 1.74 13.60
2010 0.11 0.50 1.04 4.71 17.05

46
2009 (9.43) 0.50 0.62 2.17 14.52
2008 0.64 0.90 0.45 1.34 24.47
TOTAL KENYA 2012 0.28 0.20 0.06 1.30 13.85
2011 (0.14) 1.05 0.33 1.10 14.75
2010 (2.66) 1.05 0.39 1.18 29.00
2009 0.09 1.00 0.44 1.12 29.75
2008 40.33 2.50 - 1.24 32.00
Centum investment 2012 0.50 - 0.10 0.68 13.05
2011 3.02 - - 1.39 21.50
2010 0.72 - - 1.29 15.60
2009 (0.30) - - 0.31 10.25
2008 (4.36) - - 4.57 25.00
BOC Kenya 2012 (6.62) 5.05 0.01 2.08 49.69
2011 (2.29) 6.80 0.02 1.94 88.13
2010 (1.63) 9.40 0.06 2.48 305.41
2009 (20.26) 6.80 0.06 0.25 129.40
2008 (24.13) 6.80 0.04 2.08 106.01
British 2012 3.73 32.50 0.29 1.18 493.00
American (BAT) 2011 9.89 30.50 0.31 1.31 246.00
2010 324.42 17.50 0.37 1.17 270.00
2009 3.38 14.75 0.33 0.98 178.00
2008 5.93 17.00 0.21 1.05 131.00
CARBACID 2012 14.26 6.00 0.13 4.26 125.00
2011 1.79 5.00 0.15 8.84 91.50
2010 0.96 5.00 0.12 5.79 156.00
2009 74.98 15.00 0.12 10.63 103.00
2008 55.26 10.00 0.14 14.23 137.00
East African 2012 4.58 8.75 2.68 0.80 227.00
Breweries 2011 0.99 8.75 0.27 1.05 193.00
2010 5.56 8.75 0.11 1.49 181.00
2009 7.12 8.05 0.12 1.69 151.00
2008 3.10 8.05 0.09 1.74 199.00
Mumias Sugar 2012 0.46 0.50 0.38 1.25 6.10

47
2011 0.55 0.50 0.40 2.20 7.15
2010 (2.80) 0.40 0.37 2.00 12.85
2009 0.43 0.40 0.37 1.36 6.00
2008 1.17 0.40 0.19 1.35 12.70
UNGA GROUP 2012 2.43 0.75 0.11 2.36 12.60
2011 (19.78) 0.75 0.09 2.52 10.00
2010 (2.68) 0.50 0.11 2.54 12.25
2009 (20.49) - 0.01 1.84 10.00
2008 1.73 - 0.09 1.92 13.75
Access Kenya 2012 5.34 0.30 0.38 0.53 4.41
2011 (25.87) - 0.60 0.73 4.93
2010 0.02 - 0.57 0.71 14.09
2009 0.20 0.30 0.53 1.09 19.51
2008 0.47 0.40 0.03 1.50 19.82
Safaricom Ltd 2012 2.03 0.22 0.18 0.56 3.20
2011 1.73 0.20 0.19 0.64 3.80
2010 2.84 0.20 0.13 0.67 5.55
2009 1.20 0.10 0.10 0.49 3.00
2008 1.95 0.05 0.15 0.51 3.60

48

49