Embed Size (px)
Citation preview

An Examination of the March An Examination of the March 1-2, 2009 East Coast Gravity 1-2, 2009 East Coast Gravity Wave Using High-Resolution Wave Using High-Resolution
Operational Data SetsOperational Data Sets
Alan M. CopeAlan M. Cope
NOAA/National Weather NOAA/National Weather ServiceService
Mount Holly, NJMount Holly, NJ
OutlineOutline
IntroductionIntroduction Background on Gravity WavesBackground on Gravity Waves Meteorological SettingMeteorological Setting One-minute ASOS DataOne-minute ASOS Data WSR-88D Radar DataWSR-88D Radar Data Signals from NAM-WRFSignals from NAM-WRF ConclusionsConclusions

IntroductionIntroduction

Timing of Gravity Wave Trough
-Overnight March 1-2, 2009
- With moderate snowstorm
- Moved northeast 30-35 kt
-Pressure falls up to ~ 8 hPa
- Surface Wind Gusts 40-50 kt
-Downed trees and power lines
- Loss of electric power overnight

Pressure Falls (hPa) with Gravity Wave Passage

Wind Gusts (kt) with Gravity Wave Passage

Background on Gravity Background on Gravity WavesWaves

Idealized Cross-Section of a Gravity Wave
(from Schneider, 1990)

Typical Synoptic Environment and Sounding for Gravity Waves
(from Koch and O’Handley, 1997)
Meteorological SettingMeteorological Setting

HPC Surface Pressure and Frontal Analysis 0300 UTC, March 2

250 hPa Analysis from the RUC 80-km 0000 UTC, March 2

Sounding from Wallops Is., VA - 0000 UTC March 2

Sounding from Upton, NY - 0600 UTC March 2

Satellite WV Image at 0315 UTC, March 2

Composite Radar Reflectivity at 0600 UTC

One-Minute ASOS DataOne-Minute ASOS Data

1-Minute ASOS Surface Pressure and P-Change at Wakefield, VA

1-Minute ASOS Surface Pressure and P-Change at Patuxent River, MD
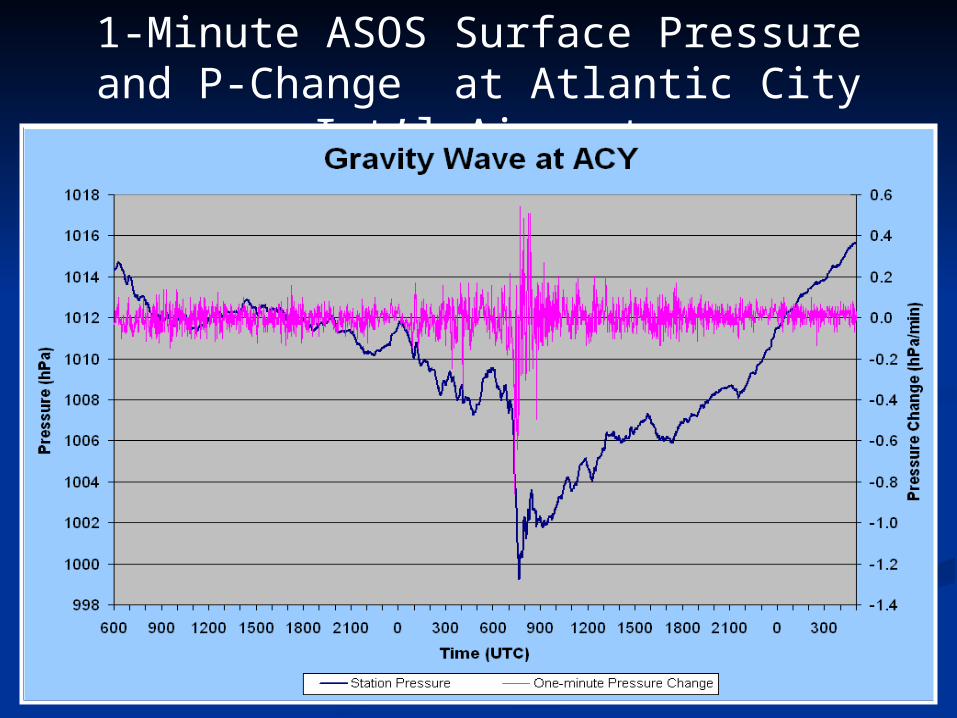
1-Minute ASOS Surface Pressure and P-Change at Atlantic City Int’l Airport

1-Minute ASOS Surface Pressure and P-Change at Boston, Logan Int’l Airport

Expanded View of 1-Minute ASOS Data
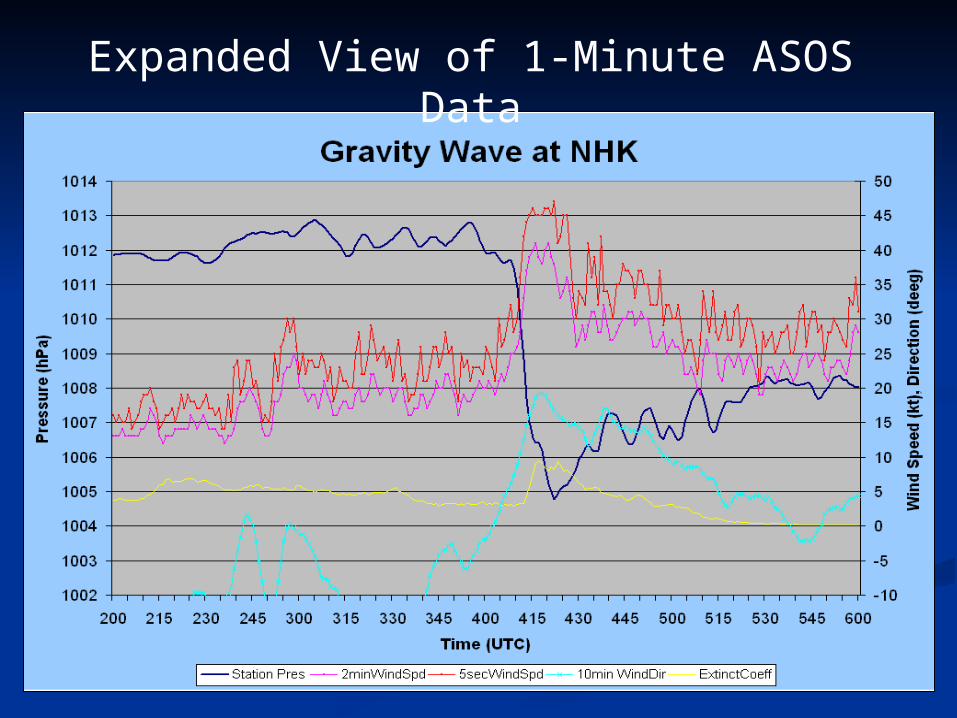
Expanded View of 1-Minute ASOS Data

WSR-88D Radar DataWSR-88D Radar Data

KDOX 0.5 deg Base Velocity - 0512 UTC

KDOX 0.5 deg Base Velocity - 0616 UTC

KDOX Base Velocity Cross Section – 0542 UTC

KDOX Base Velocity Cross Section – 0600 UTC

KDOX CAPPI Reflectivity at ~5000 ft – 0606 UTC

KDOX Reflectivity Cross Section at 0606 UTC

Signals from the NAM-Signals from the NAM-WRFWRF

NAM 21-hr Forecast, valid 0900 UTC March 2

NAM 09-hr Forecast, valid 0900 UTC March 2

ConclusionsConclusions
Large-amplitude gravity wave caused severe Large-amplitude gravity wave caused severe weatherweather
Conditions similar to other gravity wave case Conditions similar to other gravity wave case studiesstudies
One-minute ASOS data very useful to identify One-minute ASOS data very useful to identify wave (should be available real-time)wave (should be available real-time)
Doppler radar showed unusual wind pattern Doppler radar showed unusual wind pattern with hurricane force winds just above the with hurricane force winds just above the surfacesurface
Operational 12-km NAM-WRF indicated Operational 12-km NAM-WRF indicated possible gravity wave event well ahead of time.possible gravity wave event well ahead of time.

The EndThe End
Thanks for your Thanks for your attention!attention!
Questions???Questions???