Embed Size (px)
Citation preview
An Examination of Tax Deductible
Donations Made By Individual
Australian Taxpayers in
2013-14
Working Paper No. ACPNS 69
Professor Myles McGregor-Lowndes and Marie Crittall
The Australian Centre for Philanthropy and Nonprofit Studies
Queensland University of Technology
Brisbane, Australia
July 2016
GPO Box 2434
BRISBANE QLD 4001
Phone: 07 3138 1020
Fax: 07 3138 9131
Email: [email protected]
http://www.qut.edu.au/business/acpns
CRICOS code: 00213J
The Australian Centre for Philanthropy and Nonprofit Studies (ACPNS)
is a specialist research and teaching unit at the
Queensland University of Technology in Brisbane, Australia
It seeks to promote the understanding of philanthropy and nonprofit issues by drawing upon
academics from many disciplines and working closely with nonprofit practitioners,
intermediaries and government departments. ACPNS’s mission is “to bring to the community
the benefits of teaching, research, technology and service relevant to philanthropic and
nonprofit communities”. Its theme is ‘For the Common Good.’
The Australian Centre for Philanthropy and Nonprofit Studies reproduces and distributes
these working papers from authors who are affiliated with the Centre or who present papers
at Centre seminars. They are not edited or reviewed, and the views in them are those of
their authors.
A list of all the Centre’s publications and working papers is available from
http://www.qut.edu.au/business/acpns and digital downloads are available through QUT
ePrints at http://eprints.qut.edu.au/
CRICOS code: 00213J
ISBN: 978-1-921897-74-0
© Queensland University of Technology July 2016
2 Working Paper No. 69
TABLE OF CONTENTS
1.0 EXECUTIVE SUMMARY ........................................................................................................... 3
1.1 OVERVIEW OF THE RESEARCH ......................................................................................................... 3
1.3 SUMMARY OF FINDINGS ................................................................................................................ 6
2.0 WHAT IS A TAX DEDUCTIBLE GIFT? ...................................................................................... 10
2.1 CATEGORIES OF DEDUCTIBLE GIFT RECIPIENTS ................................................................................. 12
2.2 NEW PHILANTHROPIC AND GIVING TAXATION INITIATIVES .................................................................. 14
2.3 PRIVATE ANCILLARY FUNDS (PAF) – 2007-2013 ............................................................................ 22
2.4 PUBLIC ANCILLARY FUNDS (PUBAFS) ............................................................................................. 26
3.0 TAX DEDUCTIBLE DONATIONS BY INDIVIDUAL TAXPAYERS 2013-14 .......................................... 28
3.1 INDIVIDUAL TAXPAYER DONATIONS ............................................................................................... 29
3.2 INDIVIDUAL TAXPAYER DONATIONS BY GENDER ............................................................................. 35
3.3 INDIVIDUAL TAXPAYER DONATIONS BY STATE OF RESIDENCE ......................................................... 41
3.4 INDIVIDUAL TAXPAYER DONATIONS BY STATE AND POSTCODE OF RESIDENCE ............................... 48
3.5 INDIVIDUAL TAXPAYER DONATIONS BY INCOME BAND ................................................................... 53
3.6 TAXPAYER DONATIONS BY OCCUPATION ..................................................................................... 57
4.0 LIMITATIONS OF THE STUDY ................................................................................................ 62
5.0 BIBLIOGRAPHY .................................................................................................................... 65
6.0 APPENDIX ............................................................................................................................ 67
3 Working Paper No. 69
1.0 EXECUTIVE SUMMARY
1.1 Overview of the Research
This study uses information based on published ATO material and represents the extent of
tax deductible donations made and claimed by Australian taxpayers to DGRs at Item D9 Gifts
or Donations in their individual income tax returns for the 2013-14 income year. The data
does not include corporate and trust taxpayers. Expenses such as raffles, sponsorships,
fundraising purchases (e.g., sweets, tea towels, special events) or volunteering are generally
not deductible as ‘gifts’.
While section 1.3 of this Executive Summary provides the more detailed overview, analysis
of the ATO material provided for this study showed that the total amount donated and
claimed as tax deductible donations in 2013-14 was $2.62 billion (compared to $2.29 billion
for the previous income year). This constitutes an increase of $322 million from the previous
income year.
The average tax deductible donation made to DGRs and claimed by Australian taxpayers in
2013-14 was $575.54 (compared to $504.02 in the previous income year).
1.1.1 Other Recent Measures of Giving
The Productivity Commission in 2010 reported that in 2006-07 for economically significant
nonprofit organisations philanthropy revenue was $7.2 billion, represented by:
Donations from philanthropic trusts/foundations - $0.3 billion
Donations from business/organisations - $0.6 billion
Sponsorships - $1.1 billion
Donations from individuals - $4.2 billion
Other fundraising - $1.0 billion1
In 2014 the Australian Bureau of Statistics published a Non-profit Institutions Satellite
Account for the year 2012–13.2 In that year total ABS measured giving amounted to
$8,614 million (8 per cent of total sector income and 0.57% of GDP):
1 Productivity Commission. (2010). Contribution of the not-for-profit sector. Retrieved May 30, 2012 from
http://www.pc.gov.au/__data/assets/pdf_file/0003/94548/not-for-profit-report.pdf 2 Australian Bureau of Statistics (2014). Australian National Accounts: Non-Profit Institutions Satellite Account,
2012-13 (Catalogue No 5256.0), data cube table 7.1, available at http://www.abs.gov.au/AusStats/[email protected]/MF/5256.0
4 Working Paper No. 69
Donations, bequests and legacies $3,993 million
Donations from businesses $863 million
Donations from trusts and foundations $474 million
Sponsorships $1,381 million
Other fundraising $1,903 million
Income from donations, bequests and legacies experienced a 20 per cent decrease in
real terms from 2006–07 when total giving was $5131 million (6.9 per cent of total
sector income).
The sub sectors receiving significant philanthropy were environment, development
and housing, law, advocacy, philanthropic, international ($3,194m – 37%); Religion
($1,805m – 20%); Social Services ($1,240m- 14%) and culture and recreation
($1,082m- 12.5%).
The major recipient of foundation funding was social service ($122m) followed by
education and research ($114m).
The major recipients of business donations were environment, development and
housing, law, advocacy, philanthropic, international ($242m); education and
research ($196m) followed by social service ($183m).
Sponsorships were mainly directed at culture and recreation ($672m); environment,
development and housing, law, advocacy, philanthropic, international ($415m); and
industry associations, unions ($160m).
Donations and bequests from individuals went to environment, development and
housing, law, advocacy, philanthropic, international ($1405m); religion ($1,510m)
and social services ($507m).
5 Working Paper No. 69
1.2 The Research in Context
The Australian economy was entering its 25th year of economic growth. This the second
longest continuous period of growth of any advanced economy in the world. Demand for
resources and energy from Asia and especially China had grown rapidly, creating a channel
for resources investments and growth in commodity exports, but the narrative was that the
mining investment boom was over. The high Australian dollar had begun to weaken against
the US dollar. Australia’s 10-year government bond rate of 3.54 per cent was roughly 1 per
cent higher than the US and UK and more than 2 per cent higher than the 10-year German
bund. The Reserve Bank has held Australia’s official cash rate steady at 2.5 per cent for 10
months. The Westpac-Melbourne Institute Index of consumer sentiment plunged in May
after the first LNP Federal Budget to end the financial year 8.8 per cent below its level in the
previous year.
There were minimal natural disaster appeals compared to previous years. The October 2013
New South Wales bushfires were delared a disaster for the purposes of establishing
Australian disaster relief funds by the government.
The NAB Giving Index reported in February 2014 that “charitable giving grew by more than
8% in the year to February 2014, a substantial improvement on the 3.3% rate of growth seen
in the previous year.”3
In the United States, Giving USA 2015 estimated that total charitable contributions from
American individuals, corporations and foundations in 2014 reached $358.38 billion to
charity in 2014, also finally surpassing levels prior to the GFC. The 2014 total jumped 7.1
percent in current dollars and 5.4 percent when inflation-adjusted over the revised estimate
of $339.94 billion that Americans donated in 2013.
In the UK, Charities Aid Foundation (CAF) estimated the total amount donated to charity by
adults in 2013/14 was £10.6 billion.4 While the study used a different methodology in this
particular year, it estimated that giving had dropped slightly over the year again and had not
recovered to pre GFC levels.
3NAB Giving Index http://business.nab.com.au/nab-charitable-giving-index-indepth-report-february-6314/
4 Charities Air Foundation & National Council for Voluntary Organisations. (2015). UK Giving 2013/14 – an update
Retrieved April 1, 2016 from https://www.cafonline.org/docs/default-source/about-us-publications/caf-
ukgiving2014
6 Working Paper No. 69
1.3 Summary of Findings
The following is a summary of the significant statistics that are further analysed in this paper.
General Information:
The total amount donated and claimed as tax deductible donations in 2013-14 was $2.62
billion (compared to $2.29 billion for the previous income year). This constitutes an
increase of $322 million from the previous income year and is the highest amount
recorded, well above the pre-global financial crisis amount of $2.39 billion.
In 2013-14, individual taxpayers claimed $33.34 billion in personal tax deductions. Of
this amount, 7.85% of deductions claimed were tax deductible gifts, compared to 6.90%
for the cost of managing tax affairs and 62.34% for work related expenses.
The average tax deductible donation made to DGRs and claimed by Australian taxpayers in
2013-14 was $575.54 (compared to $504.02 in the previous income year). This increase
puts the average amount claimed the highest ever recorded, and above pre-global
financial crisis levels.
In 2013-14, 4.54 million Australian taxpayers (or 35.05% of the Australian taxpaying
population) made and claimed tax deductible donations. This has decreased slightly from
the previous year where 35.60% or 4.55 million taxpayers made and claimed a gift.
On average, those individual taxpayers who make tax deductible donations to DGRs
donated approximately 0.35% of their taxable income. This has increased from 0.32% in
2012-13 but is still lower than the 0.42% recorded in 2007-08.
Gender:
In 2013-14, 2.28 million male taxpayers (or 33.76% of male taxpayers) made and claimed
tax deductible donations to DGRs totalling $1.55 billion. In contrast, 2.27 million female
taxpayers (or 36.46% of female Australian taxpayers) made and claimed tax deductible
donations to DGRs totalling $1.06 billion in 2013-14. This is the first time since 2007-08
that donations by female taxpayers has exceeded $1 billion.
The average tax deductible donation made to DGRs and claimed by Australian male
taxpayers in 2013-14 was $681.04 ($574.04 in 2012-13) and $469.53 for Australian
female taxpayers ($433.51 in 2012-13).
7 Working Paper No. 69
On average, male Australian taxpayers who made tax deductible donations to DGRs
donated approximately 0.34% of their taxable income (0.30% in 2012-13), compared to
0.38% for females (0.37% in 2012-13).
State of Residence
A total of 1,455,434 taxpayers in New South Wales claimed tax deductible donations to
DGRs of $1.03 billion. This amount represented 39.51% of the national total. The next
largest donor state was Victoria whose taxpayers made and claimed tax deductible
donations to DGRs of $709.41 million, representing 27.12% of the national total.
Queensland taxpayers claimed tax deductible donations totalling $365.96 million,
followed by Western Australia with $238.63 million.
New South Wales taxpayers made and claimed the largest average tax deductible
donation to DGRs of $709.95 compared to the national average of $575.54. Australian
Capital Territory taxpayers had an average gift of $602.12, followed by taxpayers in
Victoria with an average gift of $572.50).
Taxpayers in New South Wales donated an average of 0.43% of their taxable incomes, an
increase from 0.39% in 2012-13. This was followed by taxpayers in both the Australian
Capital Territory and Victoria (0.40%). This compares to the national average of 0.35%.
Taxpayers in Queensland donated an average of 0.26% of their taxable incomes.
Income Bands:
In 2013-14, the average taxable gift for all taxpayers was $574.54. The average tax
deductible donation made and claimed by taxpayers in the $55,001-$60,000 income band
was $322.80, being 0.25% of their taxable income with 44.67% of taxpayers in this band
claiming a tax deductible gift.
The average tax deductible donation made and claimed by taxpayers in the less than
$6,001 income band was $548.87 (a decrease from $588.61 in 2012-13), with 5.51% of
taxpayers in this band claiming a tax deductible gift.
The average tax deductible donation made to DGRs and claimed by individual taxpayers
earning over one million per year was $51,978.72. This has increased from $41,244.73 in
2012-13 to an amount similar to that in 2011-12 ($49,678.88).
8 Working Paper No. 69
Taxpayers earning over $1 million donated approximately 1.31% of their taxable income
to DGRs, compared to the national average of 0.35%. This has increased from 1.14% in
2012-13.
Tax Deductible Gifts by Postcode
The postcode with the highest total of tax deductible gifts for 2013-14 was VIC 3142
(Hawksburn, Toorak) with $44,012,469 claimed in total. This is an increase from the
previous year where NSW 2030 (Dover Heights, HMAS Watson, Watsons Bay, Vaucluse,
Rose Bay North) claimed the highest total of tax deductible gifts ($27,703,284) The highest
average gift claimed was also in Victoria with Portsea (VIC 3944) donating on average
$19,187.32 per gifting taxpayer (4.93% of their taxable income). This was followed by QLD
4009 (Eagle Farm) at $18,490.30 and NSW 2027 (HMAS Rushcutters, Point Piper, Darling
Point, Edgecliff) with $14,179.59 claimed on average per gifting taxpayer.
This year, the postcode with the highest percentage of taxpayers claiming a gift
deduction was from South Australia being 5710 (Stirling North). It had 54.57% of
taxpayers claiming a gift. This was followed by VIC 3662 (Puckapunyal) where 53.91% of
taxpayers claimed a gift and NSW 2705 (HMAS Rushcutters, Point Piper, Darling Point,
Edgecliff) where 51.14% of taxpayers claimed a gift.
A database of all deductible gifts claimed between 2005 and 2014, fully searchable by
postcode, can be found on the ACPNS website at
http://www.qut.edu.au/business/acpns/publications
Tax Deductible Gifts by Occupation
This year, for the eighth time, we were able to match occupations declared by taxpayers on
their income tax returns with their deductible gifts. This should not be confused with sole
trader occupations which has been available for some time, but only captures taxpayers who
trade in a business under their own name (i.e. no corporate body or trust involved).
The highest average gift deductions were claimed by Chief Executives and Managing
Directors ($6,599.54), followed by Legislators ($4,088.64) and Other Medical
Practitioners ($2,961.42).
The occupation with the highest total amount claimed as gift deductions in total was
Chief Executives and Managing Directors ($321,159,914) followed by General Managers
($72,537,282). This is consistent with previous years.
9 Working Paper No. 69
The occupation with the highest deductible gift to taxable income ratio was legislators
(2.33%) followed by Ministers of Religion (2.06%) and Consultant, Apprentice or Trainee
(Justice and Legal Services, Insurance Claims Investigation) (1.38%). Chief Executives and
Managing Directors donated 1.27% of their taxable income, an increase from 1.04% in
2012-13).
The occupation categories with the highest percentage of donating taxpayers was, for
the fourth year in a row, Police with 72.07% of individuals in this occupation claiming a
tax deductible donation. This was followed by School Principals (67.41%) and Judicial
and Other Legal Professionals (65.47%).
A database of all deductible gifts claimed between 2006 and 2014, fully searchable by
occupation, can be found on the ACPNS web site at
http://www.qut.edu.au/business/about/research-centres/australian-centre-for-
philanthropy-and-nonprofit-studies/publications-and-resources/giving-by-postcode
Private Ancillary Funds (PAF)
The total number of PAFs increased by 12.63% to 1,204 at the end of the 2013-14 income
year. They received $517.30 million in donations and distributed $300.72 million.
Public Ancillary Funds (PubAFs)
For the third year, the ATO has released data on PubAFs. 91 new PubAFs were approved in
2013-14 to bring the total number of PubAFs approved to 1,550. They received $435.05
million in donations and distributed $330.36 million.
10 Working Paper No. 69
2.0 WHAT IS A TAX DEDUCTIBLE GIFT?
According to Division 30 of the Income Tax Assessment Act 1997 (Cth) (ITAA 1997), taxpayers
are entitled to claim a tax deduction for gifts (i.e. donations) made during the income year to
endorsed Deductible Gift Recipients (DGRs). There are two elements which must be present in
order to claim a tax-deduction:
(a) it must be a gift; and
(b) it must be made to a DGR.
The term "gift" is not defined in either the ITAA 1936 or 1997. As a consequence, it takes on its
ordinary meaning.
On 20 July 2005, the ATO released Taxation Ruling TR 2005/13 ‘Tax Deductible Gifts – What is
a Gift?’ This taxation ruling supersedes several other taxation rulings and determinations and
represents the most comprehensive taxation ruling issued by the ATO on the subject of tax
deductible gifts. TR 2005/13 contains 230 paragraphs, 81 worked examples and spans 47
pages.
For a gift to be a tax deductible donation and claimed as an income tax deduction in personal
income tax returns, the gift must usually have the following characteristics:
there is a transfer of the beneficial interest in property;
the transfer is made voluntarily;
the transfer arises by way of benefaction; and
no material benefit or advantage is received by the giver by way of return.
Generally, for a payment to be considered a gift it must be unfettered, that is, there must be
no obligation to do anything in recognition of the gift and no expectation on the part of the
donor to receive anything in return for the donation (i.e. no strings attached).
Where a payment constitutes a bona-fide gift, then the donor is entitled to claim the amount
given as an income tax deduction under Division 30. In contrast, the following are not usually
considered gifts:
purchase of raffle or art union tickets;
purchase of an item such as a mug, key ring or pen which is not merely a token that
promotes the DGR or its activities;
11 Working Paper No. 69
the cost of attending a fundraising dinner, even if the cost exceeds the value of the dinner.
However, there are new contribution rules that apply since 1 July 2004 for minor benefits
made to DGRs;
payments to school building funds as an alternative to an increase in school fees;
membership fees (except to political parties); and
payments where the person has an understanding with the recipient that the payment will
be used to provide a benefit to the donor.
However, since 1 July 2004 the government has allowed certain contributions, which do not
fall under the strict definition of a gift, to be deductible. A deduction is now allowed where
the donor receives a benefit in connection with the contribution, provided that certain
conditions are met and the benefit does not exceed a specified limit. Broadly, this allows
deductions for two separate types of contributions at a DGR fundraising event in Australia,
namely:
contributions made in return for a right to participate in a fundraising event (e.g. the
purchase of a ticket to attend a charity ball, fete, dinner, performance or similar
charitable fund-raising event); and
contributions made by way of consideration for the supply of goods and services for
successful bidding at a charity auction that is conducted by a deductible gift recipient.
12 Working Paper No. 69
2.1 Categories of Deductible Gift Recipients
Since 1 July 2000, pursuant to Subdivision 30-BA of the ITAA 1997, the Commissioner of
Taxation must endorse both Income Tax Exempt Charities (ITECs) and DGRs.
If a DGR is not endorsed by the Commissioner, donors will be unable to claim income tax
deductions for gifts made since 1 July 2000 under Division 30 of the ITAA 1997.
Sub-Division 30B of the ITAA 1997 outlines the 12 general categories of entities and funds that
have been endorsed by the Commissioner of Taxation as DGRs. The general categories are:
health (Section 30-20);
education (Section 30-25);
research (Section 30-40);
welfare and rights (Section 30-45);
defence (Section 30-50);
environment (Section 30-55);
the family (Section 30-70);
international affairs (Section 30-80);
sports and recreation (Section 30-90);
philanthropic trusts (Section 30-95);
cultural organisations (Section 30-100); and
other recipients consisting of ancillary funds (Section 30-105).
Five new general categories of deductible gift recipient have been allowed since 1 July 2006:
disaster relief;
war memorials;
animal welfare;
charitable services; and
educational scholarships.
In addition to the above general categories of funds, authorities, institutions and organisations,
gifts of $2 or more made to recipients specified in Sections 30-15 to 30-100 of the ITAA 1997
are also deductible to the donor.
13 Working Paper No. 69
However, these are only the general categories. This is not the full list of DGRs. Donors can
check the status of a DGR by searching the Australian Business Register.5 As at 31 October
2012 there were nearly 56,279 Tax Concession Charities but only about 29,046 qualify as DGRs
able to give tax deductible receipts.
Only certain types of gifts are specifically made tax deductible under Division 30. These
include:
gifts of $2 or more (money);
property which has been purchased by the donor less than 12 months before the gift was
made;
property valued by the Commissioner as over $5,000;
trading stock disposed of outside the ordinary course of business;
cultural gifts, being property made under the Cultural Gifts Program;
cultural bequests, being property made under the Cultural Bequests Program; and
heritage gifts.
In order to claim the amount of their tax deductible donation to a DGR, donors are required to
keep records of their gifts. DGRs are not required by income tax law to issue receipts for
deductible gifts, but most do, as the donor will need a receipt in order to substantiate the
claim made.
5 Australian Business Register. (2012). ABN look up. Retrieved May 30, 2012 from
http://www.abr.business.gov.au/
14 Working Paper No. 69
2.2 New Philanthropic and Giving Taxation Initiatives
On 26 March 1999, the Prime Minister issued a press release announcing various income tax
measures to encourage greater corporate and personal philanthropy in Australia. These new
measures included:
establishment of Prescribed Private Funds (PPFs) – now known as Private Ancillary Funds
(PAFs);
tax deductibility for gifts of property over $5,000;
5-year averaging of donations;
deductions for workplace giving;
conservation covenants;
capital gains tax exemption under the Cultural Gifts Program;
deductions for fundraising dinners and similar events; and
new DGR category of health promotion charities.
Each of these taxation incentives is discussed below in more detail.
Further incentives have been suggested and developed by the Prime Minister’s Community
Business Partnership since 1999. These incentives which involve the taxation regime have
been rolled out gradually since 1999.6
2.2.1 Private Ancillary Funds (PAFs) (formerly Prescribed Private Funds (PPFs))
A PPF is a fund established by will or trust instrument with:
DGR status (i.e., gifts to it are deductible to the donor);
normally, income tax exempt status (i.e., its income is exempt from income tax); and
the ability to attract a variety of other Commonwealth, State and Territory tax and duty
concessions.
There is no need for gifts to a PPF to be sought and received from the public and a PPF can
be controlled by an individual, family or corporate group. This is a removal of a major barrier
to philanthropy, as it was often difficult to satisfy the previous test of “public donations”
before a fund would be endorsed as a DGR.
6 The Prime Minister’s Community Business Partnership. (n.d.). Taxation initiatives to encourage philanthropy.
Retrieved March 30, 2016 from http://www.fahcsia.gov.au/sa/communities/progserv/Documents/pmcbp_fs5.pdf
15 Working Paper No. 69
On 1 October 2009 a new regime began for PPFs. Existing PPFs became Private Ancillary
Funds (PAFs) and they were taken to be endorsed as deductible gift recipients. The Minister
was given power to make guidelines about the establishment and maintenance of PAFs.
Each trustee of an existing PPF was taken to have agreed to comply with PAF Guidelines.
Only a constitutional corporation can be a trustee of a PAF.
The administration of PAFs was vested fully in the Commissioner of Taxation, subject to
some transitional provisions. The Commissioner has the
power to:
endorse PAFs as deductible gift recipients and tax concession charities or income tax
exempt funds;
revoke endorsement;
impose administrative penalties on trustees, and their directors; and
suspend, remove and replace trustees.
The legislative changes are contained in Tax Laws Amendment (2009 Measures No. 4) Act
2009 (Cth) which received Royal Assent on 18 September 2009. The PAF Guidelines were
signed on 28 September 2009 and a model trust deed was released soon after by the
Australian Taxation Office.
The PAF Guidelines are a legislative instrument and so have legal effect, in contrast to the
guidelines that applied to PPFs. PAFs must agree to comply with the Guidelines.
In each financial year, a PAF must distribute to deductible gift recipients an amount equal to
at least 5% of the market value of its net assets as at the end of the previous financial year.
The market value of the assets must be estimated as specified in the Guidelines.
A PAF must not acquire a collectable, may not carry on a business, and may not solicit
donations from the public. A PAF is also effectively limited in the donations it can accept
from ‘outsiders’.
A PAF must have and maintain a current investment strategy and subject to some exceptions
may not borrow or maintain an existing borrowing. The trustee must prepare and maintain a
current investment strategy meeting the requirements of the PAF Guidelines. Special
obligations are also imposed on the independent responsible person on the board of
directors of the trustee.
16 Working Paper No. 69
The Guidelines contain some exceptions/qualifications in respect of the above rules, and the
Guidelines and Act contain transitional provisions in respect of certain PAFs that existed
before 1 October 2009.
A dynamic graph of PPF growth is available on the Centre’s web site at
http://www.qut.edu.au/business/about/research-centres/australian-centre-for-
philanthropy-and-nonprofit-studies/publications-and-resources/giving-statistics
2.2.2 Gifts of Property over $5,000
From 1 July 2001 changes to the legislation enabled donors to claim a tax deduction for gifts
of property held by the donor and valued at more than $5,000 by the Commissioner of
Taxation. This deduction was backdated to apply from 1 July 1999 and extends to property
donated to approved environmental and heritage organisations. Previously, the deduction
was only available where the property was purchased within 12 months of being donated.
Tax Laws Amendment (2007 Measures No. 2) Act 2007 made several amendments to the
Income Tax Assessment Act 1997 to promote philanthropy. To promote philanthropic giving,
the Government announced in the 2006-07 Budget that it would allow a tax deduction for
the donation of certain publicly listed shares to DGRs, extending the current gift provisions.
The amendments allow a tax deduction for donations of shares in listed public companies,
which were acquired at least 12 months before the donation, and have a market value of
$5,000 or less. Donors can claim a deduction for the market value of the shares as at the day
they made the gift.
2.2.3 5 Year Averaging of Donations
Donors now have the ability to spread the following types of gifts over a period of up to 5
income years:
cash donations in excess of $5,000 (which took effect from 1 July 2003);
property valued by the Commissioner in excess of $5,000 (which took effect from 1 July
1999); and
cultural gifts made through the Cultural Gifts Program (which took effect from 1 July
1999).
17 Working Paper No. 69
2.2.4 Deductions for Workplace Giving
Workplace giving programs (which took effect from 1 July 2002) are designed to give
employees the opportunity to make regular donations to a DGR through regular payroll
deductions. Employees receive immediate tax benefits, as employers are able to reduce the
amount of PAYG withholding tax from that employee’s pay.
2.2.5 Conservation Covenants
Certain types of conservation covenants over land, entered into on or after 1 July 2002, will
be eligible for an income tax deduction and concessional capital gains tax treatment.
2.2.6 The Cultural Gifts Program – Capital Gains Tax Exemption
Since 1 July 1999, bequests of property and gifts of cultural property made through the
Cultural Gifts Program are exempt from capital gains tax, thus maximising the appreciated
value of these gifts for tax deduction purposes.
2.2.7 Deductions for Fundraising Dinners and Similar Events
Since 1 July 2004, individual taxpayers are, in certain circumstances, able to receive a tax
deduction for ‘contributions’ in the form of a ticket to a charity fundraising dinner. The
deduction initially applied to contributions above $250, where the value of the benefit
received (for example, a meal or entertainment) was no more than 10% of the total
contribution or $100, whichever was less. The provision also relates to goods purchased at
fundraising auctions.
Further changes were made from 1 January 2007 to reduce the minimum contribution
threshold to $150 (previously $250), to allow a greater number of charities to use the
measure for fundraising. The value of the minor benefit allowed was increased to 20 per
cent of the gift – or ticket price – but not exceeding a value of $150 (previously 10% not
exceeding $100).
2.2.8 Health Promotion Charities
A new DGR category known as Health Promotion Charities is entitled to the same benefits as
Public Benevolent Institutions. This category commenced in 2002, but is back-dated to the
1997/98 year. It allows a tax deduction for gifts to charitable institutions whose principal
activity is to promote the prevention or the control of behaviour that is harmful or abusive
to human beings.
18 Working Paper No. 69
2.2.9 Donations to political parties and other candidates
Before 22 June 2006, former item 3 in the table contained in section 30-15(2) ITAA 1997
provided that a deduction to a political party registered under Commonwealth Electoral Act
1918 Pt XI may be allowable but was limited to $100 and could not be claimed by a
company. From 22 June 2006, under Subdiv 30-DA ITAA 1997:
the tax deductible threshold for political contributions is $1,500 for an income year;
deductions are allowed for contributions made to political parties registered under state
and territory, as well as federal, electoral legislation;
gifts to independent candidates and independent members may be deductible; and
companies may be entitled to deductions.
Tax Laws Amendment (2008 Measures No. 1) Bill 2008 was passed by the House of
Representatives on 21 February 2008 and introduced to the Senate on 11 March 2008.
Schedule 1 of the Bill amends the income tax law to remove tax deductibility for
contributions or gifts to political parties, independent members and candidates. The
measure applies in relation to contributions and gifts made on or after 1 July 2008. The
Senate referred the provisions of Schedule 1 to the Joint Standing Committee on Electoral
Matters for inquiry and report by June 2009. Further, the Tax Laws Amendment (Political
Contributions and Gifts) Bill 2008 was passed by the Senate on Tuesday, 3 February 2009
with amendments. Individual taxpayers will still be able to claim a tax deduction for such
gifts to $1,500 due to amendments.
2.2.10 Five new general categories of deductible gift recipient from 1 July 2006:
Australian disaster relief funds – public funds for relief of people in distress as a result
of a declared disaster which occurred in Australia;
animal welfare charities – charitable institutions that provide short-term direct care
and/or rehabilitate certain animals;
charitable services institutions – charitable institutions that would be public benevolent
institutions but for their health promotion and/or harm prevention activities;
war memorial repair funds – public funds established and maintained for the
reconstruction or critical repair of a qualifying war memorial; and
developed country disaster relief funds – public funds established by a public
benevolent institution for relief of people in distress as a result of a declared disaster in
a developed country.
19 Working Paper No. 69
2.2.11 Educational Scholarships
From 1 July 2006, a public fund established for charitable purposes is eligible for
endorsement as a DGR by the Commissioner if its sole purpose is to provide money for
scholarships, bursaries or prizes to which section 30-37 of the ITAA 1997 applies.
A scholarship, bursary or prize to which the section applies is one which:
may only be awarded to Australian citizens, or permanent residents of Australia, within
the meaning of the Australian Citizenship Act 1948;
is open to individuals or groups of individuals throughout a region of at least 200,000
people, or throughout at least an entire state or territory;
promotes recipients' education in either or both of:
pre-school courses, primary courses, secondary courses or tertiary courses,
educational institutions overseas, by way of study of a component of one of
the above courses; and
is awarded on merit or for reasons of equity (e.g. for students who are experiencing
financial disadvantage or hardship).
Scholarships and bursaries are ongoing or one-off benefit payments for school fees,
textbooks and related educational expenses such as uniforms or travel. A prize is an award
of money or property that is usually conferred for reasons of merit such as academic
achievement, but may also be for reasons of equity.
2.2.12 Share Gifts
From 1 July 2007, if you make a gift of listed shares valued at $5,000 or less that you
acquired at least 12 months earlier, you could be eligible to claim a deduction. For the gift to
be tax deductible, all of the following requirements must be met:
The shares were acquired in a listed public company;
When the shares were gifted, they were listed for quotation on the official list of an
Australian stock exchange;
The shares were gifted to a deductible gift recipient;
The shares were acquired at least 12 months before they were gifted; and
The market value of the shares was $5,000 or less on the day they were gifted.
20 Working Paper No. 69
2.2.13 Public Ancillary Fund amendments
In the May 2010 Budget, the federal government announced that it would improve the
integrity of Public Ancillary Funds (PubAFs) by introducing a new regulatory framework
similar to that introduced for Private Ancillary Funds (PAFs). Amending legislation was
introduced as part of Tax Laws Amendment (2011 Measures No 7) Bill 2011. Guidelines were
made by legislative instrument on 9 December 2011, setting out rules for establishing,
operating and winding up a PubAF, and transitional provisions. Most changes took effect
from 1 January 2012.
The reformed regulatory framework takes much of its shape from that of PAFs. A new
section 426-102 inserted into Schedule 1 of Taxation Administration Act 1953 sets out the
elements of a trust that is a PubAF, including that trustees are constitutional corporations or
a Public Trustee. The main amendments introduced have the effect that:
An ancillary fund is defined as a ‘public ancillary fund’ or ‘private ancillary fund’ in
Income Tax Assessment Act 1997, section 995-1. And philanthropic trust funds can be
‘public ancillary funds’ or ‘private ancillary funds’ under Taxation Administration Act
1953, (Schedule 1 section 426-1);
PubAFs are identified as such on the Australian Business Register (Taxation
Administration Act 1953, Schedule 1 section 426-104);
The Minister (Treasurer) must make binding guidelines through legislative instruments
(Taxation Administration Act 1953, Schedule 1 section 426-103);
The Commissioner of Taxation will have power (under Taxation Administration Act 1953,
Schedule 1 section 426-120) to:
o impose administrative penalties on trustees and directors of trustees who
breach the guidelines; or
o suspend or remove trustees for breaches of guidelines.
The Public Ancillary Fund Guidelines 2011 set out requirements for operation, winding up
and portability, including:
the PubAF’s nonprofit nature;
minimum annual distribution of 4 per cent of the market value of net assets;
annual valuation of assets;
accounts; annual financial statements; and audit of financial accounts;
annual income tax return;
21 Working Paper No. 69
investment strategy and limitations on investing;
trustees’ fees and remuneration;
inviting the public to donate; and
transferring assets to another PubAF.
There are transitional rules about distribution, where a fund’s governing rules are
inconsistent with the Guidelines, or where a fund holds prohibited investments or has
existing borrowings, and where a trustee is not a constitutional corporation.
From 1 January 2014 new model deeds for funds were released by the ATO. The changes to the
deeds result from the enactment of the Charities Act 2013 andCharities (Consequential
Amendments and Transitional Provisions) Act 2013, which take effect from 1 January 2014.
2.2.14 New DGR class announced
Parliament passed Tax Laws Amendment (2013 Measures No. 1) Bill 2013, which received
royal assent on 29 June 2013. The legislation enabled eligible providers of ethics education in
government schools to receive tax deductible donations. The start date for the deductible
gift recipient (DGR) category was 29 June 2013.
22 Working Paper No. 69
2.3 Private Ancillary Funds7 (PAF) – 2007-2013
PAFs are trusts to which taxpayers can make tax deductible donations.8 The term private
ancillary fund is defined in the taxation legislation and has some similarities with the US
private family foundation. The sole purpose of a PAF must be to provide money, property or
benefits to funds, authorities or institutions, which are deductible gift recipients (DGRs).
Table 1: Numbers of PAFs, donations received, distributions made and closing values
Date
Number of
PAFs
approved in
the year
Total
number of
PAFs
approved
Donations
received
Distributions
made Closing value
($m) ($m) ($m)
2000-01 22 22 78.66 - 78.62
2001-02 59 81 53.04 6.69 133.71
2002-03 49 130 53.18 18.42 179.33
2003-04 94 224 155.66 27.46 332.02
2004-05 95 319 192.69 57.43 523.25
2005-06 116 435 364.94 84.47 885.42
2006-07 164 599 533.26 133.42 1,484.47
2007-08 169 768 779.33 140.57 2,069.35
2008-09 54 822 272.71 155.34 2,038.19
2009-10 57 879 321.04 197.47 2,266.83
2010-11 28 907 304.39 165.41 2,124.46
2011-12 95 1,002 354.49 251.66 2,933.60
2012-13 84 1,069 293.84 244.49 2,811.80
2013-14 153 1,204 517.30 300.72 3,966.07
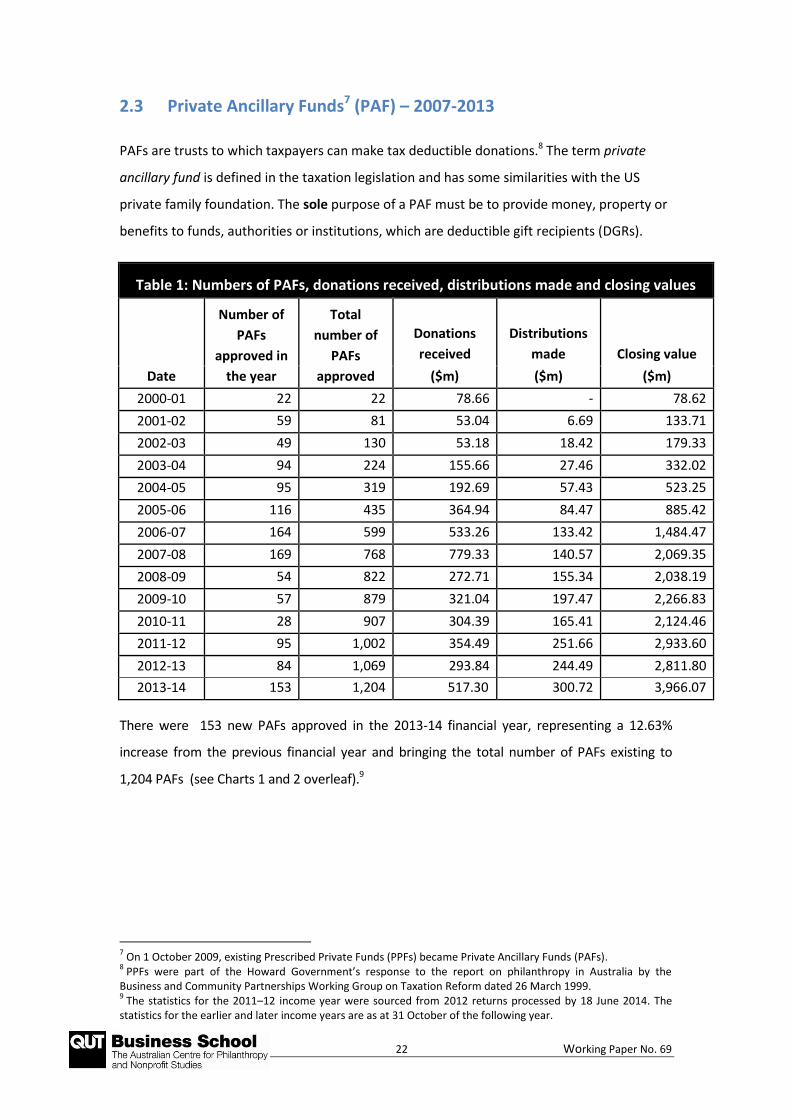
There were 153 new PAFs approved in the 2013-14 financial year, representing a 12.63%
increase from the previous financial year and bringing the total number of PAFs existing to
1,204 PAFs (see Charts 1 and 2 overleaf).9
7 On 1 October 2009, existing Prescribed Private Funds (PPFs) became Private Ancillary Funds (PAFs).
8 PPFs were part of the Howard Government’s response to the report on philanthropy in Australia by the
Business and Community Partnerships Working Group on Taxation Reform dated 26 March 1999. 9 The statistics for the 2011–12 income year were sourced from 2012 returns processed by 18 June 2014. The
statistics for the earlier and later income years are as at 31 October of the following year.
23 Working Paper No. 69
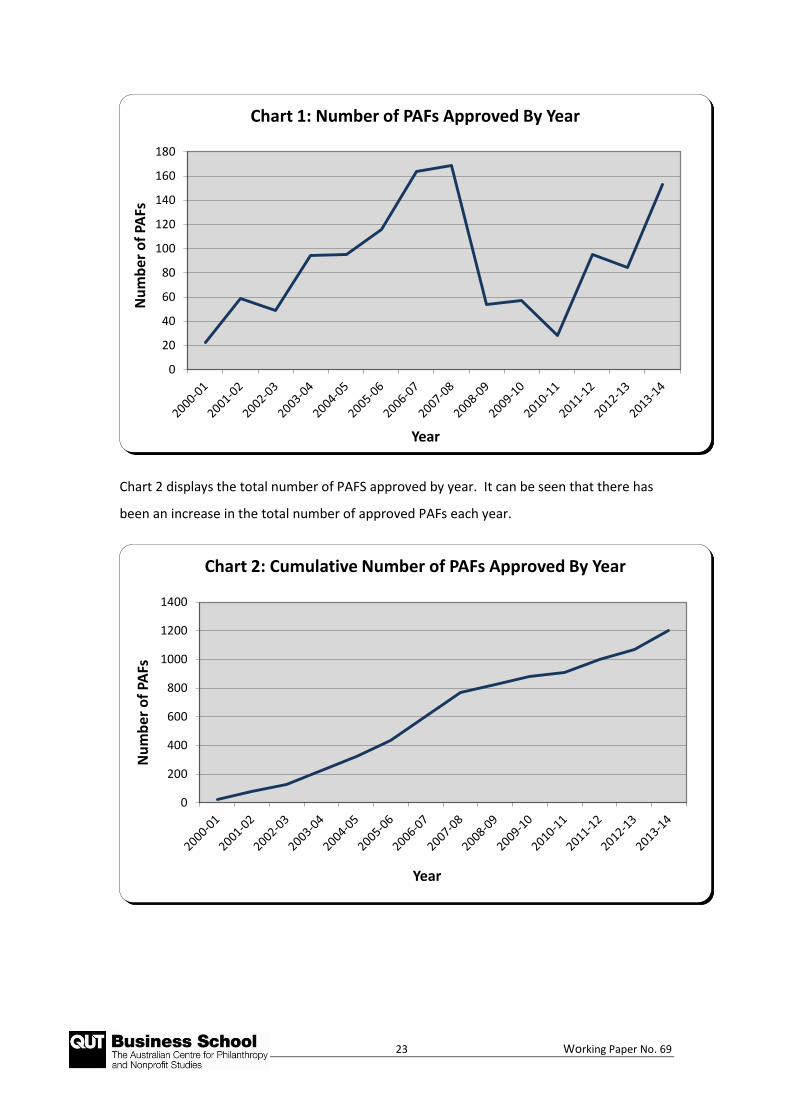
Chart 2 displays the total number of PAFS approved by year. It can be seen that there has
been an increase in the total number of approved PAFs each year.
0
20
40
60
80
100
120
140
160
180N
um
ber
of
PAFs
Year
Chart 1: Number of PAFs Approved By Year
0
200
400
600
800
1000
1200
1400
Nu
mb
er o
f PA
Fs
Year
Chart 2: Cumulative Number of PAFs Approved By Year
24 Working Paper No. 69
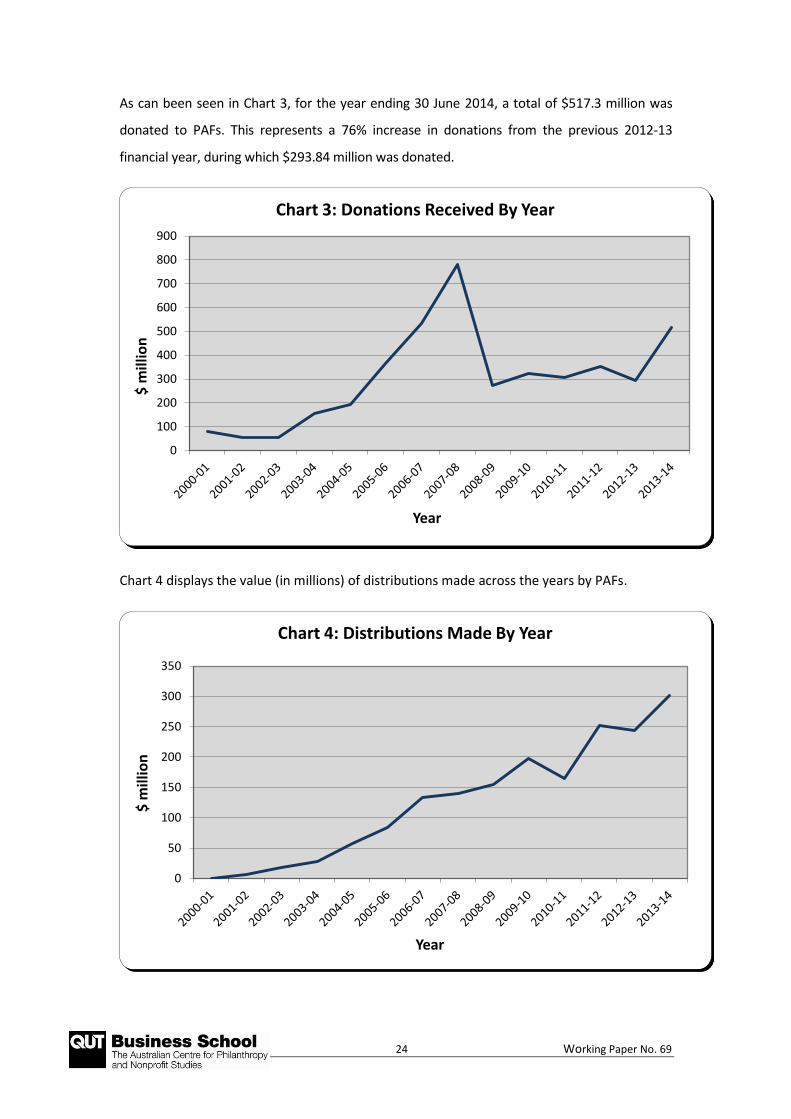
As can been seen in Chart 3, for the year ending 30 June 2014, a total of $517.3 million was
donated to PAFs. This represents a 76% increase in donations from the previous 2012-13
financial year, during which $293.84 million was donated.
Chart 4 displays the value (in millions) of distributions made across the years by PAFs.
0
100
200
300
400
500
600
700
800
900
$ m
illio
n
Year
Chart 3: Donations Received By Year
0
50
100
150
200
250
300
350
$ m
illio
n
Year
Chart 4: Distributions Made By Year
25 Working Paper No. 69
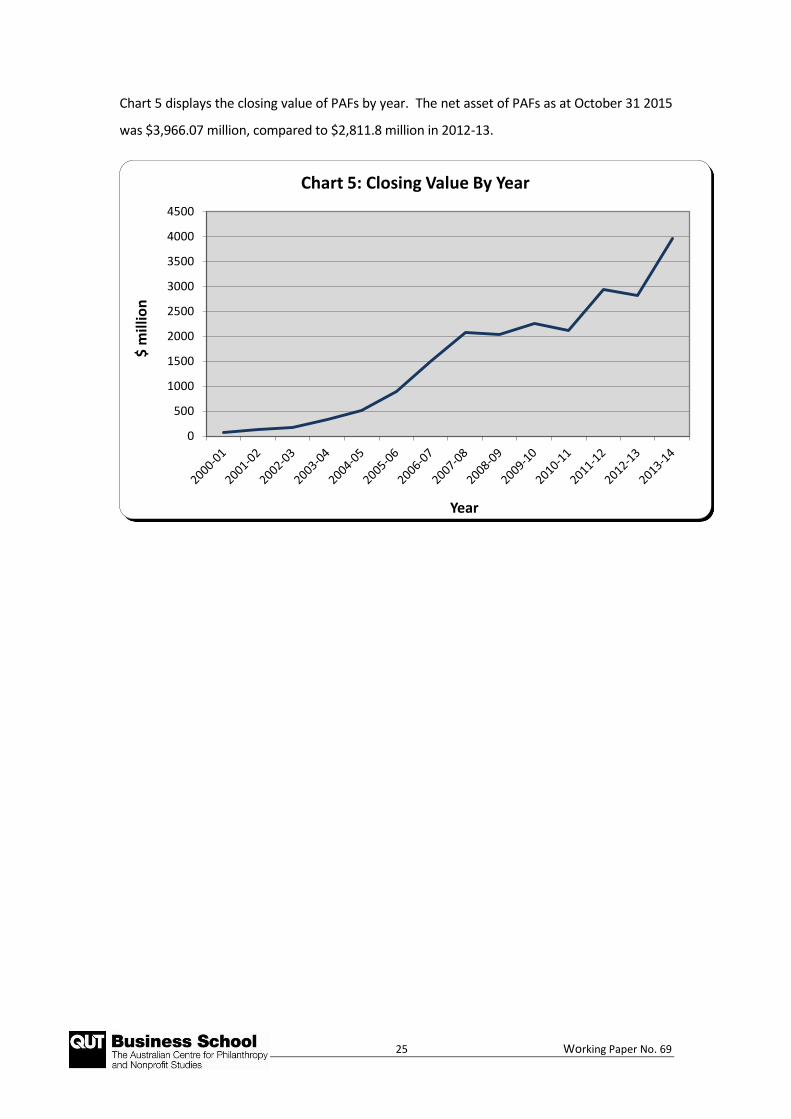
Chart 5 displays the closing value of PAFs by year. The net asset of PAFs as at October 31 2015
was $3,966.07 million, compared to $2,811.8 million in 2012-13.
0
500
1000
1500
2000
2500
3000
3500
4000
4500
$ m
illio
n
Year
Chart 5: Closing Value By Year
26 Working Paper No. 69
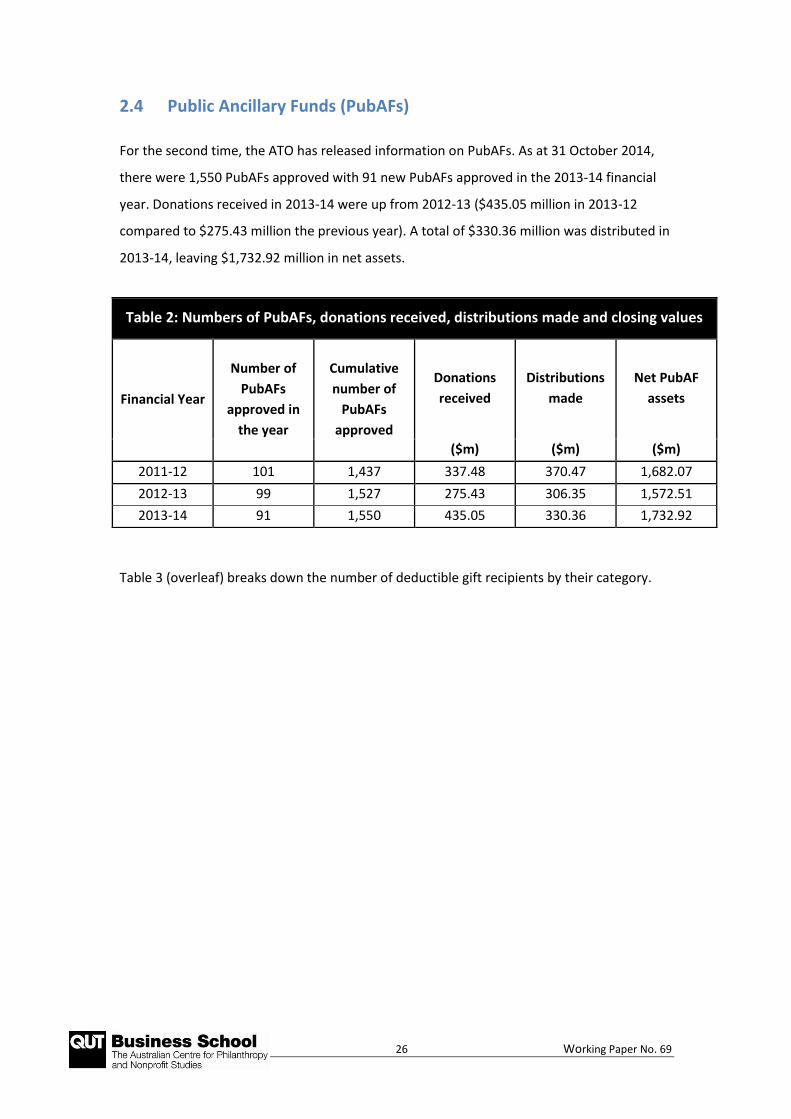
2.4 Public Ancillary Funds (PubAFs)
For the second time, the ATO has released information on PubAFs. As at 31 October 2014,
there were 1,550 PubAFs approved with 91 new PubAFs approved in the 2013-14 financial
year. Donations received in 2013-14 were up from 2012-13 ($435.05 million in 2013-12
compared to $275.43 million the previous year). A total of $330.36 million was distributed in
2013-14, leaving $1,732.92 million in net assets.
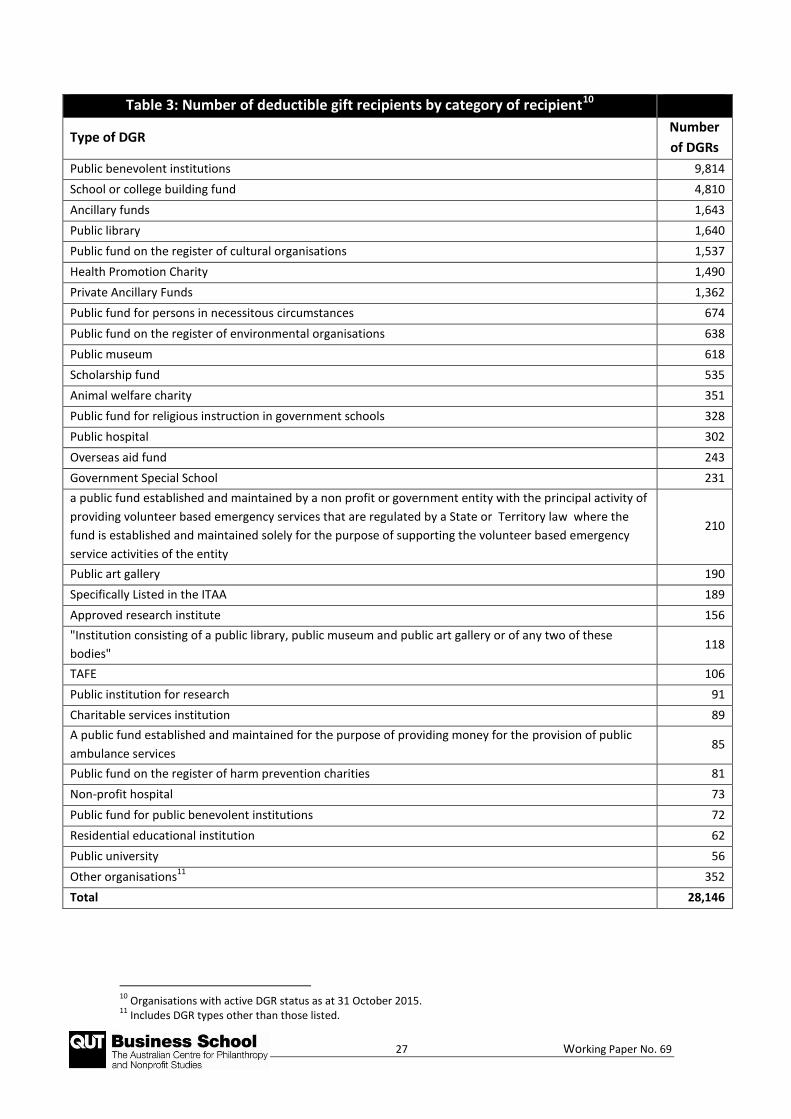
Table 3 (overleaf) breaks down the number of deductible gift recipients by their category.
Table 2: Numbers of PubAFs, donations received, distributions made and closing values
Financial Year
Number of
PubAFs
approved in
the year
Cumulative
number of
PubAFs
approved
Donations
received
Distributions
made
Net PubAF
assets
($m) ($m) ($m)
2011-12 101 1,437 337.48 370.47 1,682.07
2012-13 99 1,527 275.43 306.35 1,572.51
2013-14 91 1,550 435.05 330.36 1,732.92
27 Working Paper No. 69
Table 3: Number of deductible gift recipients by category of recipient10
Type of DGR Number
of DGRs
Public benevolent institutions 9,814
School or college building fund 4,810
Ancillary funds 1,643
Public library 1,640
Public fund on the register of cultural organisations 1,537
Health Promotion Charity 1,490
Private Ancillary Funds 1,362
Public fund for persons in necessitous circumstances 674
Public fund on the register of environmental organisations 638
Public museum 618
Scholarship fund 535
Animal welfare charity 351
Public fund for religious instruction in government schools 328
Public hospital 302
Overseas aid fund 243
Government Special School 231
a public fund established and maintained by a non profit or government entity with the principal activity of
providing volunteer based emergency services that are regulated by a State or Territory law where the
fund is established and maintained solely for the purpose of supporting the volunteer based emergency
service activities of the entity
210
Public art gallery 190
Specifically Listed in the ITAA 189
Approved research institute 156
"Institution consisting of a public library, public museum and public art gallery or of any two of these
bodies" 118
TAFE 106
Public institution for research 91
Charitable services institution 89
A public fund established and maintained for the purpose of providing money for the provision of public
ambulance services 85
Public fund on the register of harm prevention charities 81
Non-profit hospital 73
Public fund for public benevolent institutions 72
Residential educational institution 62
Public university 56
Other organisations11
352
Total 28,146
10
Organisations with active DGR status as at 31 October 2015. 11
Includes DGR types other than those listed.
28 Working Paper No. 69
3.0 TAX DEDUCTIBLE DONATIONS BY INDIVIDUAL TAXPAYERS 2013-14
This section of the paper analyses the nature and extent of tax deductible donations to DGRs
claimed by Australian individual taxpayers in their 2013-14 income tax returns.
As mentioned in the Executive Summary, the information presented is based on the amount
and type of tax deductible donations made to DGRs and claimed by Australian individual
taxpayers for the period 1 July 2013 to 30 June 2014. This information has been extracted
mainly from the ATO's publication Taxation Statistics 2013-14.12 The 2013-14 report is the
latest report that has been made publicly available.
This study uses information based on published ATO material and represents only the extent
of tax deductible donations made to DGRs and claimed by Australian taxpayers at Item D9
Gifts or Donations in their individual income tax returns for the 2014 income year, and that
have been processed by 31 October 2015. The data do not include corporate taxpayers as
there is no provision on corporate taxpayers’ tax returns to disclose gifts made to DGRs.
Expenses such as raffles, sponsorships, fundraising purchases (e.g., sweets, tea towels,
special events) or volunteering are generally not deductible as ‘gifts’.
The Giving Australia Report used a more liberal definition of gift to arrive at an estimated
total of giving at $11 billion for 2005 (excluding Tsunami giving of $300 million). The $11
billion total comprised $5.7 billion from adult Australians, $2 billion from charity gambling or
special events and $3.3 billion from business sources.13
12
The data represent information in tax returns for the 2012-13 year processed by the ATO as at 31 October
2015. It also includes some additional data supplied directly by the ATO to ACPNS researchers. 13
The Prime Minister’s Community Business Partnership. (2005). Giving Australia: Research on philanthropy in
Australia. Retrieved March 30, 2015 from http://www.qut.edu.au/business/about/research-centres/australian-
centre-for-philanthropy-and-nonprofit-studies/publications-and-resources
29 Working Paper No. 69
3.1 Individual Taxpayer Donations
Table 1 in the Appendix to this paper (which forms the basis of Charts 6 to 11 ) contains data
relating to the amount of tax deductible donations made to DGRs and claimed by individual
Australian taxpayers in their 2013-14 income tax return and revised data for previous
income years.14
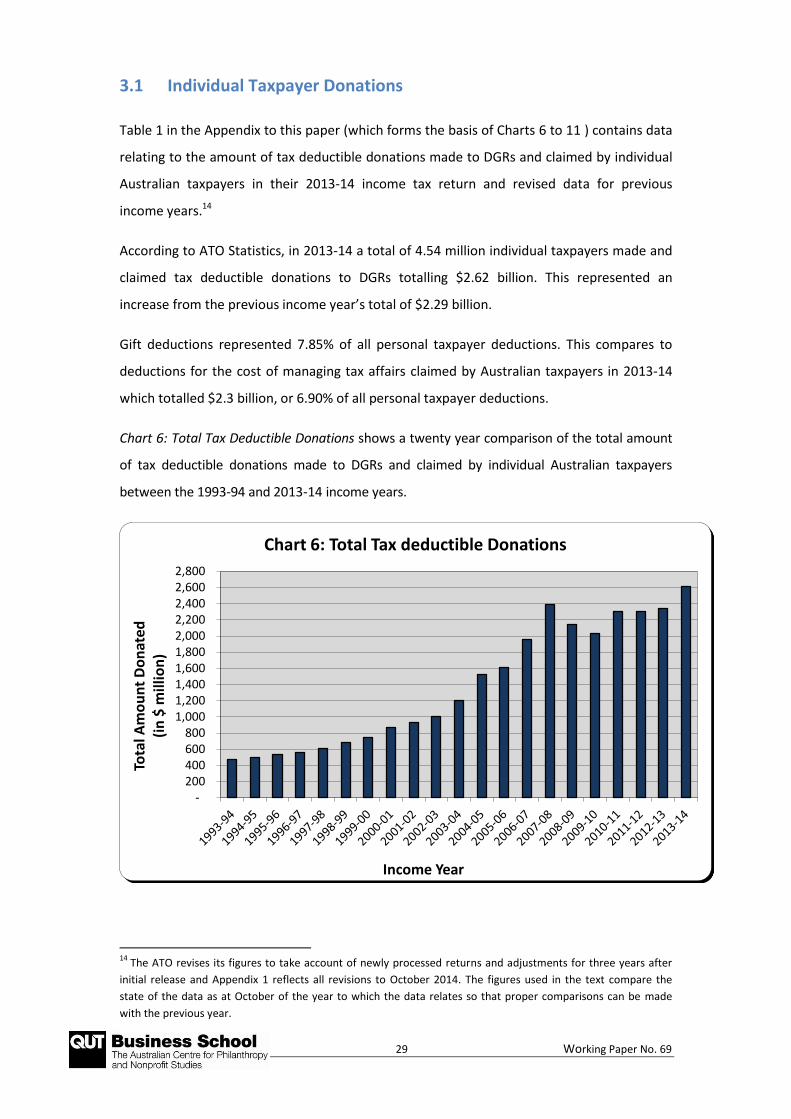
According to ATO Statistics, in 2013-14 a total of 4.54 million individual taxpayers made and
claimed tax deductible donations to DGRs totalling $2.62 billion. This represented an
increase from the previous income year’s total of $2.29 billion.
Gift deductions represented 7.85% of all personal taxpayer deductions. This compares to
deductions for the cost of managing tax affairs claimed by Australian taxpayers in 2013-14
which totalled $2.3 billion, or 6.90% of all personal taxpayer deductions.
Chart 6: Total Tax Deductible Donations shows a twenty year comparison of the total amount
of tax deductible donations made to DGRs and claimed by individual Australian taxpayers
between the 1993-94 and 2013-14 income years.
14
The ATO revises its figures to take account of newly processed returns and adjustments for three years after
initial release and Appendix 1 reflects all revisions to October 2014. The figures used in the text compare the
state of the data as at October of the year to which the data relates so that proper comparisons can be made
with the previous year.
- 200 400 600 800
1,000 1,200 1,400 1,600 1,800 2,000 2,200 2,400 2,600 2,800
Tota
l Am
ou
nt
Do
nat
ed
(in
$ m
illio
n)
Income Year
Chart 6: Total Tax deductible Donations
30 Working Paper No. 69
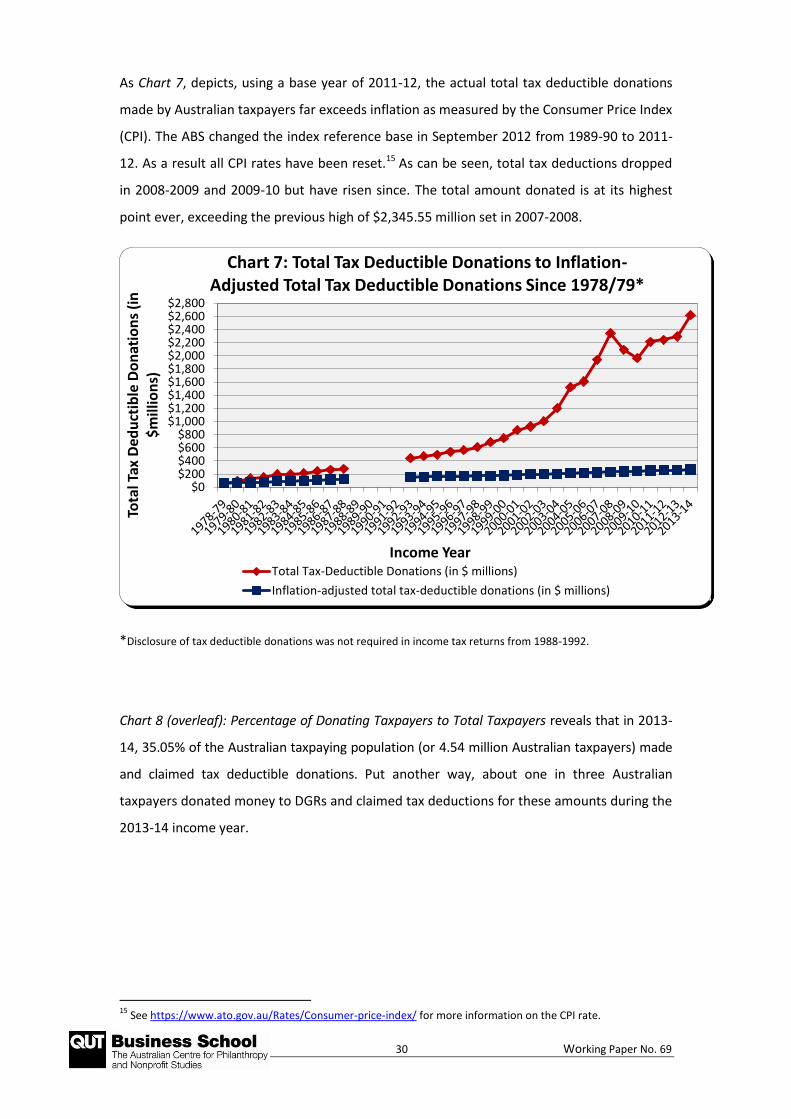
As Chart 7, depicts, using a base year of 2011-12, the actual total tax deductible donations
made by Australian taxpayers far exceeds inflation as measured by the Consumer Price Index
(CPI). The ABS changed the index reference base in September 2012 from 1989-90 to 2011-
12. As a result all CPI rates have been reset.15 As can be seen, total tax deductions dropped
in 2008-2009 and 2009-10 but have risen since. The total amount donated is at its highest
point ever, exceeding the previous high of $2,345.55 million set in 2007-2008.
*Disclosure of tax deductible donations was not required in income tax returns from 1988-1992.
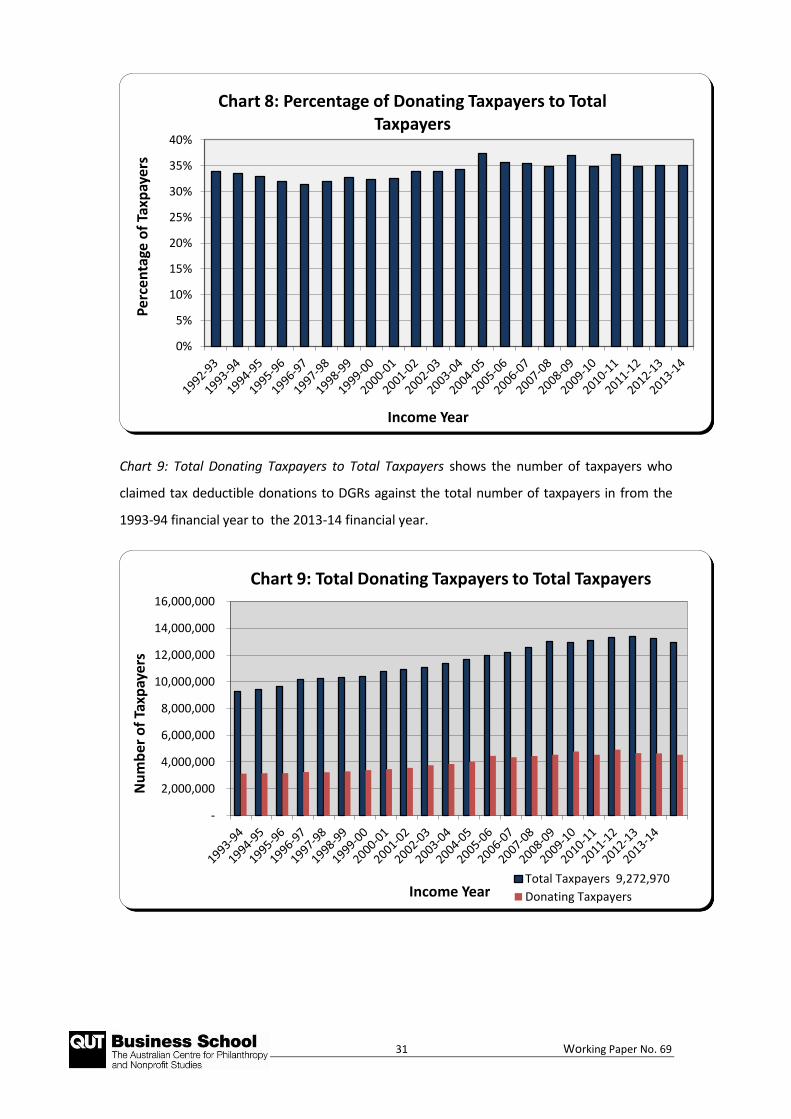
Chart 8 (overleaf): Percentage of Donating Taxpayers to Total Taxpayers reveals that in 2013-
14, 35.05% of the Australian taxpaying population (or 4.54 million Australian taxpayers) made
and claimed tax deductible donations. Put another way, about one in three Australian
taxpayers donated money to DGRs and claimed tax deductions for these amounts during the
2013-14 income year.
15
See https://www.ato.gov.au/Rates/Consumer-price-index/ for more information on the CPI rate.
$0$200$400$600$800
$1,000$1,200$1,400$1,600$1,800$2,000$2,200$2,400$2,600$2,800
Tota
l Tax
Ded
uct
ible
Do
nat
ion
s (i
n
$m
illio
ns)
Income Year
Chart 7: Total Tax Deductible Donations to Inflation-Adjusted Total Tax Deductible Donations Since 1978/79*
Total Tax-Deductible Donations (in $ millions)
Inflation-adjusted total tax-deductible donations (in $ millions)
31 Working Paper No. 69
Chart 9: Total Donating Taxpayers to Total Taxpayers shows the number of taxpayers who
claimed tax deductible donations to DGRs against the total number of taxpayers in from the
1993-94 financial year to the 2013-14 financial year.
0%
5%
10%
15%
20%
25%
30%
35%
40%P
erce
nta
ge o
f Ta
xpay
ers
Income Year
Chart 8: Percentage of Donating Taxpayers to Total Taxpayers
-
2,000,000
4,000,000
6,000,000
8,000,000
10,000,000
12,000,000
14,000,000
16,000,000
Nu
mb
er o
f Ta
xpay
ers
Income Year
Chart 9: Total Donating Taxpayers to Total Taxpayers
Total Taxpayers 9,272,970
Donating Taxpayers
32 Working Paper No. 69
Chart 9 reveals that since 1993-94, the number of donating Australian taxpayers has increased
from 3,156,223 to 4,544,381, whilst, in comparison, the total number of individuals (both
taxable and non-taxable) has increased from 9,391,090 to 12,964,285 for the same period.
This leads to the conclusion that the number of donating taxpayers (33.61% in 1993-94 to
35.50% in 2013-14) is more than keeping pace with the total numerical growth of Australian
individual taxpayers. The number of taxpayers claiming a deductible gift in 2013-14 increased
by 188,220 from 2012-13, and the total amount donated increased by $322 million (or
14.08%).
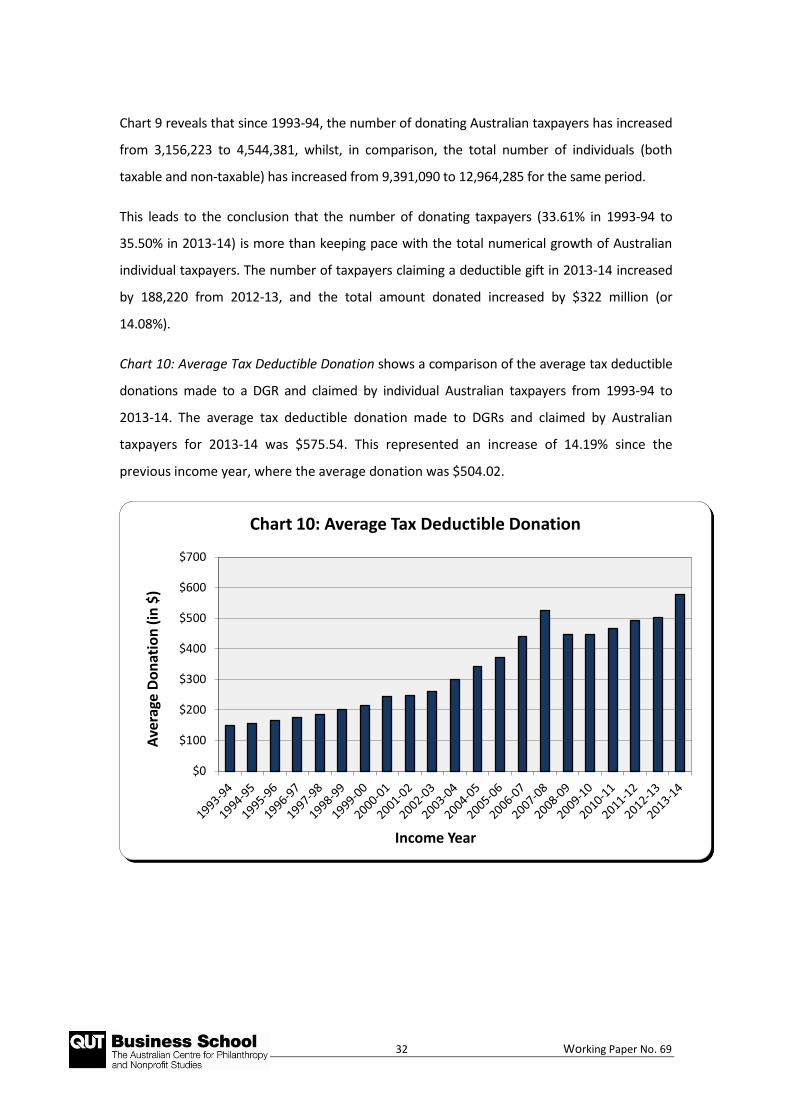
Chart 10: Average Tax Deductible Donation shows a comparison of the average tax deductible
donations made to a DGR and claimed by individual Australian taxpayers from 1993-94 to
2013-14. The average tax deductible donation made to DGRs and claimed by Australian
taxpayers for 2013-14 was $575.54. This represented an increase of 14.19% since the
previous income year, where the average donation was $504.02.
$0
$100
$200
$300
$400
$500
$600
$700
Ave
rage
Do
nat
ion
(in
$)
Income Year
Chart 10: Average Tax Deductible Donation
33 Working Paper No. 69
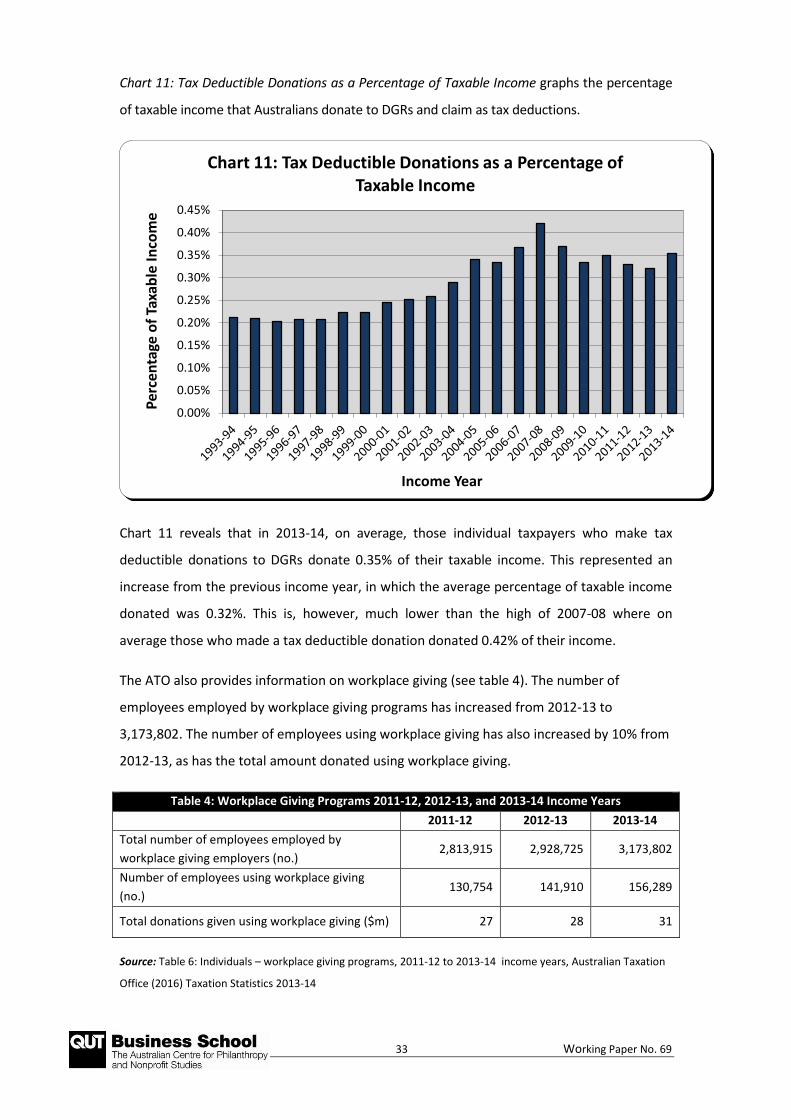
Chart 11: Tax Deductible Donations as a Percentage of Taxable Income graphs the percentage
of taxable income that Australians donate to DGRs and claim as tax deductions.
Chart 11 reveals that in 2013-14, on average, those individual taxpayers who make tax
deductible donations to DGRs donate 0.35% of their taxable income. This represented an
increase from the previous income year, in which the average percentage of taxable income
donated was 0.32%. This is, however, much lower than the high of 2007-08 where on
average those who made a tax deductible donation donated 0.42% of their income.
The ATO also provides information on workplace giving (see table 4). The number of
employees employed by workplace giving programs has increased from 2012-13 to
3,173,802. The number of employees using workplace giving has also increased by 10% from
2012-13, as has the total amount donated using workplace giving.
Table 4: Workplace Giving Programs 2011-12, 2012-13, and 2013-14 Income Years
2011-12 2012-13 2013-14
Total number of employees employed by
workplace giving employers (no.) 2,813,915 2,928,725 3,173,802
Number of employees using workplace giving
(no.) 130,754 141,910 156,289
Total donations given using workplace giving ($m) 27 28 31
Source: Table 6: Individuals – workplace giving programs, 2011-12 to 2013-14 income years, Australian Taxation
Office (2016) Taxation Statistics 2013-14
0.00%
0.05%
0.10%
0.15%
0.20%
0.25%
0.30%
0.35%
0.40%
0.45%
Per
cen
tage
of
Taxa
ble
In
com
e
Income Year
Chart 11: Tax Deductible Donations as a Percentage of Taxable Income
34 Working Paper No. 69
3.1.1 Summary and Discussion
Based on the data extracted from Table 1 in the Appendix (comprising Charts 6 to 11), our
analysis reveals that Australia’s giving has increased from the previous year. The overall
amount donated has reach an all-time high of $2.62 billion as has the average tax deductible
donation ($575.54). The percentage of taxpayers donating has slightly decreased, but the
percentage of income donated has increased by 0.03%.
35 Working Paper No. 69
3.2 Individual Taxpayer Donations by GENDER
Table 2 in the Appendix to this paper (which forms the basis of Charts 12 to 18) contains
data relating to the amount of tax deductible donations made to DGRs and claimed by
individual Australian taxpayers in their 2013-14 income tax return according to gender.
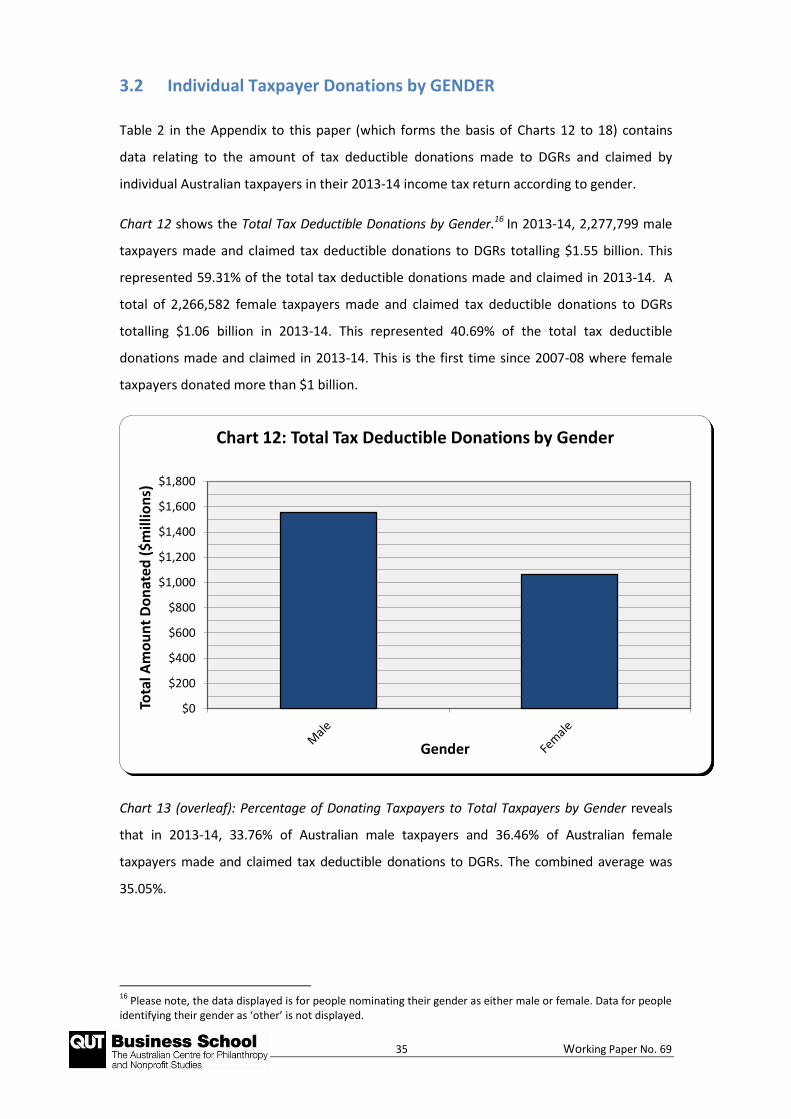
Chart 12 shows the Total Tax Deductible Donations by Gender.16 In 2013-14, 2,277,799 male
taxpayers made and claimed tax deductible donations to DGRs totalling $1.55 billion. This
represented 59.31% of the total tax deductible donations made and claimed in 2013-14. A
total of 2,266,582 female taxpayers made and claimed tax deductible donations to DGRs
totalling $1.06 billion in 2013-14. This represented 40.69% of the total tax deductible
donations made and claimed in 2013-14. This is the first time since 2007-08 where female
taxpayers donated more than $1 billion.
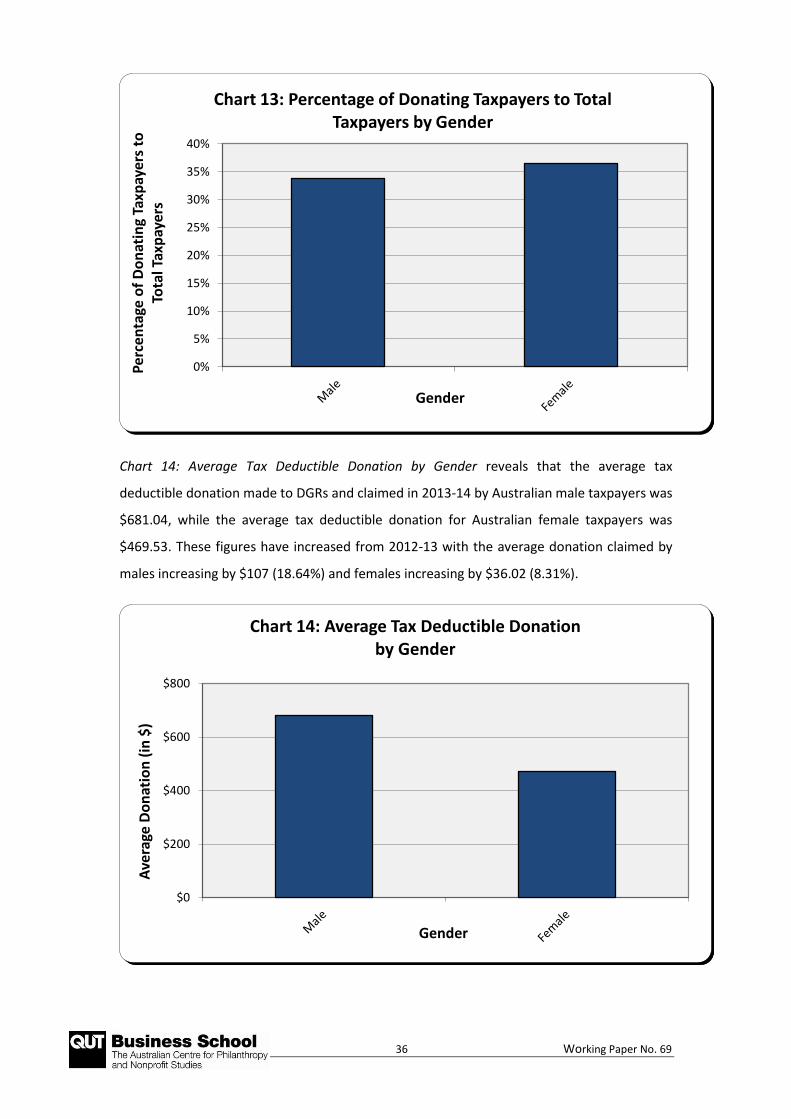
Chart 13 (overleaf): Percentage of Donating Taxpayers to Total Taxpayers by Gender reveals
that in 2013-14, 33.76% of Australian male taxpayers and 36.46% of Australian female
taxpayers made and claimed tax deductible donations to DGRs. The combined average was
35.05%.
16
Please note, the data displayed is for people nominating their gender as either male or female. Data for people identifying their gender as ‘other’ is not displayed.
$0
$200
$400
$600
$800
$1,000
$1,200
$1,400
$1,600
$1,800
Tota
l Am
ou
nt
Do
nat
ed (
$m
illio
ns)
Gender
Chart 12: Total Tax Deductible Donations by Gender
36 Working Paper No. 69
Chart 14: Average Tax Deductible Donation by Gender reveals that the average tax
deductible donation made to DGRs and claimed in 2013-14 by Australian male taxpayers was
$681.04, while the average tax deductible donation for Australian female taxpayers was
$469.53. These figures have increased from 2012-13 with the average donation claimed by
males increasing by $107 (18.64%) and females increasing by $36.02 (8.31%).
0%
5%
10%
15%
20%
25%
30%
35%
40%P
erce
nta
ge o
f D
on
atin
g Ta
xpay
ers
to
Tota
l Tax
pay
ers
Gender
Chart 13: Percentage of Donating Taxpayers to Total Taxpayers by Gender
$0
$200
$400
$600
$800
Ave
rage
Do
nat
ion
(in
$)
Gender
Chart 14: Average Tax Deductible Donation by Gender
37 Working Paper No. 69
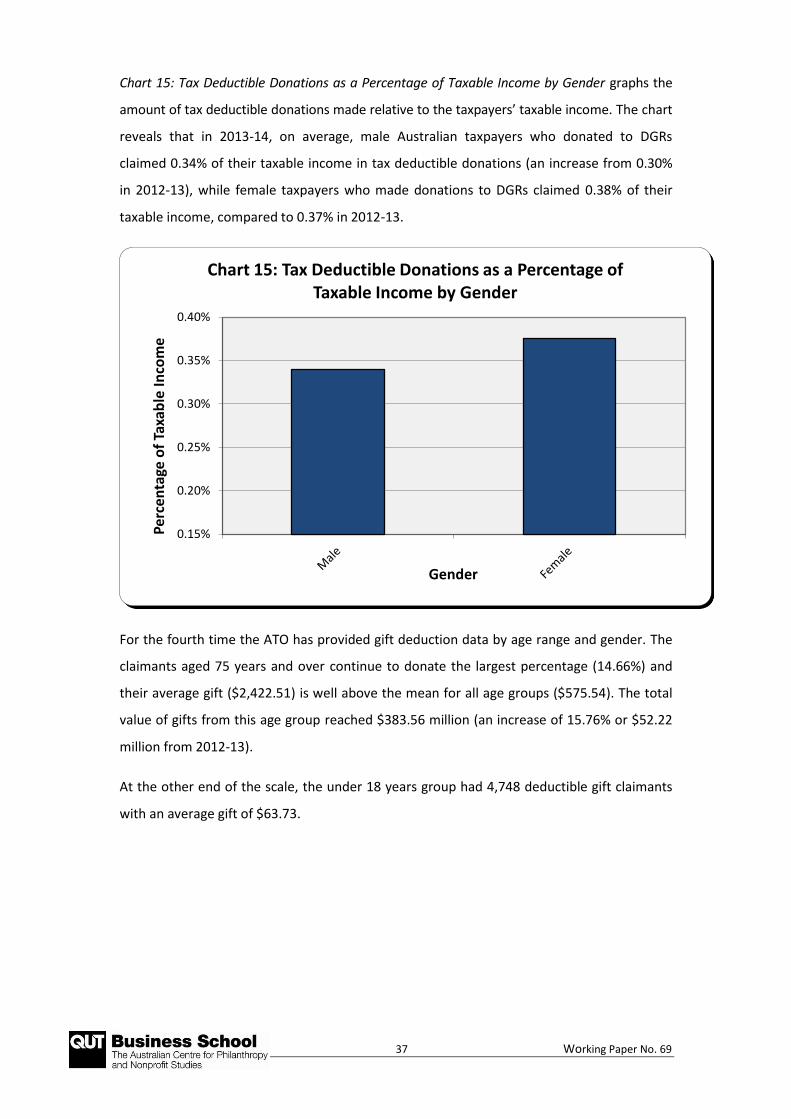
Chart 15: Tax Deductible Donations as a Percentage of Taxable Income by Gender graphs the
amount of tax deductible donations made relative to the taxpayers’ taxable income. The chart
reveals that in 2013-14, on average, male Australian taxpayers who donated to DGRs
claimed 0.34% of their taxable income in tax deductible donations (an increase from 0.30%
in 2012-13), while female taxpayers who made donations to DGRs claimed 0.38% of their
taxable income, compared to 0.37% in 2012-13.
For the fourth time the ATO has provided gift deduction data by age range and gender. The
claimants aged 75 years and over continue to donate the largest percentage (14.66%) and
their average gift ($2,422.51) is well above the mean for all age groups ($575.54). The total
value of gifts from this age group reached $383.56 million (an increase of 15.76% or $52.22
million from 2012-13).
At the other end of the scale, the under 18 years group had 4,748 deductible gift claimants
with an average gift of $63.73.
0.15%
0.20%
0.25%
0.30%
0.35%
0.40%
Per
cen
tage
of
Taxa
ble
In
com
e
Gender
Chart 15: Tax Deductible Donations as a Percentage of Taxable Income by Gender
38 Working Paper No. 69
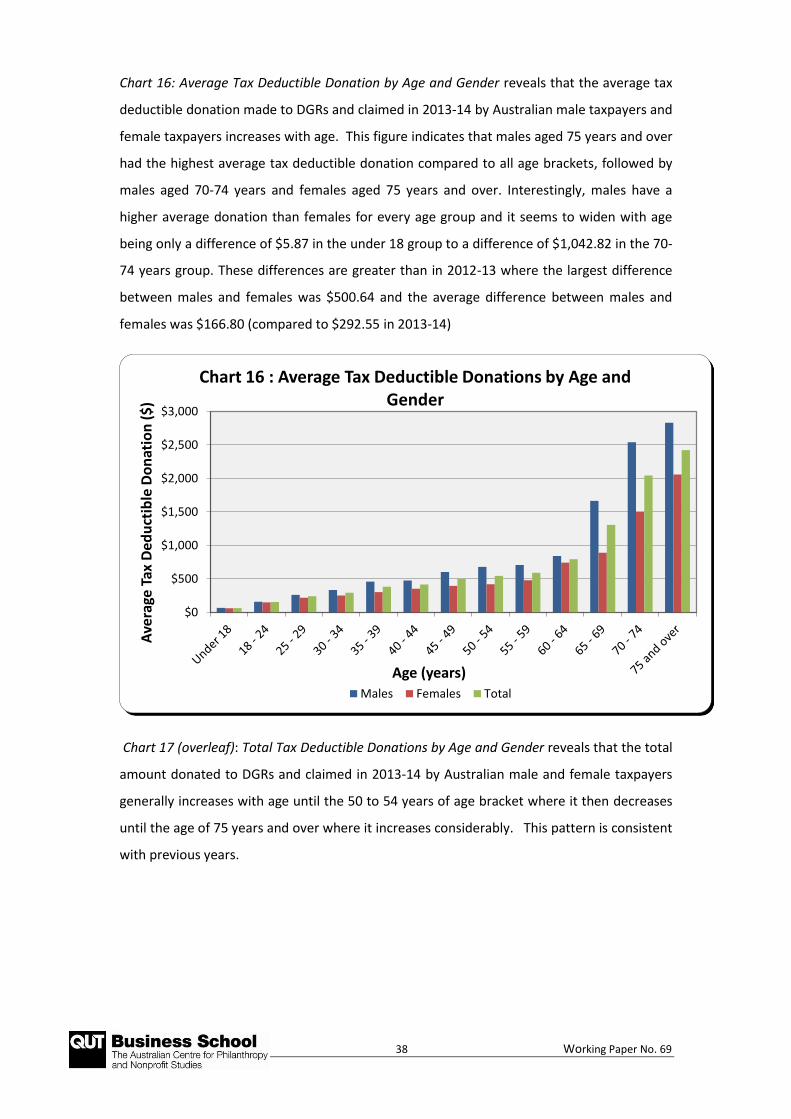
Chart 16: Average Tax Deductible Donation by Age and Gender reveals that the average tax
deductible donation made to DGRs and claimed in 2013-14 by Australian male taxpayers and
female taxpayers increases with age. This figure indicates that males aged 75 years and over
had the highest average tax deductible donation compared to all age brackets, followed by
males aged 70-74 years and females aged 75 years and over. Interestingly, males have a
higher average donation than females for every age group and it seems to widen with age
being only a difference of $5.87 in the under 18 group to a difference of $1,042.82 in the 70-
74 years group. These differences are greater than in 2012-13 where the largest difference
between males and females was $500.64 and the average difference between males and
females was $166.80 (compared to $292.55 in 2013-14)
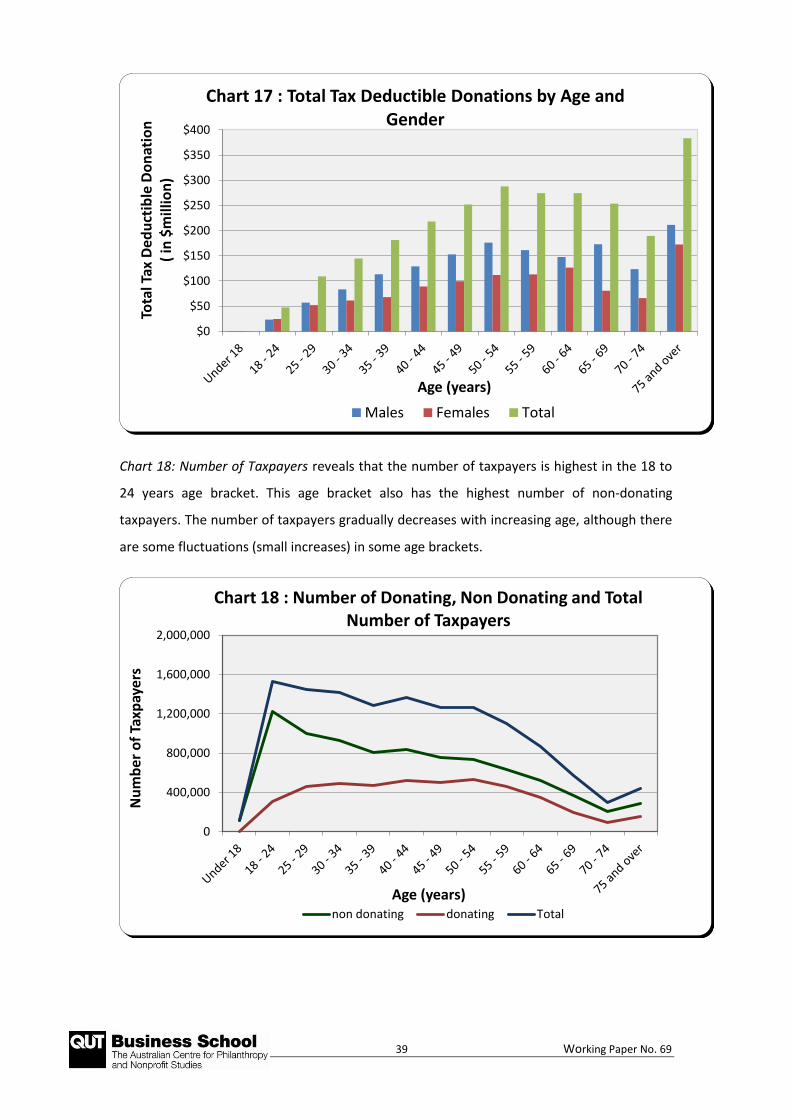
Chart 17 (overleaf): Total Tax Deductible Donations by Age and Gender reveals that the total
amount donated to DGRs and claimed in 2013-14 by Australian male and female taxpayers
generally increases with age until the 50 to 54 years of age bracket where it then decreases
until the age of 75 years and over where it increases considerably. This pattern is consistent
with previous years.
$0
$500
$1,000
$1,500
$2,000
$2,500
$3,000
Ave
rage
Tax
Ded
uct
ible
Do
nat
ion
($
)
Age (years)
Chart 16 : Average Tax Deductible Donations by Age and Gender
Males Females Total
39 Working Paper No. 69
Chart 18: Number of Taxpayers reveals that the number of taxpayers is highest in the 18 to
24 years age bracket. This age bracket also has the highest number of non-donating
taxpayers. The number of taxpayers gradually decreases with increasing age, although there
are some fluctuations (small increases) in some age brackets.
$0
$50
$100
$150
$200
$250
$300
$350
$400To
tal T
ax D
edu
ctib
le D
on
atio
n
( in
$m
illio
n)
Age (years)
Chart 17 : Total Tax Deductible Donations by Age and Gender
Males Females Total
0
400,000
800,000
1,200,000
1,600,000
2,000,000
Nu
mb
er o
f Ta
xpay
ers
Age (years)
Chart 18 : Number of Donating, Non Donating and Total Number of Taxpayers
non donating donating Total
40 Working Paper No. 69
3.2.1 Summary and Discussion
Based on the data extracted from Table 2 in the Appendix (forming the basis of Charts to 12
to 18), our analysis reveals that there is little difference in the amount of tax deductible
giving between male and female Australian taxpayers.
Male taxpayers in 2013-14 donated more in monetary terms than female taxpayers (both in
terms of total and average tax deductible donations). When expressed as a percentage of
their respective taxable incomes, females donated more to DGRs than males (0.38% for
females and 0.34% for males). This is consistent with previous years.
In terms of donating taxpayers as a percentage of total taxpayers expressed by gender, more
females claimed a tax deductible donation (36.46%) compared to males (33.76%). The
combined average was 35.05%.
41 Working Paper No. 69
3.3 Individual Taxpayer Donations by STATE OF RESIDENCE
Table 3 in the Appendix to this paper (which forms the basis of Charts 19 to 22) contains
data relating to the amount of tax deductible donations made to DGRs and claimed by
individual Australian taxpayers in their 2013-14 income tax returns according to their state
of residence.17
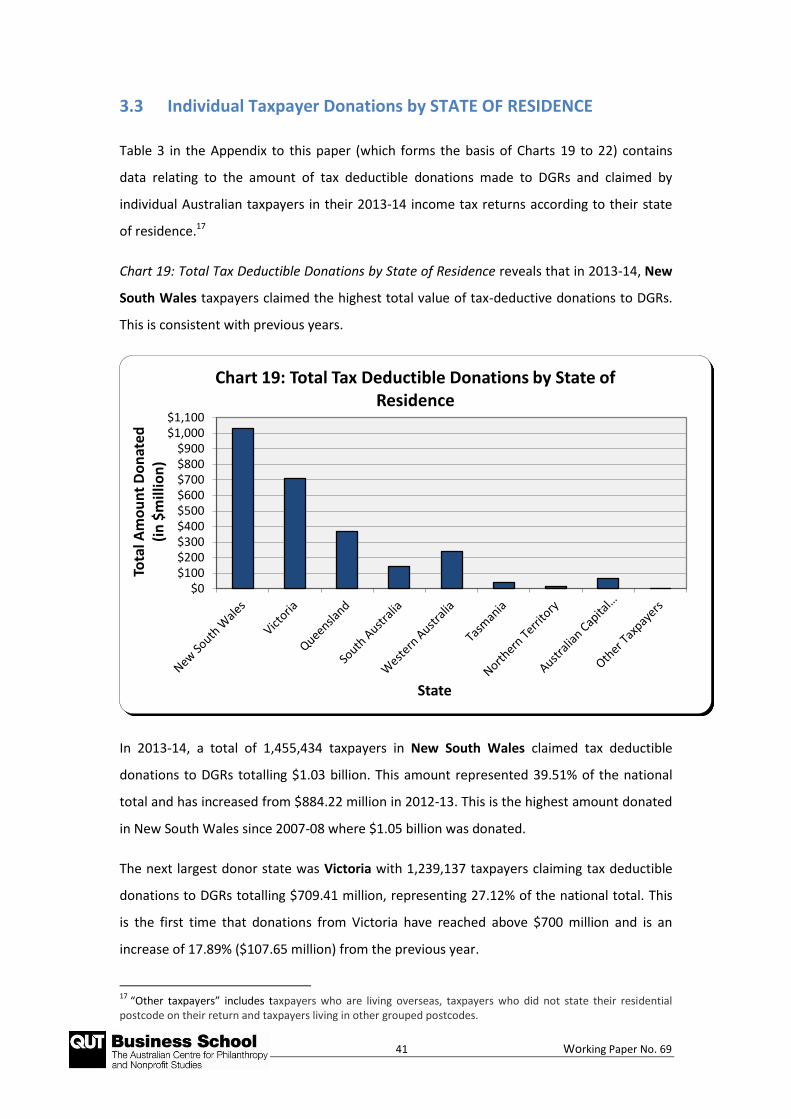
Chart 19: Total Tax Deductible Donations by State of Residence reveals that in 2013-14, New
South Wales taxpayers claimed the highest total value of tax-deductive donations to DGRs.
This is consistent with previous years.
In 2013-14, a total of 1,455,434 taxpayers in New South Wales claimed tax deductible
donations to DGRs totalling $1.03 billion. This amount represented 39.51% of the national
total and has increased from $884.22 million in 2012-13. This is the highest amount donated
in New South Wales since 2007-08 where $1.05 billion was donated.
The next largest donor state was Victoria with 1,239,137 taxpayers claiming tax deductible
donations to DGRs totalling $709.41 million, representing 27.12% of the national total. This
is the first time that donations from Victoria have reached above $700 million and is an
increase of 17.89% ($107.65 million) from the previous year.
17
“Other taxpayers” includes taxpayers who are living overseas, taxpayers who did not state their residential postcode on their return and taxpayers living in other grouped postcodes.
$0$100$200$300$400$500$600$700$800$900
$1,000$1,100
Tota
l Am
ou
nt
Do
nat
ed
(in
$m
illio
n)
State
Chart 19: Total Tax Deductible Donations by State of Residence
42 Working Paper No. 69
Overall, 838,832 Queensland taxpayers donated a total of $365.96 million (representing
13.99% of the national total). Together, these three states accounted for 80.62% of total tax
deductible donations made to DGRs in 2013-14.
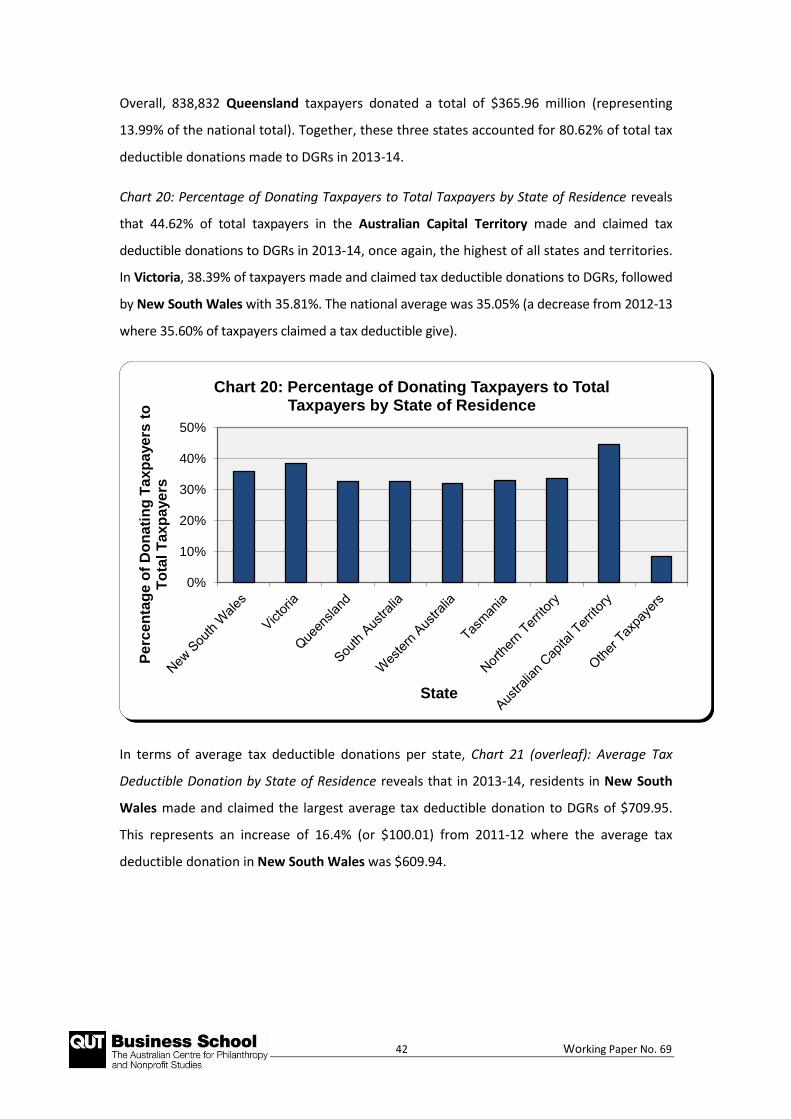
Chart 20: Percentage of Donating Taxpayers to Total Taxpayers by State of Residence reveals
that 44.62% of total taxpayers in the Australian Capital Territory made and claimed tax
deductible donations to DGRs in 2013-14, once again, the highest of all states and territories.
In Victoria, 38.39% of taxpayers made and claimed tax deductible donations to DGRs, followed
by New South Wales with 35.81%. The national average was 35.05% (a decrease from 2012-13
where 35.60% of taxpayers claimed a tax deductible give).
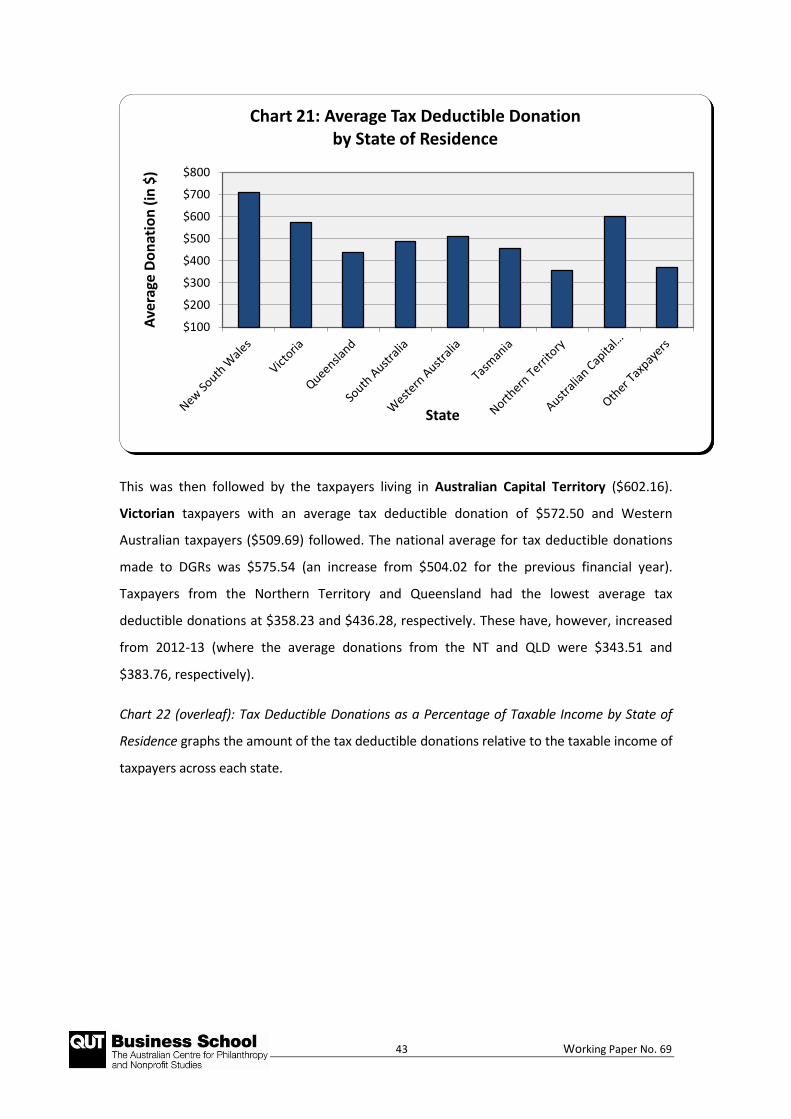
In terms of average tax deductible donations per state, Chart 21 (overleaf): Average Tax
Deductible Donation by State of Residence reveals that in 2013-14, residents in New South
Wales made and claimed the largest average tax deductible donation to DGRs of $709.95.
This represents an increase of 16.4% (or $100.01) from 2011-12 where the average tax
deductible donation in New South Wales was $609.94.
0%
10%
20%
30%
40%
50%
Pe
rce
nta
ge
of
Do
na
tin
g T
axp
aye
rs t
o
To
tal T
axp
aye
rs
State
Chart 20: Percentage of Donating Taxpayers to Total Taxpayers by State of Residence
43 Working Paper No. 69
This was then followed by the taxpayers living in Australian Capital Territory ($602.16).
Victorian taxpayers with an average tax deductible donation of $572.50 and Western
Australian taxpayers ($509.69) followed. The national average for tax deductible donations
made to DGRs was $575.54 (an increase from $504.02 for the previous financial year).
Taxpayers from the Northern Territory and Queensland had the lowest average tax
deductible donations at $358.23 and $436.28, respectively. These have, however, increased
from 2012-13 (where the average donations from the NT and QLD were $343.51 and
$383.76, respectively).
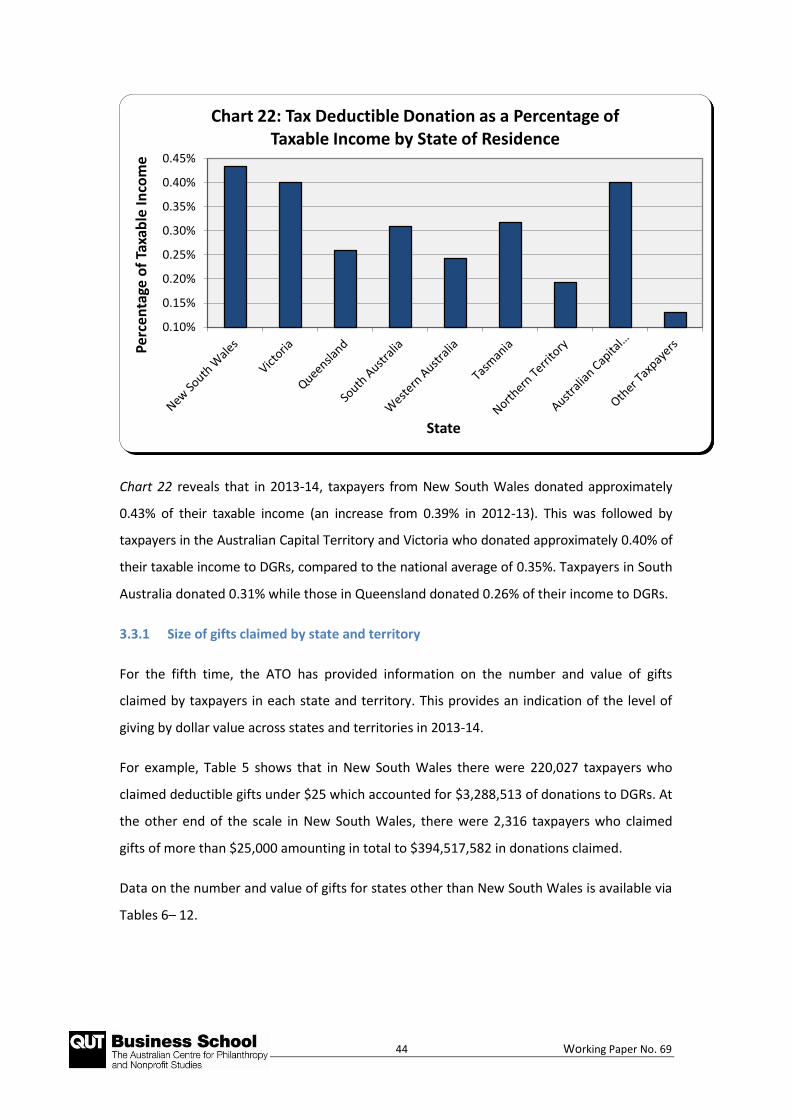
Chart 22 (overleaf): Tax Deductible Donations as a Percentage of Taxable Income by State of
Residence graphs the amount of the tax deductible donations relative to the taxable income of
taxpayers across each state.
$100
$200
$300
$400
$500
$600
$700
$800
Ave
rage
Do
nat
ion
(in
$)
State
Chart 21: Average Tax Deductible Donation by State of Residence
44 Working Paper No. 69
Chart 22 reveals that in 2013-14, taxpayers from New South Wales donated approximately
0.43% of their taxable income (an increase from 0.39% in 2012-13). This was followed by
taxpayers in the Australian Capital Territory and Victoria who donated approximately 0.40% of
their taxable income to DGRs, compared to the national average of 0.35%. Taxpayers in South
Australia donated 0.31% while those in Queensland donated 0.26% of their income to DGRs.
3.3.1 Size of gifts claimed by state and territory
For the fifth time, the ATO has provided information on the number and value of gifts
claimed by taxpayers in each state and territory. This provides an indication of the level of
giving by dollar value across states and territories in 2013-14.
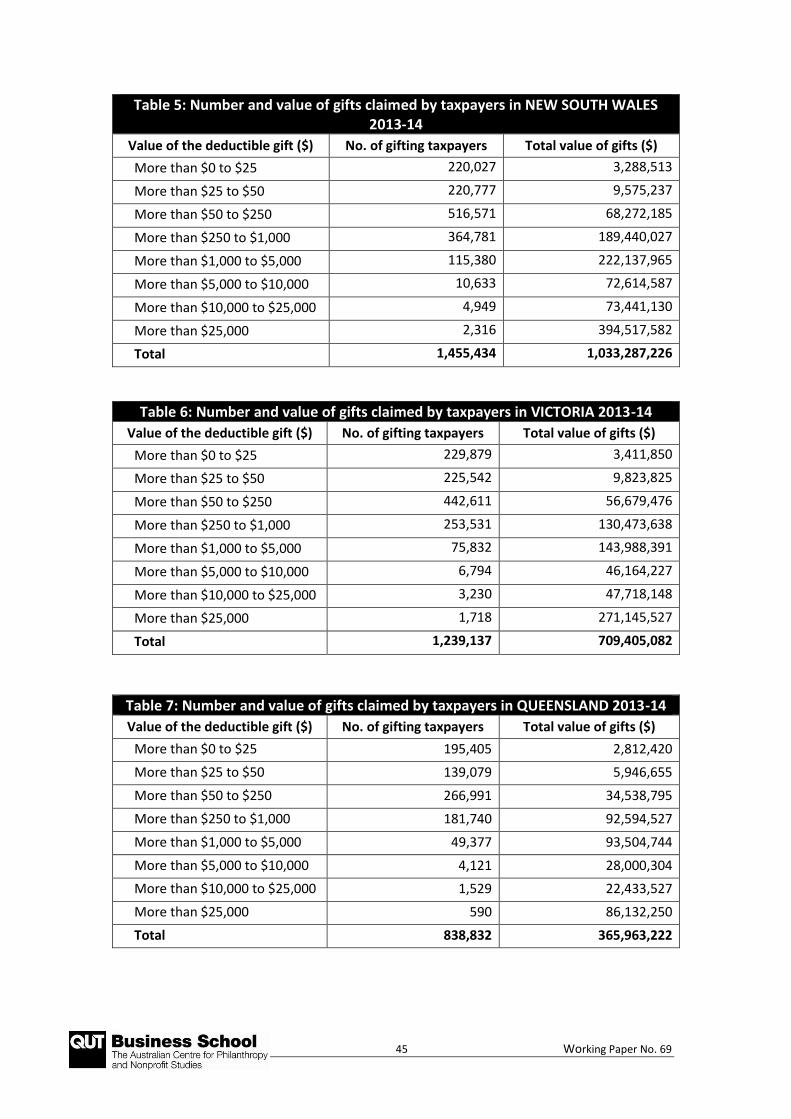
For example, Table 5 shows that in New South Wales there were 220,027 taxpayers who
claimed deductible gifts under $25 which accounted for $3,288,513 of donations to DGRs. At
the other end of the scale in New South Wales, there were 2,316 taxpayers who claimed
gifts of more than $25,000 amounting in total to $394,517,582 in donations claimed.
Data on the number and value of gifts for states other than New South Wales is available via
Tables 6– 12.
0.10%
0.15%
0.20%
0.25%
0.30%
0.35%
0.40%
0.45%
Per
cen
tage
of
Taxa
ble
In
com
e
State
Chart 22: Tax Deductible Donation as a Percentage of Taxable Income by State of Residence
45 Working Paper No. 69
Table 5: Number and value of gifts claimed by taxpayers in NEW SOUTH WALES 2013-14
Value of the deductible gift ($) No. of gifting taxpayers Total value of gifts ($)
More than $0 to $25 220,027 3,288,513
More than $25 to $50 220,777 9,575,237
More than $50 to $250 516,571 68,272,185
More than $250 to $1,000 364,781 189,440,027
More than $1,000 to $5,000 115,380 222,137,965
More than $5,000 to $10,000 10,633 72,614,587
More than $10,000 to $25,000 4,949 73,441,130
More than $25,000 2,316 394,517,582
Total 1,455,434 1,033,287,226
Table 6: Number and value of gifts claimed by taxpayers in VICTORIA 2013-14
Value of the deductible gift ($) No. of gifting taxpayers Total value of gifts ($)
More than $0 to $25 229,879 3,411,850
More than $25 to $50 225,542 9,823,825
More than $50 to $250 442,611 56,679,476
More than $250 to $1,000 253,531 130,473,638
More than $1,000 to $5,000 75,832 143,988,391
More than $5,000 to $10,000 6,794 46,164,227
More than $10,000 to $25,000 3,230 47,718,148
More than $25,000 1,718 271,145,527
Total 1,239,137 709,405,082
Table 7: Number and value of gifts claimed by taxpayers in QUEENSLAND 2013-14
Value of the deductible gift ($) No. of gifting taxpayers Total value of gifts ($)
More than $0 to $25 195,405 2,812,420
More than $25 to $50 139,079 5,946,655
More than $50 to $250 266,991 34,538,795
More than $250 to $1,000 181,740 92,594,527
More than $1,000 to $5,000 49,377 93,504,744
More than $5,000 to $10,000 4,121 28,000,304
More than $10,000 to $25,000 1,529 22,433,527
More than $25,000 590 86,132,250
Total 838,832 365,963,222
46 Working Paper No. 69
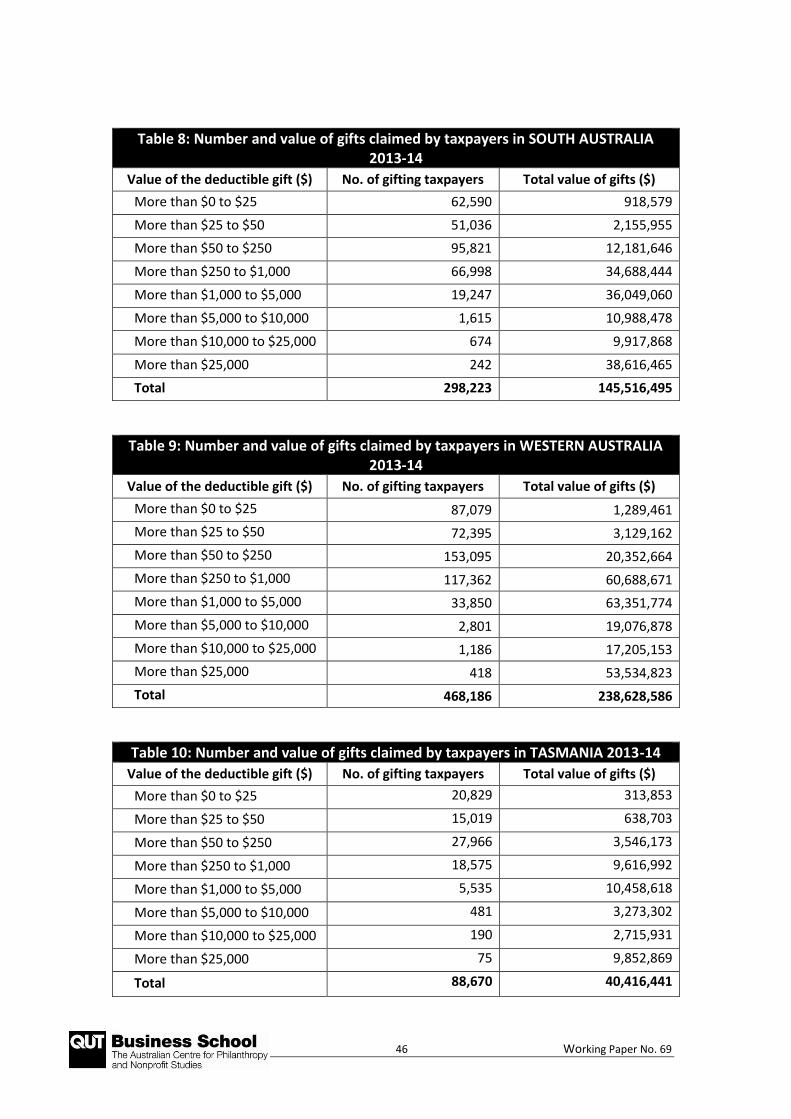
Table 8: Number and value of gifts claimed by taxpayers in SOUTH AUSTRALIA 2013-14
Value of the deductible gift ($) No. of gifting taxpayers Total value of gifts ($)
More than $0 to $25 62,590 918,579
More than $25 to $50 51,036 2,155,955
More than $50 to $250 95,821 12,181,646
More than $250 to $1,000 66,998 34,688,444
More than $1,000 to $5,000 19,247 36,049,060
More than $5,000 to $10,000 1,615 10,988,478
More than $10,000 to $25,000 674 9,917,868
More than $25,000 242 38,616,465
Total 298,223 145,516,495
Table 9: Number and value of gifts claimed by taxpayers in WESTERN AUSTRALIA 2013-14
Value of the deductible gift ($) No. of gifting taxpayers Total value of gifts ($)
More than $0 to $25 87,079 1,289,461
More than $25 to $50 72,395 3,129,162
More than $50 to $250 153,095 20,352,664
More than $250 to $1,000 117,362 60,688,671
More than $1,000 to $5,000 33,850 63,351,774
More than $5,000 to $10,000 2,801 19,076,878
More than $10,000 to $25,000 1,186 17,205,153
More than $25,000 418 53,534,823
Total 468,186 238,628,586
Table 10: Number and value of gifts claimed by taxpayers in TASMANIA 2013-14
Value of the deductible gift ($) No. of gifting taxpayers Total value of gifts ($)
More than $0 to $25 20,829 313,853
More than $25 to $50 15,019 638,703
More than $50 to $250 27,966 3,546,173
More than $250 to $1,000 18,575 9,616,992
More than $1,000 to $5,000 5,535 10,458,618
More than $5,000 to $10,000 481 3,273,302
More than $10,000 to $25,000 190 2,715,931
More than $25,000 75 9,852,869
Total 88,670 40,416,441
47 Working Paper No. 69
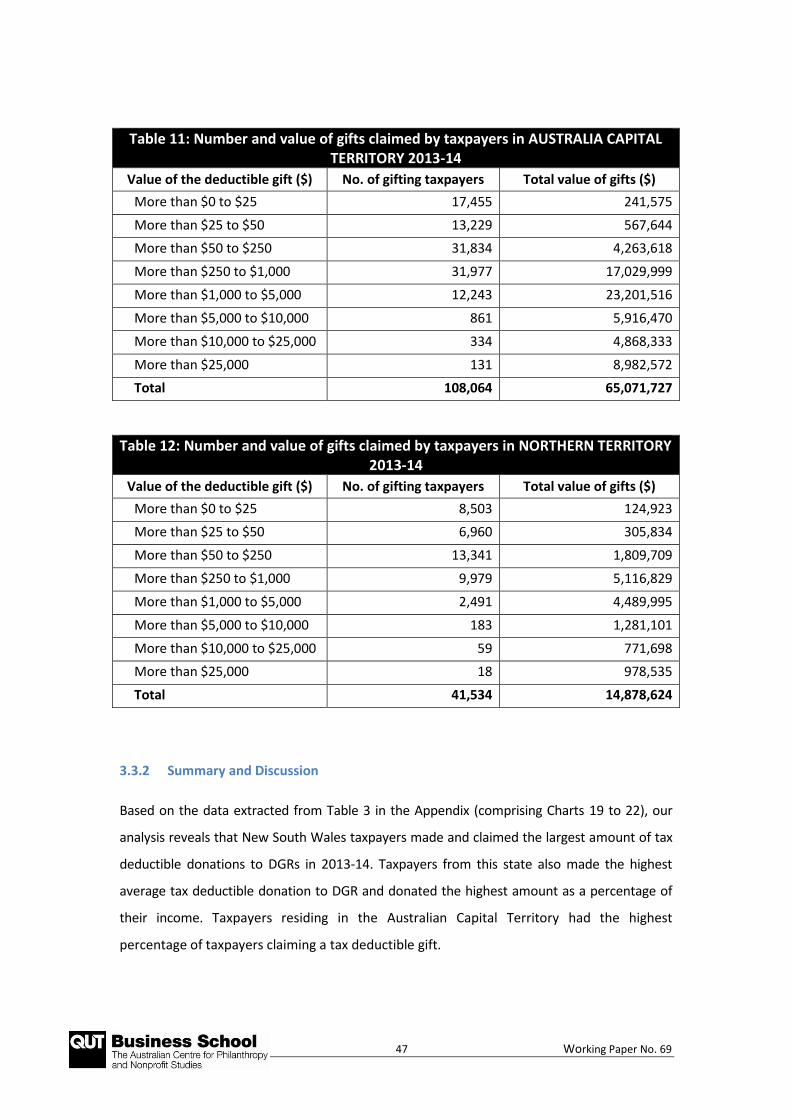
Table 11: Number and value of gifts claimed by taxpayers in AUSTRALIA CAPITAL TERRITORY 2013-14
Value of the deductible gift ($) No. of gifting taxpayers Total value of gifts ($)
More than $0 to $25 17,455 241,575
More than $25 to $50 13,229 567,644
More than $50 to $250 31,834 4,263,618
More than $250 to $1,000 31,977 17,029,999
More than $1,000 to $5,000 12,243 23,201,516
More than $5,000 to $10,000 861 5,916,470
More than $10,000 to $25,000 334 4,868,333
More than $25,000 131 8,982,572
Total 108,064 65,071,727
Table 12: Number and value of gifts claimed by taxpayers in NORTHERN TERRITORY 2013-14
Value of the deductible gift ($) No. of gifting taxpayers Total value of gifts ($)
More than $0 to $25 8,503 124,923
More than $25 to $50 6,960 305,834
More than $50 to $250 13,341 1,809,709
More than $250 to $1,000 9,979 5,116,829
More than $1,000 to $5,000 2,491 4,489,995
More than $5,000 to $10,000 183 1,281,101
More than $10,000 to $25,000 59 771,698
More than $25,000 18 978,535
Total 41,534 14,878,624
3.3.2 Summary and Discussion
Based on the data extracted from Table 3 in the Appendix (comprising Charts 19 to 22), our
analysis reveals that New South Wales taxpayers made and claimed the largest amount of tax
deductible donations to DGRs in 2013-14. Taxpayers from this state also made the highest
average tax deductible donation to DGR and donated the highest amount as a percentage of
their income. Taxpayers residing in the Australian Capital Territory had the highest
percentage of taxpayers claiming a tax deductible gift.
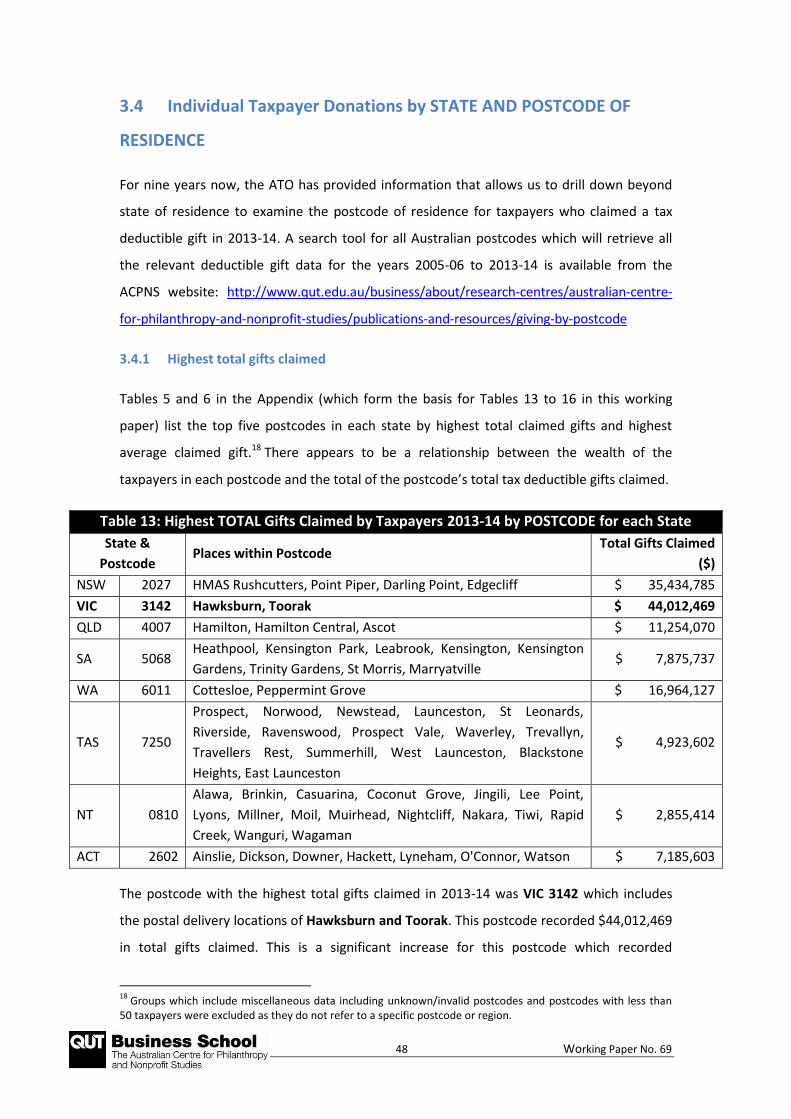
48 Working Paper No. 69
3.4 Individual Taxpayer Donations by STATE AND POSTCODE OF
RESIDENCE
For nine years now, the ATO has provided information that allows us to drill down beyond
state of residence to examine the postcode of residence for taxpayers who claimed a tax
deductible gift in 2013-14. A search tool for all Australian postcodes which will retrieve all
the relevant deductible gift data for the years 2005-06 to 2013-14 is available from the
ACPNS website: http://www.qut.edu.au/business/about/research-centres/australian-centre-
for-philanthropy-and-nonprofit-studies/publications-and-resources/giving-by-postcode
3.4.1 Highest total gifts claimed
Tables 5 and 6 in the Appendix (which form the basis for Tables 13 to 16 in this working
paper) list the top five postcodes in each state by highest total claimed gifts and highest
average claimed gift.18 There appears to be a relationship between the wealth of the
taxpayers in each postcode and the total of the postcode’s total tax deductible gifts claimed.
Table 13: Highest TOTAL Gifts Claimed by Taxpayers 2013-14 by POSTCODE for each State
State &
Postcode Places within Postcode
Total Gifts Claimed
($)
NSW 2027 HMAS Rushcutters, Point Piper, Darling Point, Edgecliff $ 35,434,785
VIC 3142 Hawksburn, Toorak $ 44,012,469
QLD 4007 Hamilton, Hamilton Central, Ascot $ 11,254,070
SA 5068 Heathpool, Kensington Park, Leabrook, Kensington, Kensington
Gardens, Trinity Gardens, St Morris, Marryatville $ 7,875,737
WA 6011 Cottesloe, Peppermint Grove $ 16,964,127
TAS 7250
Prospect, Norwood, Newstead, Launceston, St Leonards,
Riverside, Ravenswood, Prospect Vale, Waverley, Trevallyn,
Travellers Rest, Summerhill, West Launceston, Blackstone
Heights, East Launceston
$ 4,923,602
NT 0810
Alawa, Brinkin, Casuarina, Coconut Grove, Jingili, Lee Point,
Lyons, Millner, Moil, Muirhead, Nightcliff, Nakara, Tiwi, Rapid
Creek, Wanguri, Wagaman
$ 2,855,414
ACT 2602 Ainslie, Dickson, Downer, Hackett, Lyneham, O'Connor, Watson $ 7,185,603
The postcode with the highest total gifts claimed in 2013-14 was VIC 3142 which includes
the postal delivery locations of Hawksburn and Toorak. This postcode recorded $44,012,469
in total gifts claimed. This is a significant increase for this postcode which recorded
18
Groups which include miscellaneous data including unknown/invalid postcodes and postcodes with less than 50 taxpayers were excluded as they do not refer to a specific postcode or region.
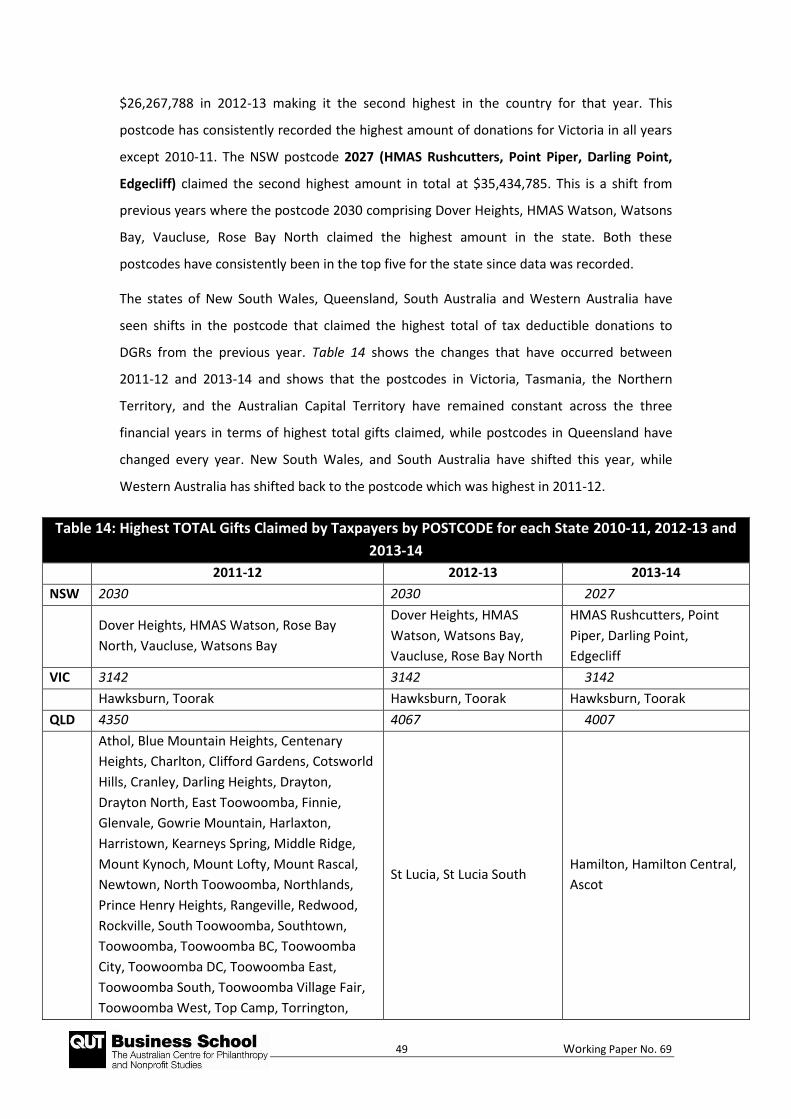
49 Working Paper No. 69
$26,267,788 in 2012-13 making it the second highest in the country for that year. This
postcode has consistently recorded the highest amount of donations for Victoria in all years
except 2010-11. The NSW postcode 2027 (HMAS Rushcutters, Point Piper, Darling Point,
Edgecliff) claimed the second highest amount in total at $35,434,785. This is a shift from
previous years where the postcode 2030 comprising Dover Heights, HMAS Watson, Watsons
Bay, Vaucluse, Rose Bay North claimed the highest amount in the state. Both these
postcodes have consistently been in the top five for the state since data was recorded.
The states of New South Wales, Queensland, South Australia and Western Australia have
seen shifts in the postcode that claimed the highest total of tax deductible donations to
DGRs from the previous year. Table 14 shows the changes that have occurred between
2011-12 and 2013-14 and shows that the postcodes in Victoria, Tasmania, the Northern
Territory, and the Australian Capital Territory have remained constant across the three
financial years in terms of highest total gifts claimed, while postcodes in Queensland have
changed every year. New South Wales, and South Australia have shifted this year, while
Western Australia has shifted back to the postcode which was highest in 2011-12.
Table 14: Highest TOTAL Gifts Claimed by Taxpayers by POSTCODE for each State 2010-11, 2012-13 and
2013-14
2011-12 2012-13 2013-14
NSW 2030 2030 2027
Dover Heights, HMAS Watson, Rose Bay
North, Vaucluse, Watsons Bay
Dover Heights, HMAS
Watson, Watsons Bay,
Vaucluse, Rose Bay North
HMAS Rushcutters, Point
Piper, Darling Point,
Edgecliff
VIC 3142 3142 3142
Hawksburn, Toorak Hawksburn, Toorak Hawksburn, Toorak
QLD 4350 4067 4007
Athol, Blue Mountain Heights, Centenary
Heights, Charlton, Clifford Gardens, Cotsworld
Hills, Cranley, Darling Heights, Drayton,
Drayton North, East Toowoomba, Finnie,
Glenvale, Gowrie Mountain, Harlaxton,
Harristown, Kearneys Spring, Middle Ridge,
Mount Kynoch, Mount Lofty, Mount Rascal,
Newtown, North Toowoomba, Northlands,
Prince Henry Heights, Rangeville, Redwood,
Rockville, South Toowoomba, Southtown,
Toowoomba, Toowoomba BC, Toowoomba
City, Toowoomba DC, Toowoomba East,
Toowoomba South, Toowoomba Village Fair,
Toowoomba West, Top Camp, Torrington,
St Lucia, St Lucia South Hamilton, Hamilton Central,
Ascot
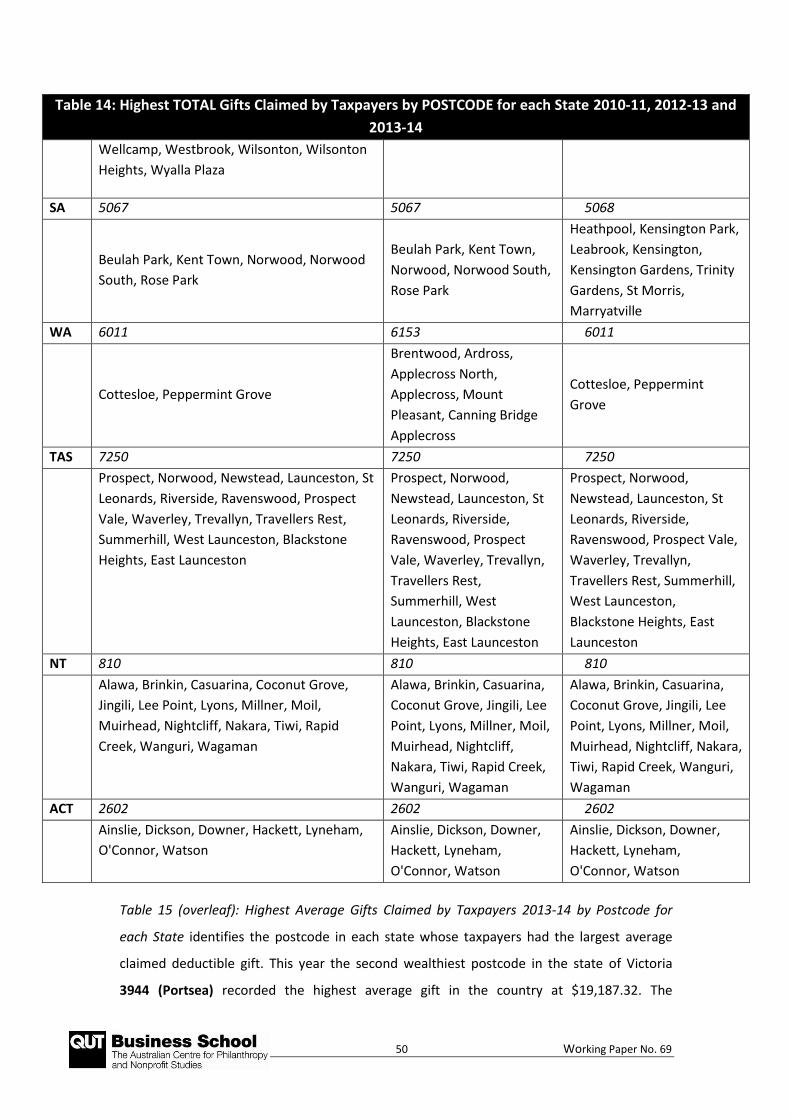
50 Working Paper No. 69
Table 14: Highest TOTAL Gifts Claimed by Taxpayers by POSTCODE for each State 2010-11, 2012-13 and
2013-14
Wellcamp, Westbrook, Wilsonton, Wilsonton
Heights, Wyalla Plaza
SA 5067 5067 5068
Beulah Park, Kent Town, Norwood, Norwood
South, Rose Park
Beulah Park, Kent Town,
Norwood, Norwood South,
Rose Park
Heathpool, Kensington Park,
Leabrook, Kensington,
Kensington Gardens, Trinity
Gardens, St Morris,
Marryatville
WA 6011 6153 6011
Cottesloe, Peppermint Grove
Brentwood, Ardross,
Applecross North,
Applecross, Mount
Pleasant, Canning Bridge
Applecross
Cottesloe, Peppermint
Grove
TAS 7250 7250 7250
Prospect, Norwood, Newstead, Launceston, St
Leonards, Riverside, Ravenswood, Prospect
Vale, Waverley, Trevallyn, Travellers Rest,
Summerhill, West Launceston, Blackstone
Heights, East Launceston
Prospect, Norwood,
Newstead, Launceston, St
Leonards, Riverside,
Ravenswood, Prospect
Vale, Waverley, Trevallyn,
Travellers Rest,
Summerhill, West
Launceston, Blackstone
Heights, East Launceston
Prospect, Norwood,
Newstead, Launceston, St
Leonards, Riverside,
Ravenswood, Prospect Vale,
Waverley, Trevallyn,
Travellers Rest, Summerhill,
West Launceston,
Blackstone Heights, East
Launceston
NT 810 810 810
Alawa, Brinkin, Casuarina, Coconut Grove,
Jingili, Lee Point, Lyons, Millner, Moil,
Muirhead, Nightcliff, Nakara, Tiwi, Rapid
Creek, Wanguri, Wagaman
Alawa, Brinkin, Casuarina,
Coconut Grove, Jingili, Lee
Point, Lyons, Millner, Moil,
Muirhead, Nightcliff,
Nakara, Tiwi, Rapid Creek,
Wanguri, Wagaman
Alawa, Brinkin, Casuarina,
Coconut Grove, Jingili, Lee
Point, Lyons, Millner, Moil,
Muirhead, Nightcliff, Nakara,
Tiwi, Rapid Creek, Wanguri,
Wagaman
ACT 2602 2602 2602
Ainslie, Dickson, Downer, Hackett, Lyneham,
O'Connor, Watson
Ainslie, Dickson, Downer,
Hackett, Lyneham,
O'Connor, Watson
Ainslie, Dickson, Downer,
Hackett, Lyneham,
O'Connor, Watson
Table 15 (overleaf): Highest Average Gifts Claimed by Taxpayers 2013-14 by Postcode for
each State identifies the postcode in each state whose taxpayers had the largest average
claimed deductible gift. This year the second wealthiest postcode in the state of Victoria
3944 (Portsea) recorded the highest average gift in the country at $19,187.32. The
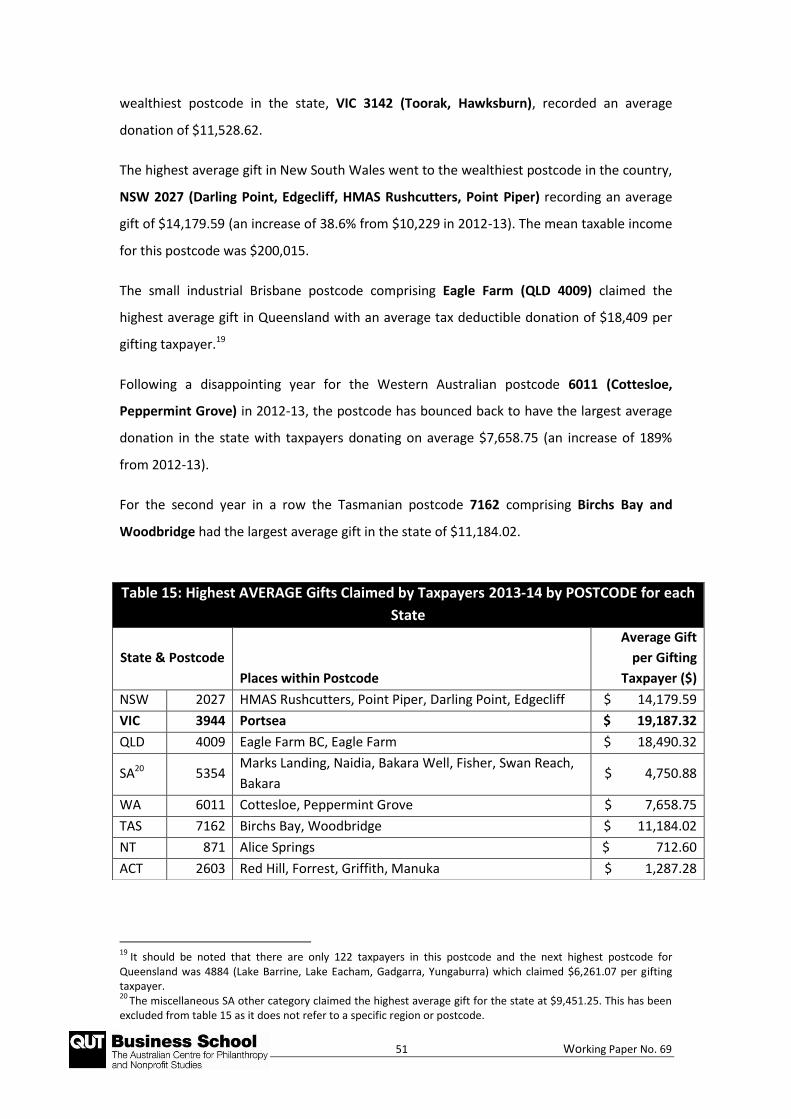
51 Working Paper No. 69
wealthiest postcode in the state, VIC 3142 (Toorak, Hawksburn), recorded an average
donation of $11,528.62.
The highest average gift in New South Wales went to the wealthiest postcode in the country,
NSW 2027 (Darling Point, Edgecliff, HMAS Rushcutters, Point Piper) recording an average
gift of $14,179.59 (an increase of 38.6% from $10,229 in 2012-13). The mean taxable income
for this postcode was $200,015.
The small industrial Brisbane postcode comprising Eagle Farm (QLD 4009) claimed the
highest average gift in Queensland with an average tax deductible donation of $18,409 per
gifting taxpayer.19
Following a disappointing year for the Western Australian postcode 6011 (Cottesloe,
Peppermint Grove) in 2012-13, the postcode has bounced back to have the largest average
donation in the state with taxpayers donating on average $7,658.75 (an increase of 189%
from 2012-13).
For the second year in a row the Tasmanian postcode 7162 comprising Birchs Bay and
Woodbridge had the largest average gift in the state of $11,184.02.
19
It should be noted that there are only 122 taxpayers in this postcode and the next highest postcode for Queensland was 4884 (Lake Barrine, Lake Eacham, Gadgarra, Yungaburra) which claimed $6,261.07 per gifting taxpayer. 20
The miscellaneous SA other category claimed the highest average gift for the state at $9,451.25. This has been excluded from table 15 as it does not refer to a specific region or postcode.
Table 15: Highest AVERAGE Gifts Claimed by Taxpayers 2013-14 by POSTCODE for each
State
State & Postcode
Places within Postcode
Average Gift
per Gifting
Taxpayer ($)
NSW 2027 HMAS Rushcutters, Point Piper, Darling Point, Edgecliff $ 14,179.59
VIC 3944 Portsea $ 19,187.32
QLD 4009 Eagle Farm BC, Eagle Farm $ 18,490.32
SA20 5354 Marks Landing, Naidia, Bakara Well, Fisher, Swan Reach,
Bakara $ 4,750.88
WA 6011 Cottesloe, Peppermint Grove $ 7,658.75
TAS 7162 Birchs Bay, Woodbridge $ 11,184.02
NT 871 Alice Springs $ 712.60
ACT 2603 Red Hill, Forrest, Griffith, Manuka $ 1,287.28
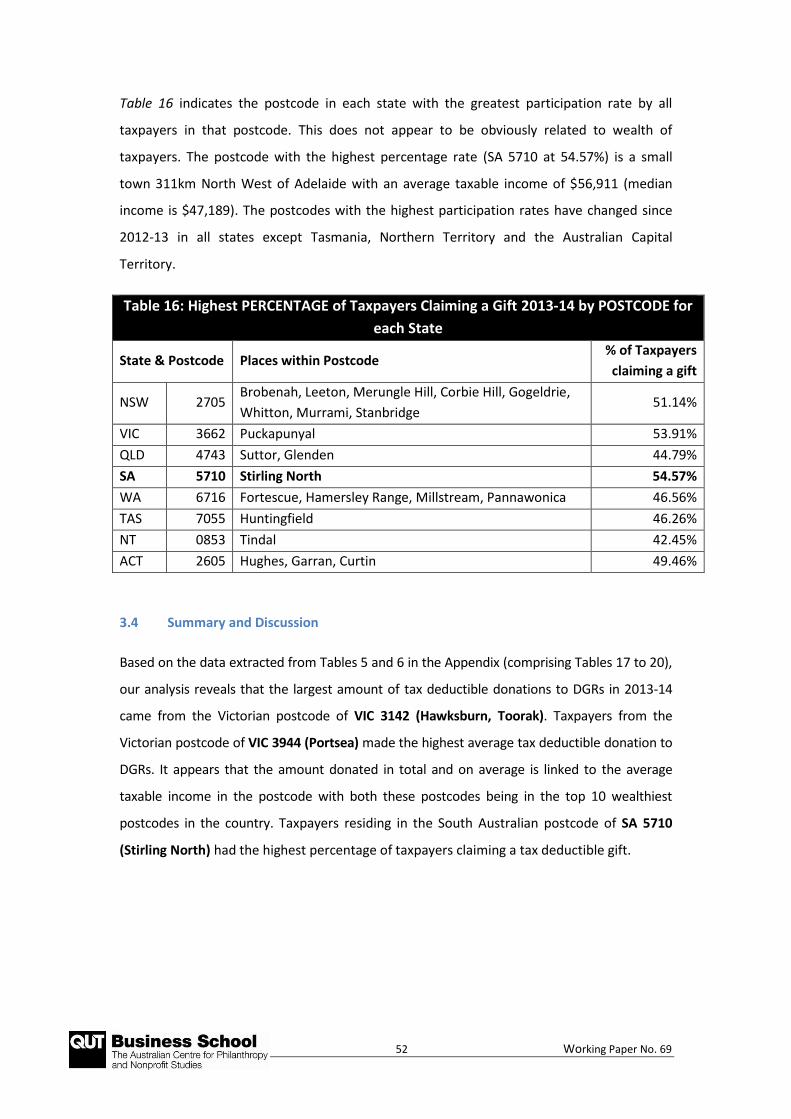
52 Working Paper No. 69
Table 16 indicates the postcode in each state with the greatest participation rate by all
taxpayers in that postcode. This does not appear to be obviously related to wealth of
taxpayers. The postcode with the highest percentage rate (SA 5710 at 54.57%) is a small
town 311km North West of Adelaide with an average taxable income of $56,911 (median
income is $47,189). The postcodes with the highest participation rates have changed since
2012-13 in all states except Tasmania, Northern Territory and the Australian Capital
Territory.
Table 16: Highest PERCENTAGE of Taxpayers Claiming a Gift 2013-14 by POSTCODE for
each State
State & Postcode Places within Postcode % of Taxpayers
claiming a gift
NSW 2705 Brobenah, Leeton, Merungle Hill, Corbie Hill, Gogeldrie,
Whitton, Murrami, Stanbridge 51.14%
VIC 3662 Puckapunyal 53.91%
QLD 4743 Suttor, Glenden 44.79%
SA 5710 Stirling North 54.57%
WA 6716 Fortescue, Hamersley Range, Millstream, Pannawonica 46.56%
TAS 7055 Huntingfield 46.26%
NT 0853 Tindal 42.45%
ACT 2605 Hughes, Garran, Curtin 49.46%
3.4 Summary and Discussion
Based on the data extracted from Tables 5 and 6 in the Appendix (comprising Tables 17 to 20),
our analysis reveals that the largest amount of tax deductible donations to DGRs in 2013-14
came from the Victorian postcode of VIC 3142 (Hawksburn, Toorak). Taxpayers from the
Victorian postcode of VIC 3944 (Portsea) made the highest average tax deductible donation to
DGRs. It appears that the amount donated in total and on average is linked to the average
taxable income in the postcode with both these postcodes being in the top 10 wealthiest
postcodes in the country. Taxpayers residing in the South Australian postcode of SA 5710
(Stirling North) had the highest percentage of taxpayers claiming a tax deductible gift.
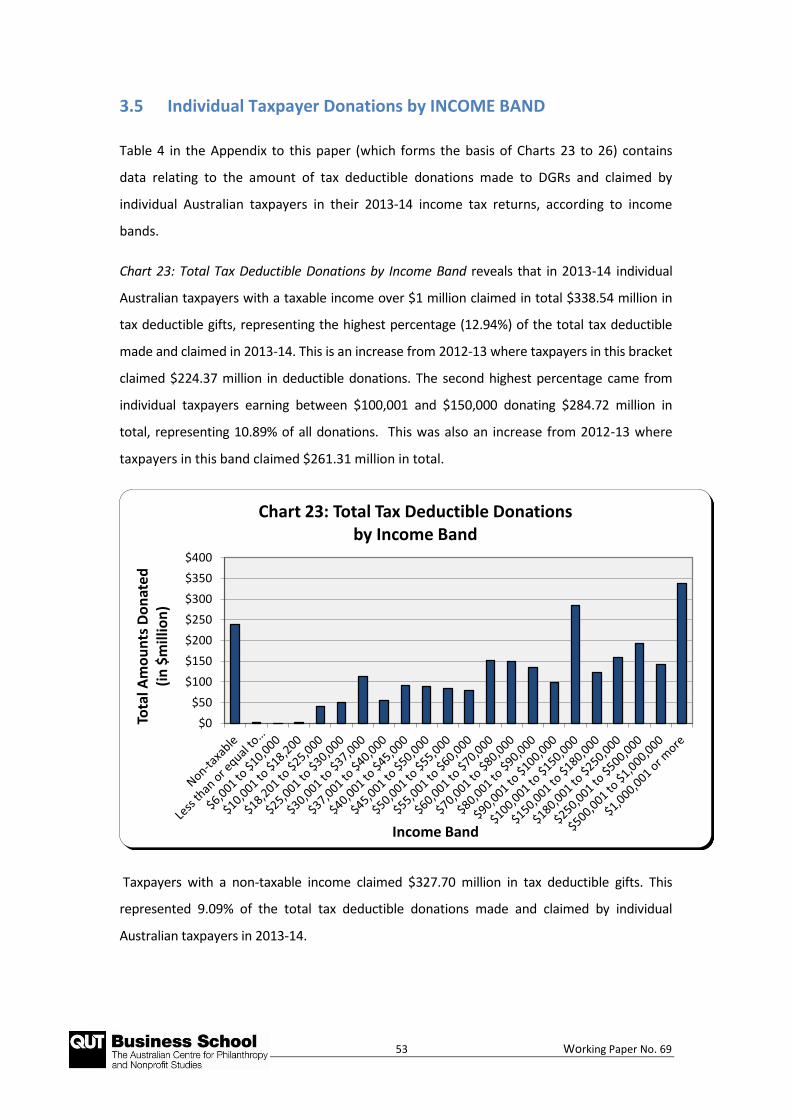
53 Working Paper No. 69
3.5 Individual Taxpayer Donations by INCOME BAND
Table 4 in the Appendix to this paper (which forms the basis of Charts 23 to 26) contains
data relating to the amount of tax deductible donations made to DGRs and claimed by
individual Australian taxpayers in their 2013-14 income tax returns, according to income
bands.
Chart 23: Total Tax Deductible Donations by Income Band reveals that in 2013-14 individual
Australian taxpayers with a taxable income over $1 million claimed in total $338.54 million in
tax deductible gifts, representing the highest percentage (12.94%) of the total tax deductible
made and claimed in 2013-14. This is an increase from 2012-13 where taxpayers in this bracket
claimed $224.37 million in deductible donations. The second highest percentage came from
individual taxpayers earning between $100,001 and $150,000 donating $284.72 million in
total, representing 10.89% of all donations. This was also an increase from 2012-13 where
taxpayers in this band claimed $261.31 million in total.
Taxpayers with a non-taxable income claimed $327.70 million in tax deductible gifts. This
represented 9.09% of the total tax deductible donations made and claimed by individual
Australian taxpayers in 2013-14.
$0
$50
$100
$150
$200
$250
$300
$350
$400
Tota
l Am
ou
nts
Do
nat
ed
(in
$m
illio
n)
Income Band
Chart 23: Total Tax Deductible Donations by Income Band
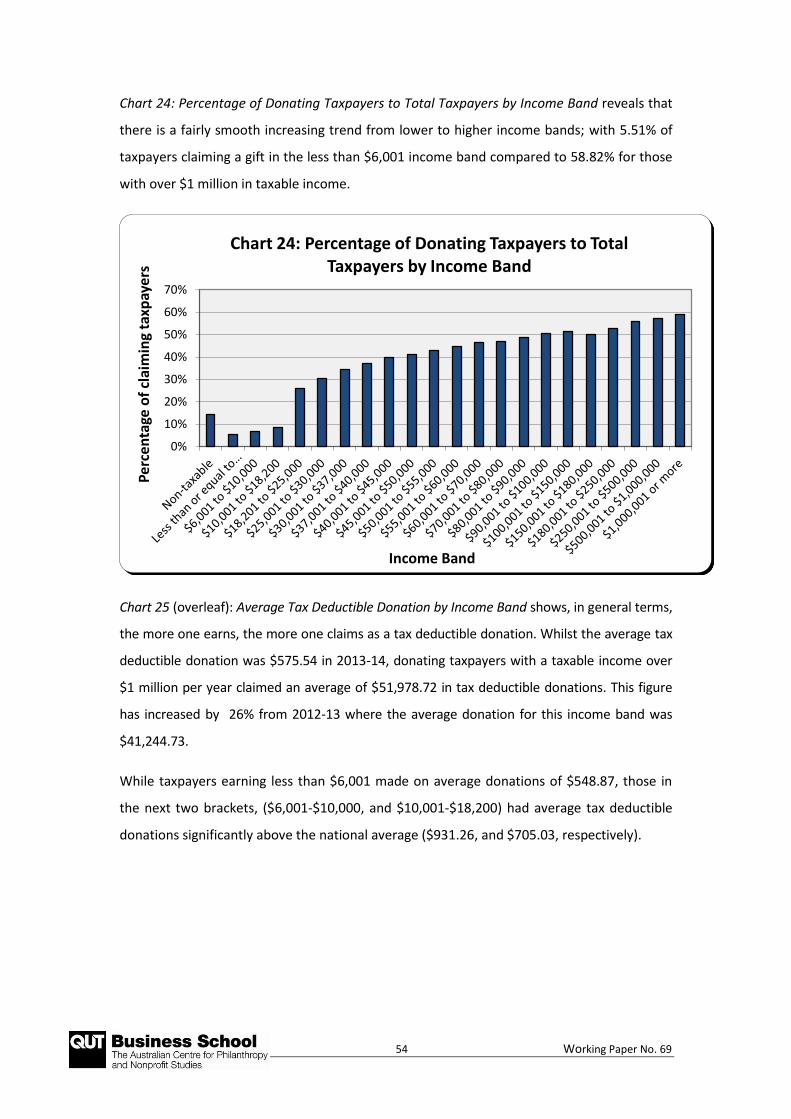
54 Working Paper No. 69
Chart 24: Percentage of Donating Taxpayers to Total Taxpayers by Income Band reveals that
there is a fairly smooth increasing trend from lower to higher income bands; with 5.51% of
taxpayers claiming a gift in the less than $6,001 income band compared to 58.82% for those
with over $1 million in taxable income.
Chart 25 (overleaf): Average Tax Deductible Donation by Income Band shows, in general terms,
the more one earns, the more one claims as a tax deductible donation. Whilst the average tax
deductible donation was $575.54 in 2013-14, donating taxpayers with a taxable income over
$1 million per year claimed an average of $51,978.72 in tax deductible donations. This figure
has increased by 26% from 2012-13 where the average donation for this income band was
$41,244.73.
While taxpayers earning less than $6,001 made on average donations of $548.87, those in
the next two brackets, ($6,001-$10,000, and $10,001-$18,200) had average tax deductible
donations significantly above the national average ($931.26, and $705.03, respectively).
0%
10%
20%
30%
40%
50%
60%
70%
Per
cen
tage
of
clai
min
g ta
xpay
ers
Income Band
Chart 24: Percentage of Donating Taxpayers to Total Taxpayers by Income Band
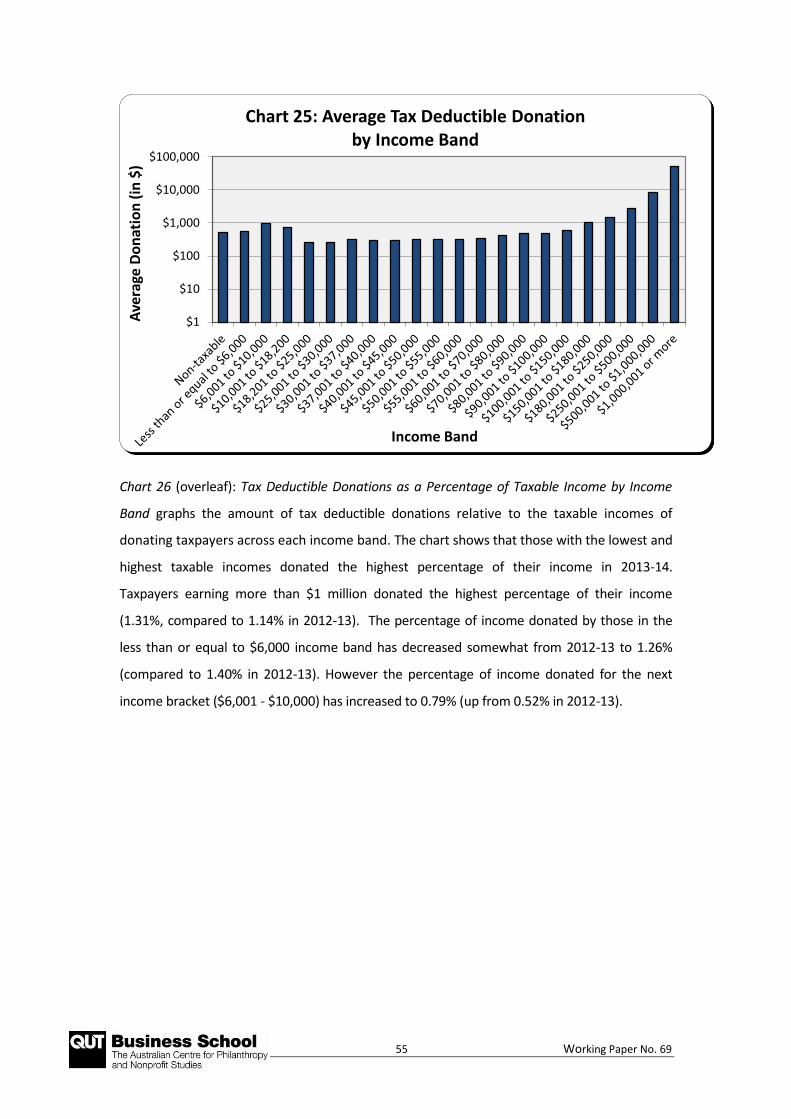
55 Working Paper No. 69
Chart 26 (overleaf): Tax Deductible Donations as a Percentage of Taxable Income by Income
Band graphs the amount of tax deductible donations relative to the taxable incomes of
donating taxpayers across each income band. The chart shows that those with the lowest and
highest taxable incomes donated the highest percentage of their income in 2013-14.
Taxpayers earning more than $1 million donated the highest percentage of their income
(1.31%, compared to 1.14% in 2012-13). The percentage of income donated by those in the
less than or equal to $6,000 income band has decreased somewhat from 2012-13 to 1.26%
(compared to 1.40% in 2012-13). However the percentage of income donated for the next
income bracket ($6,001 - $10,000) has increased to 0.79% (up from 0.52% in 2012-13).
$1
$10
$100
$1,000
$10,000
$100,000
Ave
rage
Do
nat
ion
(in
$)
Income Band
Chart 25: Average Tax Deductible Donation by Income Band
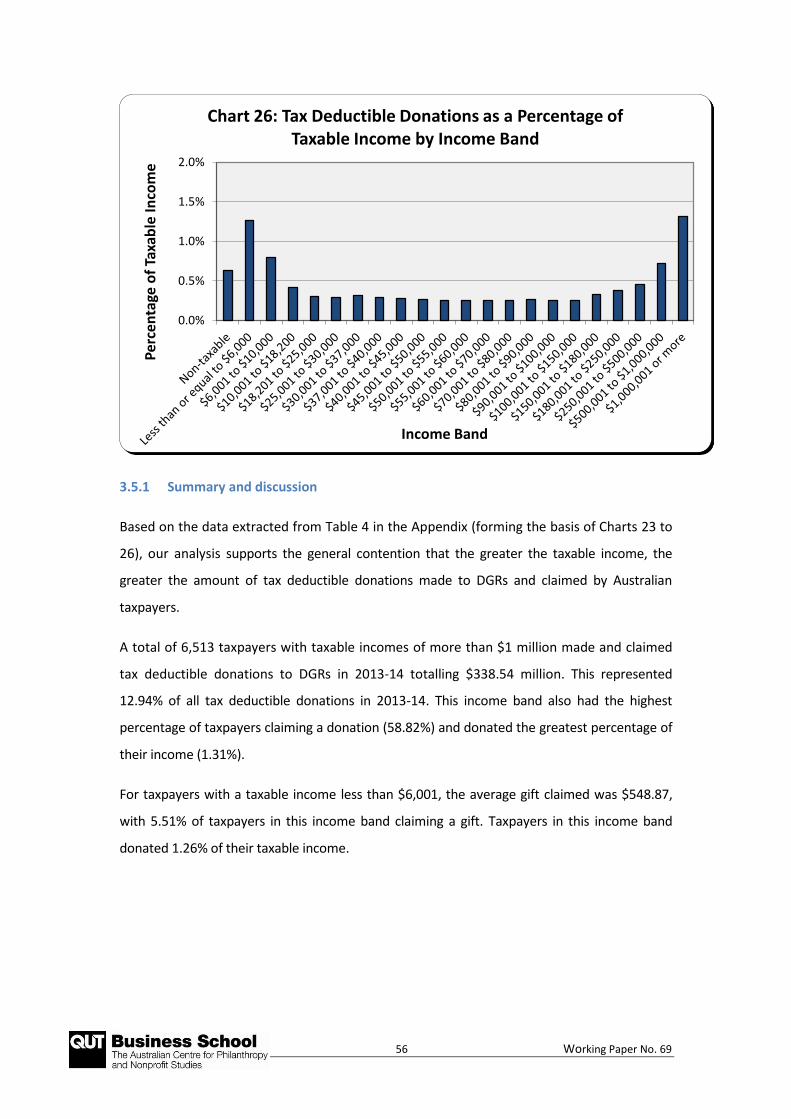
56 Working Paper No. 69
3.5.1 Summary and discussion
Based on the data extracted from Table 4 in the Appendix (forming the basis of Charts 23 to
26), our analysis supports the general contention that the greater the taxable income, the
greater the amount of tax deductible donations made to DGRs and claimed by Australian
taxpayers.
A total of 6,513 taxpayers with taxable incomes of more than $1 million made and claimed
tax deductible donations to DGRs in 2013-14 totalling $338.54 million. This represented
12.94% of all tax deductible donations in 2013-14. This income band also had the highest
percentage of taxpayers claiming a donation (58.82%) and donated the greatest percentage of
their income (1.31%).
For taxpayers with a taxable income less than $6,001, the average gift claimed was $548.87,
with 5.51% of taxpayers in this income band claiming a gift. Taxpayers in this income band
donated 1.26% of their taxable income.
0.0%
0.5%
1.0%
1.5%
2.0%P
erce
nta
ge o
f Ta
xab
le I
nco
me
Income Band
Chart 26: Tax Deductible Donations as a Percentage of Taxable Income by Income Band

57 Working Paper No. 69
3.6 Taxpayer Donations by OCCUPATION
For the eighth time the ATO has made available data for wages and salary classified by
occupation code of the taxpayer.
Occupation is taken from the personal tax return item 1. The occupation codes for 2013-14
are based upon the ‘Australian and New Zealand Standard Classification of Occupations, First
Edition’ produced by the Australian Bureau of Statistics 2006. There are eight major groups:
managers;
professionals;
technicians and trades workers;
community and personal service workers;
clerical and administrative workers;
sales workers;
machinery operators and drivers workers; and
labourers.
Each major group has a number of sub groups. Table 7 in the appendix contains the data
relating to these eight major groups of occupations.
On the Centre’s website is a search tool for all occupations which will retrieve all the
relevant deductible gift data for the year 2013-14 by occupation and years dating back to
2006-07. This is available from http://www.qut.edu.au/business/about/research-
centres/australian-centre-for-philanthropy-and-nonprofit-studies/publications-and-
resources/giving-by-postcode
Tables 17-20 below show the occupations with the highest average claimed gifts, highest
total claimed gifts, highest percentage of claimed gifts against total income and highest
percentage of participating taxpayers per occupation code. The miscellaneous ‘no
occupation’ and ‘other’ categories have been omitted from the data analysis as well as
occupation codes containing fewer than 50 people.
Table 17 identifies the top ten occupations by total gifts. Chief Executives and Managing
Directors (occupation code 1111) donated the highest amount in total, $321,159,914 in
2013-14. This is an increase of 38.6% from 2012-13, where the total amount donated from
this occupation code was $231,646,617. This occupation has consistently donated the
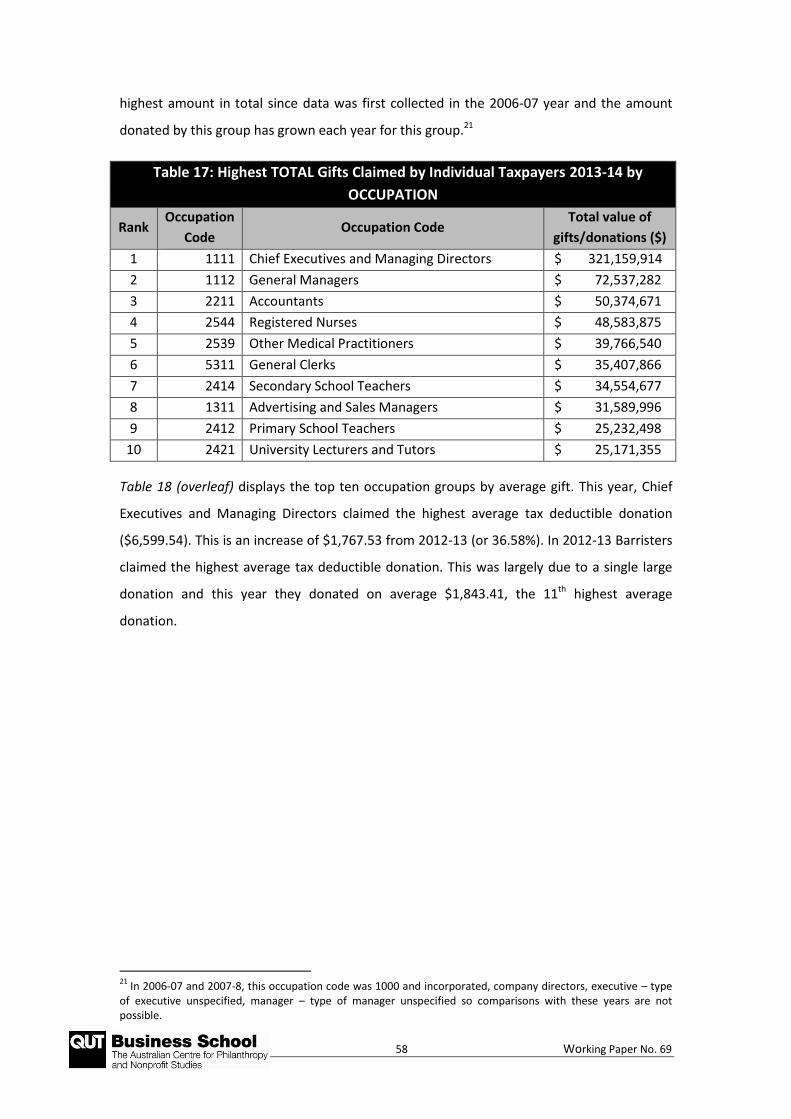
58 Working Paper No. 69
highest amount in total since data was first collected in the 2006-07 year and the amount
donated by this group has grown each year for this group.21
Table 17: Highest TOTAL Gifts Claimed by Individual Taxpayers 2013-14 by
OCCUPATION
Rank Occupation
Code Occupation Code
Total value of
gifts/donations ($)
1 1111 Chief Executives and Managing Directors $ 321,159,914
2 1112 General Managers $ 72,537,282
3 2211 Accountants $ 50,374,671
4 2544 Registered Nurses $ 48,583,875
5 2539 Other Medical Practitioners $ 39,766,540
6 5311 General Clerks $ 35,407,866
7 2414 Secondary School Teachers $ 34,554,677
8 1311 Advertising and Sales Managers $ 31,589,996
9 2412 Primary School Teachers $ 25,232,498
10 2421 University Lecturers and Tutors $ 25,171,355
Table 18 (overleaf) displays the top ten occupation groups by average gift. This year, Chief
Executives and Managing Directors claimed the highest average tax deductible donation
($6,599.54). This is an increase of $1,767.53 from 2012-13 (or 36.58%). In 2012-13 Barristers
claimed the highest average tax deductible donation. This was largely due to a single large
donation and this year they donated on average $1,843.41, the 11th highest average
donation.
21
In 2006-07 and 2007-8, this occupation code was 1000 and incorporated, company directors, executive – type of executive unspecified, manager – type of manager unspecified so comparisons with these years are not possible.
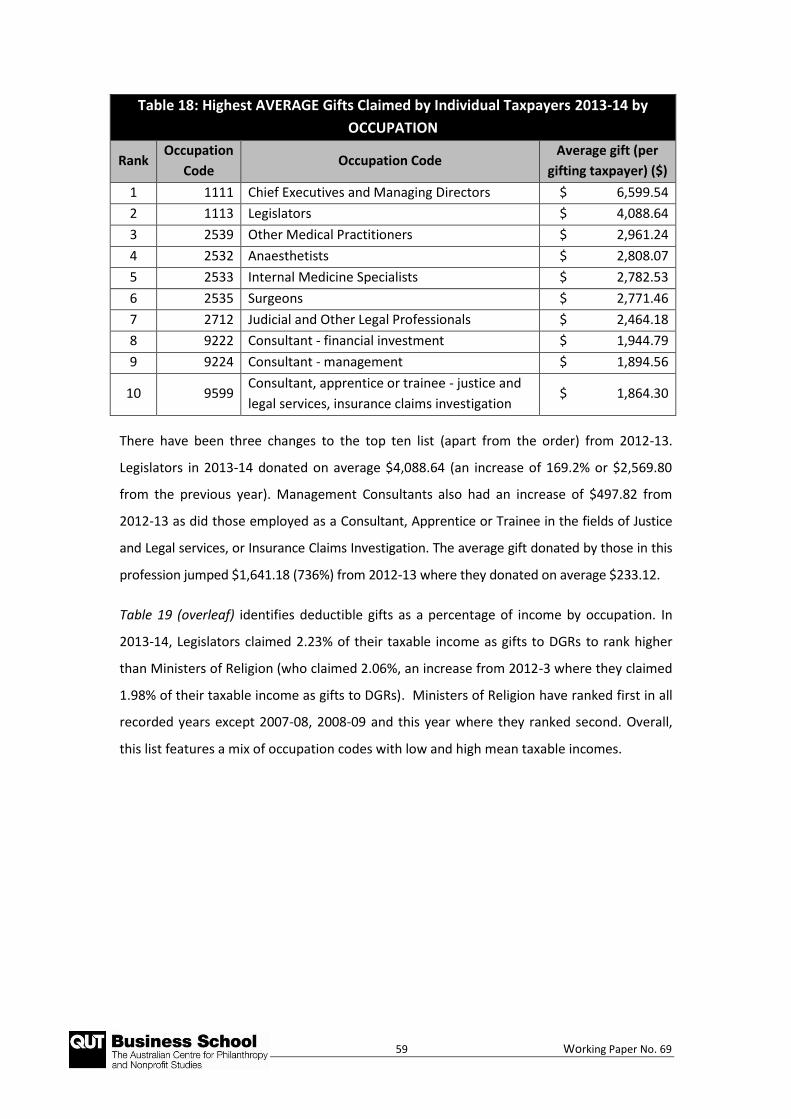
59 Working Paper No. 69
Table 18: Highest AVERAGE Gifts Claimed by Individual Taxpayers 2013-14 by
OCCUPATION
Rank Occupation
Code Occupation Code
Average gift (per
gifting taxpayer) ($)
1 1111 Chief Executives and Managing Directors $ 6,599.54
2 1113 Legislators $ 4,088.64
3 2539 Other Medical Practitioners $ 2,961.24
4 2532 Anaesthetists $ 2,808.07
5 2533 Internal Medicine Specialists $ 2,782.53
6 2535 Surgeons $ 2,771.46
7 2712 Judicial and Other Legal Professionals $ 2,464.18
8 9222 Consultant - financial investment $ 1,944.79
9 9224 Consultant - management $ 1,894.56
10 9599 Consultant, apprentice or trainee - justice and
legal services, insurance claims investigation $ 1,864.30
There have been three changes to the top ten list (apart from the order) from 2012-13.
Legislators in 2013-14 donated on average $4,088.64 (an increase of 169.2% or $2,569.80
from the previous year). Management Consultants also had an increase of $497.82 from
2012-13 as did those employed as a Consultant, Apprentice or Trainee in the fields of Justice
and Legal services, or Insurance Claims Investigation. The average gift donated by those in this
profession jumped $1,641.18 (736%) from 2012-13 where they donated on average $233.12.
Table 19 (overleaf) identifies deductible gifts as a percentage of income by occupation. In
2013-14, Legislators claimed 2.23% of their taxable income as gifts to DGRs to rank higher
than Ministers of Religion (who claimed 2.06%, an increase from 2012-3 where they claimed
1.98% of their taxable income as gifts to DGRs). Ministers of Religion have ranked first in all
recorded years except 2007-08, 2008-09 and this year where they ranked second. Overall,
this list features a mix of occupation codes with low and high mean taxable incomes.
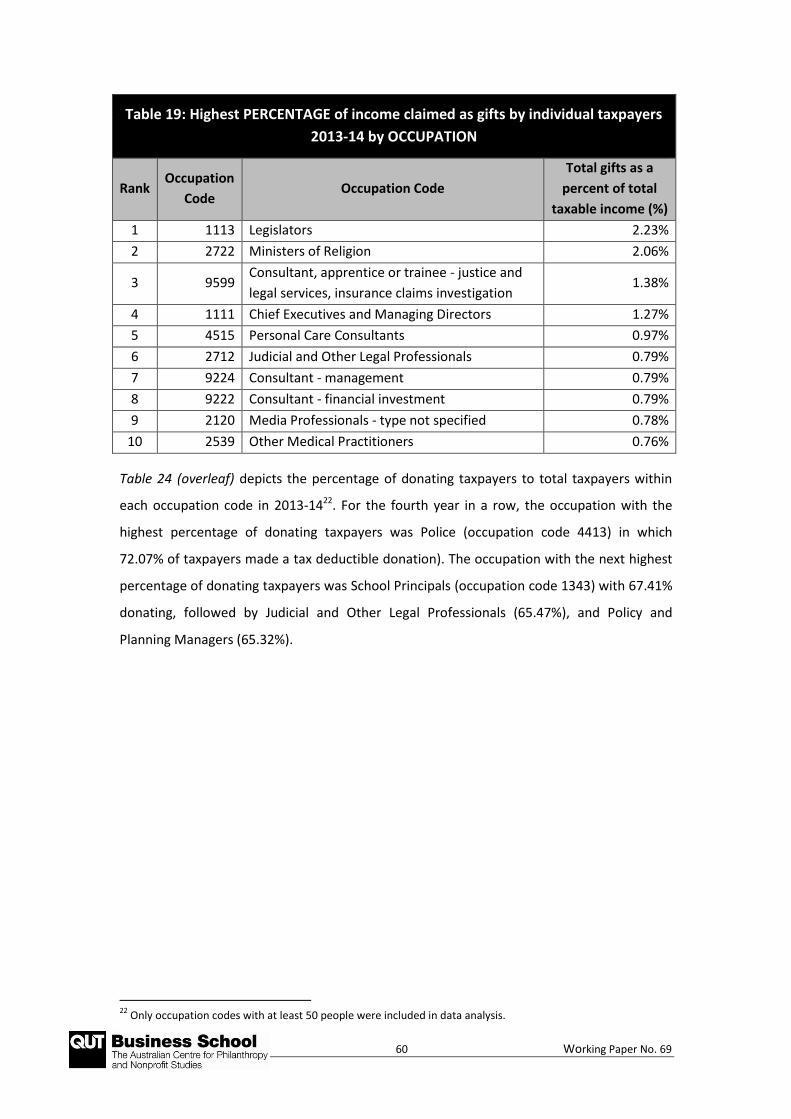
60 Working Paper No. 69
Table 19: Highest PERCENTAGE of income claimed as gifts by individual taxpayers
2013-14 by OCCUPATION
Rank Occupation
Code Occupation Code
Total gifts as a
percent of total
taxable income (%)
1 1113 Legislators 2.23%
2 2722 Ministers of Religion 2.06%
3 9599 Consultant, apprentice or trainee - justice and
legal services, insurance claims investigation 1.38%
4 1111 Chief Executives and Managing Directors 1.27%
5 4515 Personal Care Consultants 0.97%
6 2712 Judicial and Other Legal Professionals 0.79%
7 9224 Consultant - management 0.79%
8 9222 Consultant - financial investment 0.79%
9 2120 Media Professionals - type not specified 0.78%
10 2539 Other Medical Practitioners 0.76%
Table 24 (overleaf) depicts the percentage of donating taxpayers to total taxpayers within
each occupation code in 2013-1422. For the fourth year in a row, the occupation with the
highest percentage of donating taxpayers was Police (occupation code 4413) in which
72.07% of taxpayers made a tax deductible donation). The occupation with the next highest
percentage of donating taxpayers was School Principals (occupation code 1343) with 67.41%
donating, followed by Judicial and Other Legal Professionals (65.47%), and Policy and
Planning Managers (65.32%).
22
Only occupation codes with at least 50 people were included in data analysis.
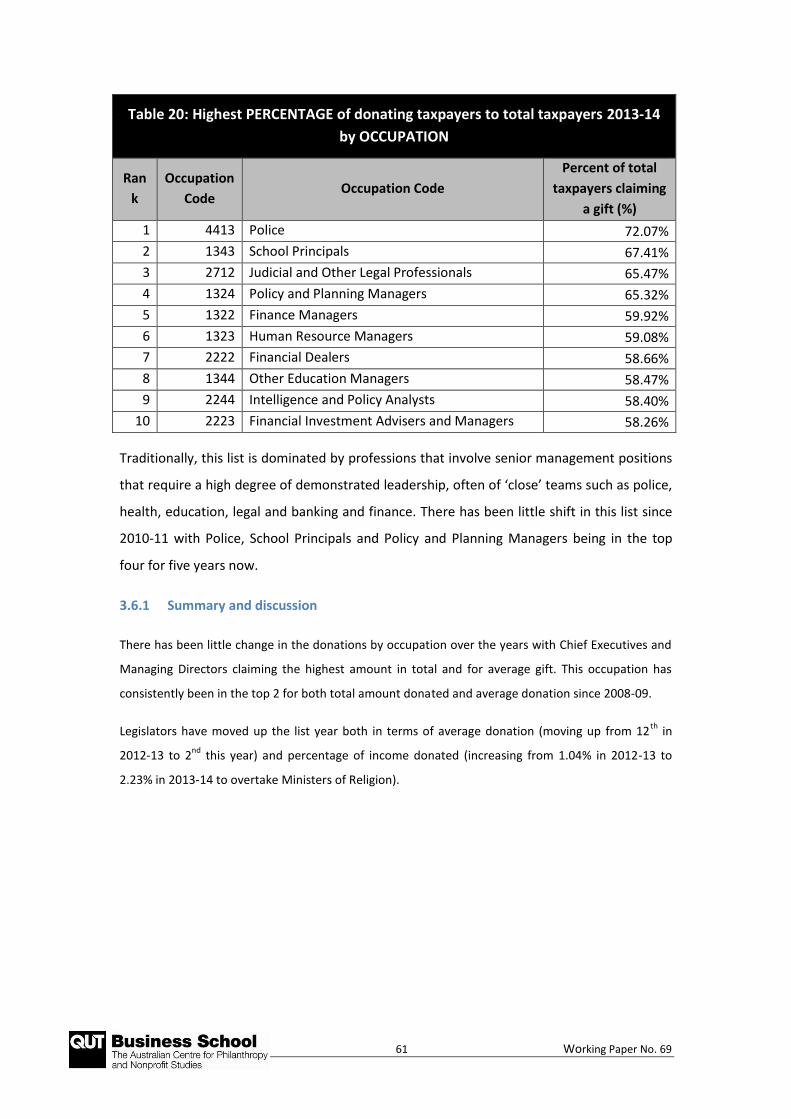
61 Working Paper No. 69
Table 20: Highest PERCENTAGE of donating taxpayers to total taxpayers 2013-14
by OCCUPATION
Ran
k
Occupation
Code Occupation Code
Percent of total
taxpayers claiming
a gift (%)
1 4413 Police 72.07%
2 1343 School Principals 67.41%
3 2712 Judicial and Other Legal Professionals 65.47%
4 1324 Policy and Planning Managers 65.32%
5 1322 Finance Managers 59.92%
6 1323 Human Resource Managers 59.08%
7 2222 Financial Dealers 58.66%
8 1344 Other Education Managers 58.47%
9 2244 Intelligence and Policy Analysts 58.40%
10 2223 Financial Investment Advisers and Managers 58.26%
Traditionally, this list is dominated by professions that involve senior management positions
that require a high degree of demonstrated leadership, often of ‘close’ teams such as police,
health, education, legal and banking and finance. There has been little shift in this list since
2010-11 with Police, School Principals and Policy and Planning Managers being in the top
four for five years now.
3.6.1 Summary and discussion
There has been little change in the donations by occupation over the years with Chief Executives and
Managing Directors claiming the highest amount in total and for average gift. This occupation has
consistently been in the top 2 for both total amount donated and average donation since 2008-09.
Legislators have moved up the list year both in terms of average donation (moving up from 12th
in
2012-13 to 2nd
this year) and percentage of income donated (increasing from 1.04% in 2012-13 to
2.23% in 2013-14 to overtake Ministers of Religion).
62 Working Paper No. 69
4.0 LIMITATIONS OF THE STUDY
a. This study only uses information based on published ATO material and represents only the
extent of tax deductible donations made to DGRs and claimed by Australian taxpayers at Item
D9 Gifts or Donations in their individual income tax returns for the 2013-14 income year. This
study does not measure the total amounts gifted by Australian taxpayers. It is not known
exactly what percentage of taxpayers make tax deductible donations and forget to claim them
in their income tax returns. Many smaller donations may not be claimed. For example, a $2
door knock receipt may have been lost or forgotten to be claimed at tax time by many
taxpayers. However, it is assumed that the larger the donation, the more likely the donation
will be claimed by the taxpayer in their tax return.
b. It is not known how many erroneous tax deductible donations are claimed by taxpayers. For
instance, in 2002-03, the ATO found 265,547 discrepancies in reviewing individual tax returns.
c. This study is based only on the extent of charitable giving by individual taxpayers. It does not
measure the extent of business or corporate giving. The statistics relating to the extent of tax
deductible donations made by non-individual taxpayers (such as companies, trusts, etc.) is not
recorded in published ATO data. Unlike the individual income tax return, the partnership, trust
and company income tax returns do not have an item equivalent to Item D9 Gifts or
Donations.
d. The amount recorded at Item D9 Gifts or Donations only represents those donations that can
be claimed as an income tax deduction. Many individual taxpayers make donations to
organisations that cannot be claimed as tax deductions (e.g. purchasing badges or tea towels,
buying food and small items from charity-run fetes, buying tickets to a fundraising event or
dinner, and sponsorships). The ATO statistics capture pure philanthropic gifts and
contributions by individuals to DGRs.
e. Some taxpayers do not lodge their tax returns by the due date. The ATO adds new information
to its aggregate data set when it is processed. This means that the total tax deductible gifts in a
previously reported year may increase in a subsequent annual report, which includes
references to previous years. For instance, the data presented in this paper is based on
information contained in individual taxpayers’ 2014 tax returns processed by the ATO as at 31
October 2015.
63 Working Paper No. 69
f. Any information contained in 2013-14 income tax returns lodged by Australian taxpayers after
October 31 2015 will not be reflected in the 2016 Taxation Statistics publication. Instead,
information relating to 2014 tax returns of individuals lodged after 31 October 2015 will be
incorporated into, and reflected in, future Taxation Statistics publications. In this paper, we
found certain figures have been revised and updated from previous Taxation Statistics
publications. This is particularly so with the total number of donors, total tax deductible
donations made and donations according to state of residence. This paper indicates the
situations where late taxpayer filings have not been included.
g. The analysis of industry classifications and gift deductions should not be confused with
taxpayers’ occupations. The analysis is solely based on taxpayers who are sole traders. For
example, lawyers may be included in:
salary and wage taxpayers (employed lawyers);
sole trader lawyers who operate their own businesses;
lawyers who carry on business as partners in a partnership; or even
a company or trust.
Thus, this data should not be applied as if it represents the gift deductions of all taxpayers who
might provide legal services, ONLY those who are sole trader business taxpayers.
h. The ATO has provided data by occupation code declared in an individual taxpayer’s return.
There are a large number of taxpayers who do not declare their occupation or are classified as
miscellaneous.
Despite these limitations, the ATO statistics are one of the few places in which donation information
is collected on a rigorous basis. All taxpayers are required to make a formal declaration at the end of
their tax returns that the information contained therein is correct. Under the system of self-
assessment, the ATO generally treats the tax return lodged by a taxpayer as being correct when
lodged.
However, the ATO has a wide-ranging audit program to confirm whether the details disclosed in
taxpayers’ income tax returns is correct or not. If the taxpayer has made a false or misleading
statement or claimed an amount that cannot be substantiated, then the taxpayer is faced with the
prospect of fines, penalties and interest charges.
64 Working Paper No. 69
The ATO Taxation Statistics also provide useful trend data as the information collated and published is
collected annually on much the same basis. Other surveys are usually snapshots with different
questions, methodology and definitions of what is a gift or donation.
Despite these limitations, it is considered that the results of this analysis will prove useful to
fundraisers and in the development of fundraising strategies. Knowing where donors come from,
and how much taxpayers within certain industries and specific occupations give, can assist DGRs to
target fundraising strategies towards these donor groups.
65 Working Paper No. 69
5.0 BIBLIOGRAPHY
Australian Bureau of Statistics. (2013). Australian and New Zealand Standard Classification of
Occupations, 2013, Version 1.2. Retrieved March 30, 2016 from
http://www.abs.gov.au/AUSSTATS/[email protected]/DetailsPage/1220.02013,%20Version%201.2?
OpenDocument
Australian Business Register. (2016). ABN look up. Retrieved March 30, 2016 from
http://www.abr.business.gov.au/
Australian Taxation Office. (2015). GiftPack. Retrieved March 30, 2016 from
https://www.ato.gov.au/law/view/document?docid=SAV/GIFTPACK/00001&PiT=20131205
000001#H1.0
Australian Taxation Office. (2014). Income tax returns. Retrieved March 30, 2016 from
https://www.ato.gov.au/Non-profit/Statements-and-returns/Income-tax-returns/
Australian Taxation Office. (2014). Tax basics for non-profit organisations. Retrieved March 30, 2016
from
https://www.ato.gov.au/uploadedFiles/Content/SME/downloads/Nonprofit16966Tax_basi
cs_for_non_profit_organisations.pdf
Australian Taxation Office. (2016). Taxation statistics 2013-14. Retrieved March 22, 2016 from
https://www.ato.gov.au/About-ATO/Research-and-statistics/In-detail/Tax-
statistics/Taxation-statistics-2013-14/
Giving USA. (2015). The annual report on philanthropy for the year 2014. Retrieved March 30, 2016
from http://www.givingusareports.org/
Income Tax Assessment Regulations 1997 (Cth) s. 3.
Lyons, M., & Hocking, S. (2000). Dimensions of Australia’s third sector: Report of the Australian
nonprofit data project. Sydney, Australia: University of Technology, Centre for Community
Organisations and Management.
Productivity Commission. (2010). Contribution of the not-for-profit sector. Retrieved March 30, 2016
from http://www.pc.gov.au/inquiries/completed/not-for-profit/report
66 Working Paper No. 69
The Prime Minister’s Community Business Partnership. (2005). Giving Australia: Research on
philanthropy in Australia. Retrieved March 30, 2016 from
http://cms.qut.edu.au/__data/assets/pdf_file/0007/87379/Giving-Australia-Report_Oct-
2005.pdf
The Prime Minister’s Community Business Partnership. (2012). Taxation initiatives to encourage
philanthropy. Retrieved March 30, 2016 from
http://www.fahcsia.gov.au/sites/default/files/documents/05_2012/pmcbp_fs5.pdf
67 Working Paper No. 69
6.0 APPENDIX
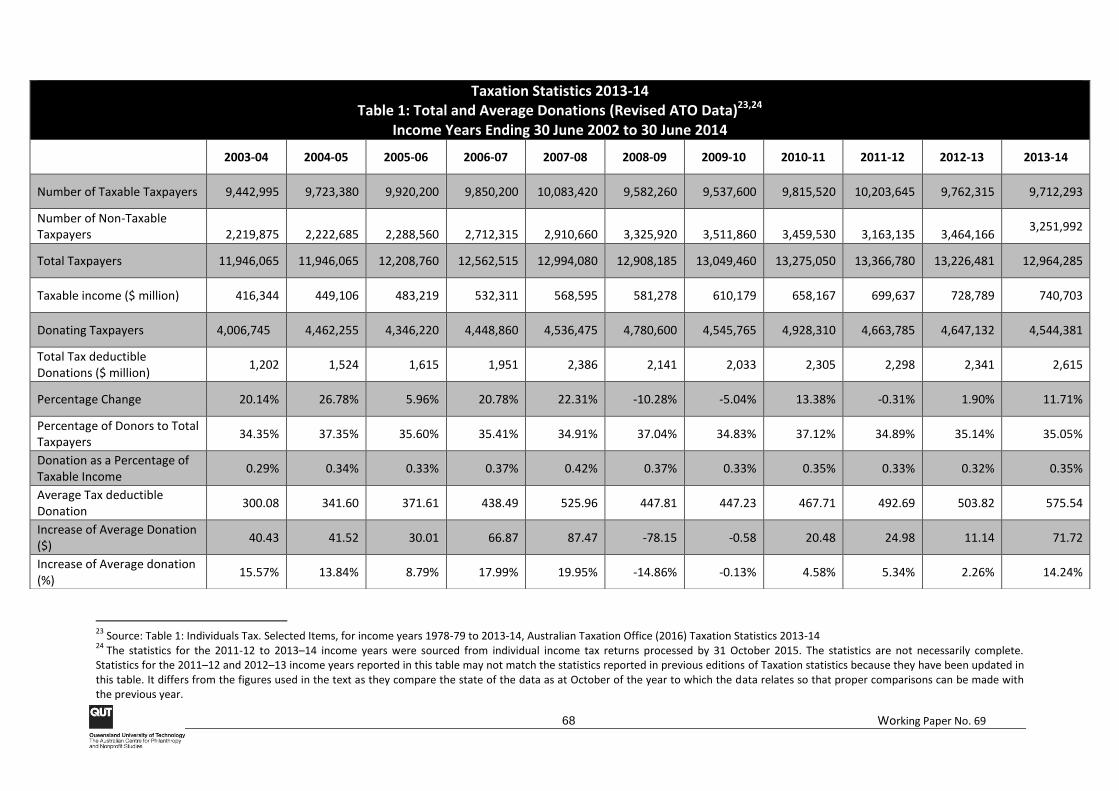
68 Working Paper No. 69
23
Source: Table 1: Individuals Tax. Selected Items, for income years 1978-79 to 2013-14, Australian Taxation Office (2016) Taxation Statistics 2013-14 24
The statistics for the 2011-12 to 2013–14 income years were sourced from individual income tax returns processed by 31 October 2015. The statistics are not necessarily complete. Statistics for the 2011–12 and 2012–13 income years reported in this table may not match the statistics reported in previous editions of Taxation statistics because they have been updated in this table. It differs from the figures used in the text as they compare the state of the data as at October of the year to which the data relates so that proper comparisons can be made with the previous year.
Taxation Statistics 2013-14 Table 1: Total and Average Donations (Revised ATO Data)23,24
Income Years Ending 30 June 2002 to 30 June 2014
2003-04 2004-05 2005-06 2006-07 2007-08 2008-09 2009-10 2010-11 2011-12 2012-13 2013-14
Number of Taxable Taxpayers 9,442,995 9,723,380 9,920,200 9,850,200 10,083,420 9,582,260 9,537,600 9,815,520 10,203,645 9,762,315 9,712,293
Number of Non-Taxable Taxpayers
2,219,875
2,222,685
2,288,560
2,712,315
2,910,660
3,325,920
3,511,860
3,459,530
3,163,135
3,464,166
3,251,992
Total Taxpayers 11,946,065 11,946,065 12,208,760 12,562,515 12,994,080 12,908,185 13,049,460 13,275,050 13,366,780 13,226,481 12,964,285
Taxable income ($ million) 416,344 449,106 483,219 532,311 568,595 581,278 610,179 658,167 699,637 728,789 740,703
Donating Taxpayers 4,006,745 4,462,255 4,346,220 4,448,860 4,536,475 4,780,600 4,545,765 4,928,310 4,663,785 4,647,132 4,544,381
Total Tax deductible Donations ($ million)
1,202 1,524 1,615 1,951 2,386 2,141 2,033 2,305 2,298 2,341 2,615
Percentage Change 20.14% 26.78% 5.96% 20.78% 22.31% -10.28% -5.04% 13.38% -0.31% 1.90% 11.71%
Percentage of Donors to Total Taxpayers
34.35% 37.35% 35.60% 35.41% 34.91% 37.04% 34.83% 37.12% 34.89% 35.14% 35.05%
Donation as a Percentage of Taxable Income
0.29% 0.34% 0.33% 0.37% 0.42% 0.37% 0.33% 0.35% 0.33% 0.32% 0.35%
Average Tax deductible Donation
300.08 341.60 371.61 438.49 525.96 447.81 447.23 467.71 492.69 503.82 575.54
Increase of Average Donation ($)
40.43 41.52 30.01 66.87 87.47 -78.15 -0.58 20.48 24.98 11.14 71.72
Increase of Average donation (%)
15.57% 13.84% 8.79% 17.99% 19.95% -14.86% -0.13% 4.58% 5.34% 2.26% 14.24%
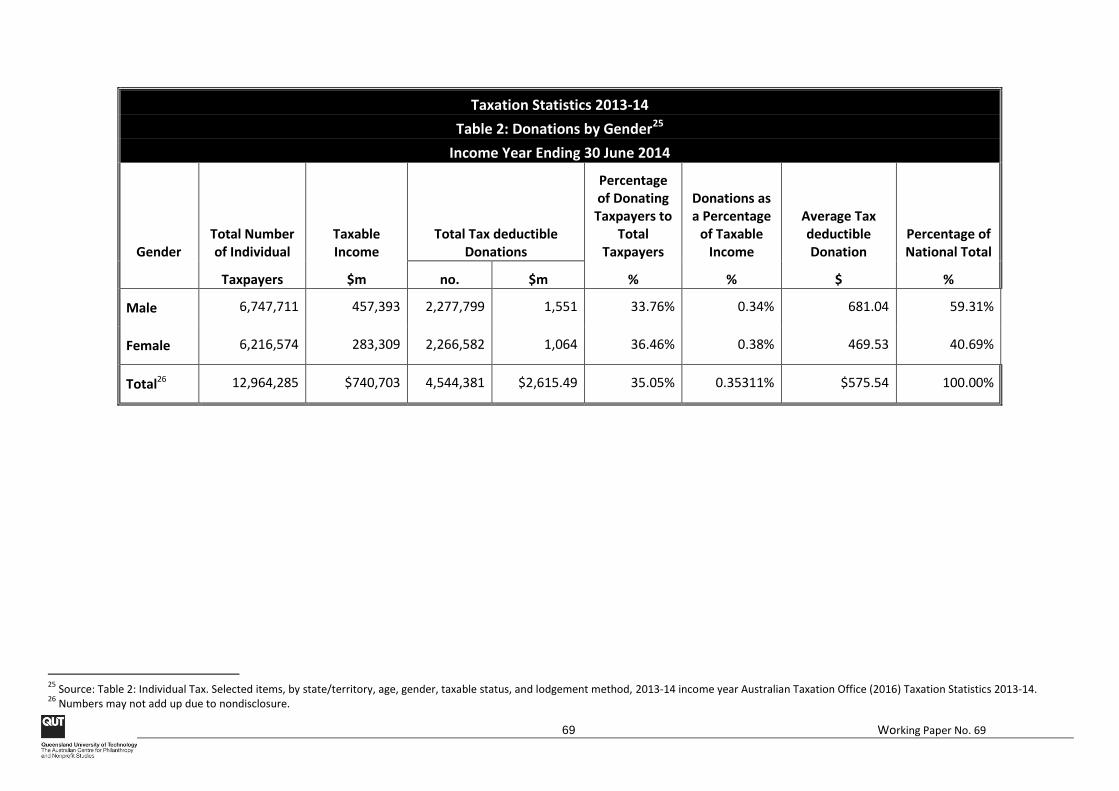
69 Working Paper No. 69
Taxation Statistics 2013-14
Table 2: Donations by Gender25
Income Year Ending 30 June 2014
Gender Total Number of Individual
Taxable Income
Total Tax deductible Donations
Percentage of Donating Taxpayers to
Total Taxpayers
Donations as a Percentage
of Taxable Income
Average Tax deductible Donation
Percentage of National Total
Taxpayers $m no. $m % % $ %
Male 6,747,711 457,393 2,277,799 1,551 33.76% 0.34% 681.04 59.31%
Female 6,216,574 283,309 2,266,582 1,064 36.46% 0.38% 469.53 40.69%
Total26 12,964,285 $740,703 4,544,381 $2,615.49 35.05% 0.35311% $575.54 100.00%
25
Source: Table 2: Individual Tax. Selected items, by state/territory, age, gender, taxable status, and lodgement method, 2013-14 income year Australian Taxation Office (2016) Taxation Statistics 2013-14. 26
Numbers may not add up due to nondisclosure.
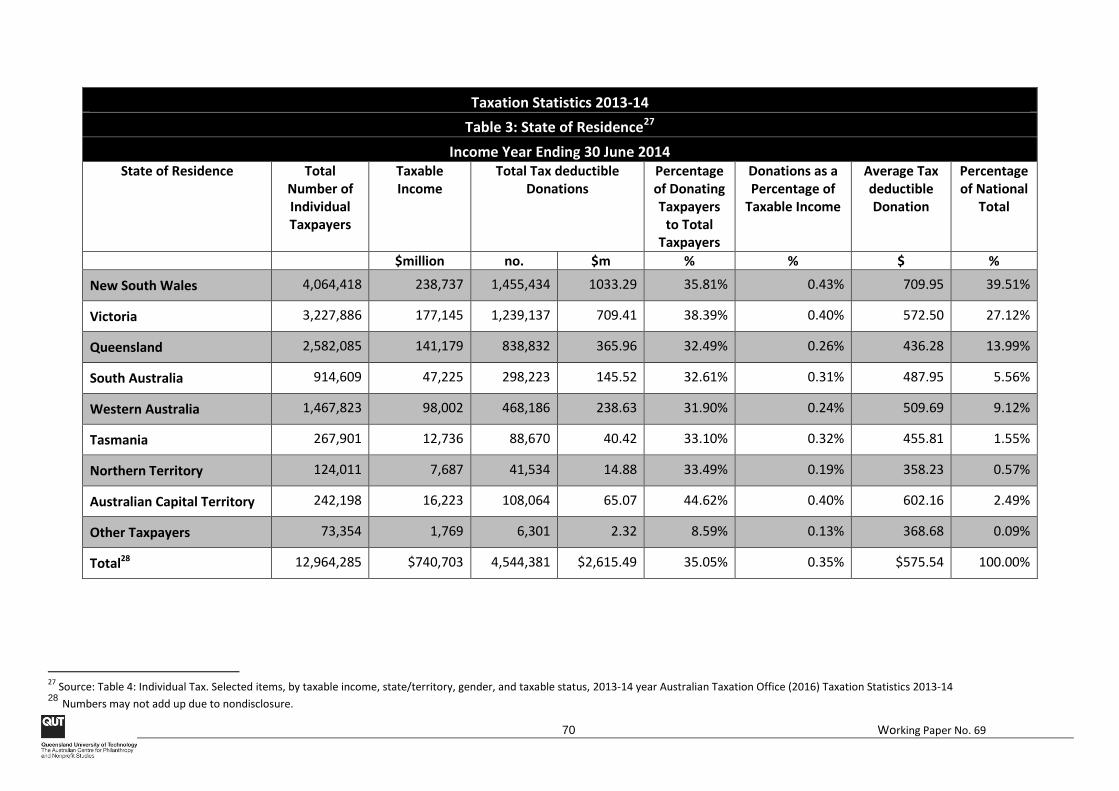
70 Working Paper No. 69
Taxation Statistics 2013-14
Table 3: State of Residence27
Income Year Ending 30 June 2014 State of Residence Total
Number of Individual Taxpayers
Taxable Income
Total Tax deductible Donations
Percentage of Donating Taxpayers
to Total Taxpayers
Donations as a Percentage of
Taxable Income
Average Tax deductible Donation
Percentage of National
Total
$million no. $m % % $ %
New South Wales 4,064,418 238,737 1,455,434 1033.29 35.81% 0.43% 709.95 39.51%
Victoria 3,227,886 177,145 1,239,137 709.41 38.39% 0.40% 572.50 27.12%
Queensland 2,582,085 141,179 838,832 365.96 32.49% 0.26% 436.28 13.99%
South Australia 914,609 47,225 298,223 145.52 32.61% 0.31% 487.95 5.56%
Western Australia 1,467,823 98,002 468,186 238.63 31.90% 0.24% 509.69 9.12%
Tasmania 267,901 12,736 88,670 40.42 33.10% 0.32% 455.81 1.55%
Northern Territory 124,011 7,687 41,534 14.88 33.49% 0.19% 358.23 0.57%
Australian Capital Territory 242,198 16,223 108,064 65.07 44.62% 0.40% 602.16 2.49%
Other Taxpayers 73,354 1,769 6,301 2.32 8.59% 0.13% 368.68 0.09%
Total28 12,964,285 $740,703 4,544,381 $2,615.49 35.05% 0.35% $575.54 100.00%
27
Source: Table 4: Individual Tax. Selected items, by taxable income, state/territory, gender, and taxable status, 2013-14 year Australian Taxation Office (2016) Taxation Statistics 2013-14 28 Numbers may not add up due to nondisclosure.
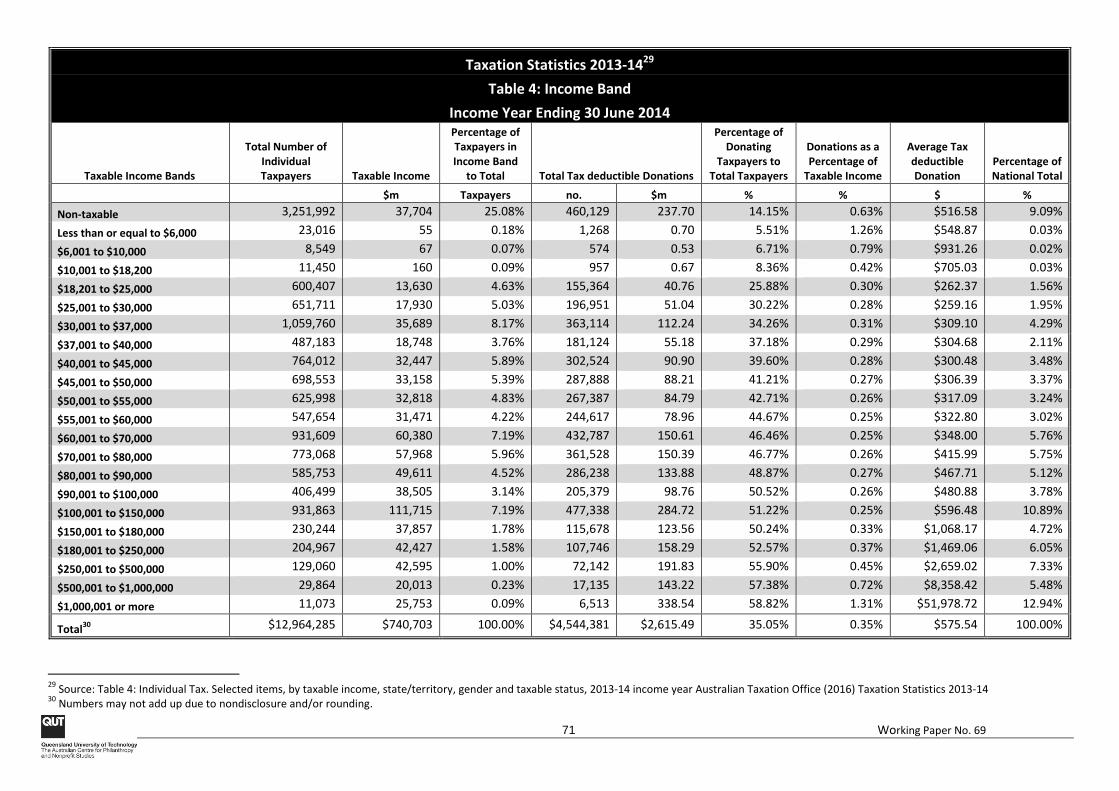
71 Working Paper No. 69
Taxation Statistics 2013-1429
Table 4: Income Band
Income Year Ending 30 June 2014
Taxable Income Bands
Total Number of Individual Taxpayers Taxable Income
Percentage of Taxpayers in Income Band
to Total Total Tax deductible Donations
Percentage of Donating
Taxpayers to Total Taxpayers
Donations as a Percentage of
Taxable Income
Average Tax deductible Donation
Percentage of National Total
$m Taxpayers no. $m % % $ %
Non-taxable 3,251,992 37,704 25.08% 460,129 237.70 14.15% 0.63% $516.58 9.09%
Less than or equal to $6,000 23,016 55 0.18% 1,268 0.70 5.51% 1.26% $548.87 0.03%
$6,001 to $10,000 8,549 67 0.07% 574 0.53 6.71% 0.79% $931.26 0.02%
$10,001 to $18,200 11,450 160 0.09% 957 0.67 8.36% 0.42% $705.03 0.03%
$18,201 to $25,000 600,407 13,630 4.63% 155,364 40.76 25.88% 0.30% $262.37 1.56%
$25,001 to $30,000 651,711 17,930 5.03% 196,951 51.04 30.22% 0.28% $259.16 1.95%
$30,001 to $37,000 1,059,760 35,689 8.17% 363,114 112.24 34.26% 0.31% $309.10 4.29%
$37,001 to $40,000 487,183 18,748 3.76% 181,124 55.18 37.18% 0.29% $304.68 2.11%
$40,001 to $45,000 764,012 32,447 5.89% 302,524 90.90 39.60% 0.28% $300.48 3.48%
$45,001 to $50,000 698,553 33,158 5.39% 287,888 88.21 41.21% 0.27% $306.39 3.37%
$50,001 to $55,000 625,998 32,818 4.83% 267,387 84.79 42.71% 0.26% $317.09 3.24%
$55,001 to $60,000 547,654 31,471 4.22% 244,617 78.96 44.67% 0.25% $322.80 3.02%
$60,001 to $70,000 931,609 60,380 7.19% 432,787 150.61 46.46% 0.25% $348.00 5.76%
$70,001 to $80,000 773,068 57,968 5.96% 361,528 150.39 46.77% 0.26% $415.99 5.75%
$80,001 to $90,000 585,753 49,611 4.52% 286,238 133.88 48.87% 0.27% $467.71 5.12%
$90,001 to $100,000 406,499 38,505 3.14% 205,379 98.76 50.52% 0.26% $480.88 3.78%
$100,001 to $150,000 931,863 111,715 7.19% 477,338 284.72 51.22% 0.25% $596.48 10.89%
$150,001 to $180,000 230,244 37,857 1.78% 115,678 123.56 50.24% 0.33% $1,068.17 4.72%
$180,001 to $250,000 204,967 42,427 1.58% 107,746 158.29 52.57% 0.37% $1,469.06 6.05%
$250,001 to $500,000 129,060 42,595 1.00% 72,142 191.83 55.90% 0.45% $2,659.02 7.33%
$500,001 to $1,000,000 29,864 20,013 0.23% 17,135 143.22 57.38% 0.72% $8,358.42 5.48%
$1,000,001 or more 11,073 25,753 0.09% 6,513 338.54 58.82% 1.31% $51,978.72 12.94%
Total30
$12,964,285 $740,703 100.00% $4,544,381 $2,615.49 35.05% 0.35% $575.54 100.00%
29
Source: Table 4: Individual Tax. Selected items, by taxable income, state/territory, gender and taxable status, 2013-14 income year Australian Taxation Office (2016) Taxation Statistics 2013-14 30
Numbers may not add up due to nondisclosure and/or rounding.
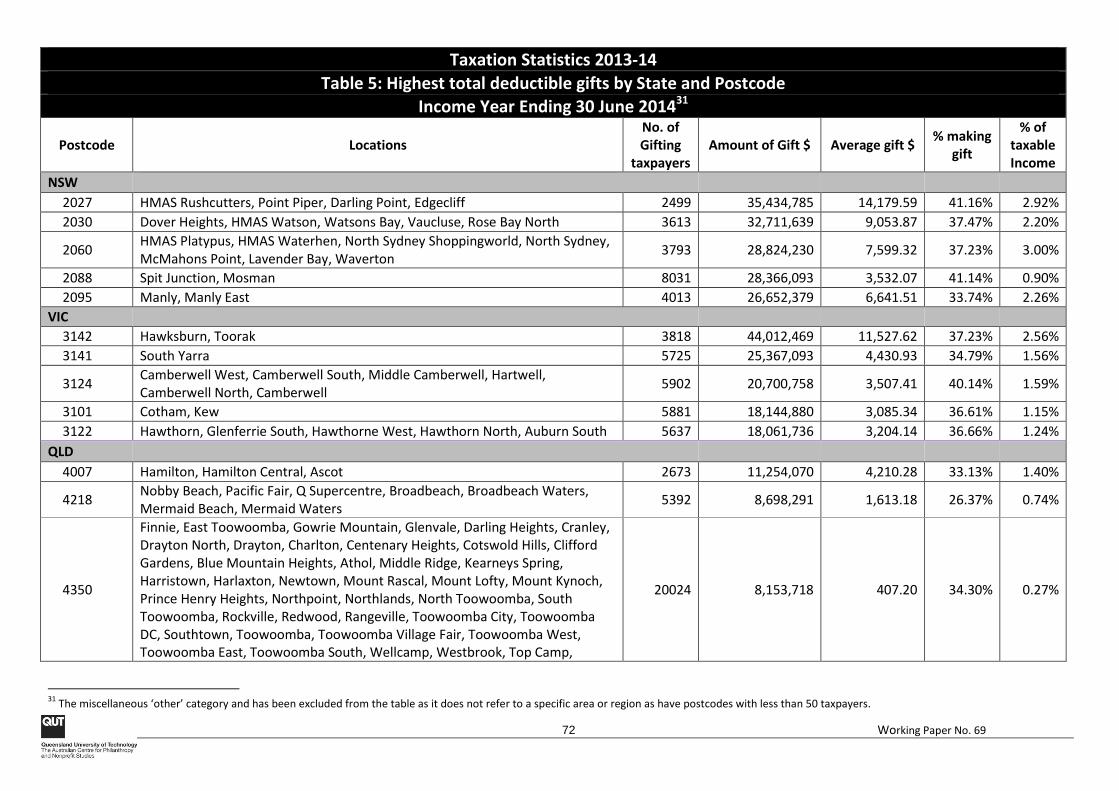
72 Working Paper No. 69
Taxation Statistics 2013-14
Table 5: Highest total deductible gifts by State and Postcode Income Year Ending 30 June 201431
Postcode Locations No. of Gifting
taxpayers Amount of Gift $ Average gift $
% making gift
% of taxable Income
NSW
2027 HMAS Rushcutters, Point Piper, Darling Point, Edgecliff 2499 35,434,785 14,179.59 41.16% 2.92%
2030 Dover Heights, HMAS Watson, Watsons Bay, Vaucluse, Rose Bay North 3613 32,711,639 9,053.87 37.47% 2.20%
2060 HMAS Platypus, HMAS Waterhen, North Sydney Shoppingworld, North Sydney, McMahons Point, Lavender Bay, Waverton
3793 28,824,230 7,599.32 37.23% 3.00%
2088 Spit Junction, Mosman 8031 28,366,093 3,532.07 41.14% 0.90%
2095 Manly, Manly East 4013 26,652,379 6,641.51 33.74% 2.26%
VIC
3142 Hawksburn, Toorak 3818 44,012,469 11,527.62 37.23% 2.56%
3141 South Yarra 5725 25,367,093 4,430.93 34.79% 1.56%
3124 Camberwell West, Camberwell South, Middle Camberwell, Hartwell, Camberwell North, Camberwell
5902 20,700,758 3,507.41 40.14% 1.59%
3101 Cotham, Kew 5881 18,144,880 3,085.34 36.61% 1.15%
3122 Hawthorn, Glenferrie South, Hawthorne West, Hawthorn North, Auburn South 5637 18,061,736 3,204.14 36.66% 1.24%
QLD
4007 Hamilton, Hamilton Central, Ascot 2673 11,254,070 4,210.28 33.13% 1.40%
4218 Nobby Beach, Pacific Fair, Q Supercentre, Broadbeach, Broadbeach Waters, Mermaid Beach, Mermaid Waters
5392 8,698,291 1,613.18 26.37% 0.74%
4350
Finnie, East Toowoomba, Gowrie Mountain, Glenvale, Darling Heights, Cranley, Drayton North, Drayton, Charlton, Centenary Heights, Cotswold Hills, Clifford Gardens, Blue Mountain Heights, Athol, Middle Ridge, Kearneys Spring, Harristown, Harlaxton, Newtown, Mount Rascal, Mount Lofty, Mount Kynoch, Prince Henry Heights, Northpoint, Northlands, North Toowoomba, South Toowoomba, Rockville, Redwood, Rangeville, Toowoomba City, Toowoomba DC, Southtown, Toowoomba, Toowoomba Village Fair, Toowoomba West, Toowoomba East, Toowoomba South, Wellcamp, Westbrook, Top Camp,
20024 8,153,718 407.20 34.30% 0.27%
31
The miscellaneous ‘other’ category and has been excluded from the table as it does not refer to a specific area or region as have postcodes with less than 50 taxpayers.
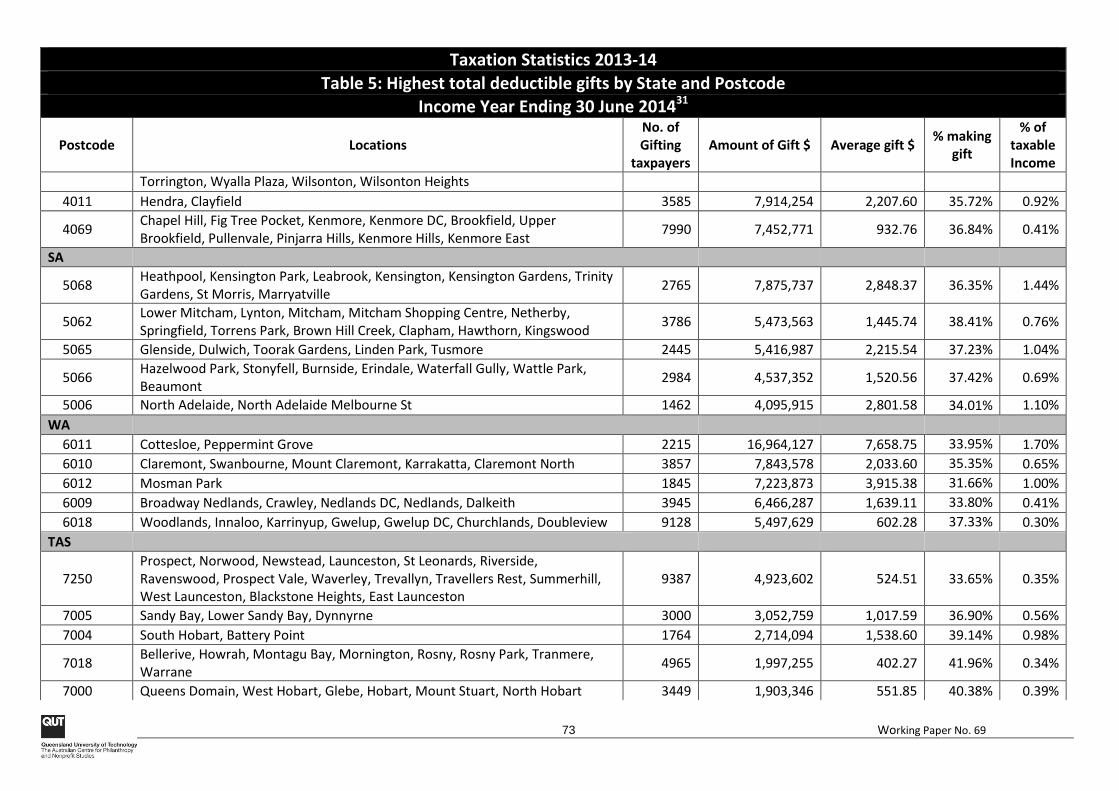
73 Working Paper No. 69
Taxation Statistics 2013-14
Table 5: Highest total deductible gifts by State and Postcode Income Year Ending 30 June 201431
Postcode Locations No. of Gifting
taxpayers Amount of Gift $ Average gift $
% making gift
% of taxable Income
Torrington, Wyalla Plaza, Wilsonton, Wilsonton Heights
4011 Hendra, Clayfield 3585 7,914,254 2,207.60 35.72% 0.92%
4069 Chapel Hill, Fig Tree Pocket, Kenmore, Kenmore DC, Brookfield, Upper Brookfield, Pullenvale, Pinjarra Hills, Kenmore Hills, Kenmore East
7990 7,452,771 932.76 36.84% 0.41%
SA
5068 Heathpool, Kensington Park, Leabrook, Kensington, Kensington Gardens, Trinity Gardens, St Morris, Marryatville
2765 7,875,737 2,848.37 36.35% 1.44%
5062 Lower Mitcham, Lynton, Mitcham, Mitcham Shopping Centre, Netherby, Springfield, Torrens Park, Brown Hill Creek, Clapham, Hawthorn, Kingswood
3786 5,473,563 1,445.74 38.41% 0.76%
5065 Glenside, Dulwich, Toorak Gardens, Linden Park, Tusmore 2445 5,416,987 2,215.54 37.23% 1.04%
5066 Hazelwood Park, Stonyfell, Burnside, Erindale, Waterfall Gully, Wattle Park, Beaumont
2984 4,537,352 1,520.56 37.42% 0.69%
5006 North Adelaide, North Adelaide Melbourne St 1462 4,095,915 2,801.58 34.01% 1.10%
WA
6011 Cottesloe, Peppermint Grove 2215 16,964,127 7,658.75 33.95% 1.70%
6010 Claremont, Swanbourne, Mount Claremont, Karrakatta, Claremont North 3857 7,843,578 2,033.60 35.35% 0.65%
6012 Mosman Park 1845 7,223,873 3,915.38 31.66% 1.00%
6009 Broadway Nedlands, Crawley, Nedlands DC, Nedlands, Dalkeith 3945 6,466,287 1,639.11 33.80% 0.41%
6018 Woodlands, Innaloo, Karrinyup, Gwelup, Gwelup DC, Churchlands, Doubleview 9128 5,497,629 602.28 37.33% 0.30%
TAS
7250 Prospect, Norwood, Newstead, Launceston, St Leonards, Riverside, Ravenswood, Prospect Vale, Waverley, Trevallyn, Travellers Rest, Summerhill, West Launceston, Blackstone Heights, East Launceston
9387 4,923,602 524.51 33.65% 0.35%
7005 Sandy Bay, Lower Sandy Bay, Dynnyrne 3000 3,052,759 1,017.59 36.90% 0.56%
7004 South Hobart, Battery Point 1764 2,714,094 1,538.60 39.14% 0.98%
7018 Bellerive, Howrah, Montagu Bay, Mornington, Rosny, Rosny Park, Tranmere, Warrane
4965 1,997,255 402.27 41.96% 0.34%
7000 Queens Domain, West Hobart, Glebe, Hobart, Mount Stuart, North Hobart 3449 1,903,346 551.85 40.38% 0.39%
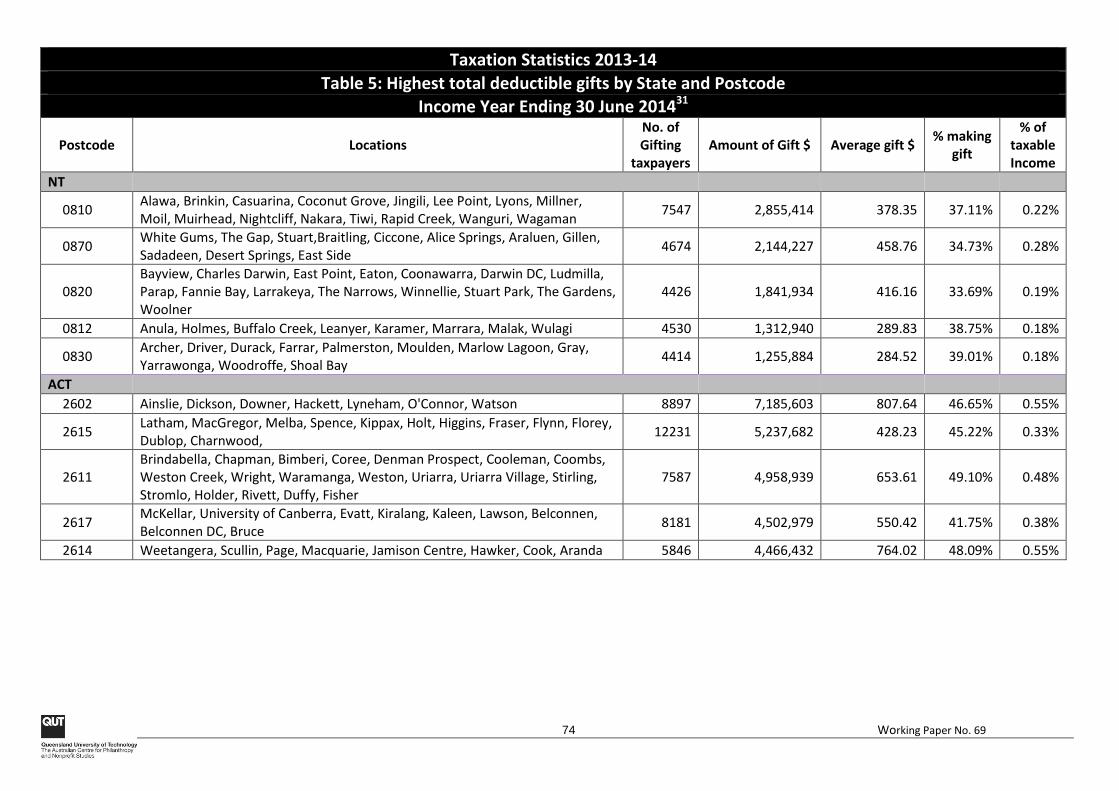
74 Working Paper No. 69
Taxation Statistics 2013-14
Table 5: Highest total deductible gifts by State and Postcode Income Year Ending 30 June 201431
Postcode Locations No. of Gifting
taxpayers Amount of Gift $ Average gift $
% making gift
% of taxable Income
NT
0810 Alawa, Brinkin, Casuarina, Coconut Grove, Jingili, Lee Point, Lyons, Millner, Moil, Muirhead, Nightcliff, Nakara, Tiwi, Rapid Creek, Wanguri, Wagaman
7547 2,855,414 378.35 37.11% 0.22%
0870 White Gums, The Gap, Stuart,Braitling, Ciccone, Alice Springs, Araluen, Gillen, Sadadeen, Desert Springs, East Side
4674 2,144,227 458.76 34.73% 0.28%
0820 Bayview, Charles Darwin, East Point, Eaton, Coonawarra, Darwin DC, Ludmilla, Parap, Fannie Bay, Larrakeya, The Narrows, Winnellie, Stuart Park, The Gardens, Woolner
4426 1,841,934 416.16 33.69% 0.19%
0812 Anula, Holmes, Buffalo Creek, Leanyer, Karamer, Marrara, Malak, Wulagi 4530 1,312,940 289.83 38.75% 0.18%
0830 Archer, Driver, Durack, Farrar, Palmerston, Moulden, Marlow Lagoon, Gray, Yarrawonga, Woodroffe, Shoal Bay
4414 1,255,884 284.52 39.01% 0.18%
ACT
2602 Ainslie, Dickson, Downer, Hackett, Lyneham, O'Connor, Watson 8897 7,185,603 807.64 46.65% 0.55%
2615 Latham, MacGregor, Melba, Spence, Kippax, Holt, Higgins, Fraser, Flynn, Florey, Dublop, Charnwood,
12231 5,237,682 428.23 45.22% 0.33%
2611 Brindabella, Chapman, Bimberi, Coree, Denman Prospect, Cooleman, Coombs, Weston Creek, Wright, Waramanga, Weston, Uriarra, Uriarra Village, Stirling, Stromlo, Holder, Rivett, Duffy, Fisher
7587 4,958,939 653.61 49.10% 0.48%
2617 McKellar, University of Canberra, Evatt, Kiralang, Kaleen, Lawson, Belconnen, Belconnen DC, Bruce
8181 4,502,979 550.42 41.75% 0.38%
2614 Weetangera, Scullin, Page, Macquarie, Jamison Centre, Hawker, Cook, Aranda 5846 4,466,432 764.02 48.09% 0.55%
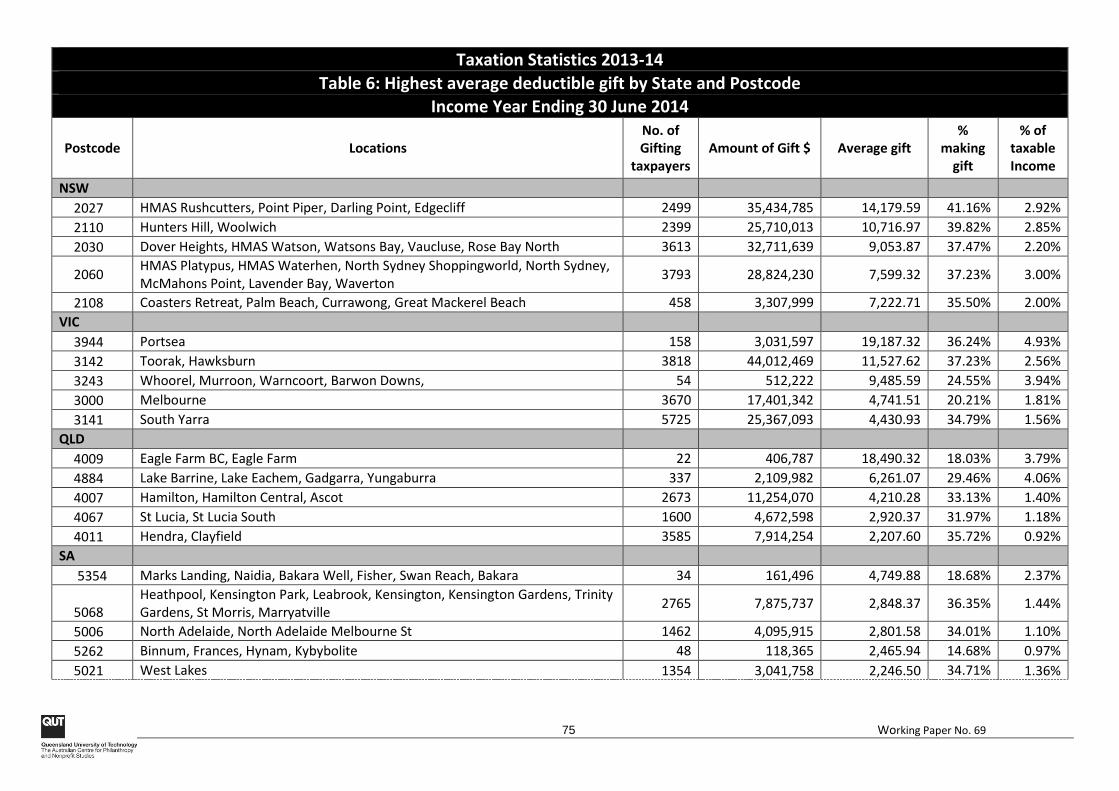
75 Working Paper No. 69
Taxation Statistics 2013-14
Table 6: Highest average deductible gift by State and Postcode Income Year Ending 30 June 2014
Postcode Locations No. of Gifting
taxpayers Amount of Gift $ Average gift
% making
gift
% of taxable Income
NSW
2027 HMAS Rushcutters, Point Piper, Darling Point, Edgecliff 2499 35,434,785 14,179.59 41.16% 2.92%
2110 Hunters Hill, Woolwich 2399 25,710,013 10,716.97 39.82% 2.85%
2030 Dover Heights, HMAS Watson, Watsons Bay, Vaucluse, Rose Bay North 3613 32,711,639 9,053.87 37.47% 2.20%
2060 HMAS Platypus, HMAS Waterhen, North Sydney Shoppingworld, North Sydney, McMahons Point, Lavender Bay, Waverton
3793 28,824,230 7,599.32 37.23% 3.00%
2108 Coasters Retreat, Palm Beach, Currawong, Great Mackerel Beach 458 3,307,999 7,222.71 35.50% 2.00%
VIC
3944 Portsea 158 3,031,597 19,187.32 36.24% 4.93%
3142 Toorak, Hawksburn 3818 44,012,469 11,527.62 37.23% 2.56%
3243 Whoorel, Murroon, Warncoort, Barwon Downs, 54 512,222 9,485.59 24.55% 3.94%
3000 Melbourne 3670 17,401,342 4,741.51 20.21% 1.81%
3141 South Yarra 5725 25,367,093 4,430.93 34.79% 1.56%
QLD
4009 Eagle Farm BC, Eagle Farm 22 406,787 18,490.32 18.03% 3.79%
4884 Lake Barrine, Lake Eachem, Gadgarra, Yungaburra 337 2,109,982 6,261.07 29.46% 4.06%
4007 Hamilton, Hamilton Central, Ascot 2673 11,254,070 4,210.28 33.13% 1.40%
4067 St Lucia, St Lucia South 1600 4,672,598 2,920.37 31.97% 1.18%
4011 Hendra, Clayfield 3585 7,914,254 2,207.60 35.72% 0.92%
SA
5354 Marks Landing, Naidia, Bakara Well, Fisher, Swan Reach, Bakara 34 161,496 4,749.88 18.68% 2.37%
5068 Heathpool, Kensington Park, Leabrook, Kensington, Kensington Gardens, Trinity Gardens, St Morris, Marryatville
2765 7,875,737 2,848.37 36.35% 1.44%
5006 North Adelaide, North Adelaide Melbourne St 1462 4,095,915 2,801.58 34.01% 1.10%
5262 Binnum, Frances, Hynam, Kybybolite 48 118,365 2,465.94 14.68% 0.97%
5021 West Lakes 1354 3,041,758 2,246.50 34.71% 1.36%
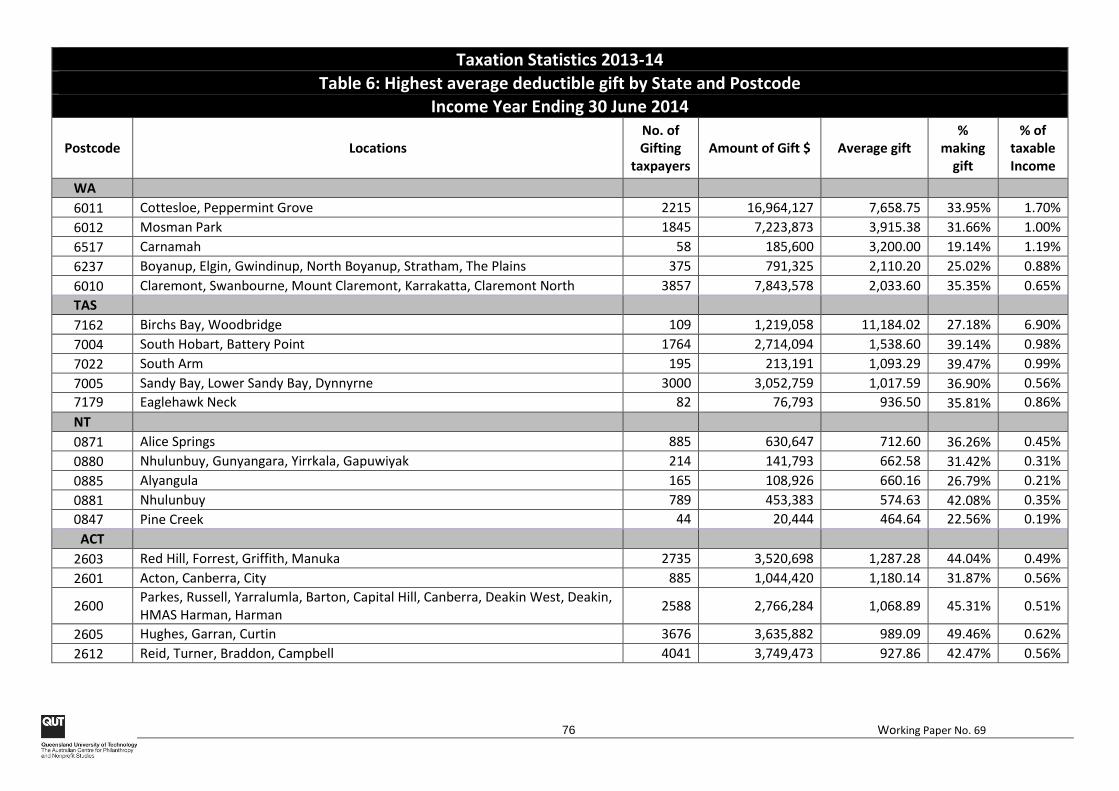
76 Working Paper No. 69
Taxation Statistics 2013-14
Table 6: Highest average deductible gift by State and Postcode Income Year Ending 30 June 2014
Postcode Locations No. of Gifting
taxpayers Amount of Gift $ Average gift
% making
gift
% of taxable Income
WA
6011 Cottesloe, Peppermint Grove 2215 16,964,127 7,658.75 33.95% 1.70%
6012 Mosman Park 1845 7,223,873 3,915.38 31.66% 1.00%
6517 Carnamah 58 185,600 3,200.00 19.14% 1.19%
6237 Boyanup, Elgin, Gwindinup, North Boyanup, Stratham, The Plains 375 791,325 2,110.20 25.02% 0.88%
6010 Claremont, Swanbourne, Mount Claremont, Karrakatta, Claremont North 3857 7,843,578 2,033.60 35.35% 0.65%
TAS
7162 Birchs Bay, Woodbridge 109 1,219,058 11,184.02 27.18% 6.90%
7004 South Hobart, Battery Point 1764 2,714,094 1,538.60 39.14% 0.98%
7022 South Arm 195 213,191 1,093.29 39.47% 0.99%
7005 Sandy Bay, Lower Sandy Bay, Dynnyrne 3000 3,052,759 1,017.59 36.90% 0.56%
7179 Eaglehawk Neck 82 76,793 936.50 35.81% 0.86%
NT
0871 Alice Springs 885 630,647 712.60 36.26% 0.45%
0880 Nhulunbuy, Gunyangara, Yirrkala, Gapuwiyak 214 141,793 662.58 31.42% 0.31%
0885 Alyangula 165 108,926 660.16 26.79% 0.21%
0881 Nhulunbuy 789 453,383 574.63 42.08% 0.35%
0847 Pine Creek 44 20,444 464.64 22.56% 0.19%
ACT
2603 Red Hill, Forrest, Griffith, Manuka 2735 3,520,698 1,287.28 44.04% 0.49%
2601 Acton, Canberra, City 885 1,044,420 1,180.14 31.87% 0.56%
2600 Parkes, Russell, Yarralumla, Barton, Capital Hill, Canberra, Deakin West, Deakin, HMAS Harman, Harman
2588 2,766,284 1,068.89 45.31% 0.51%
2605 Hughes, Garran, Curtin 3676 3,635,882 989.09 49.46% 0.62%
2612 Reid, Turner, Braddon, Campbell 4041 3,749,473 927.86 42.47% 0.56%
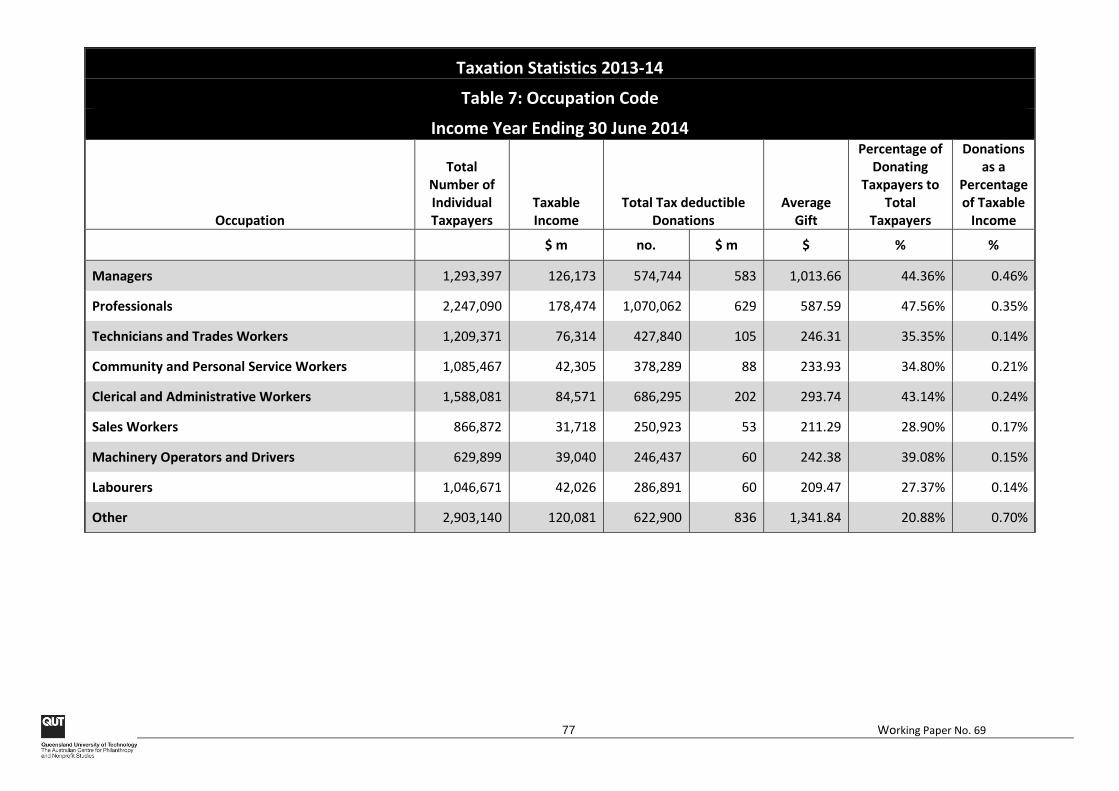
77 Working Paper No. 69
Taxation Statistics 2013-14
Table 7: Occupation Code
Income Year Ending 30 June 2014
Occupation
Total Number of Individual Taxpayers
Taxable Income
Total Tax deductible Donations
Average Gift
Percentage of Donating
Taxpayers to Total
Taxpayers
Donations as a
Percentage of Taxable
Income
$ m no. $ m $ % %
Managers 1,293,397 126,173 574,744 583 1,013.66 44.36% 0.46%
Professionals 2,247,090 178,474 1,070,062 629 587.59 47.56% 0.35%
Technicians and Trades Workers 1,209,371 76,314 427,840 105 246.31 35.35% 0.14%
Community and Personal Service Workers 1,085,467 42,305 378,289 88 233.93 34.80% 0.21%
Clerical and Administrative Workers 1,588,081 84,571 686,295 202 293.74 43.14% 0.24%
Sales Workers 866,872 31,718 250,923 53 211.29 28.90% 0.17%
Machinery Operators and Drivers 629,899 39,040 246,437 60 242.38 39.08% 0.15%
Labourers 1,046,671 42,026 286,891 60 209.47 27.37% 0.14%
Other 2,903,140 120,081 622,900 836 1,341.84 20.88% 0.70%


![SAMPLE FUNDRAISING LETTER - runfornewhope.comrunfornewhope.com/wordpress/.../RunforHope_Sample… · Web viewAll donations are 100% tax deductible. ... and [enter your name] in the](https://img.pdfslide.us/doc/110x75/5b3ce98f7f8b9ace408dc173/sample-fundraising-letter-web-viewall-donations-are-100-tax-deductible-.jpg)