Embed Size (px)
Citation preview
An Examination of Structural Change in State Legislature Standing Committees
David W. Prince
Department of Political Science
University of Kentucky
Prepared for presentation at the 1999 Southern Political Science Association
annual meeting, Savannah, Georgia
November 3-6, 1999
ABSTRACT
The 1994 elections saw the Republicans come to power in the House of Representatives for the first time in forty years. The 1994 elections also resulted in Republicans gaining control of many state legislatures. Upon coming to power at the national level, the Republicans implemented changes in the committee system. Three committees were eliminated in the House of Representatives. Additionally, the Republicans did not adhere to a strict system of seniority in the selection of committee chairmen. Because of these structural changes to the committee system, many interesting questions have arisen. Using regression analysis, this thesis attempts to determine if the factors that were present at the national level affected the committee system at the state level. Through quantitative analysis this thesis will attempt to explain changes in the number of committees in state legislative bodies. Additionally, regression is used to examine the factors that affect seniority at the state level. Through the results of the analysis, it was determined that a change in the Speaker is the most important factor in explaining the number of committees in the lower houses of state legislatures. The years that a party was out of power were shown the most important factor in explaining the number of committees in upper houses in state legislatures. Changes in leadership and changes in the number of committees was found to be the major determinants in explaining changes in seniority in state legislatures. The major conclusion of this research is that the Speaker in lower houses has more control over committee structure and he or she probably uses committee structure to help advance his or her own personal political agenda.
The 1994 elections served to change, in many respects, the way we think about politics. Prior to the 1994 elections, many scholars had written about why the Republicans were entrenched in the White House while the Democrats controlled the Congress. In addition to winning the Senate, for the first time in forty years the Republicans were able to gain control of the House of Representatives, resulting in divided government with Democrats controlling the presidency and the Republicans controlling Congress. This governmental structure served to change many of the traditional thoughts of governmental control. Many interesting questions have arisen as the result of the change in the balance of power. Is this type of governmental structure temporary or have we entered a new era in party control and institutional dominance?
There are several goals of this first session. The first goal is to give a brief history of the committee system. It is extremely important that we understand how the committee system has evolved in order to enable us to better understand how reforms, following the 1994 elections, affect the committee systems and what are some possible explanations behind the reforms. The second goal is to review briefly the reforms that the Republicans implemented at the national level that affected the committee structure in Congress. Finally, this session will review what previous researchers have found concerning committees at both the national and state levels. Through this review of the literature, a foundation will be laid to examine two trends at the national level in order to determine if the trends are also present at the state level.
There are three objectives for this paper: 1. To explain changes in the number of standing committees in state legislatures from a
structural standpoint 2. To explain changes in the use of seniority in state legislatures from a structural
standpoint 3. Offer other possible explanations for changes in committee structure
The first trend that will be examined is the decrease in the number of standing committees. In recent years the committee system has appeared to become less relevant in the American political system. The first part of this paper will examine if the decrease in committees that is present at the national level is also present at the state level, and what factors may explain changes in the number of committees in a legislative body. The second trend that will be examined is the decreasing use of seniority in the selection process of committee chairs. Historically, most legislative bodies have adhered to a strict seniority system when selecting committee chairs and committee members. However, recent trends have seen a decrease in the use of seniority for selecting committee members and chairs at the national level. This research will seek to explain this trend to ascertain if it is only a national level phenomenon, or if the importance of seniority is also decreasing at the state level.
History of the Committee System
Congress is an extremely complex organization with many different integral parts. Committees have long been an essential component in the functioning of Congress. The founding fathers gave Congress tremendous latitude in organizing itself (Shepsle 1988). From early in the history of the country, lawmakers have been torn between establishing a system that would lend itself to effective lawmaking and one in which too much power was concentrated in the hands of only a few members. Many members, especially in early Congresses, were not willing to delegate power to the leadership or to small groups of members (Shepsle 1988). The importance of the committee system has changed over time. In the early years of Congress, members were still aware of the way in which the British House of Commons operated
and they were careful to implement a system that maintained equality of legislators and would not lead to a system in which an elite few made the decisions (Smith and Deering 1990). The early Congresses did not need an elaborate committee system, although one would become necessary later when the workload of members increased. In the formative years of the nation there was a reliance on the House and Senate chambers and ad hoc or select committees to consider legislative proposals. In many instances the broad outline of a bill was determined in the committee of the whole, which is the full body of the legislature, and then the bill was referred to an ad hoc or select committee to help establish the details. The committee of the whole acted as a committee, in effect, but consisted of all the members of the House or the Senate (Shepsle 1988). The appointment of so many ad hoc committees took up valuable time that could have been spent doing other tasks. As the United States progressed from the early days of a new Republic, more and more issues began to face the country. With an increase in the number of issues, the workload for members of Congress increased dramatically. With so many new issues facing members of Congress, it was nearly impossible for every member to be knowledgeable about every subject. Because of the increased workload, the House created permanent committees. The first Congress created a standing committee on Enrolled Bills in 1789, but it was 1794 before additional committees were created. In 1794 the Committee on Elections and the Committee on Claims were created. This was followed by the creation of the Committee on the Revision of the Laws and the Committee on Commerce and Manufactures in 1794. By 1810, the House of Representatives had created 10 standing committees. During the administration of President James Monroe the committee system expanded considerably. There was an increase in the reliance on standing committees between the War of 1812 and the Civil War (Smith and Deering 1990). These standing committees differed from the select committees in several ways. First, they were permanent structures. Second, they had a defined jurisdiction. Third, their membership was not restricted to just a single bill, and they lasted beyond the consideration of any single bill. Fourth, standing committees were able to originate legislation. Fifth, they were not required to report legislation out of the committee. “In effect, they possessed both agenda and veto power” (Shepsle 1988, 465). The rising numbers of standing committees brought with them a change in the way bills were handled. In the past, bills were referred to a committee after being looked at by the full body of the House or Senate. With the increasing numbers of standing committees, bills were referred to committees first and then referred to the full House after being considered by the committee. Bundling legislation dealing with similar topics is a major advantage of a system in which standing committees are utilized (Hamm and Hedlund, 1994). The advantage of being able to group legislation together is an advantage that is lost in a system in which ad hoc committees are formed to deal with each legislative matter.
The existence of a system of permanent standing committees also provides for the establishment of expertise in a particular area (Smith and Deering 1990). Many members stay on the same committee across many sessions and this allows them to build expertise. When members are allowed to build up an expertise in a certain area, they become a resource for information for other members about how to vote on specific issues. A member voting on a piece of legislation may make a more informed vote by gaining information from a colleague who has become an expert about a subject through his experience on a committee for multiple legislative sessions. During the latter part of the 19th century, committees acquired much of their present day authority and power (Smith and Deering 1990). They became major policy making bodies and helped to set the agenda for the Congress. Committees were no longer just used to figure out the technical aspects of legislation, but in many cases, were given authority to legislate exclusively in certain areas. They also began to gain the power of killing legislation before it ever reached
the floor of the House of Representatives. By the turn of the century, committees had gained a great deal of autonomy not only from the chamber itself, but from the political parties. Much of the real power rested with the chair of the committee who exercised tremendous control over the committee’s business (Smith and Deering 1990). At the turn of the century the committee system had increased at such a rate that it became extremely difficult to facilitate coordinated policy making. In many cases several committees had jurisdiction over the same piece of legislation. In 1913 the number of standing committees peaked at 61 in the House and 74 in the Senate (Smith and Deering 1990). Many of these committees had not held meetings for many years or reported a bill. A large number of committees made it difficult to decide which committee should consider a bill. The 20th century brought about a retrenchment of the committee system with committees being reduced. The reduction of committees eliminated some of the problems of overlapping jurisdiction. Committees have been part of the structure of American state legislatures for many years. Committees have been a feature of American legislative bodies since their use in colonial assemblies (Hamm and Hedlund 1994). A core of committees has existed in most state legislative chambers over numerous two-year sessions. “Basic state-policy responsibilities have been represented by some type of committee for decades” (Hamm and Hedlund 1994, 673). Committees that have existed in some form over the decades include committees that deal with financial issues such as appropriations, revenue, and ways and means. Additionally, committees have been established to deal with education, business or commerce, and local government. Over the years the names of committees dealing with the specific areas have changed, but their presence in most state legislatures has not changed (Hamm and Hedlund 1994). The number and types of committees are continuously changing due to new concerns of the state. In some cases committees are created to deal with legislation in a particular session of the legislature, and in other cases the jurisdiction of existing committees is expanded to deal with the new concerns and issues. Hamm and Hedlund summarize how the development of the committee system has helped the country adapt to changing times:
Utilization of these devices has permitted the collective decision-making nature of a legislative body to be maintained amid the transformation from a slow-paced, relatively unified eighteenth century agrarian political society to a fast-paced, diverse urban society of the twentieth century (1994, 669).
1994 Republican Reform of the Committee System
House Republicans implemented many changes to the committee system as part of their “Contract with America” (Davidson and Oleszek 1995). Their changes have decreased the power of the committees and put more power into the hands of the leadership. Many of these changes are unlikely to be undone in the future even if the Democrats regain control of Congress. Several of the reforms continue past trends started under Democratic control (Davidson and Oleszek 1995). Additionally, Democrats will benefit from many of the changes if they regain control. They will be in a better position to pass their programs instead of competing for power among themselves. One of the first reforms of House Republicans was the elimination of proxy voting in committees (Davidson and Oleszek 1995). Proxy voting is the process that allows a committee chair, or a designee of the chair, to cast votes for members that are not present. Proxy voting puts a great deal of power in the hands of the committee chair. A chair that has proxies can easily defeat amendments by the minority party. When the committee leader controls the proxies
of committee members, minority members are unable to work out deals with members of the majority and perhaps defeat the position of the committee chair (Smith and Deering 1990). The Republicans had attempted to eliminate proxy voting for committees in the past, but in 1995 they followed through with its elimination, although it tended to hurt the majority party (Davidson and Oleszek 1995). The Republicans have to make sure all of their members are present at committee votes or risk losing to a Democrat minority that is present and votes together. The elimination of proxy voting is an effort to decrease the power of committee chairs, and thus return power to the leadership which selects the members of the committees. Additionally, the elimination of proxy voting increases the accountability of members. Members can no longer just avoid going on record about a particular issue by not showing up to vote. With the elimination of proxy voting, the member has to show up and be accounted for, or risk the loss of the vote to the Democrats. In addition to the elimination of proxy voting in committees, the Republicans also reduced the size of committee staff and the number of standing committees and subcommittees (Davidson and Oleszek 1995). The elimination of staff, however, will primarily affect the Democrats, because the Republicans will have more staff since they are in the majority. Republicans, in their reform of the committee system, eliminated three standing committees-- the District of Columbia, Post Office, and Merchant Marine and Fisheries committees, and transferred their functions to other standing committees (Davidson and Oleszek 1995). The Senate eliminated some subcommittees, but did not eliminate any of its standing committees. This is probably not the drastic cut that many members would have liked to see. The elimination of these committees, by the House, basically brings the House of Representatives in line with the Senate. The Senate eliminated its District of Columbia and Post Office committees in 1977, and has never had a Merchant Marine and Fisheries committee. The jurisdictions of the District of Columbia and the Post Office committees were placed under the Government Reform and Oversight Committee, while the duties of the Merchant Marine and Fisheries Committee were placed under the jurisdiction of three other committees. The elimination of the standing committees in the House of Representatives probably has few political ramifications for the Republicans. The Post Office, District of Columbia and Merchant Marine and Fisheries committees basically served Democratic constituencies. The postal and maritime unions are overwhelming Democratic. The District of Columbia is also overwhelmingly Democratic, which is evident by its vote in presidential elections. In addition to the elimination of three committees, the House Republicans also renamed some of the committees to reflect Republican interest. For example, the Committee on Education and Labor was renamed the Committee on Economic and Educational Opportunities (Davidson and Oleszek 1995). Education and Labor generally reflect Democratic ideas and constituencies whereas the name of Economic and Educational Opportunities is more in line with Republican constituencies. On March 15, 1995 the Republicans approved a 30 percent cut in the funding for committees in the House of Representatives. The House Republicans also consolidated several committees’ accounts. The various sources from which committees received funds were consolidated into one account. Previously, committees had received funds from three sources. Under House Resolution 107 committees were to draw funds only from one source (Congressional Quarterly Almanac 1995). In addition to the elimination of standing committees and the slashing of committee budgets, the Republicans also eliminated subcommittees and attempted to limit the number of subcommittees that each standing committee can have. Republicans limited each committee to no more than five subcommittees, with the exception of the Appropriations, Government Reform and Oversight, and Transportation. (Davidson and Oleszek 1995). Republicans also cut the size of committees, but they probably did not go as far as some would have liked. It is extremely difficult to cut the number of seats on committees when there
are a large number of members wanting seats. This is especially true on the most prestigious committees. Matters were complicated by the large number of freshman members who entered the House in 1994. The leadership can use committee assignments to reward those members who are loyal to the party position. With a reduced number of seats, it becomes more difficult to use committee assignment as a reward mechanism. The Republicans are able to set the ratio of majority to minority members on each committee, and as the majority party, the Republicans have a greater number of seats than Democrats. The Republicans have generally given themselves 55 percent of the seats on each committee, but on the most important committees such as Appropriations, Budget, Rules, and Ways and Means, they have given themselves even a higher proportion of the seats in order to make sure they are able to enact their programs (Davidson and Oleszek 1995). In a further effort to centralize power in the leadership, members are limited to six years as chair of a committee (Davidson and Oleszek 1995). Limiting the terms that a member can serve as chair prevents the member from building up his or her own power base and influence. The limiting of terms of chairs should help in breaking down the decentralized system of power that has been present for many years. While seniority is still an important criterion in the selection of committee chairs and committee assignments, it is not the sole factor in the selection of a chair. Party loyalty has become an extremely important factor in the selection of committee chairs as was seen in the 104th Congress. For example, Robert L. Livingston was chosen as chair of the House Appropriations Committee despite the fact that Joseph M. McDade of Pennsylvania, John T. Myers of Indiana, C.W. Bill Young of Florida, and Ralph Regula of Ohio had more seniority than Livingston (Congressional Quarterly Almanac 1995). Thomas Bliley Jr. of Virginia was selected as chairman of the Commerce Committee, but Carlos Moorhead of California and Billy Tauzin of Louisiana had more seniority than Bliley. Members selected to chair committees were more supportive of the Republican agenda, and therefore, would quickly report legislation out of committee that reflected the items in the Contract With America. The party leadership did not want an item in the contract killed because a chair refused to report it. With the election of a large freshman class to the 104th Congress, many of these individuals do not want to wait for years before they become chair of a committee. With term limits placed on committee chairs, freshmen will be able to move up the ranks much faster than would have previously been the case. The second part of this paper will examine the breakdown in seniority that is present at the national level and attempt to determine if the same trend is present at the state level.
National Level Findings
Woodrow Wilson was one of the first individuals to address the role of committees in the American political system. In his Congressional Government, Wilson wrote about the importance of the committee system. He believed that the real work of Congress took place in committees. Wilson (1885, 69) wrote: “ ....it is not far from the truth to say that Congress in session is Congress on public exhibition, whilst Congress in committee rooms is Congress at work.” Wilson, in Congressional Government, argued that the Speaker of the House does not have a whole lot of power beyond the appointment of the committees. He believed that the committees are where power is really located in the Congress. The work of the House is done by the committees and not by the speaker and the leadership. Wilson (1885, 58) writes “ The leaders of the House are the chairmen of the principal Standing Committees.” He continues by writing that there are many different leaders in the House of Representatives:
The House has as many leaders as there are subjects of legislation; for there are leading classes of legislation, and in the consideration of every topic of business the House is guided by a special leader in the person of the chairman of the Standing Committee, charged with the superentendence of measures of the particular class to which that topic belongs (Wilson 1885, 58-59).
Wilson saw the organization of the House as being extremely complex and therefore, it is extremely difficult for uninformed observers to understand how the system works. Many outsiders would probably see the House of Representatives as being an institution in which little order exists and things tend to be done in a haphazard manner. Wilson also addresses the difficulty that a new member has with adapting to the way that things work in Congress. A new member does not have the experience which is crucial for success in the House of Representatives and its committee system. Wilson (1885) writes about committee government and the necessity in learning the powers and the procedures of the Standing Committees. If a member does not learn the powers of the committee, it will be extremely difficult to get anything accomplished. Wilson (1885, 63) also examines the problem of jurisdiction of the committees. There are many bills that affect several different areas, and therefore, which committee to refer the bill to becomes an important question. He sees the Committee of Ways and Means and the Committee on Appropriations as being the most important. The subjects that these committees cover always receive prompt attention in the House, while other matters may not. Wilson also states that reports from the Committees on Printing and Elections always receive immediate attention. It is very difficult for the other committees to get their measures to the floor for consideration (Wilson 1885, 65). Wilson was writing at a time when committee hearings were not open to the public as they are today. In modern America, citizens can see the work of committees on television, or can attend the meetings in person. In many ways, members at work in committees in modern American are on public display. Many members are very aware that everything they say or do is being televised. In many cases, what takes place in committees is for the benefit of a television audience and not really aimed at trying to move legislation out of committee to the floor. Other scholars have built upon the early work of Wilson by examining the committee system from a different perspective. Studies have tended to offer a more in-depth analysis of the functioning of the committee system in the American political system. Richard Fenno (1973) did a comparison of six committees, in which he looked at the Appropriations, Ways and Means, Interior, Post Office, Education and Labor, and Foreign Affairs committees. He argued that the decision making process of committees differs because “ member goals, environmental constraints, and, hence, strategic premises, differ” (Fenno 1973, 280). Fenno (1973) identified three basic members’ goals. First, members desire to be reelected. Second, they desire to gain influence within the House. Third, they desire to establish good public policy. Fenno also looked at a member’s goal of having a career beyond the House, but this was not the major focus of the study. Additionally, he identified the goal of members to make private gains, but this was an issue which was not explored in the book. Fenno (1973) identified four basic environmental constraints on members of Congress. Members of the parent House, members of the executive branch, members of clientele groups, and members of the two major political parties were seen as environmental constraints placed upon members of Congress. All of these factors play a role in affecting how members of Congress behave in carrying out their legislative duties. Environmental constraints, however, affect different committees in different ways.
Additionally, Fenno (1973, 46) addresses questions that must be addressed by each committee member in the decision making process:
Are there, in each committee, any agreed prescriptions for decision making - particular any substantive decision rules - which might help us as we move to view the committee less as an aggregate of individuals and more as a working group? Each member of each committee faces this strategic problem: how shall I proceed in the committee to achieve my personal goals, given the environmental context in which my committee operates?
In contrast with Fenno’ s work, which looked at committee members’ goals from a more general perspective, Reeves (1993) offered a more focused study in which he examined the leadership style of three committee chairs. He looked at three chairs of the committee on Education and Labor -- Graham Barden, Adam Clayton Powell Jr. and Carl Perkins. Graham Barden, a conservative Democrat from North Carolina, became chair of the committee in 1950. During the 1950s when he served as chairman, the rules allowed for him to act in an autocratic manner in ruling his committee (Reeves 1993, 74). He focused primarily on stopping legislation instead of using his power as chairman to support a positive agenda. In the 1950s institutional resources were more important to a chairman than his or her personal qualities. The late 1950s saw the removal of some of the institutional power of the chairman and led to an increasing importance of personal factors in order for the chair to be successful (Reeves 1993). Adam Clayton Powell Jr., was the second chairman Reeves examined. Powell, a Democrat from New York, held the chairmanship of the Committee on Education and Labor during a period in which there was a large number of social reforms occurring. He became chairman in 1961 at the beginning of the Kennedy administration, and ruled his committee in a manner different from what was seen during Barden’ s tenure as chair (Reeves 1993). Kennedy and Powell had many of the same political beliefs; therefore, Powell was able to influence greatly the success of Kennedy’ s proposals. Powell, in contrast to Barden, was more interested in passing legislation than he was in stopping legislation. He was seen as being a “ good chairman” by most of the members of his committee (Reeves 1993). In his reign over the Education and Labor committee, he used both institutional prerogatives as well as personal factors to exercise control over his committee. Powell, as chairman, was much more willing to let subcommittees carry out their work without being dictated from the chair. Additionally, he was willing to let others do the work while he received the “ perquisites of the office (symbolic and material), and generally let others run the legislative show” (Reeves 1993, 138). Carl Dewey Perkins, a Democrat from Kentucky, became chairman of the Committee on Education and Labor in 1967 (Reeves 1993). He did not face many of the issues that previous chairmen had faced because many crucial questions had been decided during the chairmanship of Adam Clayton Powell. Perkins, however, did face new challenges that previous chairmen had not faced. Many of the institutional resources that chairmen had previously possessed had been curtailed, and this led to new challenges for him as committee chair. He had to rely mostly on his personal resources in order to be successful as committee chair. “ Perkins found rewards a better strategy than sanctions in eliciting support from his members. He chose to make resources available to members of the committee and to keep his members apprised of what was going on in the areas under their jurisdiction” (Reeves 1993, 210). Reeves (1993) stated that the prevailing view of institutional leadership is that the leadership has little influence on the organizations they head, and that organizations tend to be shaped by their environments instead of their leaders. After examining the leadership of Barden, Powell, and Perkins, Reeves concluded that the traditionally held view that committees were
shaped by their environment and not their leaders, was inaccurate. Each of the chairmen Reeves studied conducted the business of the committee in a markedly different manner, and as the result of their different leadership styles, contributed to a different manner in which the committees operated. Where Reeves (1993) examined the leadership styles of committee chairs, Melissa P. Collie and Brian E. Roberts (1992) asked why members of Congress choose to chair the committees they do in the first place. Their analysis examines senators that have been in the position to chair two or more committees during the period from 1950 to 1986. Collie and Roberts (1992) found that the decision as to which committee to chair, has been associated with more than one-third of the committee chair vacancies that occurred during the last quarter of a century. One factor that goes into the decision making process is the relative prestige of the committees. Another decision making factor is the effect that the next person in line for the committee chairmanship would have on the policy objectives of the member who is deciding which committee that he should chair. “ In general, senators opted for the chair of the more prestigious committee and opted to chair the committee where the policy interests of the heir apparent were the more threatening” (Collie and Roberts 1992, 242). Collie and Roberts (1992) identified prestige as one of the factors in selecting which committee to chair. Michael C. Munger (1988) looked at the allocation of desirable committee assignments to all members. Just as some committees were seen as being more desirable to chair, some committee assignments are seen as being more valuable than others. Munger (1988) addresses two institutions that have evolved to assist in determining how committee assignments are rationed out. Queuing and committee expansion are two ways in which to ration committee assignments. Each committee assignment may be thought of as a queue where the number of years of continuous service on a committee determines the place in the queue. This queue not only takes into account those members that are already on the committee, but those who wish to serve on the committee in the future as well. Under this type of system, the leadership promises one member the next opening on a committee and another member the opening that occurs after that. This type of system assumes the number of seats on a committee does not change. The leadership can, however, expand the number of committee seats if the demand for seats on a particular committee increases. The alternative to queuing is the expansion of committee size, however, the expansion of committee size may make committees less attractive to members, but this is a factor that has been largely ignored. James W. Endersby and Karen M. McCurdy (1996) had results which were similar to Munger (1988) who discovered that some committee assignments are more desirable than others. Endersby and McCurdy (1996) looked at committee assignments in the U.S. Senate. They attempted to measure the relative value of committee seats. They assume that members who change committees from one legislative session to the next are doing so in the effort to improve their own political and electoral position. In their analysis, Endersby and McCurdy use two different models to measure Senate committee prestige. They conclude that models that were established to measure committee prestige in the House of Representatives can be used to measure effectively committee prestige in other legislative bodies as well. Senators, like members in other bodies, have common preferences when it comes to committee assignments. Reeves (1993), Fenno (1973), Collie and Roberts (1992), Munger (1988), and Endersby and McCurdy (1996) approached their studies of committee systems from a more internal perspective of what goals committee members and chairman wished to obtain, and how they go about obtaining these goals. Randall Strahan (1990), in contrast, focused on the context in which a committee operates, thus taking a more external approach in examining the committee system . He examined the Ways and Means Committee following the congressional reforms of the 1970s. The Ways and Means Committee has differed in significant ways since the 1970s. In the 1950s and 1960s the Ways and Means committee was an integral part of a House which was largely decentralized. In the 1970s and 1980s, one has to give more attention to the parent institution
and to the social and political environment in which the committee operated (Strahan 1990). This was in contrast to the findings of Reeves, who concluded that environmental concerns were not as important as many had perceived them to be. One of the most important reforms that occurred in the 1970s was the election of committee chairs through the party caucus rather than selection based totally on seniority (Strahan 1990). Additionally, the 1970s brought about increases in the size of the Ways and Means committee. Bruce A. Ray and Steven S. Smith (1984) also looked at the size of committees in the U.S. Congress. Strahan’ s (1990) findings of increases in the size of the Ways and Means committee were consistent with the findings of Ray and Smith (1984) . They found that there was an increase in the number of committees seats across all committees. From 1947 to 1982, the number of standing committees in the U.S. Congress increased by three in the House and by one in the Senate. However, even though there was not great change in the number of committees, there was a great increase in the number of committee seats in congress. Ray and Smith argued that change in the number of committee seats are the result of changing political conditions rather than the effort to gain support from rank and file members.
State Level Findings
In contrast with the national level, little research has been conducted on the committee system at the state level. Rosenthal (1974, 7) wrote: “ When it comes to standing committees, congressional research is considerably ahead while state legislative research lags far behind.” He wrote that any study concerning standing committees must basically begin from scratch. “ Little presently exists from which to generalize or on which to base conclusions” (Rosenthal 1974, 7-8). C. I. Winslow (1931) produced one of the few early works on standing committees in state legislatures that covered the subject with any depth. Winslow, in his study, provides statistical data on the structure of standing committees for every state. Included as part of his study, he provides information about the number of committees, the size of committees and the number of committee assignments. In addition to his statistical information, he conducted a study of Maryland and Pennsylvania in which he found that the committee’ s action on a bill is final in 80 percent of the cases.
Rosenthal’ s (1974) work was one of the few in-depth works conducted on committees in state legislatures since Winslow’ s 1931 work. Rosenthal (1974) examined various aspects of committee performance in several states, but little in-depth analysis of state committee systems has been undertaken. In the intervening years since Rosenthal’ s book, some progress has been made concerning committee systems at the state level, but there is still much to be learned. Political scientists have long been concerned about where the important decisions concerning legislation are made. A study of the U.S. legislative process reveals that there are many different points of decision making for legislation. Each of the different decision making points for legislation can have a profound impact on the outcome of legislation (Hamm and Hedlund 1994). Subcommittees, legislative leaders, the governor, administrative agencies, floor debate, interest groups, constituents, and committees are factors that play an important role in the legislative decision making process (Hamm and Hedlund 1994). Previous research has considered variations in decision making within committee systems. Hamm (1980, 49) wrote: “ The legislative committee decision making process tends to screen out a substantial number of bills that have extralegislative opposition; in turn this may reduce opposition once bills reach the floor.” Hamm concluded that if there is strong extralegislative opposition to a bill, the chances of the bill passing the committee stage are greatly reduced. If there is no opposition to a bill at the committee hearing, the chances of the bill passing are greatly enhanced. Standing committees were formed for the purpose of dealing with matters that are related to the name of the committee (Hamm and Hedlund 1994). They were instituted to help make the
decision making process more efficient. A problem that has risen with standing committees is the question of jurisdiction. In many cases there is overlapping jurisdiction for a piece of legislation. The decision on which committee it should be sent to is of key importance to the success of the legislation in some instances. The system of standing committees, that has been put into place, has allowed for legislators to specialize in a particular area. Most researchers tend to make the assumption that committees make a difference in the policy making process. Much of the impact of committees on the decision making process is seen as being the result of specialization of committees and subcommittees (Hamm and Hedlund 1994). Committees have been put in place primarily to deal with the increasing range of policy concerns. A question that is put forth by Hamm and Hedlund (1994) is if changes in the number of committees leads to an increase or decrease in specialization. Some scholars have argued that reduction in the numbers of standing committees has actually led to an increase in specialization instead of the decrease in specialization which one would expect (Hamm and Hedlund 1994). Basehart (1980) also dealt with the issue of specialization and members establishing expertise in a particular area. He examined the relationship between membership stability and the extent to which committees have chairs and members who have experience dealing with a particular issue because of continuous service on the committee. He also found that many committees at the state level lack stability. In many cases the membership and chairs of committees are continuously changing and thus making committees less effective. Basehart (1980, 66) concluded that “ With the exception of one indicator- the percent of chairmen who were serving at least their second legislative term- membership stability is closely associated with the other indicators of experience and continuity.”
In 1917, the average number of standing committees in state senates was slightly greater than 31 and the range was from five in Wisconsin to sixty-two in Michigan. In the lower houses of state legislatures the average number of committees was around forty, with a range from fourteen in Rhode Island to sixty-five in Kentucky (Hamm and Hedlund 1994). In the next several decades there was not a lot of change in the number of standing committees. During the period from 1949 to 1969, significant decreases in the number of committees in both the lower and upper houses occurred. In 1969, the average number of committees dropped to slightly below 20 in upper houses, while the number dropped to below 23 in lower houses of state legislatures (Hamm and Hedlund 1994). The decreasing number of committees has generally weakened committees in state legislatures. There are various factors which help account for the weakening of the committee system at the state level. Committee assignments at the state level tend to be controlled by the party leadership. Therefore, the committees are tools of the leadership and they do not have a lot of autonomy. Additionally, in some state legislatures, rules exist which allow bills to come to the floor without being considered by committee. Wayne Francis (1989) conducted a study that examined the importance of committees in state legislatures and he found that committees tend to be weaker in some states than in others. He looked at whether power resided with the committees or if power was retained by party leaders. In a survey conducted by Francis (1989 , 41) the following question was asked of legislators: “ In your legislature where would you say the most significant decisions are made?” Legislators were given the following possible responses:
1. Office of Presiding Officers or Majority Leaders 2. Regular Committee Meetings 3. Party Caucus 4. In Governor’ s Office 5. On the Floor
6. In Policy Committee 7. In Subcommittees 8. Pre-legislative Session 9. Other
Francis (1989) found that committees were important in 81 of the 99 chambers. In 15 chambers committees were the only decision making bodies within the legislature. In 29 chambers committees shared power with party leaders. Additionally, in 16 chambers committees shared power with the party caucus and in 21 chambers power was shared among committees, party leaders, and the party caucus.
Francis (1989) found results which were consistent with what he and Riddlesperger (1982) had found earlier. Francis and Riddlesperger (1982) attempted to look at the importance of committees in the states. They saw the committee system as increasing in importance at the time they were writing. Committees are the primary way in which legislatures respond to the increasing number of needs of the states (Francis and Riddlesperger 1982). “ State legislatures have become the principle centers of decision making” (Francis and Riddlesperger 1982, 469). The committee system, however, may be declining in importance. In many cases the leadership is becoming more and more important in the decision making process. This is especially true at the national level. As Smith and Deering (1990) have noted, there tends to be a decreasing importance of the committee system at the national level. This is a trend which is also appearing at the state level as well. Wayne Francis (1985, 243) wrote: “ The role of elected party leadership, the caucuses, and the committees in the management of legislative business varies considerably among state legislative chambers in the United States, depending in part upon the majority party’ s percentage of seats and in part upon the size of the chamber.” Francis (1985) concludes by stating that legislative leaders have many important decisions to make which affect management of legislative business. Among the most important decisions made by the leadership is the way in which committee positions are filled. In most cases, the leadership attempts to accommodate the requests of the members when assigning positions (Francis, 1985). This approach to assigning committee positions enables the leadership to gain some influence over members who owe their position to the leadership. In most instances, the leadership has great flexibility in determining the size of the committee, thus the leadership is able to increase or decrease the number of seats on a committee based on demand. The style of the leadership management is partly a function of the features of the chamber and the party structure (Francis 1989). In many cases, a lack of party competition in a chamber leads to a lack of party control. Wayne Francis (1989) addresses the question of determining an optimal size for a committee. Francis (1989, 114-115) found that size is based on two criteria:
the optimality estimate in large chambers is about eleven, whereas it is closer to seven in smaller chambers.... In large chambers that experience high subcommittee use the optimal committee size estimate moves upward to between twelve and thirteen-as opposed to approximately nine where there is low subcommittee use. In small chambers (80 or less), however, the use of subcommittees seems to make very little difference in response patterns.
Francis (1989) concluded that the leadership in state legislatures tends to have a great deal of leeway in determining the number of seats on a committee. Additionally, Francis (1985)
determined that the leadership tends to be responsive to members wishes in the assignment process. Hedlund and Patterson (1992) also looked at the committee assignment process at the state level. They tested the reelection hypothesis which is that legislators receive committee assignments which help them to win their next election, and found that the effect of electoral margins on committee assignments was not significant. Hedlund and Patterson (1992) also found that legislators make strategic decisions in the requesting of committee assignments. Legislators tend to take in to account the number of committees requested and the demand level for these committees (Hedlund and Patterson, 1992). Hamm and Hedlund (1990) attempt to account for the change in the number of state legislative committee positions. In their research, they attempted to account for these changes through the development of five models. They found that the number of committees, the jurisdiction, and the number of positions on the committee tend to be altered by legislative leaders from session to session. Hamm and Moncrief (1982), prior to Hamm and Hedlund (1990) which looked at the alteration in the number of committees from session to session, examined the effects that changes in committees have on subsequent committee performance. They found that changes in committee structure had the most noticeable effect on those activities that the committees could most easily control, such as the screening and shaping of legislation. Additionally, the magnitude of the performance change is a direct product of the combined effects of the structural changes. Previous research had looked at the role that the leadership and committees play in the decision making process of state legislature, but little attention had been paid to the role of parties in that process. Hedlund and Hamm (1996) looked at the roles that political parties play in the organization of state legislative committees. They found that in most of the state legislative chambers, no written rule existed which required the strict use of seniority in the selection of committee members, thereby decreasing the powers of the political parties. Many party leaders suggested that, while seniority may play a role in the selection process of committee members, it is not a constraining factor in the selection process of committee members. Additionally, the minority party tends to exercise control over the appointment of its members in about one-half of the cases. Five percent of the committees were found to be chaired by members of the minority party. The proportion of the seats that each party held on each of the committees was generally found to be in close approximation to the percent of seats the party held in the chamber. The professionalism of a legislature affects the number of committees that are present in a state legislature. In most cases, the more professional the legislative body the greater the number of committees. Squire (1992) looked at professionalism in state legislatures. He establishes a measure of professionalism in which he uses the United States Congress as a baseline to relate the attributes that are present in other legislative bodies. Squire (1992) collected data from 1986 to 1988 on member pay, staff members per legislator, and total days in session for Congress and each of the fifty state legislatures. These indicators are consistent with those found by other scholars including Mooney (1995). In Squire’ s study the measure indicates how closely the body approximates characteristics of Congress. If a state legislative body has a level of professionalism of one, then the body has all of the same characteristics that are present in Congress. If the body has a professionalism level of zero, then the legislative body is totally opposite from the characteristics of Congress. Squire (1992, 74) found that New York had a professionalism level of .659, while New Hampshire had a professionalism level of .042. Therefore, the New York legislature most closely resembles Congress, while the New Hampshire state legislature possesses characteristics that are least like Congress. The professionalism of a state legislature is likely to have a profound effect on the number of committees in a state legislature. The more professional a legislature the more days in session and the greater the work load. Therefore, professional legislatures are more likely to have greater numbers of committees.
As shown in the previous section, most of the literature has tended to focus on the decision making process in state legislatures. Research has tended to focus on who makes the decisions in state legislatures and the results of these decisions. Additionally, little research has focused on why we see changes in the committee system in the first place. Does the leadership make most of the important decisions, or do the committees have a larger role in the process? Generally little research has been conducted which looks at the effects of party control and change in control on the committee system. In addition, little research has been conducted which examines seniority at the state level and why changes in the use of seniority occur. Hopefully, this paper will bridge some of the gaps on state committee structure and offer insight to what future research needs to be undertaken.
Theory and Hypotheses
The section will identify seven hypotheses which will be tested in this study. The first four hypotheses will look at changes in the number of committees, while the final three will look at changes in the seniority system. As shown in the literature section, research has been conducted which has looked at the committee assignment process, the effects of committee decisions, the centrality of committees to various state legislatures, committee size and so on. However, little research has been conducted that looks at why the number of committees has tended to decrease in recent years. Additionally, research has been conducted which examined the behavior of committee chairs, but paid scant attention to the assignment of committee chairs. As previously shown, a breakdown in seniority was present in 1994 at the national level. No research has been conducted which examines if this is a trend just present at the national level or if the breakdown of seniority is also present at the state level. This research will hopefully add to our knowledge of state legislative committees by addressing two phenomena which have not been looked at previously. Additionally, this study will suggest possible areas for future studies on state committees. When there is a change of control from one party to the other it is logical that the new party will want to change the committee system to reflect the interests and goals of the party. Additionally, it is logical that when there is a change of leadership, the new leader will want to change the committee system to reflect his or her personal interest. Fenno (1973) identified three goals of members of legislative bodies. They desire to be reelected, gain influence, and establish good public policy. Since members have these three goals they would naturally shape the committee system to assist in reaching these goals. Reeves (1993) also showed how members in power positions, such as committee chairs, use the committee system to promote their own agenda.
Hypothesis #1: When control of a legislative body changes from one party to another, the number of standing committees will change.
This hypothesis is consistent with what was observed in the House of Representatives in 1994 when there was a change in party control. The parties have different legislative priorities, therefore they will shape the committee system to reflect those priorities. A party is likely to add committees that reflect their interest and eliminate committees that reflect the opposition’ s interest. It will be determined if the change in the committees at the national level is also present at the state level when party control changes. Hypothesis # 2: When control changes from the Democratic party to the
Republican party the number of standing committees will decrease.
This hypotheses is also consistent with recent developments in the House of Representatives. House Republicans eliminated three standing committees. This hypothesis reflects the traditional views of the political parties. The Republicans have generally been seen as the party of less government, therefore one would expect that the party of less government would be more likely to eliminate committees. This second hypothesis will also allow us to determine if this is just a national phenomenon, or if this is also present at the state level. Additionally, this hypothesis will help us determine if one party is more likely to decrease the number of committees than the other. If this hypothesis is supported, we will be able to make predictions on changes in the committee system based on who is gaining power. Hypothesis #3: The longer a party has been out of power the greater the
change in the number of standing committees.
This hypothesis arises from the fact that when a party has been out of power for a long period of time, it has had little input on the current organization of the institution. Therefore, they are more likely to change the number of committees than in the situation where there are more competitive parties and power changes hands every few years. Hypothesis number three will help to determine if the changes that took place following the 1994 elections were just the result of a party coming to power after a long absence and, therefore, having little input into the current system. Hypothesis # 4: When there is a change in leadership the number of
standing committees will change.
This hypothesis is derived from the concept that when there is a leadership change in a legislative body the new party leader wishes to change the system to reflect his or her own interests. For purpose of this study, a change in leadership will refer to a change in the speaker for lower houses and a change in the majority leader and president pro tempore in upper houses. This hypothesis will be used to test if the changes that are occurring are the result of the actions of a particular political party, or if changes in committees are more likely to be a product of individual leaders. As previously stated, Fenno (1973) indicated the desire to gain influence as one of the goals of legislative members. A new leader can use the committee system to gain influence, therefore it is logical that when a new leader comes to power changes in the number of committees would occur. Francis (1989) found that committees were important in 81 legislative chambers and in 29 chambers they shared power with the leadership. Therefore, if so much of the power resides within the committees and a member has the goal of gaining influence, one would expect that someone in a leadership position would try to exercise control over the committee system. Hypothesis # 5: When there is a change in leadership the use of seniority
in the selection of committee chairs will decrease.
Hedlund and Hamm (1996) found that in most legislative chambers few rules existed which required the strict use of seniority in the selection of committee positions. Many party leaders stated that while seniority is used in the selection process of committee members, it should not be a constraining factor. This hypothesis is consistent with what occurred after the 1994 elections at the national level. Many senior members were passed over for committee assignments when the speakership in the House of Representatives changed from one individual to another (Congressional Quarterly Almanac 1995). This hypothesis will be used to test for the effects of changes in leadership on the seniority system in state legislatures.
Hypothesis # 6: When there is a change in party control the use of seniority in the selection of committee chairs will change.
This hypothesis is also consistent with what was present at the national level in 1994 with the change of party control in the United States Congress. With the change of control from one party to another, there was also a change in the use of seniority. In the case of House Republicans, seniority was not as much of a criterion in the selection of chairs as had been the case during much of the Democratic tenure.
Hypothesis # 7: When the number of committees increases, the use of seniority in the selection of committee chairs will increase.
The seventh hypothesis results from the rule in most legislatures that limits members to chairing one committee. As the number of committees increases, there are more committee assignments to go around. One would especially expect a legislative body with a large number of committees and a small number of seats in the body to have an especially high number of senior members who are chairing committees. The final hypothesis brings us full circle from where we began. The first four hypotheses were trying to explain why changes in the number of committees occur, while the next two attempt to explain changes in the use of seniority, and finally the last hypothesis attempts to relate how change in the number of committees affects the use of seniority.
Change in Numbers of Committees
This section will examine the first four hypotheses that were established previously. First, this section will present the independent variables that will be used for this part of the study. Second, the two models used in this study will be explained briefly. Third, an explanation of the methods used in carrying out this portion of the study will be provided, and finally the results of the analysis will be presented. There were four major changes which took place at the national level in 1994. The first four independent variables explained in the next section arise from these four phenomena. First, 1994 saw a change in party control of the Congress from the Democratic party to the Republican party. This occurrence was also seen in many state legislatures. As shown in table 1, Republicans were able to gain control of 8 upper houses and 11 lower houses. The second factor present in 1994 was a change in control from the Democratic party to the Republican party.
[Table 1 About Here]
In some state legislatures Republicans had not been in control since Reconstruction. The third factor was a change in control from a party that had been in control for forty years. Finally, 1994 saw a change in leadership at the national level with the speakership in the House changing from Tom Foley to Newt Gingrich and Bob Dole becoming the new majority leader in the Senate. Because change in leadership may be the most important factor in influencing the number of committees in a legislative body, it should be accounted for in the analysis. As stated by Francis (1985), state legislative leaders have many important decisions to make, including decisions about how the committee system will be structured.
Independent Variables
Change In Party Control
Two different change variables will be used in this study. The first change variable is a dummy variable which indicates if there is a change in control from one party to another. If there is a change of control from one party to another the variable will be coded as a one. If there is no change in party control the variable will be coded as a zero. A second change variable, that will be used in a separate regression analysis, is a variable coded as a one if there is a change of control from Democratic to Republican, and as a minus one if there is a change in control from Republican to Democrat. If there is no change in party control the variable will be coded as a zero. These variables are included in the study to determine if changes in the number of committees are the product of a change in control of the legislative body, and in the case of the directional change variable, to determine if a certain party is more likely to decrease the number of committees. In some instances, when a new party comes into power they desire to make changes in the structure of the legislature. A party that has controlled the legislature in the previous session is unlikely to make major changes in the number of committees since it has governed with the system in place. Years Out Of Power The number of years a party has been out of power could have an effect on the changes made when they come to power. When a party has been out of power for an extended period of time, it is more likely to implement change than if the party had been out of power for only one term. For purpose of this study, 1950 was used as the cut off date for determining this variable. In many cases, especially in the South, some states had not witnessed a change in party control since Reconstruction. The use of 1950 provides a long enough time period to determine if the number of years out of power are affecting the number of committees in the system. The number of years out of power is used instead of the number of legislative terms to take into account varying length of legislative session among states. Control of the State Legislature A third independent variable included in this study is control of the state legislature. The variable will be coded as a dummy variable with one representing Republican control and zero representing Democratic control. Republicans at the national level decreased the number of standing committees upon coming to power. The purpose of this variable is to determine if Republican control at the state level results in a decrease in the number of standing committees, since they have been traditionally viewed as the party of less government. This variable will not be used in the regression analysis that includes the directional change control variable. Leadership Change A fourth independent variable to be included in this study is change in leadership. For lower houses of state legislatures the variable will indicate if there has been a change in the Speaker of the House from one term to the next term. If there was a change in the speakership then the variable will be coded as a one. If there is no change in the office of the speaker then the variable will be coded as a zero. For upper houses of state legislatures two potential leadership positions exist. Some upper houses have a majority leader and a President Pro Tempore, while others have only one of the positions. For upper houses the leadership variable will measure whether there has been a change in the majority leader or the President Pro Tempore. The variable will be coded as zero if there is no change in either position and as one if there has been a change in one of the two positions. The two positions are included because the real position of power varies from one legislative body to another. Some states have only one of the two positions in their legislature,
therefore change in each of the leadership positions are combined into one variable of leadership change for inclusion in the regression analysis. Future research might involve the determination of where power exists in each of the states, but this was impossible to determine for this study due to a lack of information. Professionalism The effects of professionalism will be controlled for in this study. Generally speaking, the more professional a legislative body the greater the number of committees. For this study a measurement of professionalism was created which employed three determinants of professionalism- compensation, length of session and staff . These are factors which are consistent with Squire (1992) and Mooney (1995). Professionalism is measured for each term considered. Compensation is the first part of the professionalism measurement and consists of the salary that each member receives plus their per diems for the year. If a legislature meets biannually then the salary is divided in half to reflect what the member would make for one year. The second factor used in the measurement is the length of session. The length of session was the number of days that a legislative body could legally meet over a two year period, excluding a special session. A two year period was used to allow for the fact that some states only meet every other year while others meet for different numbers of days for each year during a two year term. In some cases the legislature may have met for the maximum number of days while in others they did not. For purpose of this research the maximum number of days is used due to the difficulty in obtaining the data for the 49 states examined in this study. The final factor included in the professionalism measurement is staff. There are three categories of staff - personal staff, district staff and shared staff. Since theoretically, personal and district staff is more important than shared staff, they are weighed more. For each type of staff a score was calculated equaling zero if none were present, one if part-time staff were present and two if full-time staff were present. Each state was given a score based upon if each of the three categories were full-time or part-time. Shared staff was weighted half of what personal and district staff were weighted. This resulted in a scoring ranging from zero, indicating no staff, to five designating full-time staff in each of the three categories. A state that had part-time staff in each of the categories would receive a score of 2.5.
The final measurement of professionalism is determined by taking a ranking for each of the three components and combining them to produce an overall ranking of professionalism. Each of the three components were given equal weight in the final measurement. To produce the final rankings the three rankings were added together resulting in a score from three, indicating a ranking of one in each of the three categories, to 147 indicating a ranking of 49th in each of the three categories. The rankings for 1995 are presented in Appendix A . The results for professionalism are consistent with those of Squire (1992).
Two Models of Committee Change
Actual Committee Change Model
For this study two dependent variables are going to be examined. The first dependent variable indicates the absolute value of the actual number of committees changed from one term of the legislature to the next. For example, if the legislature had 12 committees one session and 14 committees the next session the variable would be coded as a 2. The variable would also be coded as a 2 if the legislature had 14 committees one session and 12 committees the next session. The regression analysis run in this study will attempt to explain the dependent variable of changes in the number of committees using the independent variables previously discussed.
Proportional Committee Change Model The second model to be considered uses a different dependent variable. The second dependent variable developed for this study is a proportional change in the number of committees. A legislature that did not see change in the number of committees would be coded as one hundred percent, while changes in the number of committees would be indicated by a number greater than one hundred percent. The second model to be considered uses a different dependent variable in the effort to control for the fact that one committee change in a system that has thirty committees may not be as significant as one committee change in a system that has only a few committees.
Methods
The data used in this study were obtained from the Books of the States from 1983 until 1995. Nebraska was omitted from this study because it has an unicameral nonpartisan legislature. Additionally, Connecticut was omitted from this study because it has only joint committees, and Maine was excluded from the analysis for 1985 and 1987 because it had only joint committees during those legislative sessions. This study will examine both models of committee change that were previously illustrated. The first regression analysis run will use the actual number of committees that changed as the dependent variable The independent variables will be change in party control, years out of power, control of the state legislature, and professionalism. The second regression analysis run will involve the removal of the change in party control variable and control of the state legislature, and replace them with a variable that indicates the direction of change in party control. This will help to validate the results of the previous analysis, since changes in control and party control may be closely related. The third regression analysis examines the second model of committee change that uses a proportional increase or reduction in the number of standing committees as the dependent variable. The second model will include the same independent variables of change in party control, years out of power, control of the state legislature, and professionalism that were included in the first regressions. The final regression analysis involves the removal of the change in party control and control of the legislature variables and inclusion of the directional change variable.
Each of the four analyses will be run for all cases over the six term period and will for each individual term. Additionally, all regression analyses will be conducted for upper and lower houses of state legislatures to determine if differences exist between the two houses. From the regression analyses, it will be determined what variables had an effect on the number of committees over the six term period and in each of the legislative terms used in this study. Additionally, R square will be reported as an indication of how much of the variation in the number of committees is being explained by the independent variables included in this study.
Results
Actual Committee Change Model The first regression results involve the use of the actual number of committees changed as the dependent variable. The findings in lower houses indicated a change in the Speaker is the primary factor in explaining change in the number of committees. These findings were consistent with what was found in the United States House elections in 1994 with the change of the Speakership from Tom Foley to Newt Gingrich. The Speaker change was found to be significant
using both a directional change variable and separate variables that indicated control and change in control. For the period 1985 to 1995 an increase in the number of committees is found to be associated with a change in the speakership (see Table 2). This result was found using both the directional change variable and the separate control and change variables. This finding was consistent with the fact that there was a change in the number of committees after a change of speaker in the United States House. However, it was not consistent with the fact that there was a decrease in the number of committees in the United States House when there was a change in leadership. These findings offer support for the fourth hypothesis that when there is a change in leadership there is a change in the number of committees. These findings were found only to be significant for lower houses of state legislatures and not for upper houses. There may be various reasons why changes in leadership are significant in lower houses but are not in upper houses. First, the two houses may operate under different rules and depending upon the rules in the different bodies the leadership may have a major role in the determining what committees should be added, and which ones should be eliminated. In some states the leadership may play a major role in the committee assignment process, while in others the role of the leadership may be diminished or non-existent. As shown previously, Francis (1989) attempted to show where power existed in state legislatures. Additionally, upper houses tend to be smaller, therefore, individual members are able to wield more power than would be possible when there are a larger number of members. An additional explanation may lie in the fact that members may desire to stay in the upper house longer than in the lower house. In some cases a member may be using the lower house as a stepping stone to move up the political ladder to the state senate, which is generally seen as being more prestigious. Therefore, a legislator may stay in the upper house longer, thereby increasing his or her power base and decreasing the power of the leadership. These factors, however, are just speculation and more research needs to be conducted to explain why leadership changes proved to be significant in lower houses, but not upper. When evaluating the results across the six terms examined in the study, professionalism is significant in lower houses, but not in upper houses (see Table 2). The more professional a legislature the greater the number of committees. Regression analyses were also run for each legislative term that was included in the analysis. Professionalism did not prove to be significant for the 1985 session (see Table 3). However, professionalism was significant in the 1987 session (see Table 4). These results led to the same conclusion that was reached previously. The more professional the legislature the greater the number of committees. Professionalism does not prove to be significant for 1989 (see Table 5), but the results for 1991, 1993 and 1995 are consistent with what was previously found (see Tables 6-8). The results concerning professionalism are consistent with what one would expect to find. A more professional legislature would have more work to perform. Therefore, as the work load increases there becomes a greater need for division of labor in order to effectively and efficiently carry out the work of the legislative body. Regression analysis for each individual term revealed that different factors were present in 1985 that were not present during the entire time frame examined in this analysis. Using a .1 level of significance, the directional change variable proved to be significant leading to the conclusion that we would expect an increase in the number of committees when Republicans gain control of the House (see Table 3). This finding is consistent with what was predicted in hypothesis number one that when control of the legislature changed from one party to another the number of committees would change. However, this finding is not consistent with what was predicted in hypothesis number two, which states that when control changes from the Democratic party to the Republican party the number of committees would decrease. The regression analysis for 1995 also offers support for the first hypothesis that when
[Tables 2 to 8 About Here]
there is a change in control the number of committees will change. For 1995 we found an increase in the number of committees when there is a change in control in the lower house (see Table 8). The findings at the state level in 1995 were consistent with what was found at the national level in 1995, in that we saw a change in the number of committees with a change in control. However, it was not consistent with the fact that a decrease in committees was seen at the national level, while an increase was seen at the
state level. This may give some indication that a change in control may lead to a change in the number of committees, but we can not predict if there will be an increase or decrease in committees based on which party is gaining control. There may also be indication that a change in leadership may be more important than change in party control in explaining committee changes. A new speaker may increase or decrease the number of committees depending on what his or her political agenda is. The changes in leadership that proved to be significant in lower houses, were not significant in upper houses. The years that a party was out of power did prove to be significant in upper houses. Using a directional change variable for the six terms, we found that the more years a party is out of power the greater the increase in the number of committees (see Table 2). The years out of power also proved to be significant for the 1985 and 1991 terms using a directional change variable. For 1985 and 1991 we also found that the longer a party is out of power the greater the increase in the number of committees (see Table 3 and 6). The preceding results are consistent with what was predicted in hypothesis number three. There are several explanations which may serve to explain why the years out of power is significant in upper houses and not in lower houses. One possible explanation may be differing terms of office. In many cases, upper houses tend to be more stable in their membership. Upper houses may be more isolated from the whims of a new leader. Therefore, the years out of power may be the best factor in explaining changes in the number of committees. When a party has been out of control for a long period of time there may be a greater opportunity to change the number of committees due to the fact that members are not entrenched into the existing system. Some of the rules may give more power to individual members, thereby decreasing the power of the leadership in a system which has recently been controlled by that party. This is another area which needs to be examined in more detail in the future. The only other significant factors found for upper houses of state legislatures were for 1993. Professionalism and the directional change variable were found to be significant using a .1 standard (see Table 7). The more professional a state the greater the number of committees. Additionally, we would expect an increase in committees when the Republicans gain control of the upper house. It is very difficult to draw many conclusions from these results. They are based upon only one session and are significant only when a liberal .1 standard is employed. Proportional Change Model The results obtained using the proportional committee change model basically confirm what was found using the actual committee change model. The magnitude of the change, however is not as great as what was found using the actual committee change model. In state houses a change in the leadership again proved to be significant over the six legislative terms that were examined. There is an increase in the number of committees when there is a change in the speaker (see Table 9). This finding was found using both the directional change variable and separate change and control variables. This result was consistent with what was found under the previous model. These findings are also consistent with what was predicted
[Table 9 About Here]
in hypothesis number five, that when there is a change in the leadership the number of committees will change. Professionalism was found significant using the second model as well. The more professional a state the greater the number of committees (see Table 9). Professionalism was not found significant for 1985 (see Table 10). However, professionalism was found to be significant for the 1987 session. The finding for 1987 was similar with previous results (see Table 11). Additional research needs to be undertaken to determine why professionalism is significant for the 1987 term, but not for other terms. Professionalism is only significant in upper houses for 1993 using a .1 standard (see Table 12). This finding was consistent with the other findings that found that the number of committees increases as the legislature becomes more professional. While a change of leadership proved to be the most significant factor in explaining committee change in lower houses, the years out of power proved to be the most significant factor in explaining committee change in upper houses using the proportional change model also. Using a directional change variable in the analysis, the longer a party has been out of power the greater the increase in the number of committees (see Table 9). The years out of power also proved significant for the 1991 session and resulted in the same findings (see Table 13). These results support hypothesis number three that the longer a party is out of power the greater the change in the number of committees. Hypothesis number three was also supported under the actual committee change model, but the hypothesis was supported only for upper houses in state legislatures.
Other factors proved to be significant for various legislative terms, and for some terms there were no significant factors in explaining committee change. This may partly be due to the lower number of cases which are used in the analysis of one term. In 1985 the directional change variable was significant in the lower chamber leading to the conclusion that there is an increase in committees when the Republicans gain control of the legislature (see Table 10). This finding is consistent with hypothesis one that when there is a change of party the number of committees will change. However, this finding is in contrast with what was predicted in hypothesis number two that a change from Democratic control to Republican control would result in a decrease in the number of committees. On the other hand, regression results for the 1993 term offer support for hypothesis number two. Using a directional change variable, it was found that when Republicans gained control of the lower house there was a decrease in the number of committees (see Table 12). The 1995 term also led to the same conclusions which were reached for 1985 (see Table 14). The finding for 1995 was opposite of what was seen at the national level for the same year. At the national level we saw a decrease of three committees when the Republicans gained control of the legislature. These results are for individual years, thereby making it extremely difficult to generalize these findings. Additional research needs to be conducted to find out what factors may be in play during these years to account for these findings. No factors proved to be significant using this model for 1989 (see Table 15). Using both models of committee change, some general conclusions can be made. First, change in the Speaker was the primary factor explaining change in the number of committees in lower chambers, while the years out of power was the primary factor in upper houses. Second, professionalism leads to more committees, but only in lower chambers. Third, neither party is more likely to decrease the number of committees. Fourth, different factors play a role in different terms, therefore it is nearly impossible to provide one set of determinants of the number of committees. The R Square values for the change in the
[Table 10 to 15 About Here]
number of committees were very low, thus more research needs to be conducted in order to fully explain change in the number of committees.
Changes In the Seniority System
For the second phase of this study seniority will be examined . For the purpose of this research, seniority will be defined as continuous service within a house of a legislative body. Prior service by a member will be used to break ties between members whose continuous service dates back to the same year. For example, if two members had continuous service since 1982, but one of the members had been in the legislature previously the member with the prior service would be the senior member. Additionally, for this study, the most senior member is selected from those that are not chairing another committee. For example, if a member of a committee has more seniority than the committee chair, but he or she is chairing another committee then the committee is considered to be chaired by the senior member assuming that there are no other members on the committee with more seniority than the chair who is not hearing a committee. For examination in this study seven states were chosen—New York, Pennsylvania Texas, North Carolina, Minnesota, Montana, and Alabama. These states were selected due to their representation of the nation as a whole. The selection process included picking states which fit into the three categories of professionalism. States were selected which were considered to be highly professional, non-professional, and those which ranked in the middle. A second criterion used in the selection process was a state which had experienced a change in party control and states which had not experienced a change in party control during the period examined in this study. Using two criteria one can establish a 3 by 2 matrix with the goal of selecting states which fit into each category. Appendix B shows the matrix which was used in the selection process.
The first category in the matrix is a highly professional state that has not experienced a change in party control or either legislative house. New York was selected to fulfill this category. New York ranks at the top of the professionalism measure established in this study as well as the study conducted by Squire (1992). Additionally, New York has not seen a change in party control during the period looked at in this study. During the 12 years examined in this study, the Republicans have controlled the Senate in New York, while the Democrats controlled the House.
The second criterion, which has to be fulfilled in the selection process, is a state that is highly professional and has experienced a change in party control. Pennsylvania was selected as a state which ranks near the top in terms of professionalism and has experienced a change of party control. Pennsylvania saw the Republicans gain control of the state house after the 1994 elections. This was consistent with what was seen at the national level with Republicans gaining control after the 1994 elections.
The third criterion is a state which ranks in the middle in terms of professionalism and has not experienced a change in party control. Texas ranked in the middle of the measure of professionalism which was established in this study, as well as the study conducted by Squire (1992). Texas has seen the Democrats control both houses of the state legislature during the period examined in this study.
The fourth criterion in the selection process is a state that ranks in the middle in terms of professionalism and has experienced a change in party control. Two states included in this study fall into this category. First, North Carolina which ranks in the middle of most professionalism measurements saw a change in party control in the state house after the 1994 elections with the Republicans gaining control. Minnesota also fits this fourth criterion with the Democrats gaining control of the state house after the 1986 elections. Minnesota was included to help determine if changes in seniority are the product of a change of control from one party to another, and are not just the product of a change from the Democratic party to the Republican party.
The fifth criterion in the selection process was a state which ranked low in terms of professionalism and had not experienced a change in party control during the period under examination. Alabama was selected as a state which is non-professional and has seen the Democrats entrenched in power for decades.
The final criterion used in the selection process was a state which was ranked low in terms of professionalism, and had experienced a change in party control during the time period which was examined. Montana has tended to be a very competitive state with control of the state legislature alternating between the two parties. The Democrats controlled the state Senate in 1985, 1991 and 1993, with the Republicans controlling the Senate in 1989 and 1995. The 1987 term saw control of the Senate split evenly between the two parties. The state house has also tended to be highly competitive in Montana with the Democrats in control in 1989 and 1991 and the Republican having a majority in 1987, 1993 and 1995. The house also saw control evenly divided between the parties in 1985.
Methods
The data for this part of the paper were obtained from the legislative libraries in Texas, Montana, and Minnesota, the Public Information Office in Alabama, the Library of the Senate in Pennsylvania, the Office of the Speaker of the New York State Assembly, and the North Carolina Manual. The selection process of the states for this study was set forth in the previous section. Each committee in the lower and upper house of the seven states selected was examined to determine if the committee was being chaired by the senior member. For each committee the members of the majority party were compared based upon their years of continuous service and it was determined if the chair was the most senior member. Members with more seniority than the chair were excluded if they were chairing another committee. The final measure of seniority is the percentage of committees chaired by the senior member for each chamber of the state legislatures beginning in 1985 and ending in 1995. This time period should be long enough to determine what factors affect seniority.
After measuring seniority a change score was computed for each state with 1985 being used as the baseline in the analysis. This measure shows the degree to which seniority increases or decreases from the previous years. This was done because the actual level of seniority may vary from state to state. The change in seniority is the dependent variable for this part of the study.
Some of the independent variables for this section will remain the same as the previous chapter. For this section of the paper, the professionalism measurement used previously will also be incorporated. Additionally, the leadership change variables will also be included in the regression analysis. The regression analysis will include the directional change variable which was used previously. A separate regression analysis will include the change of control variable that was used in the previous chapter.
For this part of the study, an additional independent variable will be included in the analysis. The change in the number of committees in the legislative body will be included to take into account the fact that legislative bodies with more committees have more chairmanships to go around. This could be a major factor in explaining the change in the percentage of committees, that are being chaired by the senior member. Regression analysis will be run for both the upper and lower houses of state legislatures in the effort to determine which factors help to explain the change in the use of seniority within that body.
Results
There are some general observations that can be made when examining the seniority system in the seven states selected for this study. First, upper houses tend to have a higher percentage of committees chaired by the senior member. Out of the forty-two cases examined in this study, only seven cases were found where the lower house had a higher percentage of committees chaired by the senior member, and out of those seven, cases four occurred in Pennsylvania.
There may be several reasons why a greater use of seniority was found in lower chambers. The answer may lie in the autonomous nature of individuals within each chamber. The rules may give the Speaker more power in the committee assignment process in lower houses. Additionally, lower houses may have shorter terms of office thereby decreasing the opportunity for individuals to build up their own power structure. Lower houses may see a greater turn over in membership, thereby decreasing the opportunities for members to build up personal power structures within the legislature. Members may see the lower house only as a stepping stone to a higher position. In addition, upper chambers tend to be smaller than lower chambers, thereby increasing the power of individuals and increasing the likelihood of a member receiving an assignment as a committee chair. If there are a large number of committees and a small number of members the percentage of senior members chairing a committee should be greater.
The case of Alabama is interesting in the fact that the percentage of committees chaired by the senior member is generally lower than in the other states examined in this study. In the lower house in Alabama, 1985 is the only year that had more than 50 percent of the committees chaired by the senior member. For the other five cases in Alabama, the range is from 28 percent to 41 percent. The upper house has numbers which are slightly higher than the lower house with four of the six cases having more than 50 percent of the committees chaired by the senior member. However, the numbers are still below what is present in upper houses in the other six states.
There may be several explanations to explain why there are low percentages of committees being chaired by the senior member in Alabama. First, Alabama has historically been dominated by the Democratic party. There are cases in the history of Alabama politics in which one-hundred percent of the legislature consisted of Democrats. The leadership may not be as responsive to the members when there are such large majorities within the legislature. The leadership is in a better position to use the committee system to advance their personal agenda and can use the committee assignment process as a means of rewarding those who have supported the leaders. Additionally, the existing system has become so entrenched that it may be difficult to implement changes.
North Carolina is another state that offers some interesting findings concerning the seniority system. In the lower house of the North Carolina legislature we see a drastic change in the numbers of committees chaired by the senior member from the 1987 term to the 1989 term. In 1987 over 85 percent of the committees were chaired by the senior member. The total dropped to less than 10 percent in 1989. The major reason for this drastic change was reorganization of the house. In 1987 the house consisted of 58 committees. In 1989 after the reorganization, the total dropped to 13. This made it more difficult to give out committee assignments. In some cases, subcommittee chairmanships were seen as being more important than full standing committees. In 1991 the North Carolina House saw an increase to 13 percent of the committees being chaired by the senior member. By 1993 the figure had increased to 48 percent . 1991 also saw an increase in the number of standing committees to 23 in the state house. The increase in the number of committees chaired by the senior member may be the product of the increase in the number of standing committees.
Regression Analysis
The regression analysis for the seniority portion of this paper reveals some interesting results. The regression analysis was successful in discovering some of the factors that explain change in the seniority system in lower houses. However, changes in upper houses were not explained through this research. The first regression analysis involved use of a variable that indicated if there was a change in control from one party to another. The change variable was found significant, leading to the conclusion that there is an increase in committees chaired by the senior member when there is a change in party control (see Table 16). This finding is consistent with what was predicted in hypothesis number six that stated, when there is a change in party control the use of seniority in the selection of committee chairmen will change. One would expect that a change in party would bring about a change in the use of seniority in the selection process. However, the finding that is probably most surprising is that a change in party control would bring about an increase in the use of seniority in the selection process. One would logically predict that a change in party would result in a decrease in the use of seniority in legislatures because members lack their own built in power structure since they have been out of power.
A change in the speaker had the opposite effect than a change in control had on the seniority system. When there is a change in the speaker the number of committees chaired by the senior member decreases. This finding is consistent with what was predicted in hypothesis number five that when there is a change in the leadership the use of seniority will decrease. These results are consistent with what was present at the national level after the 1994 elections. Many senior members were passed over for assignments in the effort to place members in those positions who were more responsive to the Republicans’ Contract with America.
The change in the number of committees was also significant for lower houses, leading to the conclusion that the greater the number of committees the greater the use of seniority. This result is consistent with what was predicted in hypothesis number seven. We see an increase in the use of seniority when there is an increase in the number of committees within the legislative body. This is a logical result which one would expect to see. As the number of committees increases the number of committee chairs increases thereby making it more likely for a member to receive an assignment as the chair of a committee. In general, most legislatures limit members to chairing one committee. With this limitation, it increases the likelihood that a chair will be the senior member when there are a large number of committees. A regression analysis was also run using a directional change variable. When Republicans gain control of the legislature the use of seniority increases. This result also provides support for hypothesis number six. When party control changes the use of seniority will also change. This result is in contrast to what was seen at the national level following the 1994 elections. A change in the speaker also proved to be significant using the directional change model. When there is a change in the speaker the use of seniority in the selection process of chairs decreases. This result is consistent with what was predicted in hypothesis number five. It is interesting to note that with a party change we are seeing an increase in the use of seniority in the committee selection process while we see a decrease in the use of seniority when there is a speaker change. This may lie in the idea of the speaker using the committee system to further his or her own personal agenda. In order for the speaker to best advance his or her agenda, one needs people which are loyal and supportive to the speaker in important positions. Therefore, the speaker probably does not want to use seniority as the sole criterion in the selection of committee chairmen. Many scholars prescribe to the personal power agenda of leaders and using the committee system to promote their own interest increases the political power of the speaker.
The regression analysis for upper houses did not reveal any significant results. The R
[Table 16 About Here]
Square value for upper houses was only .04, meaning that only 4 percent of the variation in the percent change of committees chaired by the senior member could be explained by the change in the number of committees, change in leadership, change in control, professionalism, and the years out of power. In contrast, 51% of the variation in the percent change of committees chaired by the senior member could be explained by the same independent variables in lower houses. Upper houses generally are not as large as lower houses, therefore, there are not as many people to select from for committee assignments, and in some cases, nearly every member will receive an assignment as chair. Additionally, the results are consistent with what was seen at the national level in 1994, the breakdown of seniority appeared in the house nationally and at the state level. The decrease of the use of seniority did not appear in the upper house at either level. More research, however, needs to be conducted to determine why these differences exist between lower and upper houses.
Several conclusions can be made from the results reported in this chapter. First, change in control leads to a greater use of seniority and a change in speaker results in a decrease in the use of seniority. Second, the greater the number of committees the greater the use of seniority. Finally, seniority tends to be of more importance in lower houses where Speakers generally control the committee assignment process.
Conclusions and Implications
This paper has attempted to offer some insight into the committee systems at the state
level. I hope that this work has provided some answers to why we see changes in the number of committees in state legislatures, and why we see changes in the use of seniority in state legislatures. Additionally, I hope this paper has raised some questions which will be explored in future studies.
The following conclusions can be made about the hypotheses tested in this study: 1. Hypothesis # 1 is supported through this research, but only for lower houses. When a
legislative body changes control from one party to another the number of committees will change. This result was also consistent with what was seen at the national level following the 1994 elections, and it was also consistent with the belief that a political party will shape the committee system to reflect its agenda.
2. Hypothesis # 2 is not upheld in this study. There is no indication that Republicans
are more likely to decrease the number of committees than Democrats. There were cases where there was a decrease in the number of committees when Republicans gained control of the state legislature and cases where there was a decrease in the number of committees when the Democrats gained control, therefore the second hypothesis can not be supported in this study. This finding is in contrast to what was seen at the national level following the 1994 elections.
3. Hypothesis # 3 is sustained through the results, but only for upper houses. The
greater the number of years that a party had been out of power the greater the change in the number of standing committees. There is no indication in this study that the years a party has been out of power plays a role in determining the number of committees in lower houses.
4. Hypothesis # 4 is supported by the findings, but only for lower houses. Changes in
leadership did not affect the number of committees in upper houses. Change in leadership may be the primary factor in explaining changes in the number of committees in lower houses. In many legislatures the speaker has control of the
committee assignment process, thereby making it logical that a speaker change would lead to changes in the number of committees.
5. Hypothesis # 5 is supported through this research, but only for lower houses. Changes in the speaker is shown to lead to a decreased use of the seniority system in state legislatures. This result is consistent with what was seen at the national level following the 1994 elections. It also provides some evidence that speakers use the committee system to advance there own political goals.
6. Hypothesis # 6 is also upheld, but only for lower houses. This study offers evidence
that when there is a change in party control there is a change in the use of seniority in the selection of committee chairmen. The testing of this hypothesis also led to another finding that when Republicans gain control of a legislature the use of seniority will increase. This result is in contrast with what was seen at the national level.
7. Hypothesis # 7 is supported in the results, but only for lower houses. An increase in
the number of committees was shown to lead to an increase in the use of seniority. This was what one would expect to find since the number of chairmanships would increase as the number of committees increases.
In this study much was learned about the committee system in lower houses of state legislatures. However, little advance was made in upper houses. Additional research needs to be undertaken which considers other factors that may help to explain committee structure in upper houses. The answer may lie in the fact that there is no way to predict changes in upper houses and that any attempt is just a fruitless exercise. One can conclude that a change in leadership may be the most important factor in determining the number of committees in a state legislatures, and in turn changes in the number of committees lead to changes in the use of seniority. Additionally, one can probably infer from this study that individual members probably possess more power in upper houses than in lower houses. It appears that the speaker is in the position to shape the structure of the committee system in accordance with his or her own desires. On the other hand, Senate leaders do not appear to have the same prerogatives. Many of the state legislatures were modeled after the national system and what is seen at the national level may help to explain what is seen at the state level. In the United States Senate individual members have a great deal of power. The desires of the leadership can be defeated by individual members. On the other hand, the Speaker of the United States House of Representatives has tools at his disposal that allow him to exercise tighter control over the operation of the House. Future research needs to investigate the rules under which state legislatures operate. In this investigation one may find the answer to why changes occur in committees in upper houses. Additionally, many of the years presented in this study saw little party turnover in the state legislature, therefore this may help to explain why many of the results proved to be statistically insignificant. Additional research needs to be undertaken that looks at a wider range of legislative sessions. Special attention needs to be paid to periods of American history in which there has been a large turnover in party control. An examination of the Watergate era, in which Democrats won in mass numbers, may help to more clearly determine if committee decrease is a product of a change in control of the legislature, or if it is a product of Republican control. Additionally, other factors need to be considered in future research. Only a small percentage of the change in the number of committees is explained by the independent variables in this study. Through a better understanding of changes in the committee system, we will be in a better

position to understand the legislative process and the legislation that is the product of that process.
References
Basehart, Hubert Harry. 1980. “ The Effect of Membership Stability On Continuity and Experience In U.S. State Legislative Committees.” Legislative Studies Quarterly 5: 55-68. Collie, Melissa P., and Brian E. Roberts. 1992. “ Trading Places: Choice and
Committee Chairs in the U.S. Senate, 1950-1986.” Journal of Politics 54: 231- 245.
Congressional Quarterly Almanac. 1995. Washington, D.C. : CQ Press. Davidson, Roger H. And Walter J. Oleszek, eds. 1995. The 104th Congress: A
Congressional Quarterly Reader A Supplement to Congress and Its Members. Washington: Congressional Quarterly Press.
Endersby, James W., and Karen M. McCurdy. 1996. “ Committee Assignments in
the U.S. Senate.” Legislative Studies Quarterly 21: 219-233. Fenno, Richard F., Jr. 1973. Congressmen in Committees. Boston: Little, Brown
and Company. Francis, Wayne L., and James W. Riddlesperger. 1982. “ U.S. State Legislative
Committees: Structure, Procedural Efficiency, And Party Control.” Legislative Studies Quarterly 7: 453-471.
Francis, Wayne L. 1985. “ Leadership, Party Caucuses, and Committees In U.S.
State Legislatures.” Legislative Studies Quarterly 10: 243-257. Francis, Wayne L. 1989. The Legislative Committee Game. Columbus: Ohio State University Press. Hamm, Keith E. 1980. “ U.S. State Legislative Committee Decisions: Similar
Results In Different Settings” Legislative Studies Quarterly 5:31-54. Hamm, Keith E., and Ronald D. Hedlund. 1990. “ Accounting for Change in the
Number of State Legislative Committee Positions.” Legislative Studies Quarterly 42: 597-625.
Hamm, Keith E., and Gary Moncrief. 1982. “ Effects of Structural Change In
Legislative Committee Systems On Their Performance in U.S. States.” Legislative Studies Quarterly 7:383-399.
Hamm, Keith E., and Ronald D, Hedlund. 1994. “ Committees In State
Legislatures.” In The Encyclopedia of the American Legislative System, ed. Joel H. Silbey. New York: Charles Scribner & Sons.
Hedlund, Ronald D., and Samuel C. Patterson. 1992. “ The Electoral Antecedents of State Legislative Committee Assignments.” Legislative Studies Quarterly 17:539-559.
Hedlund, Ronald D., and Keith Hamm. 1996 “ Political Parties as Vehicles for Organizing U.S. State Legislative Committees.” Legislative Studies Quarterly 23: 383-408.
Mooney, Christopher Z. 1995. “ Citizens, Structures, and Sister State: Influences
on State Legislative Professionalism.” Legislative Studies Quarterly 20: 47-67.
Munger, Michael C. 1988. “ Allocation of Desirable Committee Assignments:
Extend Queues versus Committee Expansion.” American Journal of Political Science 32: 317-344.
Ray, Bruce A., and Steven S. Smith. 1984. “ Committee Size In the U.S.
Congress.” Legislative Studies Quarterly 9: 679-695.
Reeves, Andree E. 1993. Congressional Committee Chairmen. Lexington: University of Kentucky Press. Rosenthal, Alan. 1974. Legislative Performance In The States. New York:Free
Press. Shepsle, Kenneth A. 1988. “ Representation and Governance: The Great
Legislative Trade-off.” Political Science Quarterly 103: 461-483. Smith, Steven S., and Christopher J. Deering. 1990. Committees in Congress. Washington: Congressional Quarterly Inc. Squire, Peverill 1992. “ Legislative Professionalization and Membership Diversity
in State Legislatures.” Legislative Studies Quarterly 17: 69-79. Strahan, Randall 1990. New Ways and Means. Chapel Hill: University of North Carolina Press. Wilson, Woodrow 1885. Congressional Government. Boston: Houghton-Mifflin. Winslow, C. I. 1931. State Legislative Committees: A Study in Procedure.
Baltimore: John Hopkins University Press.
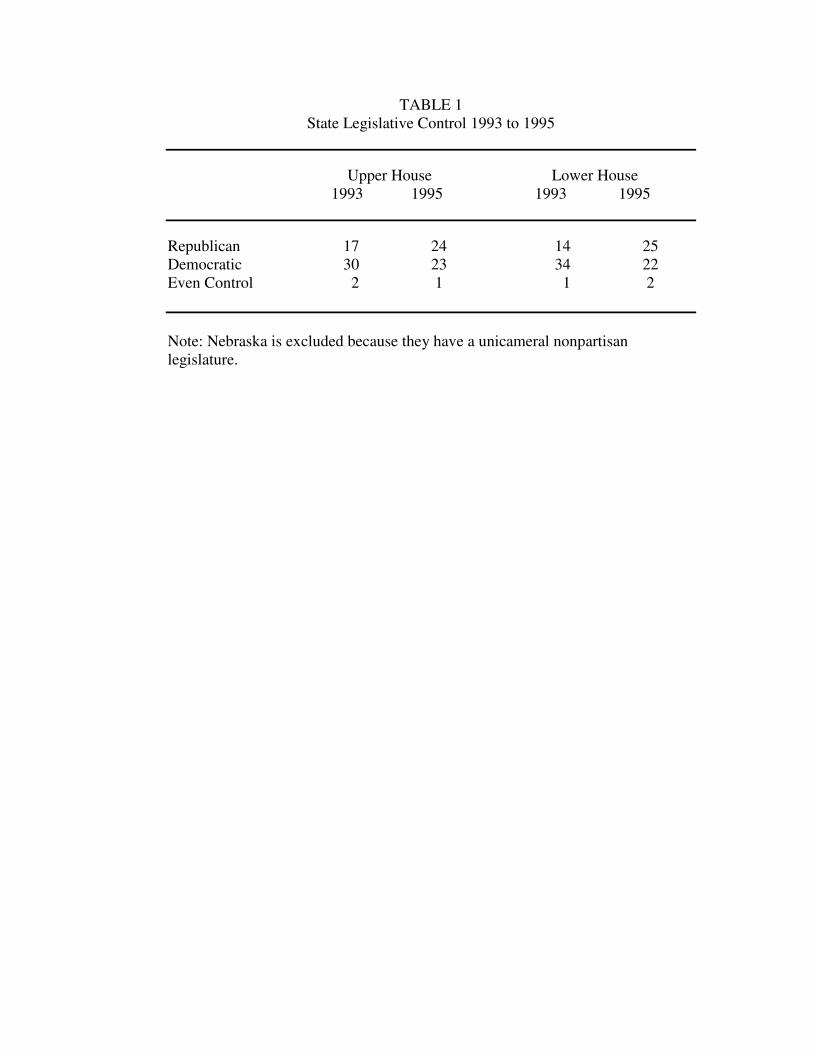
TABLE 1 State Legislative Control 1993 to 1995
Upper House Lower House
1993 1995 1993 1995 Republican 17 24 14 25 Democratic 30 23 34 22 Even Control 2 1 1 2 Note: Nebraska is excluded because they have a unicameral nonpartisan legislature.
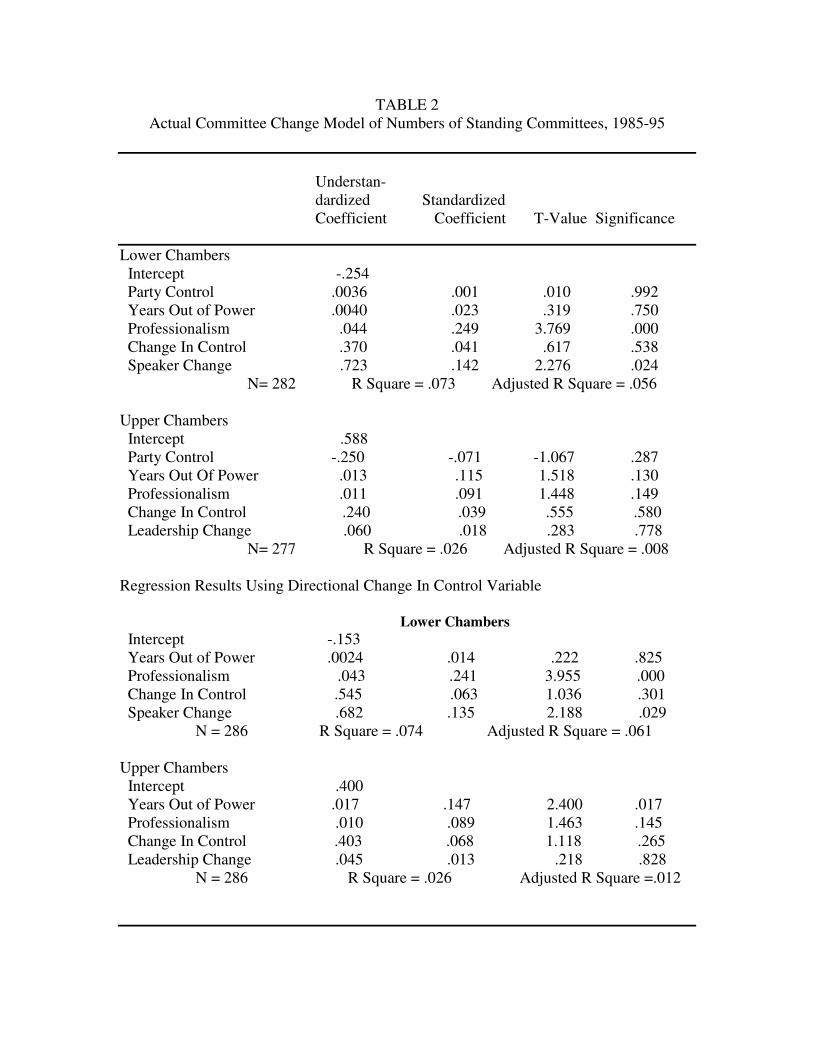
TABLE 2 Actual Committee Change Model of Numbers of Standing Committees, 1985-95
Understan- dardized Standardized Coefficient Coefficient T-Value Significance
Lower Chambers Intercept -.254 Party Control .0036 .001 .010 .992 Years Out of Power .0040 .023 .319 .750 Professionalism .044 .249 3.769 .000 Change In Control .370 .041 .617 .538 Speaker Change .723 .142 2.276 .024 N= 282 R Square = .073 Adjusted R Square = .056 Upper Chambers Intercept .588 Party Control -.250 -.071 -1.067 .287 Years Out Of Power .013 .115 1.518 .130 Professionalism .011 .091 1.448 .149 Change In Control .240 .039 .555 .580 Leadership Change .060 .018 .283 .778 N= 277 R Square = .026 Adjusted R Square = .008 Regression Results Using Directional Change In Control Variable
Lower Chambers Intercept -.153 Years Out of Power .0024 .014 .222 .825 Professionalism .043 .241 3.955 .000 Change In Control .545 .063 1.036 .301 Speaker Change .682 .135 2.188 .029 N = 286 R Square = .074 Adjusted R Square = .061 Upper Chambers Intercept .400 Years Out of Power .017 .147 2.400 .017 Professionalism .010 .089 1.463 .145 Change In Control .403 .068 1.118 .265 Leadership Change .045 .013 .218 .828 N = 286 R Square = .026 Adjusted R Square =.012
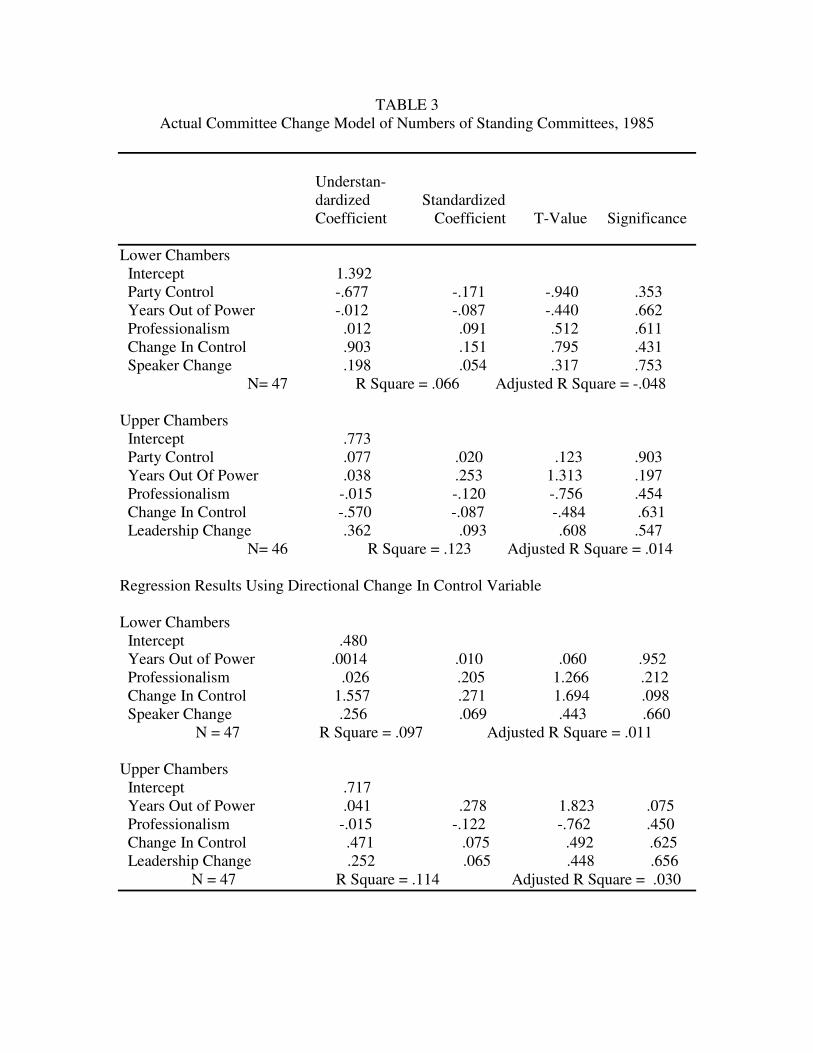
TABLE 3 Actual Committee Change Model of Numbers of Standing Committees, 1985
Understan- dardized Standardized Coefficient Coefficient T-Value Significance
Lower Chambers Intercept 1.392 Party Control -.677 -.171 -.940 .353 Years Out of Power -.012 -.087 -.440 .662 Professionalism .012 .091 .512 .611 Change In Control .903 .151 .795 .431 Speaker Change .198 .054 .317 .753 N= 47 R Square = .066 Adjusted R Square = -.048 Upper Chambers Intercept .773 Party Control .077 .020 .123 .903 Years Out Of Power .038 .253 1.313 .197 Professionalism -.015 -.120 -.756 .454 Change In Control -.570 -.087 -.484 .631 Leadership Change .362 .093 .608 .547 N= 46 R Square = .123 Adjusted R Square = .014 Regression Results Using Directional Change In Control Variable Lower Chambers Intercept .480 Years Out of Power .0014 .010 .060 .952 Professionalism .026 .205 1.266 .212 Change In Control 1.557 .271 1.694 .098 Speaker Change .256 .069 .443 .660 N = 47 R Square = .097 Adjusted R Square = .011 Upper Chambers Intercept .717 Years Out of Power .041 .278 1.823 .075 Professionalism -.015 -.122 -.762 .450 Change In Control .471 .075 .492 .625 Leadership Change .252 .065 .448 .656 N = 47 R Square = .114 Adjusted R Square = .030
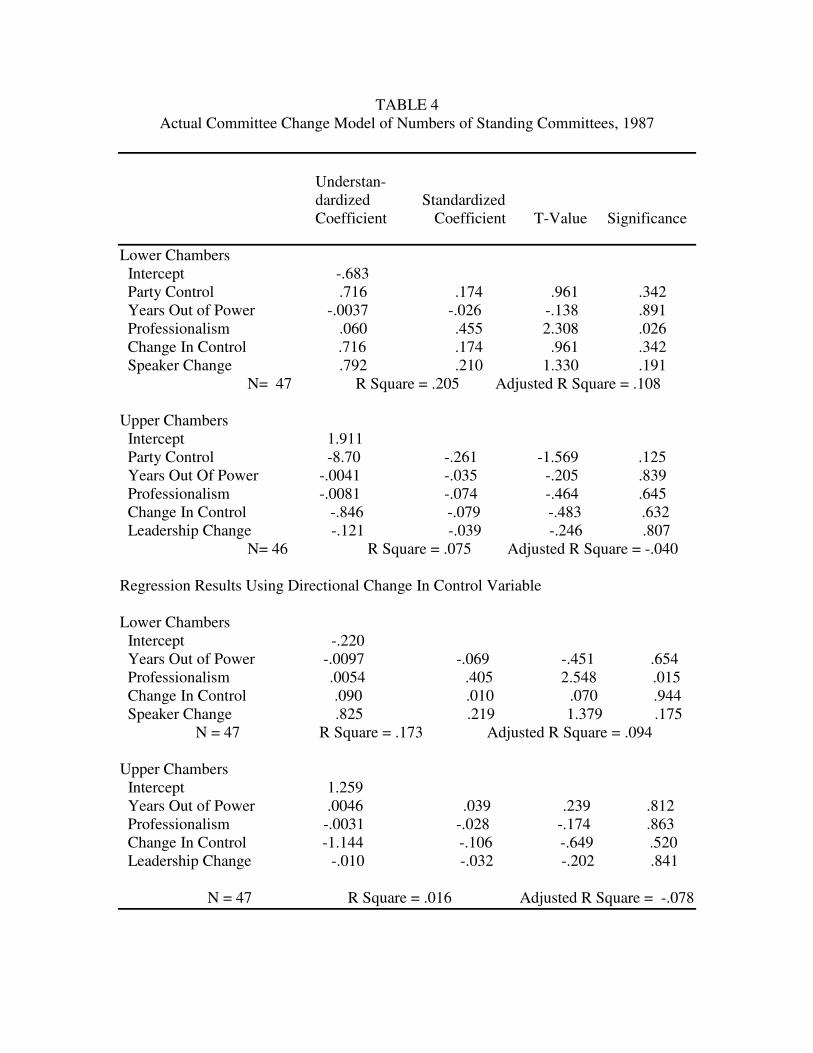
TABLE 4 Actual Committee Change Model of Numbers of Standing Committees, 1987
Understan- dardized Standardized Coefficient Coefficient T-Value Significance
Lower Chambers Intercept -.683 Party Control .716 .174 .961 .342 Years Out of Power -.0037 -.026 -.138 .891 Professionalism .060 .455 2.308 .026 Change In Control .716 .174 .961 .342 Speaker Change .792 .210 1.330 .191 N= 47 R Square = .205 Adjusted R Square = .108 Upper Chambers Intercept 1.911 Party Control -8.70 -.261 -1.569 .125 Years Out Of Power -.0041 -.035 -.205 .839 Professionalism -.0081 -.074 -.464 .645 Change In Control -.846 -.079 -.483 .632 Leadership Change -.121 -.039 -.246 .807 N= 46 R Square = .075 Adjusted R Square = -.040 Regression Results Using Directional Change In Control Variable Lower Chambers Intercept -.220 Years Out of Power -.0097 -.069 -.451 .654 Professionalism .0054 .405 2.548 .015 Change In Control .090 .010 .070 .944 Speaker Change .825 .219 1.379 .175 N = 47 R Square = .173 Adjusted R Square = .094 Upper Chambers Intercept 1.259 Years Out of Power .0046 .039 .239 .812 Professionalism -.0031 -.028 -.174 .863 Change In Control -1.144 -.106 -.649 .520 Leadership Change -.010 -.032 -.202 .841 N = 47 R Square = .016 Adjusted R Square = -.078
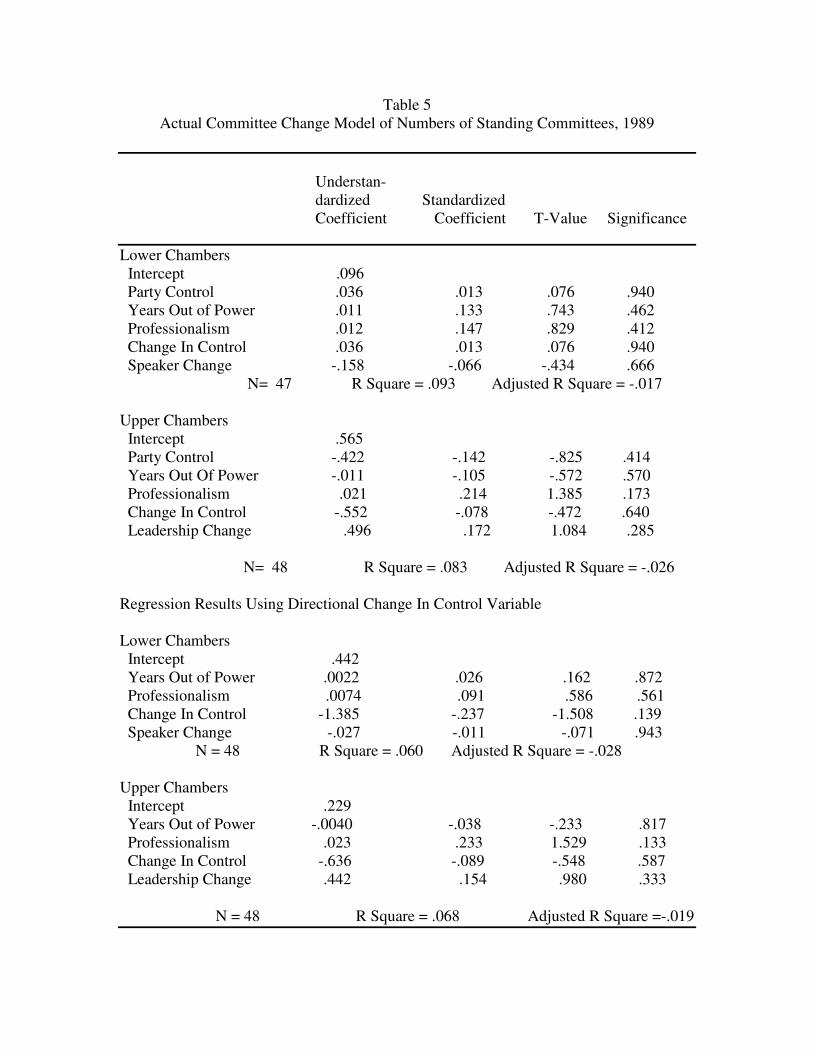
Table 5 Actual Committee Change Model of Numbers of Standing Committees, 1989
Understan- dardized Standardized Coefficient Coefficient T-Value Significance
Lower Chambers Intercept .096 Party Control .036 .013 .076 .940 Years Out of Power .011 .133 .743 .462 Professionalism .012 .147 .829 .412 Change In Control .036 .013 .076 .940 Speaker Change -.158 -.066 -.434 .666 N= 47 R Square = .093 Adjusted R Square = -.017 Upper Chambers Intercept .565 Party Control -.422 -.142 -.825 .414 Years Out Of Power -.011 -.105 -.572 .570 Professionalism .021 .214 1.385 .173 Change In Control -.552 -.078 -.472 .640 Leadership Change .496 .172 1.084 .285 N= 48 R Square = .083 Adjusted R Square = -.026 Regression Results Using Directional Change In Control Variable Lower Chambers Intercept .442 Years Out of Power .0022 .026 .162 .872 Professionalism .0074 .091 .586 .561 Change In Control -1.385 -.237 -1.508 .139 Speaker Change -.027 -.011 -.071 .943 N = 48 R Square = .060 Adjusted R Square = -.028 Upper Chambers Intercept .229 Years Out of Power -.0040 -.038 -.233 .817 Professionalism .023 .233 1.529 .133 Change In Control -.636 -.089 -.548 .587 Leadership Change .442 .154 .980 .333 N = 48 R Square = .068 Adjusted R Square =-.019
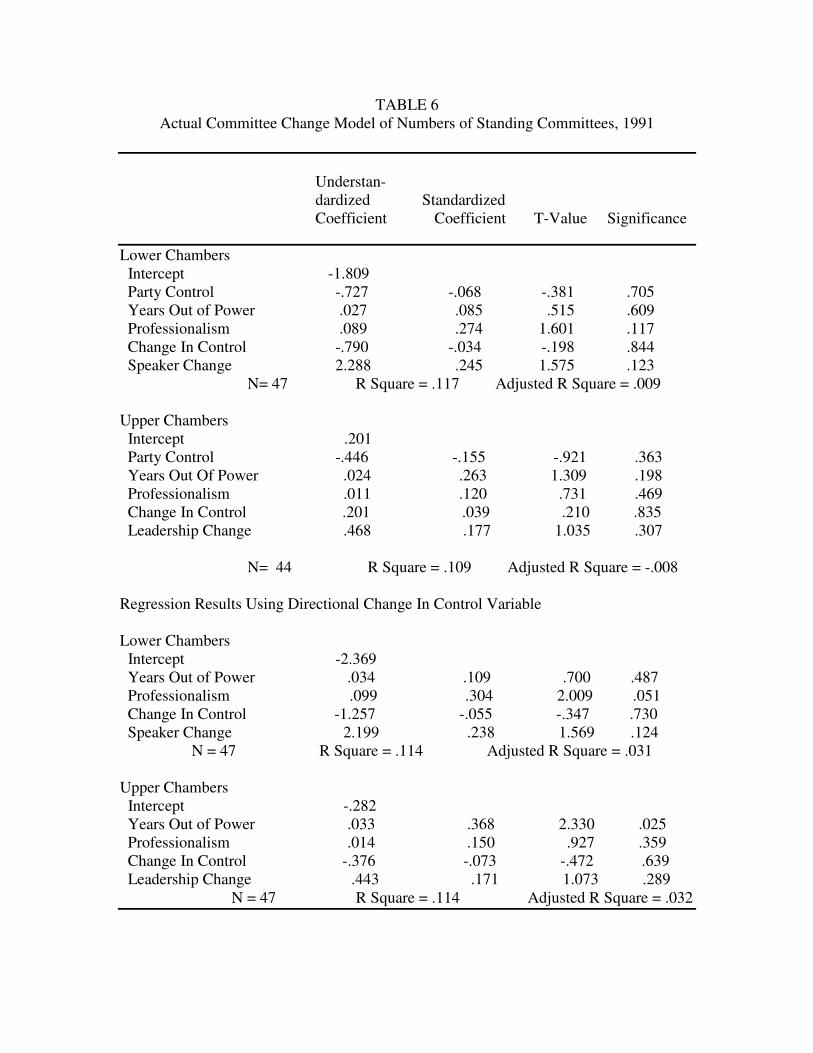
TABLE 6 Actual Committee Change Model of Numbers of Standing Committees, 1991
Understan- dardized Standardized Coefficient Coefficient T-Value Significance
Lower Chambers Intercept -1.809 Party Control -.727 -.068 -.381 .705 Years Out of Power .027 .085 .515 .609 Professionalism .089 .274 1.601 .117 Change In Control -.790 -.034 -.198 .844 Speaker Change 2.288 .245 1.575 .123 N= 47 R Square = .117 Adjusted R Square = .009 Upper Chambers Intercept .201 Party Control -.446 -.155 -.921 .363 Years Out Of Power .024 .263 1.309 .198 Professionalism .011 .120 .731 .469 Change In Control .201 .039 .210 .835 Leadership Change .468 .177 1.035 .307 N= 44 R Square = .109 Adjusted R Square = -.008 Regression Results Using Directional Change In Control Variable Lower Chambers Intercept -2.369 Years Out of Power .034 .109 .700 .487 Professionalism .099 .304 2.009 .051 Change In Control -1.257 -.055 -.347 .730 Speaker Change 2.199 .238 1.569 .124 N = 47 R Square = .114 Adjusted R Square = .031 Upper Chambers Intercept -.282 Years Out of Power .033 .368 2.330 .025 Professionalism .014 .150 .927 .359 Change In Control -.376 -.073 -.472 .639 Leadership Change .443 .171 1.073 .289 N = 47 R Square = .114 Adjusted R Square = .032
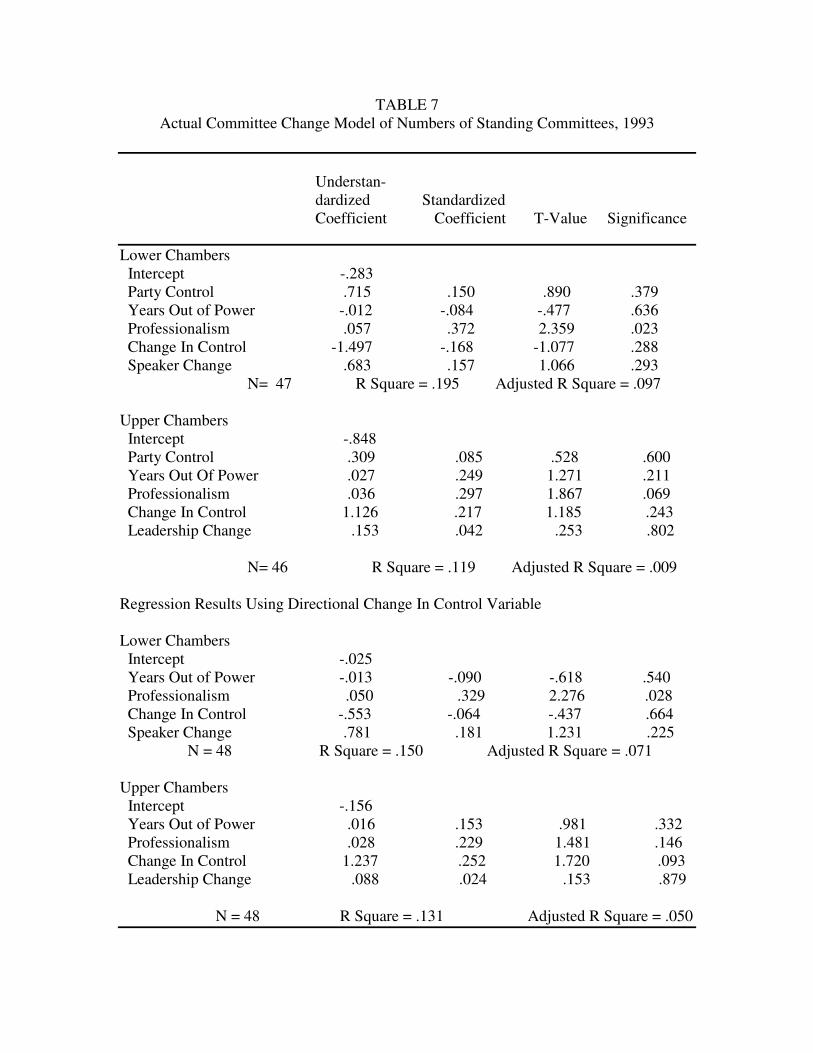
TABLE 7 Actual Committee Change Model of Numbers of Standing Committees, 1993
Understan- dardized Standardized Coefficient Coefficient T-Value Significance
Lower Chambers Intercept -.283 Party Control .715 .150 .890 .379 Years Out of Power -.012 -.084 -.477 .636 Professionalism .057 .372 2.359 .023 Change In Control -1.497 -.168 -1.077 .288 Speaker Change .683 .157 1.066 .293 N= 47 R Square = .195 Adjusted R Square = .097 Upper Chambers Intercept -.848 Party Control .309 .085 .528 .600 Years Out Of Power .027 .249 1.271 .211 Professionalism .036 .297 1.867 .069 Change In Control 1.126 .217 1.185 .243 Leadership Change .153 .042 .253 .802 N= 46 R Square = .119 Adjusted R Square = .009 Regression Results Using Directional Change In Control Variable Lower Chambers Intercept -.025 Years Out of Power -.013 -.090 -.618 .540 Professionalism .050 .329 2.276 .028 Change In Control -.553 -.064 -.437 .664 Speaker Change .781 .181 1.231 .225 N = 48 R Square = .150 Adjusted R Square = .071 Upper Chambers Intercept -.156 Years Out of Power .016 .153 .981 .332 Professionalism .028 .229 1.481 .146 Change In Control 1.237 .252 1.720 .093 Leadership Change .088 .024 .153 .879 N = 48 R Square = .131 Adjusted R Square = .050
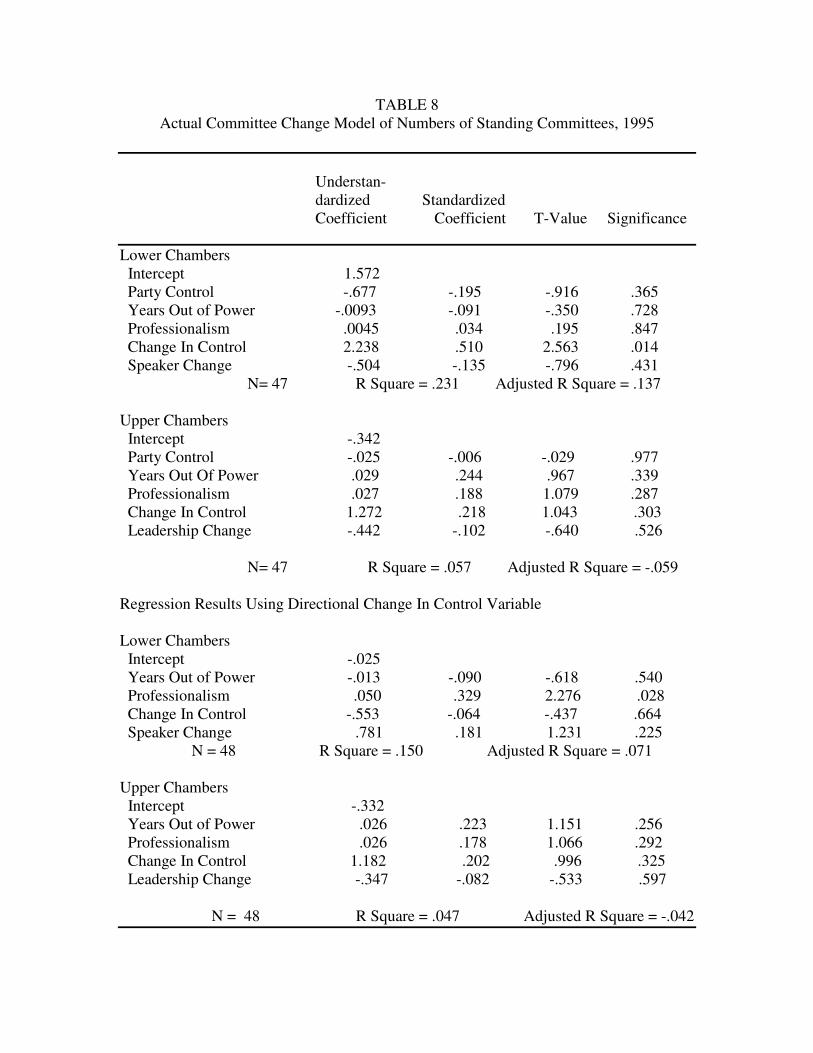
TABLE 8 Actual Committee Change Model of Numbers of Standing Committees, 1995
Understan- dardized Standardized Coefficient Coefficient T-Value Significance
Lower Chambers Intercept 1.572 Party Control -.677 -.195 -.916 .365 Years Out of Power -.0093 -.091 -.350 .728 Professionalism .0045 .034 .195 .847 Change In Control 2.238 .510 2.563 .014 Speaker Change -.504 -.135 -.796 .431 N= 47 R Square = .231 Adjusted R Square = .137 Upper Chambers Intercept -.342 Party Control -.025 -.006 -.029 .977 Years Out Of Power .029 .244 .967 .339 Professionalism .027 .188 1.079 .287 Change In Control 1.272 .218 1.043 .303 Leadership Change -.442 -.102 -.640 .526 N= 47 R Square = .057 Adjusted R Square = -.059 Regression Results Using Directional Change In Control Variable Lower Chambers Intercept -.025 Years Out of Power -.013 -.090 -.618 .540 Professionalism .050 .329 2.276 .028 Change In Control -.553 -.064 -.437 .664 Speaker Change .781 .181 1.231 .225 N = 48 R Square = .150 Adjusted R Square = .071 Upper Chambers Intercept -.332 Years Out of Power .026 .223 1.151 .256 Professionalism .026 .178 1.066 .292 Change In Control 1.182 .202 .996 .325 Leadership Change -.347 -.082 -.533 .597 N = 48 R Square = .047 Adjusted R Square = -.042
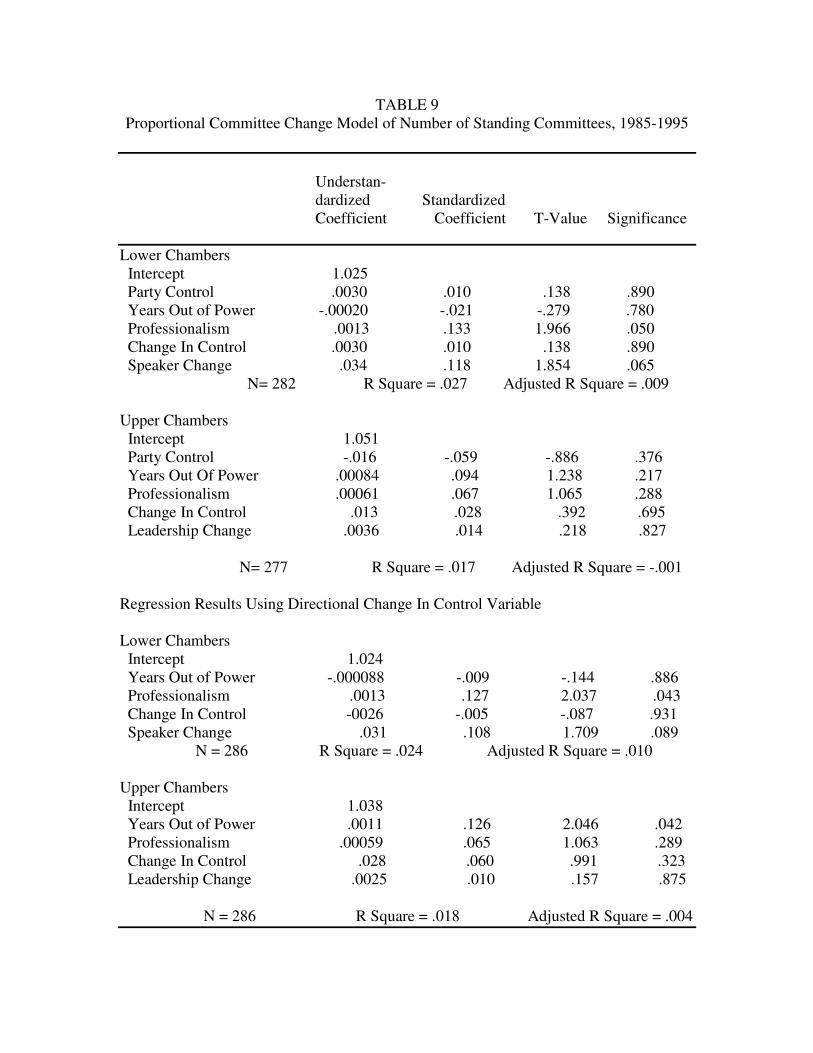
TABLE 9 Proportional Committee Change Model of Number of Standing Committees, 1985-1995
Understan- dardized Standardized Coefficient Coefficient T-Value Significance
Lower Chambers Intercept 1.025 Party Control .0030 .010 .138 .890 Years Out of Power -.00020 -.021 -.279 .780 Professionalism .0013 .133 1.966 .050 Change In Control .0030 .010 .138 .890 Speaker Change .034 .118 1.854 .065 N= 282 R Square = .027 Adjusted R Square = .009 Upper Chambers Intercept 1.051 Party Control -.016 -.059 -.886 .376 Years Out Of Power .00084 .094 1.238 .217 Professionalism .00061 .067 1.065 .288 Change In Control .013 .028 .392 .695 Leadership Change .0036 .014 .218 .827 N= 277 R Square = .017 Adjusted R Square = -.001 Regression Results Using Directional Change In Control Variable Lower Chambers Intercept 1.024 Years Out of Power -.000088 -.009 -.144 .886 Professionalism .0013 .127 2.037 .043 Change In Control -0026 -.005 -.087 .931 Speaker Change .031 .108 1.709 .089 N = 286 R Square = .024 Adjusted R Square = .010 Upper Chambers Intercept 1.038 Years Out of Power .0011 .126 2.046 .042 Professionalism .00059 .065 1.063 .289 Change In Control .028 .060 .991 .323 Leadership Change .0025 .010 .157 .875 N = 286 R Square = .018 Adjusted R Square = .004
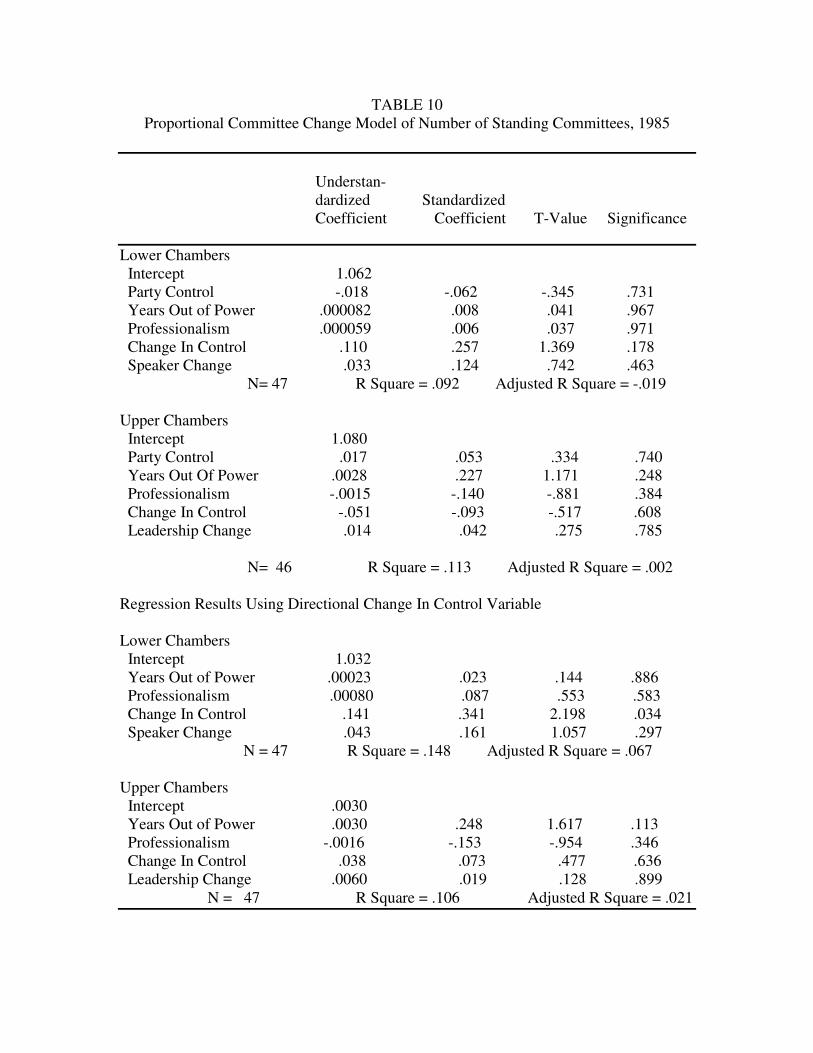
TABLE 10 Proportional Committee Change Model of Number of Standing Committees, 1985
Understan- dardized Standardized Coefficient Coefficient T-Value Significance
Lower Chambers Intercept 1.062 Party Control -.018 -.062 -.345 .731 Years Out of Power .000082 .008 .041 .967 Professionalism .000059 .006 .037 .971 Change In Control .110 .257 1.369 .178 Speaker Change .033 .124 .742 .463 N= 47 R Square = .092 Adjusted R Square = -.019 Upper Chambers Intercept 1.080 Party Control .017 .053 .334 .740 Years Out Of Power .0028 .227 1.171 .248 Professionalism -.0015 -.140 -.881 .384 Change In Control -.051 -.093 -.517 .608 Leadership Change .014 .042 .275 .785 N= 46 R Square = .113 Adjusted R Square = .002 Regression Results Using Directional Change In Control Variable Lower Chambers Intercept 1.032 Years Out of Power .00023 .023 .144 .886 Professionalism .00080 .087 .553 .583 Change In Control .141 .341 2.198 .034 Speaker Change .043 .161 1.057 .297 N = 47 R Square = .148 Adjusted R Square = .067 Upper Chambers Intercept .0030 Years Out of Power .0030 .248 1.617 .113 Professionalism -.0016 -.153 -.954 .346 Change In Control .038 .073 .477 .636 Leadership Change .0060 .019 .128 .899 N = 47 R Square = .106 Adjusted R Square = .021
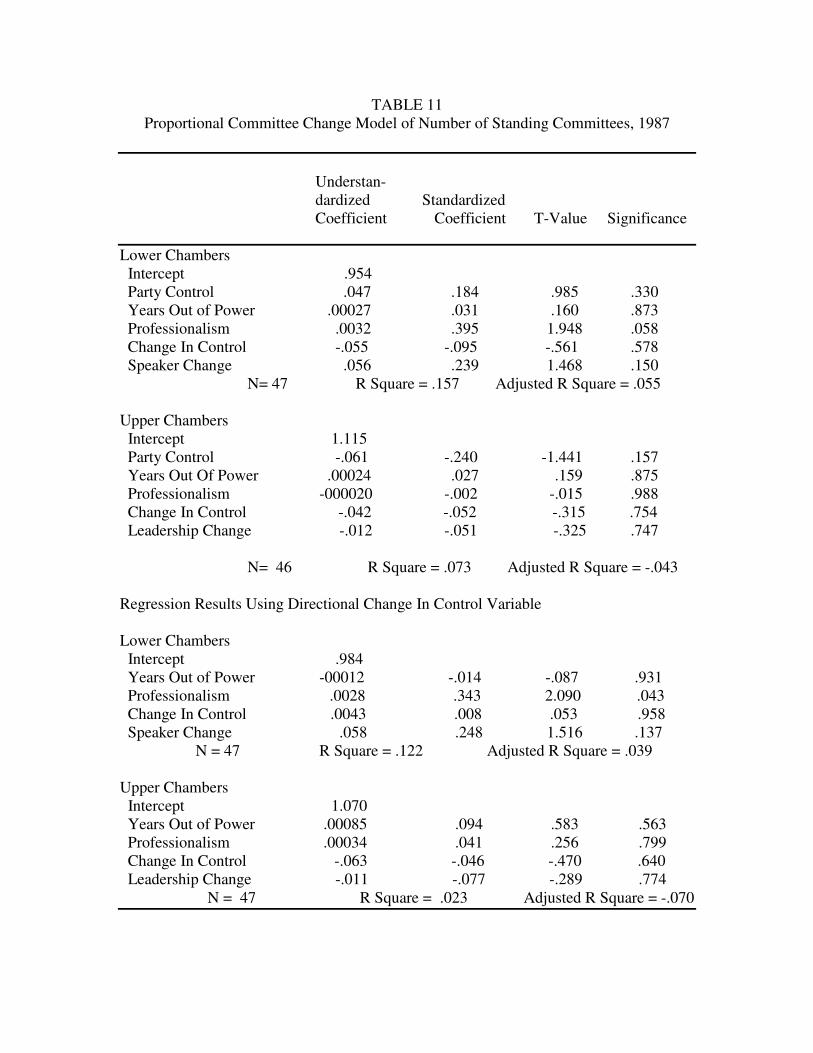
TABLE 11 Proportional Committee Change Model of Number of Standing Committees, 1987
Understan- dardized Standardized Coefficient Coefficient T-Value Significance
Lower Chambers Intercept .954 Party Control .047 .184 .985 .330 Years Out of Power .00027 .031 .160 .873 Professionalism .0032 .395 1.948 .058 Change In Control -.055 -.095 -.561 .578 Speaker Change .056 .239 1.468 .150 N= 47 R Square = .157 Adjusted R Square = .055 Upper Chambers Intercept 1.115 Party Control -.061 -.240 -1.441 .157 Years Out Of Power .00024 .027 .159 .875 Professionalism -000020 -.002 -.015 .988 Change In Control -.042 -.052 -.315 .754 Leadership Change -.012 -.051 -.325 .747 N= 46 R Square = .073 Adjusted R Square = -.043 Regression Results Using Directional Change In Control Variable Lower Chambers Intercept .984 Years Out of Power -00012 -.014 -.087 .931 Professionalism .0028 .343 2.090 .043 Change In Control .0043 .008 .053 .958 Speaker Change .058 .248 1.516 .137 N = 47 R Square = .122 Adjusted R Square = .039 Upper Chambers Intercept 1.070 Years Out of Power .00085 .094 .583 .563 Professionalism .00034 .041 .256 .799 Change In Control -.063 -.046 -.470 .640 Leadership Change -.011 -.077 -.289 .774 N = 47 R Square = .023 Adjusted R Square = -.070
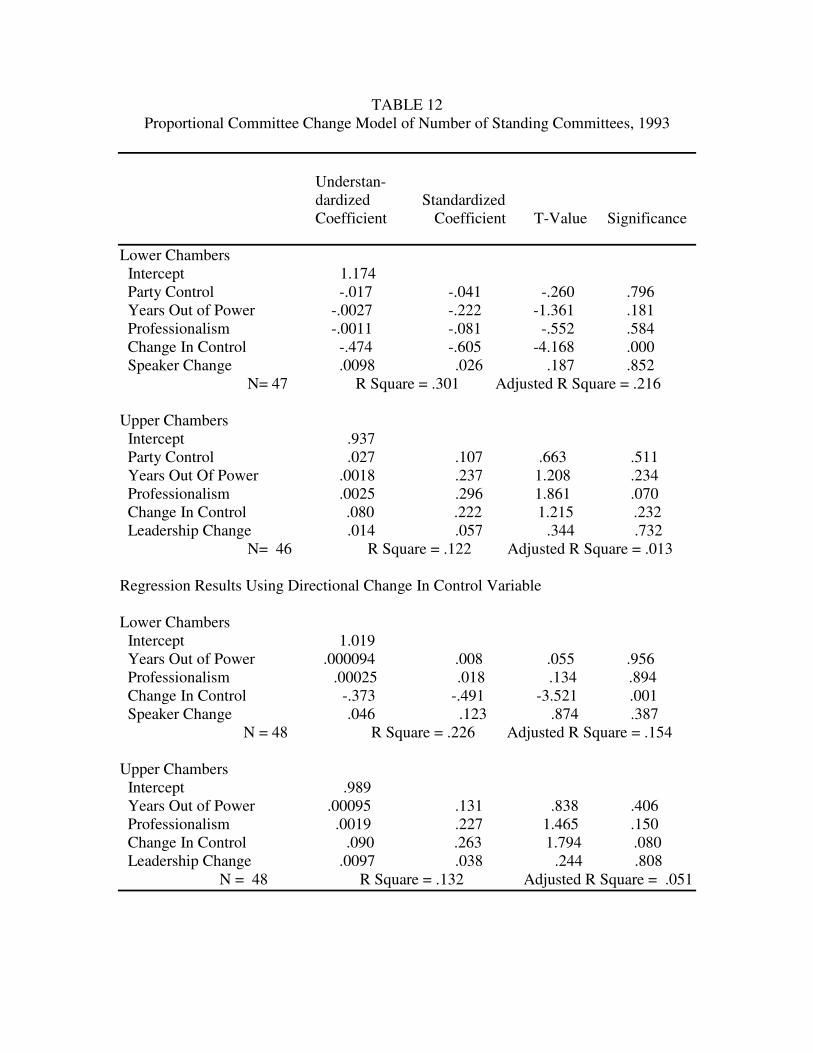
TABLE 12 Proportional Committee Change Model of Number of Standing Committees, 1993
Understan- dardized Standardized Coefficient Coefficient T-Value Significance
Lower Chambers Intercept 1.174 Party Control -.017 -.041 -.260 .796 Years Out of Power -.0027 -.222 -1.361 .181 Professionalism -.0011 -.081 -.552 .584 Change In Control -.474 -.605 -4.168 .000 Speaker Change .0098 .026 .187 .852 N= 47 R Square = .301 Adjusted R Square = .216 Upper Chambers Intercept .937 Party Control .027 .107 .663 .511 Years Out Of Power .0018 .237 1.208 .234 Professionalism .0025 .296 1.861 .070 Change In Control .080 .222 1.215 .232 Leadership Change .014 .057 .344 .732 N= 46 R Square = .122 Adjusted R Square = .013 Regression Results Using Directional Change In Control Variable Lower Chambers Intercept 1.019 Years Out of Power .000094 .008 .055 .956 Professionalism .00025 .018 .134 .894 Change In Control -.373 -.491 -3.521 .001 Speaker Change .046 .123 .874 .387 N = 48 R Square = .226 Adjusted R Square = .154 Upper Chambers Intercept .989 Years Out of Power .00095 .131 .838 .406 Professionalism .0019 .227 1.465 .150 Change In Control .090 .263 1.794 .080 Leadership Change .0097 .038 .244 .808 N = 48 R Square = .132 Adjusted R Square = .051
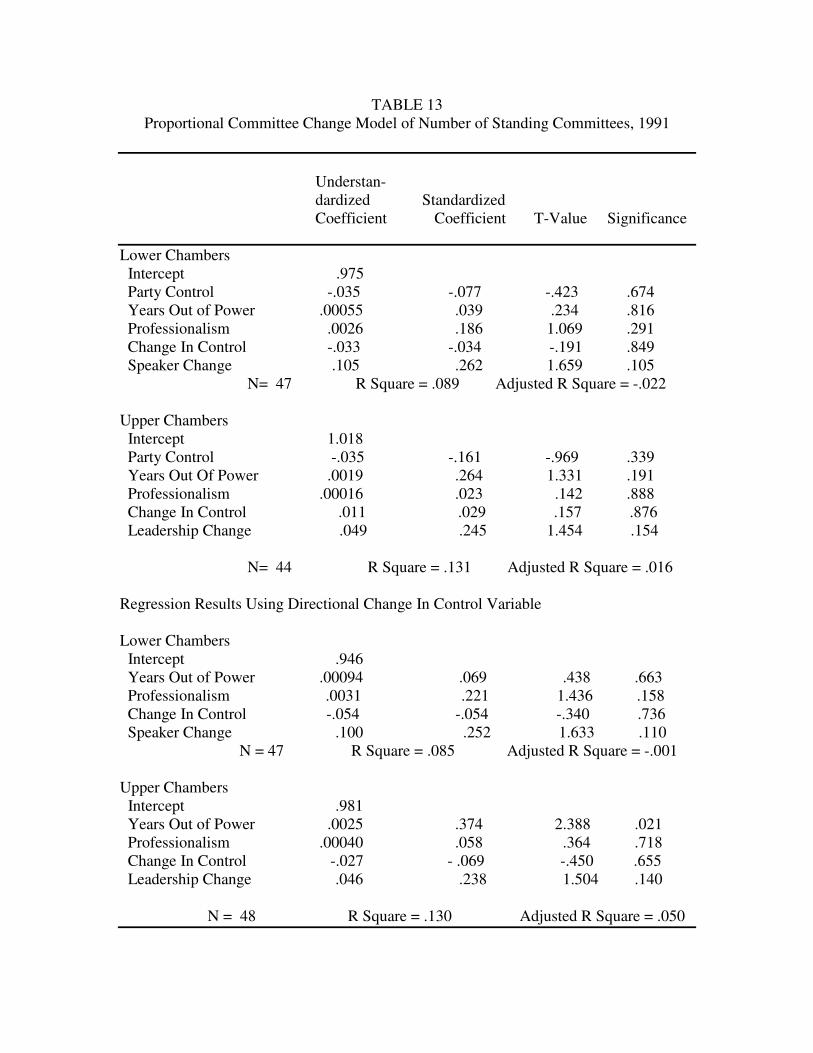
TABLE 13 Proportional Committee Change Model of Number of Standing Committees, 1991
Understan- dardized Standardized Coefficient Coefficient T-Value Significance
Lower Chambers Intercept .975 Party Control -.035 -.077 -.423 .674 Years Out of Power .00055 .039 .234 .816 Professionalism .0026 .186 1.069 .291 Change In Control -.033 -.034 -.191 .849 Speaker Change .105 .262 1.659 .105 N= 47 R Square = .089 Adjusted R Square = -.022 Upper Chambers Intercept 1.018 Party Control -.035 -.161 -.969 .339 Years Out Of Power .0019 .264 1.331 .191 Professionalism .00016 .023 .142 .888 Change In Control .011 .029 .157 .876 Leadership Change .049 .245 1.454 .154 N= 44 R Square = .131 Adjusted R Square = .016 Regression Results Using Directional Change In Control Variable Lower Chambers Intercept .946 Years Out of Power .00094 .069 .438 .663 Professionalism .0031 .221 1.436 .158 Change In Control -.054 -.054 -.340 .736 Speaker Change .100 .252 1.633 .110 N = 47 R Square = .085 Adjusted R Square = -.001 Upper Chambers Intercept .981 Years Out of Power .0025 .374 2.388 .021 Professionalism .00040 .058 .364 .718 Change In Control -.027 - .069 -.450 .655 Leadership Change .046 .238 1.504 .140 N = 48 R Square = .130 Adjusted R Square = .050
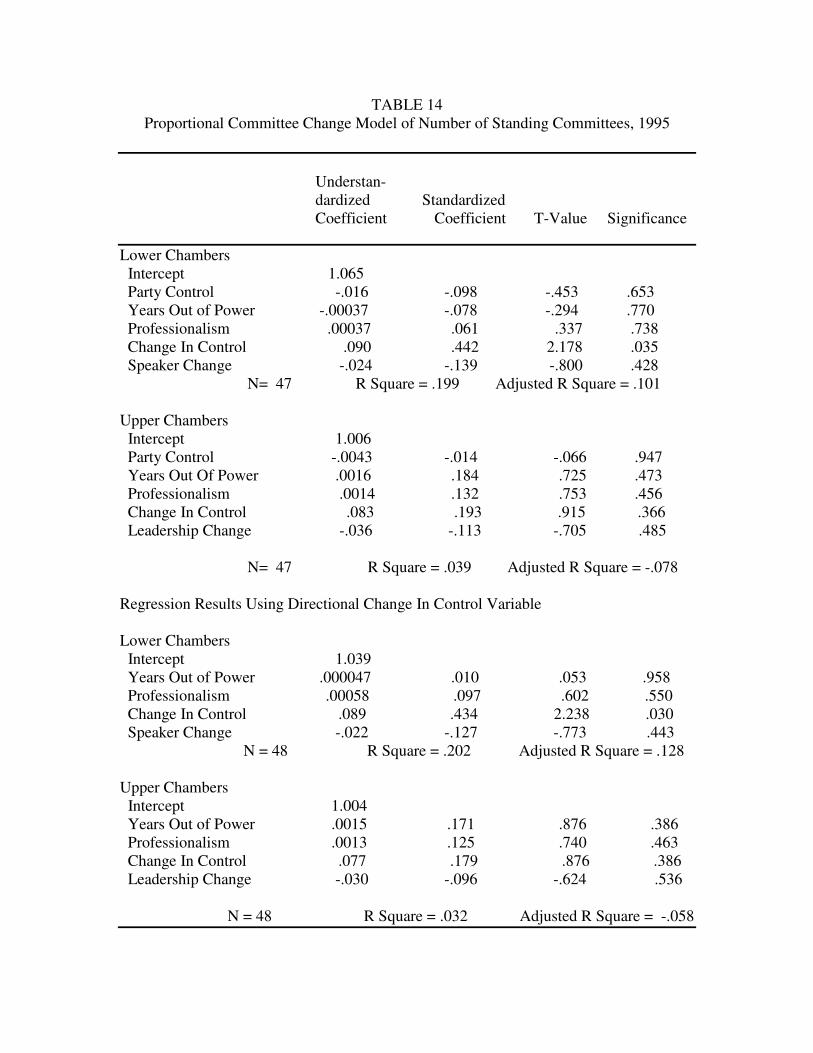
TABLE 14 Proportional Committee Change Model of Number of Standing Committees, 1995
Understan- dardized Standardized Coefficient Coefficient T-Value Significance
Lower Chambers Intercept 1.065 Party Control -.016 -.098 -.453 .653 Years Out of Power -.00037 -.078 -.294 .770 Professionalism .00037 .061 .337 .738 Change In Control .090 .442 2.178 .035 Speaker Change -.024 -.139 -.800 .428 N= 47 R Square = .199 Adjusted R Square = .101 Upper Chambers Intercept 1.006 Party Control -.0043 -.014 -.066 .947 Years Out Of Power .0016 .184 .725 .473 Professionalism .0014 .132 .753 .456 Change In Control .083 .193 .915 .366 Leadership Change -.036 -.113 -.705 .485 N= 47 R Square = .039 Adjusted R Square = -.078 Regression Results Using Directional Change In Control Variable Lower Chambers Intercept 1.039 Years Out of Power .000047 .010 .053 .958 Professionalism .00058 .097 .602 .550 Change In Control .089 .434 2.238 .030 Speaker Change -.022 -.127 -.773 .443 N = 48 R Square = .202 Adjusted R Square = .128 Upper Chambers Intercept 1.004 Years Out of Power .0015 .171 .876 .386 Professionalism .0013 .125 .740 .463 Change In Control .077 .179 .876 .386 Leadership Change -.030 -.096 -.624 .536 N = 48 R Square = .032 Adjusted R Square = -.058
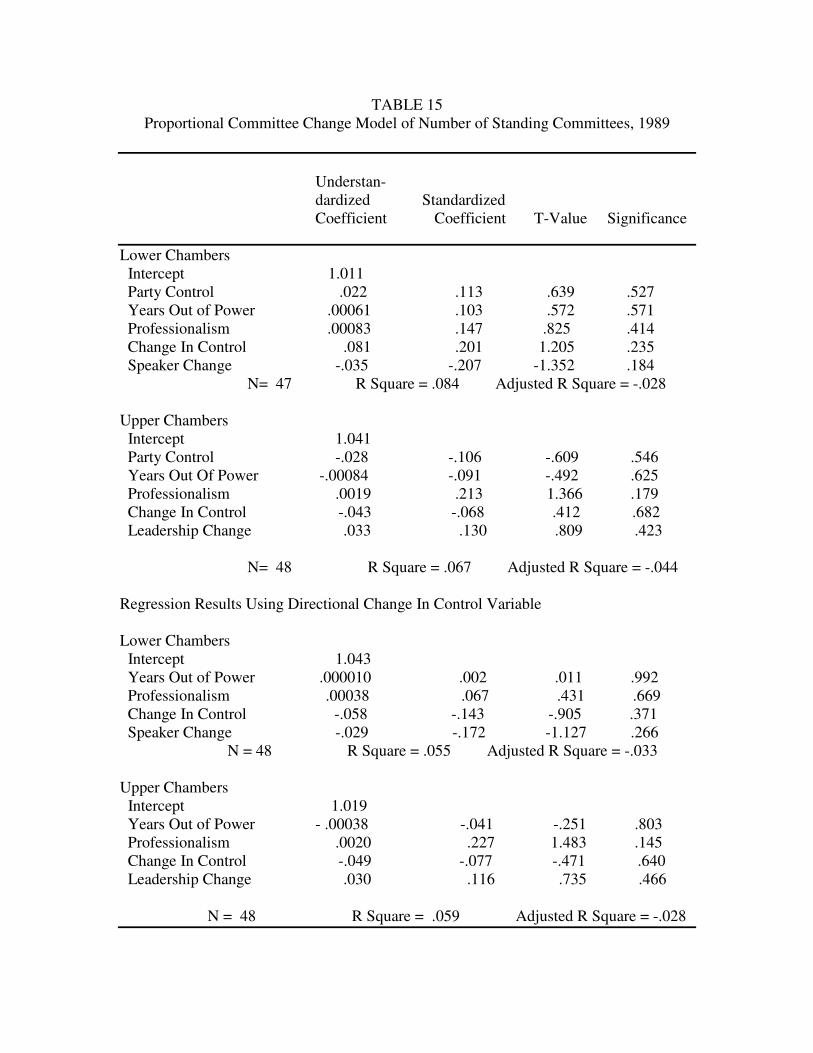
TABLE 15 Proportional Committee Change Model of Number of Standing Committees, 1989
Understan- dardized Standardized Coefficient Coefficient T-Value Significance
Lower Chambers Intercept 1.011 Party Control .022 .113 .639 .527 Years Out of Power .00061 .103 .572 .571 Professionalism .00083 .147 .825 .414 Change In Control .081 .201 1.205 .235 Speaker Change -.035 -.207 -1.352 .184 N= 47 R Square = .084 Adjusted R Square = -.028 Upper Chambers Intercept 1.041 Party Control -.028 -.106 -.609 .546 Years Out Of Power -.00084 -.091 -.492 .625 Professionalism .0019 .213 1.366 .179 Change In Control -.043 -.068 .412 .682 Leadership Change .033 .130 .809 .423 N= 48 R Square = .067 Adjusted R Square = -.044 Regression Results Using Directional Change In Control Variable Lower Chambers Intercept 1.043 Years Out of Power .000010 .002 .011 .992 Professionalism .00038 .067 .431 .669 Change In Control -.058 -.143 -.905 .371 Speaker Change -.029 -.172 -1.127 .266 N = 48 R Square = .055 Adjusted R Square = -.033 Upper Chambers Intercept 1.019 Years Out of Power - .00038 -.041 -.251 .803 Professionalism .0020 .227 1.483 .145 Change In Control -.049 -.077 -.471 .640 Leadership Change .030 .116 .735 .466 N = 48 R Square = .059 Adjusted R Square = -.028
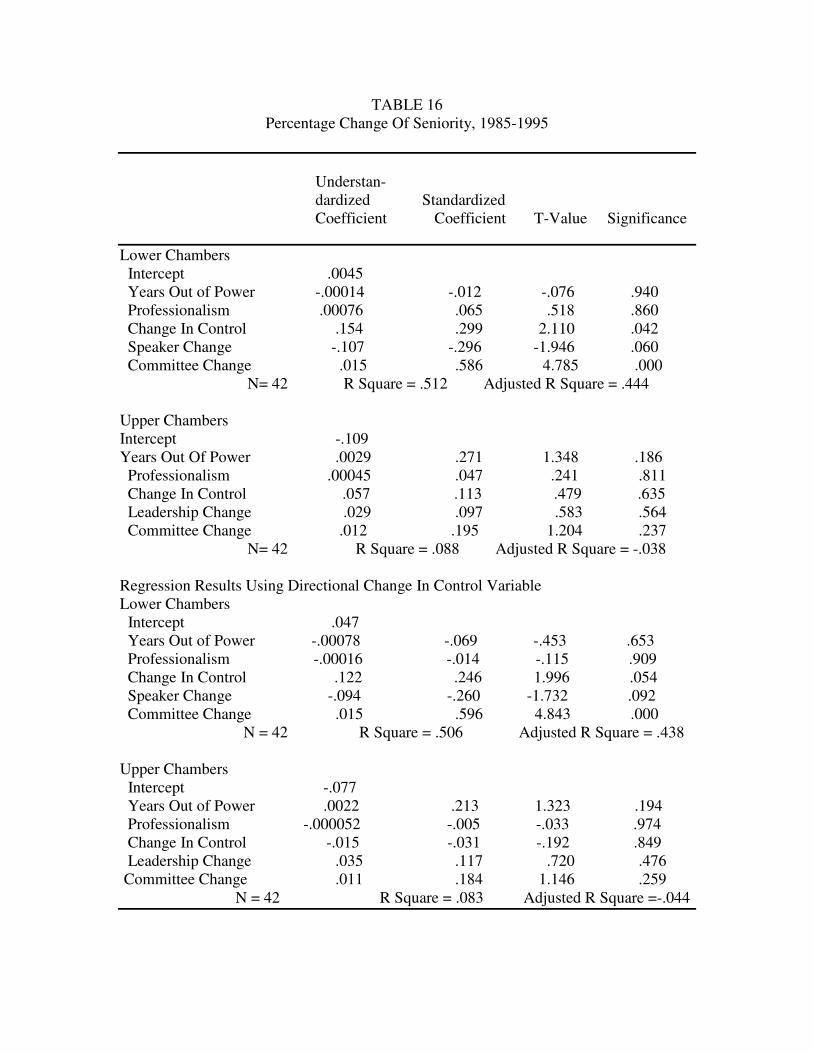
TABLE 16 Percentage Change Of Seniority, 1985-1995
Understan- dardized Standardized Coefficient Coefficient T-Value Significance
Lower Chambers Intercept .0045 Years Out of Power -.00014 -.012 -.076 .940 Professionalism .00076 .065 .518 .860 Change In Control .154 .299 2.110 .042 Speaker Change -.107 -.296 -1.946 .060 Committee Change .015 .586 4.785 .000 N= 42 R Square = .512 Adjusted R Square = .444 Upper Chambers Intercept -.109 Years Out Of Power .0029 .271 1.348 .186 Professionalism .00045 .047 .241 .811 Change In Control .057 .113 .479 .635 Leadership Change .029 .097 .583 .564 Committee Change .012 .195 1.204 .237 N= 42 R Square = .088 Adjusted R Square = -.038 Regression Results Using Directional Change In Control Variable Lower Chambers Intercept .047 Years Out of Power -.00078 -.069 -.453 .653 Professionalism -.00016 -.014 -.115 .909 Change In Control .122 .246 1.996 .054 Speaker Change -.094 -.260 -1.732 .092 Committee Change .015 .596 4.843 .000 N = 42 R Square = .506 Adjusted R Square = .438 Upper Chambers Intercept -.077 Years Out of Power .0022 .213 1.323 .194 Professionalism -.000052 -.005 -.033 .974 Change In Control -.015 -.031 -.192 .849 Leadership Change .035 .117 .720 .476 Committee Change .011 .184 1.146 .259 N = 42 R Square = .083 Adjusted R Square =-.044
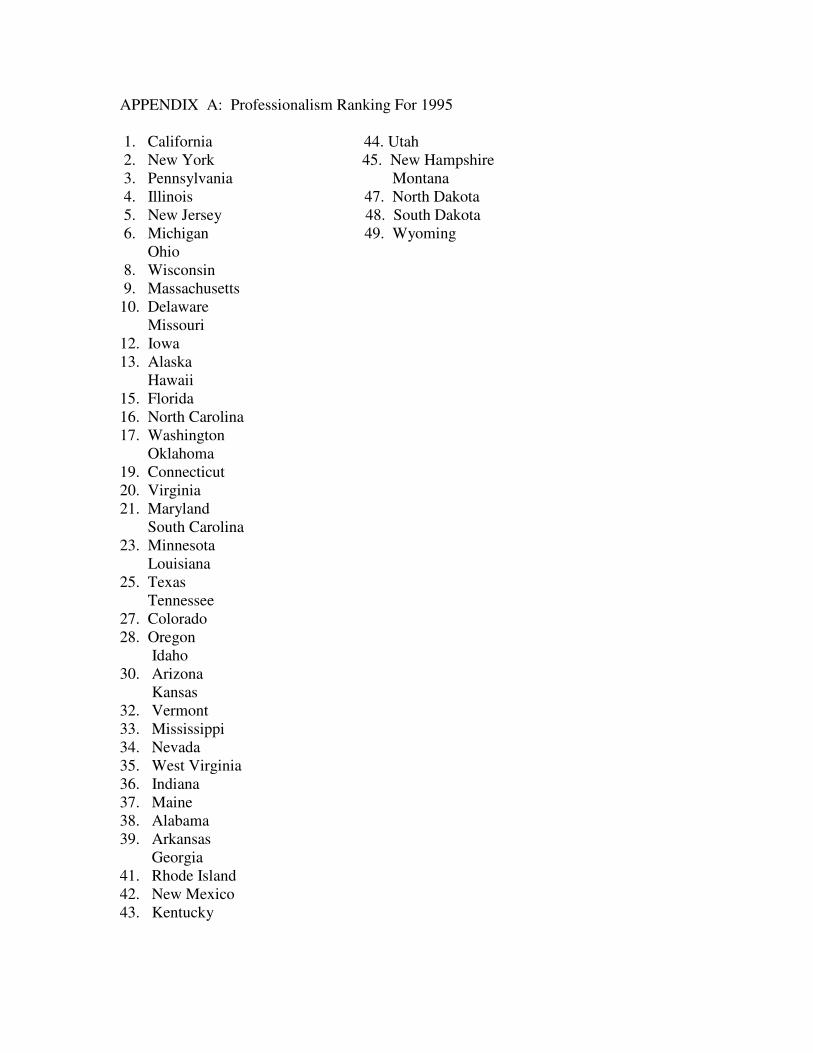
APPENDIX A: Professionalism Ranking For 1995 1. California 44. Utah 2. New York 45. New Hampshire 3. Pennsylvania Montana 4. Illinois 47. North Dakota 5. New Jersey 48. South Dakota 6. Michigan 49. Wyoming Ohio 8. Wisconsin 9. Massachusetts 10. Delaware Missouri 12. Iowa 13. Alaska Hawaii 15. Florida 16. North Carolina 17. Washington Oklahoma 19. Connecticut 20. Virginia 21. Maryland South Carolina 23. Minnesota Louisiana 25. Texas Tennessee 27. Colorado 28. Oregon Idaho 30. Arizona Kansas 32. Vermont 33. Mississippi 34. Nevada 35. West Virginia 36. Indiana 37. Maine 38. Alabama 39. Arkansas Georgia 41. Rhode Island 42. New Mexico 43. Kentucky
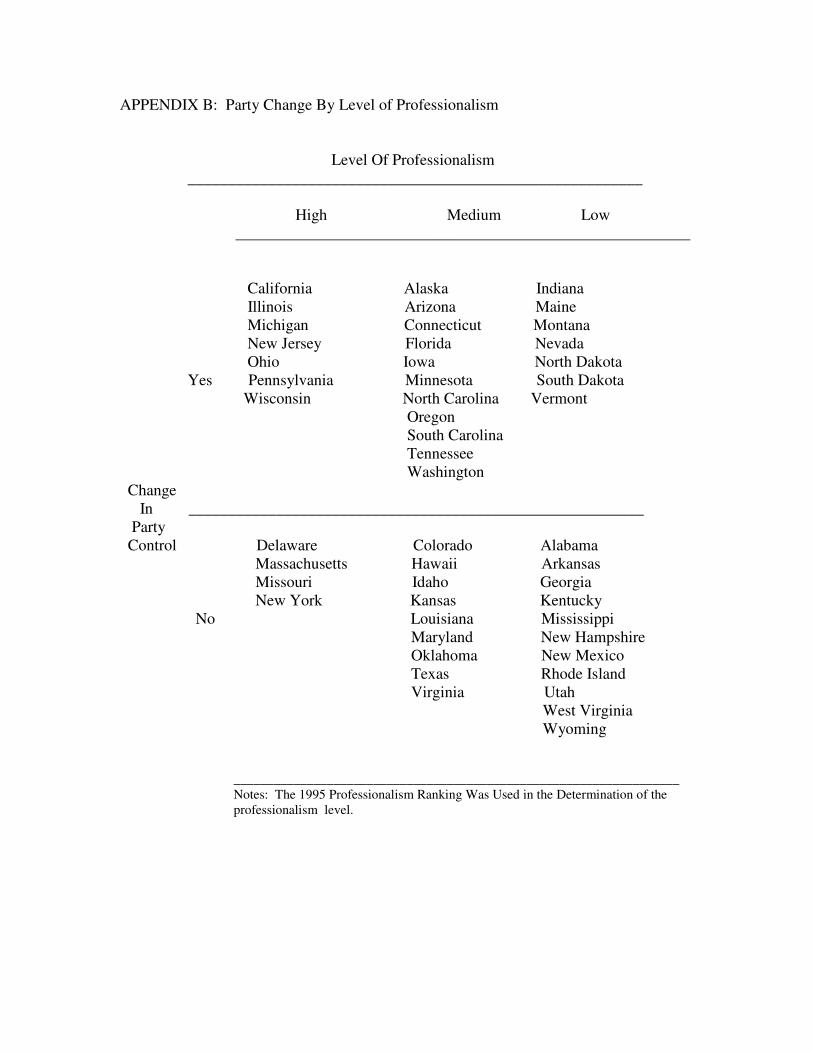
APPENDIX B: Party Change By Level of Professionalism
Level Of Professionalism _________________________________________________________ High Medium Low _________________________________________________________ California Alaska Indiana Illinois Arizona Maine Michigan Connecticut Montana New Jersey Florida Nevada Ohio Iowa North Dakota Yes Pennsylvania Minnesota South Dakota Wisconsin North Carolina Vermont Oregon South Carolina Tennessee Washington Change In _________________________________________________________ Party Control Delaware Colorado Alabama Massachusetts Hawaii Arkansas Missouri Idaho Georgia New York Kansas Kentucky No Louisiana Mississippi Maryland New Hampshire Oklahoma New Mexico Texas Rhode Island Virginia Utah West Virginia Wyoming
___________________________________________________________________ Notes: The 1995 Professionalism Ranking Was Used in the Determination of the professionalism level.