Embed Size (px)
Citation preview

RESEARCH ARTICLE
An examination of school reopening
strategies during the SARS-CoV-2 pandemic
Alfonso LanderosID1, Xiang Ji6, Kenneth Lange1,2,5, Timothy C. Stutz1, Jason Xu7, Mary
E. Sehl1,4*, Janet S. Sinsheimer1,2,3*
1 Department of Computational Medicine, UCLA, Los Angeles, CA, United States of America, 2 Department
of Human Genetics, UCLA, Los Angeles, CA, United States of America, 3 Department of Biostatistics, UCLA,
Los Angeles, CA, United States of America, 4 Division of Hematology-Oncology, Department of Medicine,
UCLA, Los Angeles, CA, United States of America, 5 Department of Statistics, UCLA, Los Angeles, CA,
United States of America, 6 Department of Mathematics, Tulane University, New Orleans, LA, United States
of America, 7 Department of Statistical Science, Duke University, Durham, NC, United States of America
* [email protected] (MES); [email protected] (JSS)
Abstract
The SARS-CoV-2 pandemic led to closure of nearly all K-12 schools in the United States of
America in March 2020. Although reopening K-12 schools for in-person schooling is desir-
able for many reasons, officials understand that risk reduction strategies and detection of
cases are imperative in creating a safe return to school. Furthermore, consequences of
reclosing recently opened schools are substantial and impact teachers, parents, and ulti-
mately educational experiences in children. To address competing interests in meeting edu-
cational needs with public safety, we compare the impact of physical separation through
school cohorts on SARS-CoV-2 infections against policies acting at the level of individual
contacts within classrooms. Using an age-stratified Susceptible-Exposed-Infected-
Removed model, we explore influences of reduced class density, transmission mitigation,
and viral detection on cumulative prevalence. We consider several scenarios over a 6-
month period including (1) multiple rotating cohorts in which students cycle through in-per-
son instruction on a weekly basis, (2) parallel cohorts with in-person and remote learning
tracks, (3) the impact of a hypothetical testing program with ideal and imperfect detection,
and (4) varying levels of aggregate transmission reduction. Our mathematical model pre-
dicts that reducing the number of contacts through cohorts produces a larger effect than
diminishing transmission rates per contact. Specifically, the latter approach requires dra-
matic reduction in transmission rates in order to achieve a comparable effect in minimizing
infections over time. Further, our model indicates that surveillance programs using less sen-
sitive tests may be adequate in monitoring infections within a school community by both
keeping infections low and allowing for a longer period of instruction. Lastly, we underscore
the importance of factoring infection prevalence in deciding when a local outbreak of infec-
tion is serious enough to require reverting to remote learning.
PLOS ONE
PLOS ONE | https://doi.org/10.1371/journal.pone.0251242 May 20, 2021 1 / 16
a1111111111
a1111111111
a1111111111
a1111111111
a1111111111
OPEN ACCESS
Citation: Landeros A, Ji X, Lange K, Stutz TC, Xu J,
Sehl ME, et al. (2021) An examination of school
reopening strategies during the SARS-CoV-2
pandemic. PLoS ONE 16(5): e0251242. https://doi.
org/10.1371/journal.pone.0251242
Editor: Martial L Ndeffo Mbah, Texas A&M
University College Station, UNITED STATES
Received: November 30, 2020
Accepted: April 22, 2021
Published: May 20, 2021
Copyright: © 2021 Landeros et al. This is an open
access article distributed under the terms of the
Creative Commons Attribution License, which
permits unrestricted use, distribution, and
reproduction in any medium, provided the original
author and source are credited.
Data Availability Statement: Simulation code to
replicate the results of the study is available at:
https://github.com/alanderos91/
COVID19SchoolReopening.
Funding: KL and JSS are supported by the National
Institute of General Medical Sciences of the
National Institutes of Health under award number
R01GM053275 (https://www.nigms.nih.gov/).
MES is supported by the Susan G. Komen Career
Catalyst Award CCR16380478 (https://ww5.
komen.org/ResearchGrants/FundingOpportunities.
html). JX is supported by the National Science

Introduction
Reopening K-12 schools is a topic of intense discussion. Because transmission of SARS-CoV-2
occurs through respiratory droplets, reopening policies must adequately reduce crowded envi-
ronments at school to protect children, teachers, staff, and ultimately communities. Unfortu-
nately, many factors work to the detriment of ostensibly reasonable strategies, including
extended hours for teachers, challenges in transporting children to and from school, and
reduced quality of educational experience. Although U.S. school closures in March 2020
reduced COVID-19 cases in states with low cumulative incidence, education researchers
worry about lagging educational development of children once schools reopen [1–3]. A pre-
dictable, regular attendance policy is crucial in balancing social burden with maintaining
steady educational progress.
As school systems, professional organizations, and governments have proposed different
reopening strategies to reduce infection risks to students, teachers, school staff, and faculty, it
is helpful to quantify ramifications of different plans [4]. Here we explore a simple, interpret-
able mathematical model that compares infection rates under various reopening scenarios.
Specifically, we compare consequences of (1) reopening at full capacity, (2) allowing half of all
children to return to in-person schooling while the other half continues with remote learning
(parallel cohorts), and (3) alternating sessions in which different student cohorts attend school
every other or every third week (rotating cohorts). Our goal is to provide insight into epidemi-
ological consequences of reopening strategies and to quantify their consequences. In particu-
lar, we explore implications of the reclosing guidelines announced by Governor Gavin
Newsom for California schools [5].
Methods
Compartmental model
Our approach uses a deterministic Susceptible-Exposed-Infected-Removed (SEIR) model
stratified by age group and cohort. We assume that infecteds may or may not present with
symptoms and that the removed pool accounts for individuals with negligible contribution to
infection spread, including individuals that have either recovered with full immunity or died.
Given that natural immunity may persist over several months [6–9] and that our simulations
span a period of 6 months, we make the plausible assumption that individuals do not return to
the susceptible pool once infected. For simplicity, the simulation scope is limited to two age
groups, children in K-12 education spread over 1 to 3 child cohorts and adults over 18 years.
Births are ignored because our simulations operate on relatively short time scales. Although
mortality certainly represent an important metric for public health concerns, we do not model
deaths explicitly. This simplification avoids introducing additional model parameters. In the-
ory, one might approximate deaths by adjusting our predictions for the number of removed
individuals by community-specific estimates for death rates. Model assumptions are further
elaborated in our discussion of transmission rates and other model parameters.
In our differential equations model the functions S(t), E(t), I(t), and R(t) denote the fraction
of susceptible, exposed, infected, and removed individuals, respectively, in an overall popula-
tion at time t. Each compartment is stratified by age class (1 for children, 2 for adults) and
cohort membership so that I1k refers to infected children in cohort k. With this notation in
mind, we propose the following model for the force of infection acting on susceptible
PLOS ONE An examination of school reopening strategies
PLOS ONE | https://doi.org/10.1371/journal.pone.0251242 May 20, 2021 2 / 16
Foundation under grant number DMS-2030355
(https://www.nsf.gov/). The funders had no role in
study design, data collection and analysis, decision
to publish, or preparation of the manuscript.
Competing interests: The authors have declared
that no competing interests exist.

individuals in class j and cohort k, denoted λjk(t), as
ljkðtÞ ¼X
cohort ‘
X
age class i
interaction
between
cohorts k; ‘
0
B@
1
CA�
transmission
for age
group i! j
0
B@
1
CA�
fraction of
infecteds in
age group i;
and cohort ‘
0
BBBB@
1
CCCCA
¼X
‘
X
i
ak‘ � bij � Ii‘ðtÞ:
For pairs of cohorts k 6¼ ℓ, the extremes αkℓ = 0 and αkℓ = 1 reflect complete separation and
mixing between two cohorts, respectively. Values in between these limits may be interpreted
as decreased interaction due to physical or social distancing. Weak cohort interactions are
fixed at αkℓ = 0.05 in all of our simulations. The transmission rates βij may be asymmetric to
capture heterogeneity in transmission due to different contact patterns, susceptibility, or infec-
tiousness. Lastly, the parameters σj and γj for age class j represent rates at which exposed indi-
viduals become infectious (latency) and infecteds recover from the contagious stage
(infectiousness), respectively. Specifically, we take 1/γj as the average number of days an indi-
vidual in class j is contagious based on a time-homogeneous Markovian model; an analogous
interpretation holds for the latency parameters.
Fig 1 summarizes the high level features of our mathematical model. All numerical simula-
tions are carried out in the Julia programming language using tools from the SciML ecosystem
[10–13].
We note that our modelling studies differ from previous work. Compared to Zhang et al.
[14], our model lacks the detailed data on contact patterns among multiple age classes. This
omission is deliberate. Our model focuses on the interaction between adult and child age clas-
ses to understand the influence of transmission rates, cohort structure, and demographics
Fig 1. Overview of SEIR compartmental model. The main compartments are denoted by S(t), E(t), I(t), and R(t) for
susceptible, exposed, infected, and removed, respectively. Compartments are stratified by age class (1—children, 2—
adults) and membership to cohort k. The coefficients αkℓ 2 [0, 1] account for the strength of interaction between
cohorts k and ℓ.
https://doi.org/10.1371/journal.pone.0251242.g001
PLOS ONE An examination of school reopening strategies
PLOS ONE | https://doi.org/10.1371/journal.pone.0251242 May 20, 2021 3 / 16

simultaneously. The later section on our phenomenological transmission model elaborates on
this approach. Similarly, we depart from the framework of Lee et al. [15] to model multiple
rotating cohorts and the influence of increased child-child contact due to in-person school
attendance.
Simulation studies on prevalence thresholds
We consider the effect of a stopping rule on cumulative prevalence. Inspired by California’s
guidelines urging schools to revert to remote learning whenever the infections within a school
reach 5% in 2-week period (3), we define the stopping time tthreshold as the first time that
detected school cases reach the specified threshold. Formally, the stopping time is given by
tthreshold ¼ inf t 2 T :X
s2windowðtÞ
CðsÞ � 5%
( )
;
where T is a set of testing times and the sum is taken over a sliding 14-day window up to time
t. The quantity C(s) = sensitivity × I1k(s)/q represents detected cases adjusted for population
size q, and is specific to the active cohort k. Detection necessarily depends on a particular test’s
sensitivity and is based on testing at the beginning of a school day, after which infected individ-
uals in the active cohort are immediately isolated and placed in the removed state (I(t)! R(t)). The isolation rule applies only to the cohort at school, while the sensitivity factor in the
rule captures imprecision in testing and reporting.
Note that tthreshold =1 if the threshold is never reached over the time span of our simula-
tions. Furthermore, our simulation results involving tthreshold represent a lower bound because
case isolation is taken to be instantaneous. In practice, segregation of affected pupils is delayed.
Our model does not explicitly account for adult staff at school. Our simplifying assumption is
justified by our focus on qualitative behavior and the fact that students typically outnumber
teachers and ancillary staff. For example, the average class sizes for public elementary and pub-
lic secondary schools are estimated to be 21.2 and 26.8 students, respectively, for the 2011–
2012 academic year [16]. At a 20:1 student to staff ratio, a school with 1000 students would
need 53 cases in a 14-day period to meet the closure criterion of 50 set in our simulations.
Modeling transmission between age classes
In spite of less severe disease and lower case-fatality rates than adults, children may be just as
prone to SARS-CoV-2 infections as adults [17]. Children’s symptoms range from fever, rhini-
tis, cough, and GI symptoms, to a disease termed Multisystem Inflammatory Syndrome in
Children (MIS-C) [18–20]. However, because children’s symptoms are typically less severe
and of shorter duration than those of adults [21], the likelihood of pediatric infection escaping
symptom-based monitoring, such as temperature screening, is higher than that of adults. This
reality increases pre-symptomatic and asymptomatic transmission [22, 23]. Thus, detecting
transmission in children is difficult; quantifying it is all the more challenging [24–26].
Contact tracing data from Singapore suggest that per contact transmission between chil-
dren, particularly in educational settings, is low compared with adult-adult transmission [27].
Yet the number of contacts between children is expected to be significantly higher compared
to other age groups [28, 29]. Changes in contact structure will necessarily change estimates of
transmission rates [14]. For example, Li et al. provide transmission rate estimates for Wuhan
prior to (1.12 per day) and following travel restrictions (0.52 per day) [26]. An additional
source of heterogeneity in transmission is the potentially reduced susceptibility of children
compared to adults [30]. The review by Viner et al. summarizes much of the early literature on
PLOS ONE An examination of school reopening strategies
PLOS ONE | https://doi.org/10.1371/journal.pone.0251242 May 20, 2021 4 / 16

this topic and suggests that the susceptibility of adolescents may be similar to that of adults
[31]. Infectiousness of different age groups is not as well characterized. Each source of hetero-
geneity poses a challenge to developing a parsimonious mathematical model.
Rather than reconciling transmission rate estimates across populations based on different
scientific models, we vary transmission rates between and within age classes to underscore the
influence of modelling assumptions on epidemiological consequences and to calibrate the
range of effects given existing evidence. To this end, our transmission rates βij are designed to
separate the magnitude of transmission from the effects of different age class interactions.
Scale is determined by baseline transmission rate, β0 and is interpreted as a characteristic of a
population. The baseline transmission rate is then used to define each βij based on the formula
βij = β0 × fij with weights fij 2 [0, 1] capturing the contribution of each i! j interaction to the
aggregate transmission rate β0. For our model with only 2 age classes, imposing the constraint
f11 þ f12 þ f21 þ f22 ¼ 1;
allows us to explore the effect of transmissibility assumptions at a fixed scale while retaining
the complexity of contact matrices, susceptibility, and infectiousness.
There are a few special cases to point out. The case
f11 ¼ f12 ¼ f21 ¼ f22 ¼ 1=4;
assumes that child-child, child-adult, adult-child, and adult-adult interactions are indistin-
guishable and therefore that the two age groups are equivalent on the basis of transmission. In
the absence of cohort structures, the force of infection on class j becomes
lj ¼ b0
X
i
fijIi ¼ b0I;
effectively collapsing our model to the basic SEIR equations under which β0 is the transmission
rate of a homogeneous population. The case f11 < f22 reflects lower susceptibility in children
compared to adults, differences in contact structure, or both. Assuming the nature of contacts
between groups is symmetric, the scenario f12 > f21 suggests that child-adult interactions con-
tribute more to transmission than adult-child interactions due to differences in susceptibility
or infectiousness. Our definition of transmission rates sidesteps the complexity in modelling
SARS-CoV-2 transmission and affords our model greater flexibility and interpretability at the
expense of parameter identifiability.
Cohort structure and increased child-child contact
A well-timed cyclic attendance strategy tuned to the latent period of SARS-CoV-2 may curtail
secondary infections [32]. Assuming a latent period of 3-4 days, a weekly rotation schedule
synchronizes with peak infectiousness. To compare with full-time and online-only instruction,
we investigate consequences in reopening at 50% and 33% capacity with rotating cohorts. Our
simulations therefore model transmission between children using period rates that cycle
between high and low contact values. Namely, we take t 7! c × β11 on school days and t 7! β11
otherwise, where c is a multiplier reflecting increased contacts in children. This function is
phased between cohorts to reflect school rotation. In summary, children in rotating cohorts
attend school for 5 consecutive days and then rotate with the next cohort at the beginning of
the following week. With two cohorts children attend school every other week; for three
cohorts they attend every third week (rotating cohort strategy). A trend in the U.S. is to allow
families to opt for remote learning in lieu of in-person instruction during the SARS-CoV-2
pandemic. We model this situation by dividing our virtual school community into two cohorts
PLOS ONE An examination of school reopening strategies
PLOS ONE | https://doi.org/10.1371/journal.pone.0251242 May 20, 2021 5 / 16

of equal size, one which attends school and thus experiences an elevated transmission rate
while a second group opts for a remote learning option (parallel cohort strategy).
Choices for other model parameters
In contrast to factors contributing to transmission rates, latent, infectious, and incubation
periods for SARS-CoV-2 are better characterized in the literature. Lauer et al. estimate a
median incubation period of approximately 5 days [33]. Li et al. infer latency and infectious
periods of 3.69 and 3.47 days, respectively [26]. The review by Bar-On reports median latent
and infectious periods of 3 and 4 days, respectively [34]. Other studies report serial intervals
and incubation periods consistent with these estimates for latency and infectiousness [35, 36].
Unfortunately, the literature on similar epidemiological inferences in children is sparse. One
observational study suggests children may have incubation periods similar to those of adults
[37].
Because our simulations model school reopening, the proportion of infected individuals
will influence prevalence and especially time to school closures. A periodic joint report from
the American Academy of Pediatrics and Children’s Hospital Association indicates that chil-
dren account for 12.9% (range: 8%-20%) of COVID-19 cases across US states and territories as
of February 4, 2021 [38]. We also account for demographic structure by considering the pro-
portion of children and adults in simulations. The American Community Survey Education
Tabulation for 2014-2018 [16] suggests that children under 18 years of age make up approxi-
mately 22% of a population delineated by school district boundaries. Thus, we calibrate our
simulations to a population mix of 22% children and 78% adults, and assume children account
for 10% of initial infections. In addition, the total proportion of infections is fixed to 2% of a
population (2000 active infections per 100,000) to simulate under conditions away from dis-
ease-free equilibrium and to ensure the stopping time is not immediately hit. These choices
represent scenarios away from herd immunity [39, 40].
Table 1 summarizes our choices and lists references pertinent to each choice, where
applicable.
Results
Cohorts reduce R0 under various transmission modalities
We first examine the impact of separating children into rotating cohorts on the basic repro-
duction number R0 of the model. Unfortunately, this quantity necessarily depends on poorly
characterized transmission rates and varies with different contact patterns and human behav-
iors. Thus, we use our parameterization βij = β0 fij to identify dominant terms fij contributing
to R0 under varying cohort numbers but with β0 fixed. In particular, we consider 3 interesting
cases: (1) adult-child and child-adult transmission are symmetric, (2) child-child transmission
is weak, and (3) adult-adult transmission is weak. Fig 2 summarizes the results of our analysis.
In each of these cases, we find that splitting a school community into 2 or 3 rotating cohorts
substantially reduces R0 under a wide range of parameter values. For example, in the regime
with symmetric between-class transmission and weak child-child transmission, moving from
full capacity to 2 cohorts shifts R0 from about 3 to about 1.5 (Fig 2A and 2B, right corners).
Moving further to 3 cohorts brings the reproduction number below 1 in the same regime
(Fig 2C). Relaxing the symmetry assumption, we find the pattern recapitulated under both
assumptions of weak child-child transmission (Fig 2D–2F) and weak adult-adult transmission
(Fig 2G–2I). Further, this analysis suggests that child-adult and adult-adult transmission can
play dominant roles in the short-term dynamics of our model under the plausible scenario of
PLOS ONE An examination of school reopening strategies
PLOS ONE | https://doi.org/10.1371/journal.pone.0251242 May 20, 2021 6 / 16

weak child-child transmission (Fig 2D, right and top corners). The influence of β22 is not sur-
prising because our virtual population’s demography is skewed toward adults (78%). However,
our results demonstrate that child-adult transmission should be weighed carefully in reopen-
ing decisions because it less characterized and poses a potent risk, especially to school teachers.
We focus our attention on the asymmetric case with weak child-child transmission for the
remainder of the study. Specifically, we set f11 = 0.1, f12 = 0.25, f21 = 0.15, and f22 = 0.5 to model
this scenario, and take β0 = 1.2 to simulate under R0� 3. This choice does not reflect a belief
about conditions of the pandemic in any particular population; it is merely intended to dem-
onstrate effects of mitigation strategies within our modelling framework.
Reopening under prevalence-informed criteria
Identifying conditions under which schools can be safely reopened is paramount to proposing
public health policy for containing the epidemic. In particular, reopening schools only to
quickly close down after a few days of instruction is costly both in resources and its negative
health effect. Here we investigate the influence of initial conditions and elevated child-child
transmission on the stopping time tthreshold under an ideal scenario with a 100% sensitive test.
Fig 3 reports values for tthreshold after varying child-child transmission in active school cohorts
by a factor of c = 1, c = 2, and c = 10. Reopening schools under high infection burden leads to
smaller values for tthreshold, as expected. Interestingly, these results suggest that multiple
cohorts have a desired effect of delaying school closures beyond the time span of 26 weeks (6
months) in our simulations. For example, assuming 0.1% prevalence at reopening leads to
school closure after 6–7 weeks under a single cohort whereas multiple cohorts or the hybrid
approach have tthreshold > 26 weeks. The behavior of the stopping time is insensitive to the con-
tact multiplier c. However, there is a sharp transition from tthreshold > 26 weeks to tthreshold� 4
weeks under multiple cohorts as prevalence at reopening increases.
Next, we investigate the influence of test sensitivity in our simulated monitoring program
and closure criteria on period prevalence, taken as the sum of infecteds and removed
Table 1. Summary of model parameters with ranges and estimates.
Parameter Description Range/Estimate
β0 Bulk transmission rate for population 1.2 day-1, 1.5 day-1
f11 Weight for child to child transmission. 0–1; 0.1
f12 Weight for child to adult transmission. 0–1; 0.25
f21 Weight for adult to child transmission. 0–1; 0.15
f22 Weight for adult to adult transmission. 0–1; 0.5
1/σ1 Average child latency period. 3 days
1/σ2 Average adult latency period. 3 days
1/γ1 Average child infectious period. 4 days
1/γ2 Average adult infectious period. 4 days
αkk Strength of interactions within a cohort k. 1
αkℓ Strength of interactions between cohorts k and ℓ. 0.05
I(0) Proportion of infecteds at reopening (incidence). 0.0—10%; 2%
I1k Proportion of infected children at reopening. 0.0—10%; 10%
c Multiplier modeling increased child-child contact. 1,2,10
The range for transmission between adults suggested by Li et al. [26] calibrates the bulk rate. Latency and infectious
period estimates are based on Li et al. and the summary by Bar-On et al. [26, 34]. The initial proportion of infected
individuals is equally distributed across cohorts.
https://doi.org/10.1371/journal.pone.0251242.t001
PLOS ONE An examination of school reopening strategies
PLOS ONE | https://doi.org/10.1371/journal.pone.0251242 May 20, 2021 7 / 16
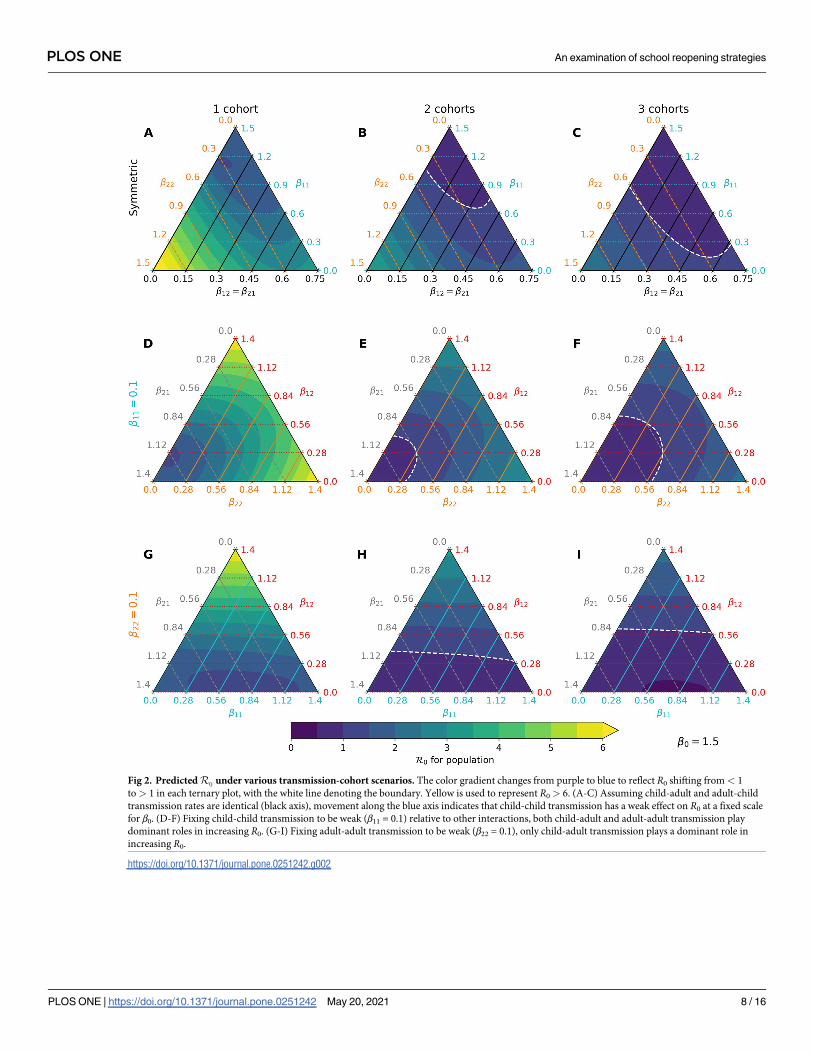
Fig 2. Predicted R0 under various transmission-cohort scenarios. The color gradient changes from purple to blue to reflect R0 shifting from< 1
to> 1 in each ternary plot, with the white line denoting the boundary. Yellow is used to represent R0 > 6. (A-C) Assuming child-adult and adult-child
transmission rates are identical (black axis), movement along the blue axis indicates that child-child transmission has a weak effect on R0 at a fixed scale
for β0. (D-F) Fixing child-child transmission to be weak (β11 = 0.1) relative to other interactions, both child-adult and adult-adult transmission play
dominant roles in increasing R0. (G-I) Fixing adult-adult transmission to be weak (β22 = 0.1), only child-adult transmission plays a dominant role in
increasing R0.
https://doi.org/10.1371/journal.pone.0251242.g002
PLOS ONE An examination of school reopening strategies
PLOS ONE | https://doi.org/10.1371/journal.pone.0251242 May 20, 2021 8 / 16

Fig 3. Number of weeks to reach a 5% stopping threshold in a community. Each scenario assumes a 100% sensitive test. The stopping time tthreshold
(y-axis) is simulated under varying prevalence conditions at reopening (x-axis). The contact multiplier for child-child transmission is also varied from
(A) c = 1 to (B) c = 2 and (C) c = 10 and has little influence on stopping times. Multiple cohorts are effective at prolonging school operations while
staying below a 5% prevalence threshold over a 14-day window. Note that only detected cases in children contribute to the decision rule.
https://doi.org/10.1371/journal.pone.0251242.g003
PLOS ONE An examination of school reopening strategies
PLOS ONE | https://doi.org/10.1371/journal.pone.0251242 May 20, 2021 9 / 16

individuals. We compare predictions of our model over 26 weeks (6 months) in Fig 4 when (1)
no action is taken (blue), (2) the monitoring program employs a perfectly sensitive test without
delays in reporting (orange), and (3) the monitoring program employs a rapid but less sensi-
tive test (green). Our simulations with a single cohort indicate that a 5% percent threshold pol-
icy can shift period prevalence in children from approximately 55% to 40% over the simulated
26-week period (Fig 4D). Compared to this ideal scenario, an imperfect test with 50% detec-
tion leads to a slightly later stopping time owing to infections spread by undetected cases and
greater overall pediatric infections (Fig 4A). The effect is less pronounced in the adult
Fig 4. Comparison of infections and susceptibles under different test sensitivities in both children and adults. Simulations are based on parameter
values f11 = 0.1, f12 = 0.25, f21 = 0.15, and f22 = 0.5 with bulk transmission rate β0 = 1.2. Reopening takes place at a 2% prevalence level (2000 infections
per 100,000). The decision criterion over a 14-day sliding window is highlighted in a dotted line. Blue, orange, and green lines correspond to scenarios
without intervention, with a 100% sensitive test, and a 50% sensitive test, respectively. (A) The 14-day prevalence criteria hits the 5% threshold after just
over 2 weeks in the two testing scenarios. (B) Prevalence in adults peaks after about 4 weeks independent of test sensitivity in children. (C) Testing is
effective in keeping most children safe from infection regardless of test sensitivity. (D) Testing in children has little impact on keeping adults free from
infection under these conditions.
https://doi.org/10.1371/journal.pone.0251242.g004
PLOS ONE An examination of school reopening strategies
PLOS ONE | https://doi.org/10.1371/journal.pone.0251242 May 20, 2021 10 / 16

population due to high adult-adult transmission. Crucially, reopening with a surveillance pro-
gram may provide approximately 2 weeks of continuous instruction. In our model, infections
after closing are driven by a lack of interventions outside of school; testing and isolation in this
context can curtail this growth. Our results support the importance of testing and complete
school closure in preventing a major disease outbreak after reopening.
We repeat the same simulation study with the hybrid parallel cohort policy. Fig 5 reports
the same indices recorded under the same parameter values as in the single cohort policy.
Reducing the force of infection through the community’s contact network successfully
decreases period prevalence, sustained contact between children notwithstanding
(Fig 5A–5C). The stopping rule for the in-person cohort is not triggered even when detection
is imperfect (Fig 5D–5F). Infections are generally higher in the in-person cohort compared to
the remote cohort for both children and adults.
Mitigating transmission between children
Although face masks can reduce the spread of SARS-CoV-2 by 40% in adults [41], risks of
mask wearing by elementary school children include impaired learning, speech development,
social development, and facial recognition [42, 43]. It is also unclear whether children can con-
sistently wear masks. An October 2020 survey of middle school and high school students, com-
municated by the CDC, underscores this point with mask wearing varying from
approximately 65% in classrooms and hallways to 25% in outdoor settings within school
boundaries [44].
We explore the impacts of varying degrees of protection conferred by combined risk reduc-
tion strategies, such as mask wearing, desk shields, handwashing, vigilant surface cleaning,
improved ventilation, and outdoor instruction. Combined impacts of these strategies are mod-
eled as 20%, 40%, 60%, and 80% reductions in the transmission rates β11 and β22 relative to ref-
erence values. Specifically, we take β11 = 0.12, β12 = 0.3, β21 = 0.18, and β22 = 0.6 as natural
Fig 5. Comparison of cumulative under the parallel cohort approach. (A-C) The 14-day prevalence criteria increases over the first 4 weeks, but point
prevalence consistently trends downward due to cohort structure. Over 90% of children are kept safe from infection under the conditions of this
simulation. (D-F) The combination of testing in children and cohort separation prevents a high level of infection in adults.
https://doi.org/10.1371/journal.pone.0251242.g005
PLOS ONE An examination of school reopening strategies
PLOS ONE | https://doi.org/10.1371/journal.pone.0251242 May 20, 2021 11 / 16
rates and apply a 40% reduction factor to adults by setting β21 = 0.072 and β22 = 0.24. This
implies R0� 1.7 prior to reopening. Increased contact is modeled by taking c = 10 so that β11
= 1.2, which corresponds to R0� 2.2 under the full capacity reopening scenario. This repre-
sents an extreme that illustrates effects in a poor situation.
Fig 6 compares prevalence trajectories for interventions directly targeting transmission
under a single or two rotating child cohorts. With a single cohort and no mitigation in chil-
dren, our choices lead to approximately 8%, 24%, and 28% infected children after 4, 13, and 26
weeks following reopening, respectively (Fig 6A, blue line). However, with measures that lead
to an 80% reduction in transmission, infections at 4, 13, and 26 weeks are 5%, 11%, and 13%,
respectively (Fig 6A, purple line). Targeting transmission rates in children also reduces infec-
tions in adults to a similar degree (Fig 6B). Much stricter adherence to transmission mitigation
measures is required for low infection levels when there is a single cohort (Fig 6A and 6B) than
when there are two cohorts (Fig 6C and 6D). A combination of both types of interventions
ultimately results in even fewer infections.
Fig 6. Cumulative prevalence trajectories under risk reduction strategies for children while at school. For child-child transmission, we set β11 = 0.1
× (1 − r) outside of school and β11 = (1 #x2212; r) × c × 0.1 during school, where r is a reduction factor due to effective risk reduction strategies and
c = 10 accounts for increased contact between children. (A–B) Mitigation that reduces transmission between children can lead to a substantial
reduction in infections for both children and adults, provided the mitigation effects are large. (C–D) The impact of risk reduction strategies persists
when children are separated into 2 rotating cohorts but does not demand as strict an adherence to be effective. An 80% reduction in pediatric
transmission has a weaker effect compared to separating children into 2 rotating cohorts as the latter strategy result in fewer than 5% pediatric infection
over 26 weeks (6 months).
https://doi.org/10.1371/journal.pone.0251242.g006
PLOS ONE An examination of school reopening strategies
PLOS ONE | https://doi.org/10.1371/journal.pone.0251242 May 20, 2021 12 / 16

Discussion
Summary
Our analysis identifies child-adult transmission as a potential risk to reopening schools even
under the plausible assumption of weak child-child transmission relative to adult-adult transmis-
sion (Fig 2D–2F). Moreover, our simulation studies highlight the profound impact of reducing
cohort size with parallel or rotating cohorts under a range of transmission rates and reproduc-
tion numbers. For example, during a 6-month time span, reopening schools in a population
with 0.1% infections with 2 cohorts avoids triggering a prevalence closure decision rule based on
a 5% pediatric infection threshold. This, allows schools to stay open longer compared to reopen-
ing at 100% capacity without cohort separation (Fig 3). Simultaneous adherence to transmission
mitigation measures and multiple separated cohorts can keep cases low, for example under 3%
(Fig 6C and 6D). Our work also underscores the importance of tracking infections and setting a
threshold for reverting to remote learning. In the absence of any intervention to in-person
instruction, the proportion of school safe from infection stays just above 40% at equilibrium (Fig
4B, blue). This compares with keeping the susceptible proportion above 60% under the combina-
tion of a rapid testing program, a stopping rule, and a single cohort (Fig 4B, green and orange).
Limitations
There are several limitations to our modelling that could be addressed in future studies. Finer
age stratification is required to predict outcomes in specific communities and can be imple-
mented within our modelling framework. For example, high school students may wear masks
and practice physical distancing more reliably than elementary school children, and may also
have transmission rates closer to those of adults [31]. Second, we assume equal transmission
rates among all adults and omit explicit interactions between students and teachers within a
classroom, which are critical in implementing backup protocols that allow switches to remote
learning. Network-based models are better suited to accounting for classroom and household
structures in a population, as well as shifting contact patterns [45–47] Third, our model treats
school communities in isolation. Schools in urban settings have diverse commuting patterns
and face potential for importing cases from outside adjacent neighborhoods. Fourth, our con-
clusions about reproduction numbers, period prevalence, stopping times, and impact of vari-
ous mitigation strategies should be understood as offering policy guidance rather than precise
quantitative predictions. Our ODEs are suited to fitting prevalence data rather than incidence
data which poses a challenge to predictive capabilities. Lastly, our models omit the stochastic
nature of infections in small populations. Although these caveats limit the quantitative accu-
racy of our predictions, we contend that our qualitative conclusions are correct.
Conclusion
We find that measures reducing class density by rotating cohorts between in-person and
remote schooling are likely to have greater impact in reducing the spread of SARS-CoV-2 than
policies such as mask wearing, handwashing, and physical distancing in the classroom. Never-
theless, the latter policies combined with a reduction in class density are still quite effective in
reducing effective transmission. From the perspective of mathematical epidemiology, this is to
be expected as separating a contact graph into disconnected pieces ultimately limits the prolif-
erative potential of an infectious disease. Surprisingly, parallel cohorts are as effective as rotat-
ing cohorts in case reduction, while requiring less coordination and work schedule adjustment
for parents. Educating children under either cohort strategy should be a priority in school re-
openings. Benefits of switching to remote learning when infections climb to an unacceptable
PLOS ONE An examination of school reopening strategies
PLOS ONE | https://doi.org/10.1371/journal.pone.0251242 May 20, 2021 13 / 16

level benefit from rapid testing, even if imperfect. Our rapid testing predictions are consistent
with a recent study [48] on the influence of viral kinetics, test sensitivity, test frequency, and
sample-to-answer reporting time in surveillance protocols, which also demonstrates that test
efficacy is a secondary concern given the dangers of the pandemic.
Finally, communities should be treated differently. High-risk communities with large class
sizes need to be especially careful in exposing children to unnecessary risks. Future work is
needed to review policies of schools that have successfully remained open over the past year.
Our modeling techniques may be helpful in estimating the expected impact of applying those
policies in larger districts.
Supporting information
S1 Appendix.
(ZIP)
S1 File.
(DOCX)
Author Contributions
Conceptualization: Alfonso Landeros, Mary E. Sehl, Janet S. Sinsheimer.
Formal analysis: Alfonso Landeros, Jason Xu, Mary E. Sehl, Janet S. Sinsheimer.
Investigation: Alfonso Landeros, Xiang Ji, Kenneth Lange, Timothy C. Stutz, Jason Xu, Mary
E. Sehl, Janet S. Sinsheimer.
Methodology: Alfonso Landeros, Xiang Ji, Kenneth Lange, Timothy C. Stutz, Jason Xu.
Project administration: Kenneth Lange, Mary E. Sehl, Janet S. Sinsheimer.
Software: Alfonso Landeros, Xiang Ji, Timothy C. Stutz.
Supervision: Kenneth Lange, Mary E. Sehl, Janet S. Sinsheimer.
Visualization: Alfonso Landeros, Xiang Ji, Timothy C. Stutz.
Writing – original draft: Alfonso Landeros, Mary E. Sehl, Janet S. Sinsheimer.
Writing – review & editing: Alfonso Landeros, Xiang Ji, Kenneth Lange, Timothy C. Stutz,
Jason Xu, Mary E. Sehl, Janet S. Sinsheimer.
References1. Auger KA, Shah SS, Richardson T, et al. Association between statewide school closure and COVID-19
incidence and mortality in the US. JAMA. 2020 Jul; 7. https://doi.org/10.1001/jama.2020.14348 PMID:
32745200
2. Kuhfeld M, Tarasawa B. The COVID-19 slide: What summer learning loss can tell us about the potential
impact of school closures on student academic achievement. NWEA. 2020.
3. Kuhfeld M, Soland J, Tarasawa B, Johnson A, Ruzek E, Liu J. Projecting the Potential Impact of
COVID-19 School Closures on Academic Achievement. Educational Researcher. 2020 Nov 1; 49
(8):549–65. https://doi.org/10.3102/0013189X20965918
4. Sheikh A, Sheikh A, Sheikh Z, Dhami S. Reopening schools after the COVID-19 lockdown. Journal of
Global Health. 2020 Jun; 10(1):010376. https://doi.org/10.7189/jogh.10.010376 PMID: 32612815
5. Office of Governor Gavin Newsom. Governor Gavin Newsom Lays Out Pandemic Plan for Learning
and Safe Schools. California Governor. Published July 17, 2020. Accessed July 21, 2020. https://www.
gov.ca.gov/2020/07/17/governor-gavin-newsom-lays-out-pandemic-plan-for-learning-and-safe-
schools/
PLOS ONE An examination of school reopening strategies
PLOS ONE | https://doi.org/10.1371/journal.pone.0251242 May 20, 2021 14 / 16

6. Seow J, Graham C, Merrick B, Acors S, Pickering S, Steel KJA, et al. Longitudinal observation and
decline of neutralizing antibody responses in the three months following SARS-CoV-2 infection in
humans. Nature Microbiology. 2020 Dec; 5(12):1598–607. https://doi.org/10.1038/s41564-020-00813-
8 PMID: 33106674
7. Gaebler C, Wang Z, Lorenzi JCC, Muecksch F, Finkin S, Tokuyama M, et al. Evolution of antibody immunity
to SARS-CoV-2. Nature. 2021 Jan 18;1–6. https://doi.org/10.1038/s41586-021-03207-w PMID: 33461210
8. Dan JM, Mateus J, Kato Y, Hastie KM, Yu ED, Faliti CE, et al. Immunological memory to SARS-CoV-2
assessed for up to 8 months after infection. Science. 2021 Feb 5; 371 (6529). https://doi.org/10.1126/
science.abf4063 PMID: 33408181
9. Sokal A, Chappert P, Barba-Spaeth G, Roeser A, Fourati S, Azzaoui I, et al. Maturation and persistence
of the anti-SARS-CoV-2 memory B cell response. Cell. 2021 Feb 2; 0(0). https://doi.org/10.1016/j.cell.
2021.01.050 PMID: 33571429
10. Rackauckas C, Nie Q. DifferentialEquations.jl—A Performant and Feature-Rich Ecosystem for Solving
Differential Equations in Julia. Journal of Open Research Software. 2017; 5(1):15. https://doi.org/10.
5334/jors.151
11. Rackauckas C, Nie Q. Confederated modular differential equation APIs for accelerated algorithm devel-
opment and benchmarking. Advances in Engineering Software. 2019; 132:1–6. https://doi.org/10.1016/
j.advengsoft.2019.03.009
12. SciML. DifferentialEquations.Jl. Checkout v6.15.0; 2020. https://github.com/SciML/OrdinaryDiffEq.jl
13. SciML. OrdinaryDiffEq.Jl. Checkout v5.41.0; 2020. https://github.com/SciML/DifferentialEquations.jl
14. Zhang J, Litvinova M, Liang Y, et al. Changes in contact patterns shape the dynamics of the COVID-19
outbreak in China. Science. 2020; 368(6498):1481–1486. https://doi.org/10.1126/science.abb8001
PMID: 32350060
15. Lee B, Hanley JP, Nowak S, Bates JHT, Hebert-Dufresne L. Modeling the impact of school reopening
on SARS-CoV-2 transmission using contact structure data from Shanghai. BMC Public Health. 2020
Nov 16; 20(1):1713. https://doi.org/10.1186/s12889-020-09799-8 PMID: 33198707
16. U.S. Department of Education, National Center for Education Statistics. Digest of Education Statistics,
2018. 2019 Dec 24; Available from: https://nces.ed.gov/pubsearch/pubsinfo.asp?pubid=2020009
17. Zimmermann P, Curtis N. Coronavirus Infections in Children Including COVID-19: An Overview of the
Epidemiology, Clinical Features, Diagnosis, Treatment and Prevention Options in Children. The Pediat-
ric Infectious Disease Journal. 2020; 39(5):355–368. https://doi.org/10.1097/INF.0000000000002660
PMID: 32310621
18. Verdoni L, Mazza A, Gervasoni A, et al. An outbreak of severe Kawasaki-like disease at the Italian epi-
centre of the SARS-CoV-2 epidemic: an observational cohort study. The Lancet. 2020; 395
(10239):1771–1778. https://doi.org/10.1016/S0140-6736(20)31103-X
19. HAN Archive—00432 | Health Alert Network (HAN). https://emergency.cdc.gov/han/2020/han00432.
asp (2020). February 2, 2021.
20. Dufort EM, Koumans EH, Chow EJ, Rosenthal EM, Muse A, Rowlands J, et al. Multisystem Inflamma-
tory Syndrome in Children in New York State. New England Journal of Medicine. 2020; 383:347–358.
https://doi.org/10.1056/NEJMoa2021756 PMID: 32598830
21. Ludvigsson JF. Systematic review of COVID-19 in children shows milder cases and a better prognosis than
adults. Acta Paediatrica. 2020; 109(6):1088–95. https://doi.org/10.1111/apa.15270 PMID: 32202343
22. Jones TC, Muhlemann B, Veith T, et al. An analysis of SARS-CoV-2 viral load by patient age. medRxiv.
Published online June 9, 2020:2020.06.08.20125484. https://doi.org/10.1101/2020.06.08.20125484
23. Paltiel AD, Zheng A, Walensky RP. Assessment of SARS-CoV-2 Screening Strategies to Permit the
Safe Reopening of College Campuses in the United States. JAMA Netw Open. 2020; 3(7):e2016818–
e2016818. https://doi.org/10.1001/jamanetworkopen.2020.16818 PMID: 32735339
24. Lopez AS. Transmission Dynamics of COVID-19 Outbreaks Associated with Child Care Facilities—Salt
Lake City, Utah, April–July 2020. MMWR Morb Mortal Wkly Rep. 2020; 69. https://doi.org/10.15585/
mmwr.mm6937e3
25. Park Y, Choe Y, Park O, Park S, Kim Y, Kim J, et al. Contact Tracing during Coronavirus Disease Out-
break, South Korea, 2020. Emerging Infectious Diseases. 2020; 26(10):2465–2468. https://doi.org/10.
3201/eid2610.201315 PMID: 32673193
26. Li R, Pei S, Chen B, et al. Substantial undocumented infection facilitates the rapid dissemination of
novel coronavirus (SARS-CoV-2). Science. 2020; 368(6490):489–493. https://doi.org/10.1126/science.
abb3221 PMID: 32179701
27. Yung CF, Kam K, Nadua KD, Chong CY, Tan NWH, Li J, et al. Novel Coronavirus 2019 Transmission
Risk in Educational Settings. Clinical Infectious Diseases. 2021 Mar 15; 72(6):1055–8. https://doi.org/
10.1093/cid/ciaa794 PMID: 32584975
PLOS ONE An examination of school reopening strategies
PLOS ONE | https://doi.org/10.1371/journal.pone.0251242 May 20, 2021 15 / 16

28. Szablewski CM. SARS-CoV-2 Transmission and Infection Among Attendees of an Overnight Camp—
Georgia, June 2020. MMWR Morb Mortal Wkly Rep. 2020; 69. https://doi.org/10.15585/mmwr.
mm6931e1 PMID: 32759921
29. Zhang J, Litvinova M, Wang W, et al. Evolving epidemiology and transmission dynamics of coronavirus
disease 2019 outside Hubei province, China: a descriptive and modelling study. The Lancet Infectious
Diseases. 2020; 20(7):793–802. https://doi.org/10.1016/S1473-3099(20)30230-9 PMID: 32247326
30. Davies NG, Klepac P, Liu Y, Prem K, Jit M, Eggo RM. Age-dependent effects in the transmission and
control of COVID-19 epidemics. Nature Medicine. Published online June 16, 2020:1–7. PMID:
32546824
31. Viner RM, Mytton OT, Bonell C, Melendez-Torres GJ, Ward J, Hudson L, et al. Susceptibility to SARS-
CoV-2 Infection Among Children and Adolescents Compared With Adults: A Systematic Review and
Meta-analysis. JAMA Pediatr. 2021 Feb 1; 175(2):143. https://doi.org/10.1001/jamapediatrics.2020.
4573 PMID: 32975552
32. Karin O, Bar-On YM, Milo T, et al. Adaptive Cyclic Exit Strategies from Lockdown to Suppress COVID-
19 and Allow Economic Activity. Epidemiology; 2020. https://doi.org/10.1101/2020.04.04.20053579
33. Lauer SA, Grantz KH, Bi Q, et al. The Incubation Period of Coronavirus Disease 2019 (COVID-19)
From Publicly Reported Confirmed Cases: Estimation and Application. Annals of Internal Medicine.
2020; 172(9):577–582. https://doi.org/10.7326/M20-0504 PMID: 32150748
34. Bar-On YM, Flamholz A, Phillips R, Milo R. SARS-CoV-2 (COVID-19) by the numbers. Eisen MB, ed.
eLife. 2020; 9:e57309. https://doi.org/10.7554/eLife.57309 PMID: 32228860
35. Du Z, Xu X, Wu Y, Wang L, Cowling BJ, Meyers LA. Serial Interval of COVID-19 among Publicly
Reported Confirmed Cases. Emerging Infectious Diseases. 2020; 26(6):1341–1343. https://doi.org/10.
3201/eid2606.200357 PMID: 32191173
36. He X, Lau EHY, Wu P, et al. Temporal dynamics in viral shedding and transmissibility of COVID-19.
Nature Medicine. 2020; 26(5):672–675. https://doi.org/10.1038/s41591-020-0869-5 PMID: 32296168
37. Zhu Y, Bloxham CJ, Hulme KD, Sinclair JE, Tong ZWM, Steele LE, et al. A Meta-analysis on the Role of
Children in Severe Acute Respiratory Syndrome Coronavirus 2 in Household Transmission Clusters.
Clinical Infectious Diseases. 2020 https://doi.org/10.1093/cid/ciaa1825 PMID: 33283240
38. Children and COVID-19: State-Level Data Report. American Academy of Pediatrics. February 4, 2021.
39. Kwok KO, Lai F, Wei WI, Wong SYS, Tang JWT. Herd immunity—estimating the level required to halt
the COVID-19 epidemics in affected countries. Journal of Infection. 2020; 80(6):e32–e33. https://doi.
org/10.1016/j.jinf.2020.03.027 PMID: 32209383
40. Syal K. COVID-19: Herd immunity and convalescent plasma transfer therapy. Journal of Medical Virol-
ogy. 2020; 92(9):1380–2. https://doi.org/10.1002/jmv.25870 PMID: 32281679
41. Mitze T, Kosfeld R, Rode J, Walde K. Face masks considerably reduce COVID-19 cases in Germany.
Proc Natl Acad Sci USA. 2020 Dec 22; 117(51):32293–301. https://doi.org/10.1073/pnas.2015954117
PMID: 33273115
42. American Academy of Pediatrics. COVID-19 Planning Considerations: Guidance for School Re-entry.
Published June 25, 2020. Accessed July 1, 2020. http://services.aap.org/en/pages/2019-novel-
coronavirus-covid-19-infections/clinical-guidance/covid-19-planning-considerations-return-to-in-
person-education-in-schools/
43. American Federation of Teachers. Pediatricians, Educators and Superintendents Urge a Safe Return to
School This Fall. American Federation of Teachers. Published July 10, 2020. Accessed July 13, 2020.
https://www.aft.org/press-release/pediatricians-educators-and-superintendents-urge-safe-return-
school-fall
44. COVID-19 Stats: Percentage of Middle and High School Students Aged 13–21 Years Attending In-Per-
son Classes Who Reported Observing Fellow Students Wearing a Mask All the Time, by School Setting
and Activity—United States, October 2020. MMWR Morb Mortal Wkly Rep. 2021; 70. https://doi.org/10.
15585/mmwr.mm7006a5
45. Bu F, Aiello AE, Xu J, Volfovsky A. Likelihood-Based Inference for Partially Observed Epidemics on
Dynamic Networks. Journal of the American Statistical Association. 2020 Aug 18;1–17. https://doi.org/
10.1080/01621459.2020.1790376
46. Britton T. Epidemic models on social networks—With inference. Statistica Neerlandica. 2020; 74
(3):222–41. https://doi.org/10.1111/stan.12203
47. Jiang Y, Kassem R, York G, Junge M, Durrett R. SIR epidemics on evolving graphs. arXiv:190106568.
2019 Jan 19; Available from: http://arxiv.org/abs/1901.06568
48. Larremore DB, Wilder B, Lester E, Shehata S, Burke JM, Hay JA, et al. Test sensitivity is secondary to
frequency and turnaround time for COVID-19 screening. Science Advances. 2021 Jan 1; 7(1):
eabd5393. https://doi.org/10.1126/sciadv.abd5393 PMID: 33219112
PLOS ONE An examination of school reopening strategies
PLOS ONE | https://doi.org/10.1371/journal.pone.0251242 May 20, 2021 16 / 16