Embed Size (px)
Citation preview
University of Central Florida University of Central Florida
STARS STARS
HIM 1990-2015
2013
An examination of psychological disorders, social anxiety, and An examination of psychological disorders, social anxiety, and
perfectionism in high-achieving undergraduate students perfectionism in high-achieving undergraduate students
Amy Elliott University of Central Florida
Part of the Psychology Commons
Find similar works at: https://stars.library.ucf.edu/honorstheses1990-2015
University of Central Florida Libraries http://library.ucf.edu
This Open Access is brought to you for free and open access by STARS. It has been accepted for inclusion in HIM
1990-2015 by an authorized administrator of STARS. For more information, please contact [email protected].
Recommended Citation Recommended Citation Elliott, Amy, "An examination of psychological disorders, social anxiety, and perfectionism in high-achieving undergraduate students" (2013). HIM 1990-2015. 1398. https://stars.library.ucf.edu/honorstheses1990-2015/1398
AN EXAMINATION OF PSYCHOLOGICAL DISORDERS, SOCIAL ANXIETY, AND PERFECTIONISM IN HIGH-ACHIEVING UNDERGRADUATE STUDENTS
by
AMY L. ELLIOTT
A thesis submitted in partial fulfillment of the requirements for the Honors in the Major Program in Health Sciences
in the College of Health and Public Affairs and in The Burnett Honors College at the University of Central Florida
Orlando, Florida
Spring Term 2013
Thesis Chair: Michael J. Rovito, Ph.D.

ii
©2013 Amy L. Elliott
iii
Abstract
There is a long-standing debate on whether high-achieving students experience a better or
worse psychological well-being than their peers. This retrospective cohort study adds to the
current literature by examining the differences in rates of psychological disorders, social
anxiety, and perfectionism between high-achieving and typical undergraduate students. A
convenience sample of 357 students was gathered from the University of Central Florida (UCF).
Participants were asked to fill out a brief survey which included questions about demographics,
grade point average (GPA), social anxiety, perfectionism, enrollment in The Burnett Honors
College, inclusion in any childhood gifted programs, and diagnosis of psychological disorders.
Two groups (a High-Achieving group and a Comparison group) were formed based on GPA
scores and enrollment in The Burnett Honors College at UCF. Relative risk and chi-squared
analyses were conducted to see if there was a significant relationship between group
classification and the incidence of psychological disorders, self-injury, and social anxiety.
T-tests were used to compare group means of social anxiety and perfectionism. A statistically
significant relationship was found between group classification and the incidence of
psychological disorders, self-injury, and social anxiety (p = .033, p = .028, and p < .001). The
High-Achieving group scored significantly higher on the SPAI-23 SP Subscale (p = .032), the SPAI-
23 Difference Score (p < .001), and the APS-R Standards Subscale (p < 0.001). Altogether, the
findings of this study indicate that High-Achieving undergraduate students experience a worse
psychological well-being than their typical undergraduate student peers.

iv
Dedication
To my grandfathers, who always believed in me and loved me unconditionally. I hope this and my future research endeavors make you proud.
To my family, who encouraged me every step of the way despite my various mood changes.
Without you this would not be possible.
To my best friends, who made me take the occasional break from my writing. Thank you for keeping me sane.
v
Acknowledgements
I extend my sincerest gratitude to Dr. Michael J. Rovito, the chair of my thesis committee. Without his continual guidance and shared enthusiasm for research, this project would not be
what it is today.
I also express my deepest appreciation to my other committee members, Dr. Suha Saleh and Dr. Jeffrey Bedwell, for their unwavering patience and germane advice. Special thanks to Dr.
Saleh who kept me grounded in reality when I was starting to get carried away with my grandiose research ideas.
I also want to communicate my appreciation to The Burnett Honors College at the University of
Central Florida for creating the Honors in the Major Program.
vi
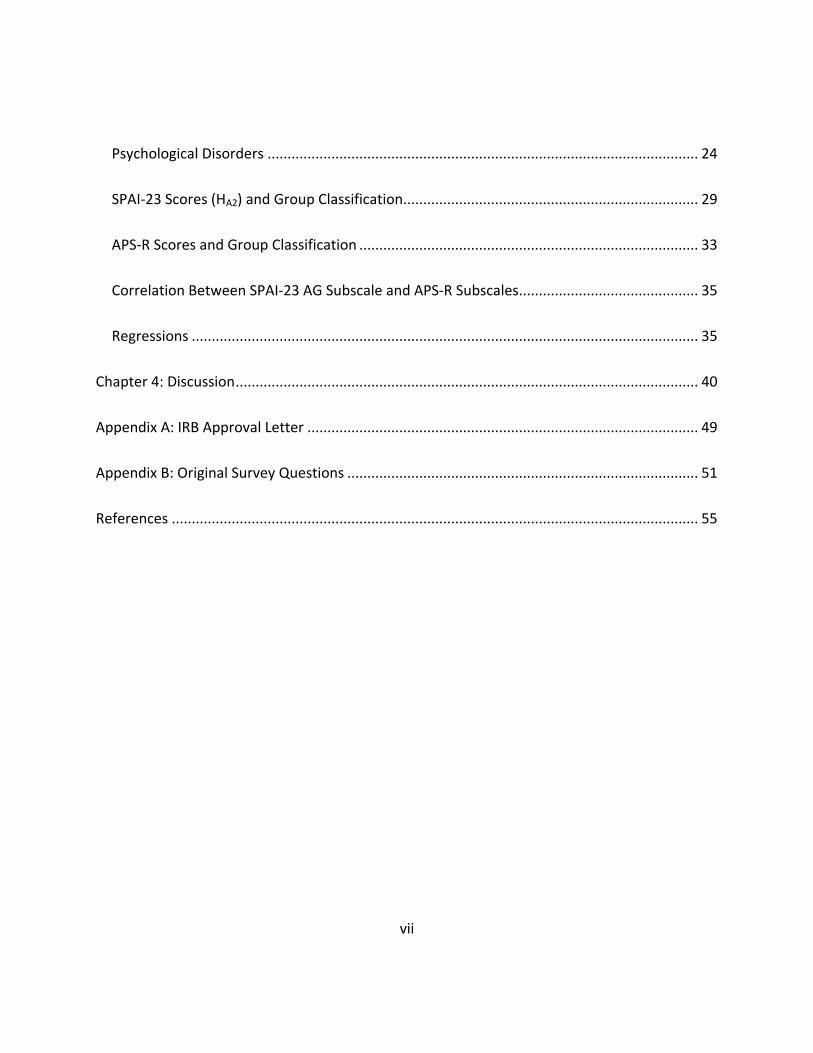
Table of Contents
Chapter 1: Introduction .................................................................................................................. 1
Gifted Learners Versus High-Achieving Students ....................................................................... 1
Mental Health in the United States ............................................................................................ 1
Mental Health of Gifted and High-Achieving Individuals ........................................................... 2
History of Research on Perfectionism ........................................................................................ 5
Gifted Learners, High-Achievers, and Perfectionism .................................................................. 7
Social Anxiety and Undergraduate Students .............................................................................. 8
Mental Health Concerns and Honors Undergraduates ............................................................ 10
Chapter 2: Methodology ............................................................................................................... 12
Study Design ............................................................................................................................. 12
Sampling Methodology ............................................................................................................. 13
Instrumentation and Measurement ......................................................................................... 15
Chapter 3: Results ......................................................................................................................... 19
Group Formation ...................................................................................................................... 19
Analysis Plan ............................................................................................................................. 21
Sample and Group Characteristics ............................................................................................ 22
vii
Psychological Disorders ............................................................................................................ 24
SPAI-23 Scores (HA2) and Group Classification.......................................................................... 29
APS-R Scores and Group Classification ..................................................................................... 33
Correlation Between SPAI-23 AG Subscale and APS-R Subscales ............................................. 35
Regressions ............................................................................................................................... 35
Chapter 4: Discussion .................................................................................................................... 40
Appendix A: IRB Approval Letter .................................................................................................. 49
Appendix B: Original Survey Questions ........................................................................................ 51
References .................................................................................................................................... 55
viii
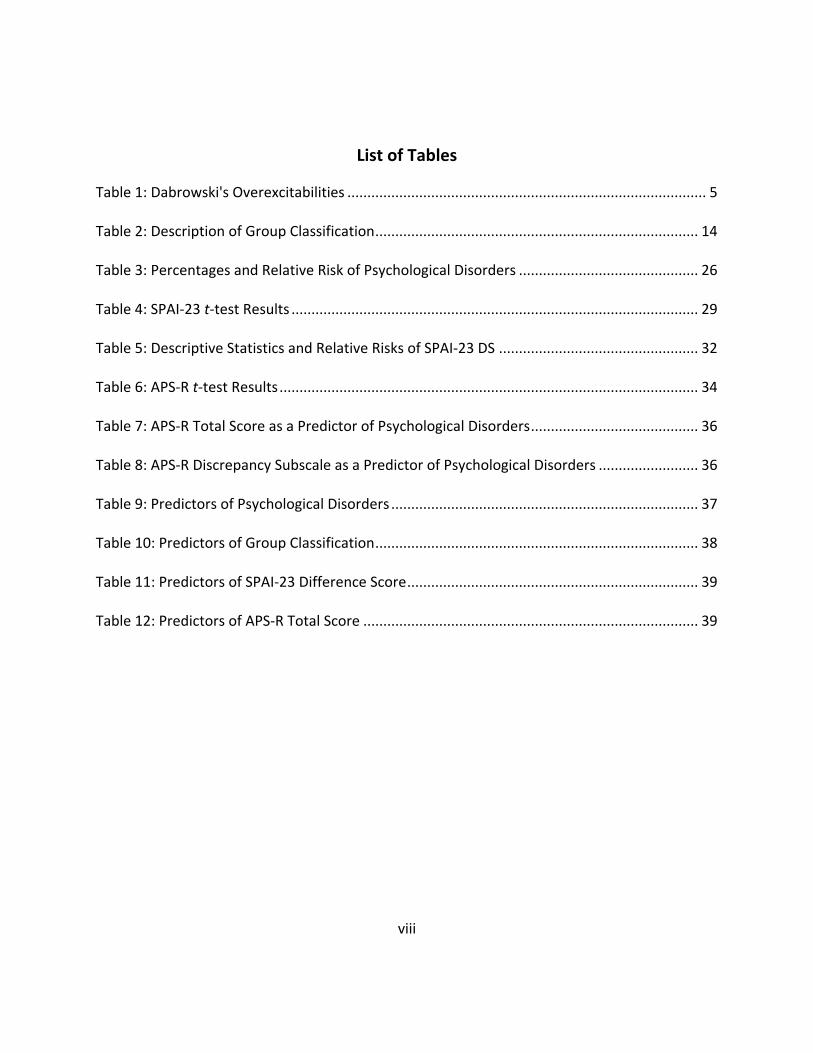
List of Tables
Table 1: Dabrowski's Overexcitabilities .......................................................................................... 5
Table 2: Description of Group Classification ................................................................................. 14
Table 3: Percentages and Relative Risk of Psychological Disorders ............................................. 26
Table 4: SPAI-23 t-test Results ...................................................................................................... 29
Table 5: Descriptive Statistics and Relative Risks of SPAI-23 DS .................................................. 32
Table 6: APS-R t-test Results ......................................................................................................... 34
Table 7: APS-R Total Score as a Predictor of Psychological Disorders .......................................... 36
Table 8: APS-R Discrepancy Subscale as a Predictor of Psychological Disorders ......................... 36
Table 9: Predictors of Psychological Disorders ............................................................................. 37
Table 10: Predictors of Group Classification ................................................................................. 38
Table 11: Predictors of SPAI-23 Difference Score ......................................................................... 39
Table 12: Predictors of APS-R Total Score .................................................................................... 39
ix
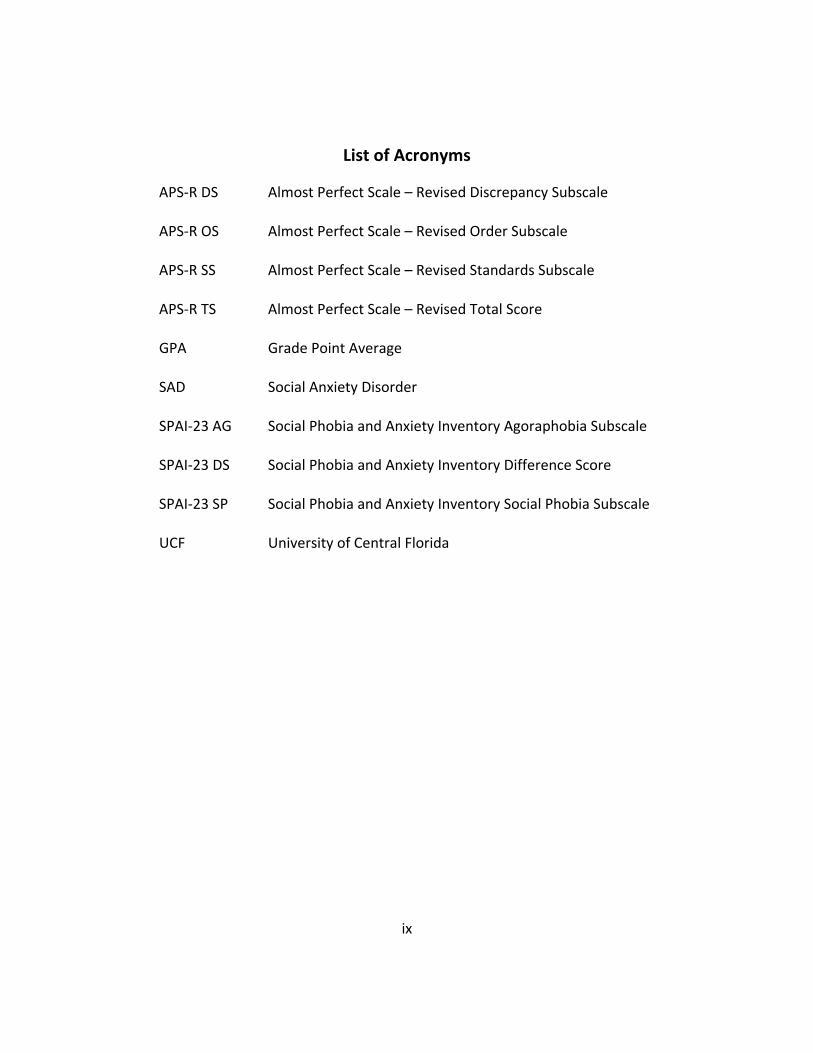
List of Acronyms
APS-R DS Almost Perfect Scale – Revised Discrepancy Subscale
APS-R OS Almost Perfect Scale – Revised Order Subscale
APS-R SS Almost Perfect Scale – Revised Standards Subscale
APS-R TS Almost Perfect Scale – Revised Total Score
GPA Grade Point Average
SAD Social Anxiety Disorder
SPAI-23 AG Social Phobia and Anxiety Inventory Agoraphobia Subscale
SPAI-23 DS Social Phobia and Anxiety Inventory Difference Score
SPAI-23 SP Social Phobia and Anxiety Inventory Social Phobia Subscale
UCF University of Central Florida
1
Chapter 1: Introduction
Gifted Learners Versus High-Achieving Students
School Honors programs are typically composed of at least two types of students: gifted
students and high-achieving students. It is important to note the difference. According to
Szabos (1989), a high-achiever generates advanced ideas whereas a gifted learner generates
complex, abstract ideas. A high-achiever works hard to achieve, memorizes well, knows the
answers, and consistently receives A’s. A gifted learner, on the other hand, knows without
having to work hard, guesses and infers well, asks the questions, and might not be motivated by
grades. High-achievers seem to prefer routine, whereas gifted learners tend to rebel against
routine. Gifted learners also tend to be self-critical, while high-achievers tend to be pleased
with their own learning. It is also important to note that many gifted individuals can share the
same qualities as high-achievers, but most high-achievers do not satisfy the criteria to be
classified as gifted.
Mental Health in the United States
According to the U.S. Department of Health and Human Services (1999), only 17% of
adults in the United States are considered to be in a state of optimal mental health. Mental
health disorders such as Major Depressive Disorder and Generalized Anxiety Disorder are chief
among the reasons that adults may experience a poor state of mental health. In any given year,
2
26% of adults and 20% of children and adolescents in the United States suffer from one or more
mental disorders (Kessler et al., 2005).
College students are certainly not exempt from mental health problems. Every year the
American College Health Association surveys thousands of undergraduate students from
around the United States and assembles an extensive report on college health trends. In 2011,
they found that 23% of female and 17% of male undergraduate students had a diagnosable
mental health condition. A little more than half of the surveyed undergraduate students
reported feeling overwhelming anxiety in the last 12 months and 13% of males and 17% of
females reported feeling hopeless in the last 2 weeks (American College Health Association,
2011). The report also showed that about 31% of undergraduates reported being so depressed
at least once in the last 12 months that it was difficult to function (American College Health
Association, 2011).
Mental Health of Gifted and High-Achieving Individuals
Do gifted/high-achieving individuals experience better psychological well-being than
their peers? Or, does giftedness/high achievement increase vulnerabilities for psychological
issues? There is a long history of research debating this topic and there is evidence to support
both sides. Some researchers claim that “the gifted are capable of greater understanding of
self and others due to their cognitive capacities and [they can] therefore cope better with
stress, conflicts, and developmental dysynchrony than their peers” (Neihart, 1999, p.1). Other
researchers claim that as a result of these increased cognitive capacities, “the gifted are more
3
sensitive to interpersonal conflicts and experience greater degrees of alienation and stress than
do their peers” (Neihart, 1999, p.1).
Most studies on the psychological well-being of gifted and high-achieving individuals
have focused on children and have shown that gifted and high-achieving children are at least as
well and possibly better adjusted than their peers (Bracken, 1980; Gallucci, 1988; Nail & Evans,
1997). Despite the literature attesting to the strengths of giftedness and high achievement in
childhood, Peterson and his team (2009) found that gifted youth admitted they felt self-
conscious and inadequate, experienced social awkwardness and social deficits, got agitated
over minor issues, let emotions build up inside, worried too much, and were too uptight.
Some evidence suggests that when compared to non-gifted peers, both gifted and high-
achieving adolescents and adults experience a greater number of psychiatric disorders and
specific psychological symptoms (Carman, 2011; Lewis et al., 1992; Suldo et al., 2008; Yadusky-
Holahan & Holahan, 1983). However, an extensive literature review by Neihart (1999) shows
that gifted individuals are a diverse population and that no conclusion on emotional well-being
can be drawn for the group as a whole. Neihart (1999) suggests that the psychological well-
being of gifted individuals is a multidimensional construct related to the age of the individual,
the type of giftedness, the educational fit, the temperament and personality of the individual,
and his/her specific life circumstances.
In 1983, Barbara Clark established an extensive list of characteristics that differentiates
gifted individuals from their non-gifted peers. She suggested that the same attributes that
4
make an individual superiorly intelligent may also create a potential for concomitant problems
such as being misunderstood by peers (as reported by Lewis et al., 1992).
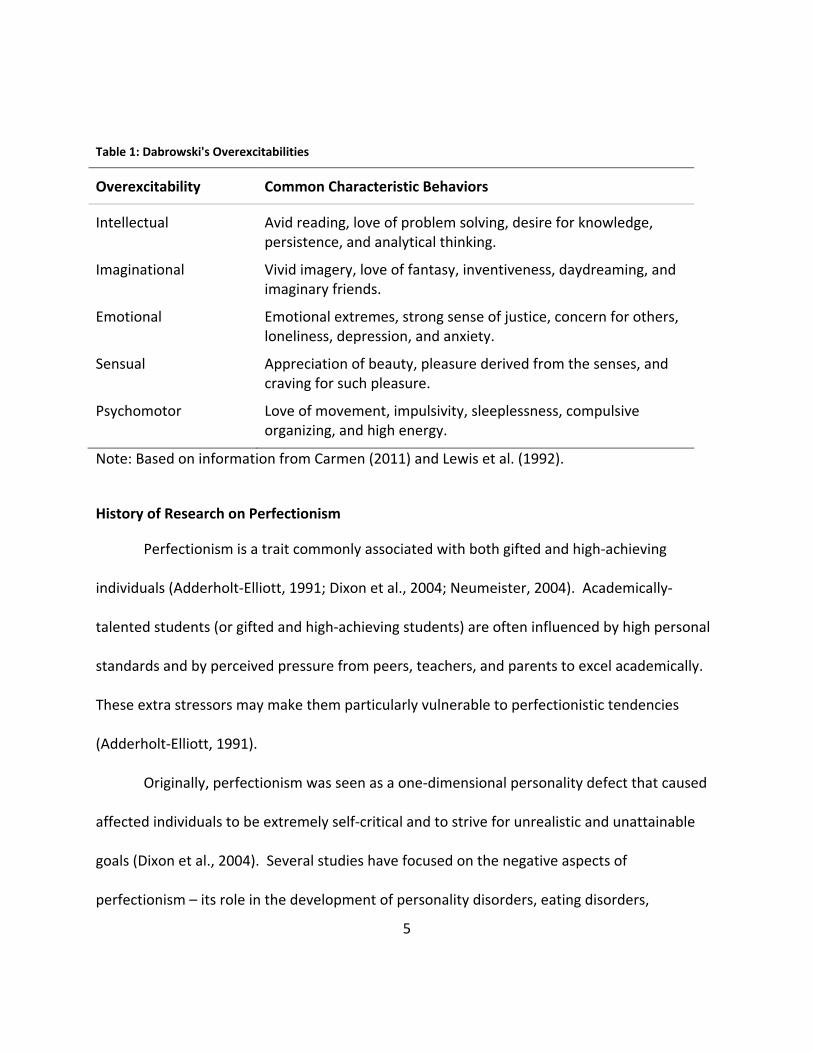
Another individual, Kazimierz Dabrowski, defined five categories of “overexcitabilities” –
intellectual, imaginational, emotional, sensual, and psychomotor (as reported by Lewis et al.,
1992; see Table 1). Overexcitability can be defined as “a greater responsiveness and intensified
sensitivity to sensory stimuli” (Carman, 2011, p. 415). Research shows that gifted individuals
consistently score higher on 4 out of the 5 overexcitabilities - all of them except psychomotor
(Lewis et al., 1992; Piechowski, 1986). Research shows that high-achieving individuals also
score higher on some overexcitabilities than their peers. Lewis and his team (1992), for
example, found that high-achieving college students often experience strong, extreme
emotions (emotional overexcitability) and often feel isolated because they believe they have to
keep these emotions in check in order to maintain positive social interactions.
5
Table 1: Dabrowski's Overexcitabilities
Overexcitability
Common Characteristic Behaviors
Intellectual
Avid reading, love of problem solving, desire for knowledge, persistence, and analytical thinking.
Imaginational Vivid imagery, love of fantasy, inventiveness, daydreaming, and imaginary friends.
Emotional Emotional extremes, strong sense of justice, concern for others, loneliness, depression, and anxiety.
Sensual Appreciation of beauty, pleasure derived from the senses, and craving for such pleasure.
Psychomotor Love of movement, impulsivity, sleeplessness, compulsive organizing, and high energy.
Note: Based on information from Carmen (2011) and Lewis et al. (1992).
History of Research on Perfectionism
Perfectionism is a trait commonly associated with both gifted and high-achieving
individuals (Adderholt-Elliott, 1991; Dixon et al., 2004; Neumeister, 2004). Academically-
talented students (or gifted and high-achieving students) are often influenced by high personal
standards and by perceived pressure from peers, teachers, and parents to excel academically.
These extra stressors may make them particularly vulnerable to perfectionistic tendencies
(Adderholt-Elliott, 1991).
Originally, perfectionism was seen as a one-dimensional personality defect that caused
affected individuals to be extremely self-critical and to strive for unrealistic and unattainable
goals (Dixon et al., 2004). Several studies have focused on the negative aspects of
perfectionism – its role in the development of personality disorders, eating disorders,
6
depression, anxiety, obsessive compulsion, negative self-esteem, etc. (Blatt, 1995; Kring et al.,
2010; Peterson et al., 2009).
Researchers have come to view perfectionism as being a multi-dimensional construct,
capable of producing both positive and negative functioning. Hamachek (1978) introduced two
different types of perfectionism: neurotic and normal. Neurotic perfectionists hold themselves
up to impossibly high standards. No matter how great their performance, they are never
satisfied with their efforts because nothing they do is ever good enough. Neurotic
perfectionists have low self-esteem and find little pleasure in life. Normal perfectionists, on the
other hand, strive for excellence and get a feeling of satisfaction from the effort they put forth.
They focus on their strengths and on organization, whereas neurotic perfectionists focus
heavily on their weaknesses and demonstrate excessive concern over making mistakes
(Hamachek, 1978). Dixon and her associates claimed that dysfunctional (or neurotic)
perfectionists are “socially detached, anxious, moody, hostile and overly competitive,” whereas
healthy (or normal) perfectionists are “agreeable and conscientious, goal-oriented, socially at
ease, well-adjusted, and not neurotic” (2004, p.97).
Hewitt and Flett (1991) further broke down dysfunctional (or neurotic) perfectionists
into two categories: self-oriented perfectionists and socially-prescribed perfectionists. Self-
oriented perfectionists set excessively high standards for themselves, whereas socially-
prescribed perfectionists perceive a pressure from significant others to live up to lofty
standards (Hewitt & Flett, 1991). Both self-oriented and socially-prescribed perfectionism have
7
been correlated with multiple mental health issues such as hypomania, depression, anxiety,
avoidant and passive-aggressive tendencies, dysthymia, and learned helplessness (Hewitt &
Flett, 1991; Neumeister, 2004).
Gifted Learners, High-Achievers, and Perfectionism
Most previous research on perfectionism in high-achieving or gifted individuals has
focused on children (Peterson et al., 2009) and adolescents (Dixon et al., 2004; Flett et al.,
2011; Peterson et al., 2009). Dixon and his associates (2004) studied a group of gifted high
school juniors and seniors. They discovered four types of perfectionism pertaining to students:
pervasive, mixed-maladaptive, mixed-adaptive, and non-perfectionist. The two maladaptive
types (pervasive and mixed-maladaptive) are important to discuss, because they were
associated with poor adjustment and mental health. Students with the pervasive type of
perfectionism were well-organized but had strong doubts about their ability to complete tasks.
Students with the mixed-maladaptive form of perfectionism were overly concerned about
making mistakes, were not well-organized, and consistently set lower standards for themselves
because they doubted their abilities. Both types complained of psychiatric problems such as
obsessive-compulsive tendencies, depression, anxiety, and somatic symptoms (Dixon et al.,
2004).
There is very little research on the relationship between perfectionism and high-
achieving undergraduate students, but one study was found (Neumeister, 2004). In agreement
with Hewitt and Flett (1991), Neumeister (2004) found that socially-prescribed perfectionists
8
held the belief that others had stringent expectations for them. From a young age, they
experienced a strong fear of disappointing others. This belief led them to think their self-worth
was based entirely on academic achievement. As a group, socially-prescribed perfectionists
strove to be perfect to avoid disappointing others and to protect their own self-image. Self-
oriented perfectionists, on the other hand, did not feel external pressures to achieve
academically. Even when their families expressed concern that they were placing themselves
under too much pressure, they continued to expect these high standards of themselves. As a
group, self-oriented perfectionists noted that their perfectionism seemed to be a sort of inborn
tendency, and they attributed most of the development of their perfectionism to having been
relatively unchallenged in school (Neumeister, 2004).
Social Anxiety and Undergraduate Students
Social Anxiety Disorder (SAD; also known as Social Phobia) has a lifetime prevalence of
about 12.1% and is defined as “a persistent, unrealistic, intense fear of social situations that
might involve being scrutinized by, or even just exposed to, unfamiliar people” (Kring et al.,
2010, p.122). Persons with Social Anxiety Disorder often feel extremely anxious in situations
where they might experience embarrassment or be negatively evaluated by others. Situations
that evoke anxious feelings include: eating in public, meeting new people, attending parties,
using public restrooms, using the telephone, giving a speech, etc. Feared situations are often
avoided altogether or endured with great anxiety and distress. Social anxiety exists on a
continuum ranging from mild shyness to severe, clinical levels. It can be limited to one specific
9
situation (such as talking on the phone), or it may affect all aspects of life. First symptoms tend
to appear during adolescence, but SAD can be found in children (Kring et al., 2010, p.123). If
left untreated, it will most likely be a chronic disorder. Social anxiety has high rates of
comorbidity and has been found to be highly correlated with perfectionism (Juster et al., 1996;
Wheeler et al., 2011). At least 1 out of every 3 people with Social Anxiety Disorder also meet
the criteria for Avoidant Personality Disorder, a more serious and pervasive disease (Chavira,
Stein, & Malcarne, 2002).
Social anxiety and avoidance often lead to functional impairments affecting one’s ability
to work, achieve educational goals, and participate in daily activities (Roberson-Nay et al.,
2007). People with Social Anxiety Disorder often work in occupations far below their talent
levels (Kring et al., 2010, p.122). They would rather work at less-rewarding jobs that have
limited social demands than work where they must face their extreme social fears on a daily
and maybe even hourly basis.
Beidel and her colleagues (1989) found that the prevalence of Social Phobia among
undergraduate college students may be as high as 19%. Social anxiety might be especially
problematic in college students because it is often hard to identify unless the student is
experiencing extreme distress. Due to the “fear of judgment,” sufferers of social anxiety may
be unlikely to seek treatment or professional help (Schry et al., 2012). Strahan (2003) reports
that social anxiety may contribute to considerable amounts of dissatisfaction and discomfort in
the overall undergraduate experience of high-achieving students. College students with social
10
anxiety are less assertive, prone to social isolation, and viewed by their peers as being much
more vulnerable to threat (Schry et al., 2012). In addition, socially-anxious undergraduates may
be likely to engage in alcohol consumption in order to decrease anxious feelings (Strahan,
2003). This can lead to very dangerous situations, including alcohol abuse and driving under
the influence.
Mental Health Concerns and Honors Undergraduates
Research shows that most lifetime mental disorders first appear before age 24 (Hunt et
al., 2009). College provides a great opportunity to identify and treat these disorders - teaching
adults successful ways to cope in the future and helping them reach their full potentials.
However, Eisenberg and his team (2007) found that less than half of undergraduate
students who tested positive for major depression or anxiety disorders received mental health
services in the previous year. Despite the fact that attitudes toward seeking mental health
treatment seem to have improved steadily in the last few years (Hunt et al., 2009), almost 30%
of undergraduate students said they would not consider seeking help from a mental health
professional even if they were really bothered by a personal problem (American College Health
Association, 2011).
High-achieving undergraduate students may be particularly at risk for mental health
problems. In addition to the evidence that they may experience a higher incidence of
psychological issues, studies have shown that even when high-achieving students are highly
distressed, they do not reveal their problems to trusted adults (Peterson & Ray, 2006).
11
Peterson (2000) found that adults are often unaware of a high-achieving student’s level of
distress because they tend to maintain high grades even during distressing life events. Equally
as troubling, Sowa and May (1997) found that gifted individuals may claim to be well-adjusted
even when their behavior shows the exact opposite. If academically-talented students hide a
problem, do not seek help for a problem, or do not even know that they have a problem, how
will they reach their optimal mental health, academic, and career potentials?
While there are a handful of studies that have focused on the mental health of
undergraduate students in general, the researchers for this thesis were unable to find any
studies that focused specifically on high-achieving undergraduate students or on the mental
health differences between high-achieving and typical undergraduate students. The present
study hopes to add to the literature by examining the presence of psychological disorders,
social anxiety, and perfectionism among high-achieving and typical undergraduate students.
12
Chapter 2: Methodology
Study Design
This study was partly designed to be a retrospective cohort study. The researchers
aimed to examine the association between a risk factor (high scholastic achievement) and the
development of a disease (psychological disorder). This was accomplished by looking at the
relationship between two different groups of undergraduate students and the incidence of
reported psychological disorders within each group. Two groups were created: a High-
Achieving group and a Comparison group (composed of typical undergraduate students).
Students were placed into these groups based upon grade point average (GPA) and enrollment
in The Burnett Honors College of the University of Central Florida (UCF). The primary research
goal was to determine if there was a significant association between psychological disorders
and high-achieving undergraduate students. The secondary research goal was to identify any
patterns of social anxiety and perfectionism in these two groups of undergraduate students.
Experimental and Null Hypotheses:
H1: There will be a statistically significant association between the UCF High-Achieving student
population and reported psychological disorders.
H0: There will be no association between UCF High-Achieving students and reported
psychological disorders.
13
Alternative Hypotheses:
Ha1: The UCF High-Achieving student population will have significantly higher rates of reported
psychological disorders than the Comparison student population.
Ha2: The UCF High-Achieving student population will have significantly higher rates of social
anxiety than the Comparison (Typical) student population.
Ha3: Perfectionism will be a statistically significant predictor of psychological disorders.
Sampling Methodology
This study was designed to determine if there is a significant association between high
scholastic achievement and psychological disorders. The sample was taken from UCF and
participants were placed into one of two groups: High-Achieving or Comparison (Typical).
Group placement was based on GPA scores and enrollment in The Burnett Honors College of
UCF. Since Honors programs are typically composed of gifted and high-achieving students, the
research team assumed everyone currently enrolled in The Burnett Honors College fit this
study’s qualifications for being in the High-Achieving group. The team also assumed, though,
that there were some high-achieving students who did not meet all of the requirements for
entrance into The Burnett Honors College when they applied to UCF. High GPA scores were
considered a measure of high-achievement in these students. For the purposes of this study, a
student was considered a high-achiever if he/she had a cumulative GPA of 3.8 or higher. This
cut-off GPA score was arbitrary.
14
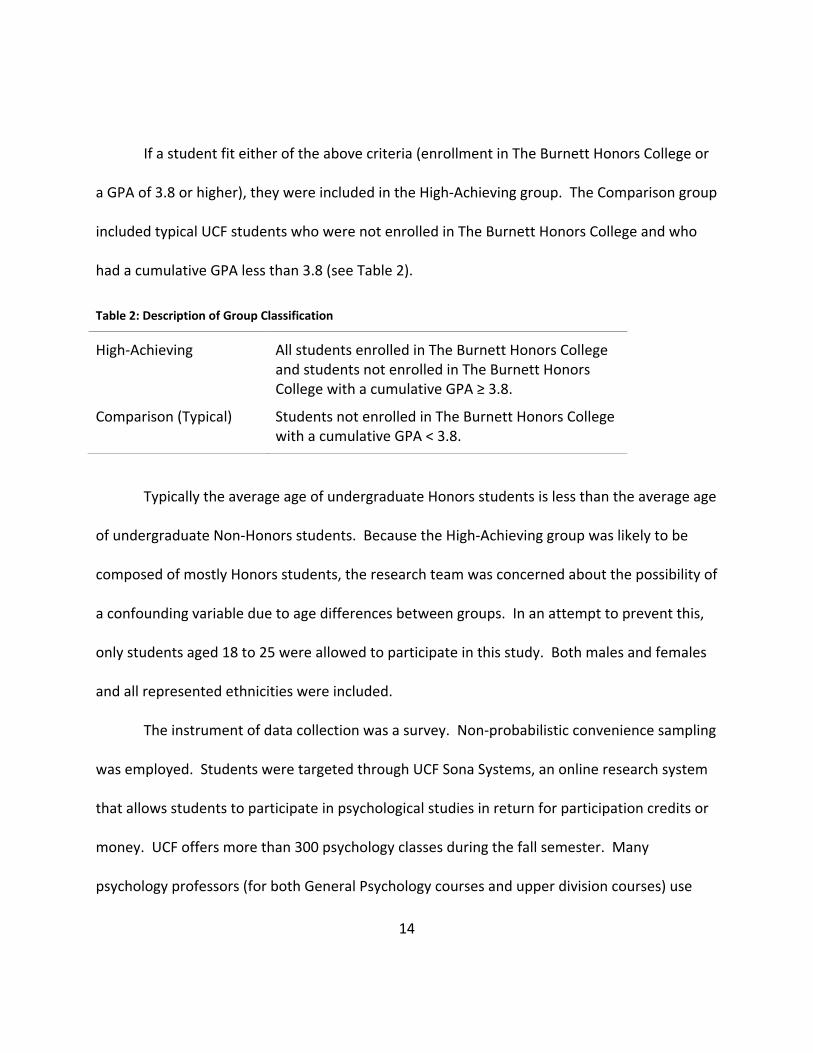
If a student fit either of the above criteria (enrollment in The Burnett Honors College or
a GPA of 3.8 or higher), they were included in the High-Achieving group. The Comparison group
included typical UCF students who were not enrolled in The Burnett Honors College and who
had a cumulative GPA less than 3.8 (see Table 2).
Table 2: Description of Group Classification
High-Achieving
All students enrolled in The Burnett Honors College and students not enrolled in The Burnett Honors College with a cumulative GPA ≥ 3.8.
Comparison (Typical) Students not enrolled in The Burnett Honors College with a cumulative GPA < 3.8.
Typically the average age of undergraduate Honors students is less than the average age
of undergraduate Non-Honors students. Because the High-Achieving group was likely to be
composed of mostly Honors students, the research team was concerned about the possibility of
a confounding variable due to age differences between groups. In an attempt to prevent this,
only students aged 18 to 25 were allowed to participate in this study. Both males and females
and all represented ethnicities were included.
The instrument of data collection was a survey. Non-probabilistic convenience sampling
was employed. Students were targeted through UCF Sona Systems, an online research system
that allows students to participate in psychological studies in return for participation credits or
money. UCF offers more than 300 psychology classes during the fall semester. Many
psychology professors (for both General Psychology courses and upper division courses) use
15
Sona Systems for “academic credit” either by requiring students to earn a certain number of
survey credits for their course or by allowing them to earn extra credit. The researchers aimed
to have at least 200 participants in each group for a total sample size of at least 400 students.
The Sona Systems sample generated plenty of students who fit the requirements for
being in the Comparison group but only 44 students who fit the requirements for being in the
High-Achieving group. The researchers decided to try to target high-achieving students by
sending out a mass e-mail to The Burnett Honors College students. All students currently
enrolled in The Burnett Honors College received two e-mails asking them to participate in a
quick survey on the differences in mental health among different groups of undergraduate
students. A link took them to Qualtrics, an online survey software system, and they typed in a
password and completed the survey (the same survey that was on Sona Systems). This process
generated an additional 74 students for the High-Achieving group.
Instrumentation and Measurement
The instrumentation of measurement for this study was a hybrid assessment tool of
original questions developed by the research team and questions from two previously-existing
and widely-accepted tools. The original questions on the survey included questions that
targeted such things as: demographics, GPA, enrollment in The Honors College, inclusion in
gifted programs, and diagnosis of psychological disorders. To see a list of the original survey
questions and the specific psychological disorders that were included in the survey, see
Appendix B.
16
Social anxiety was measured using the Social Phobia and Anxiety Inventory – 23 (SPAI-
23; Roberson-Nay, Strong, Nay, Beidel, & Turner, 2007). Permission to use the SPAI-23 was
given in person by Dr. Beidel, a professor at UCF. The SPAI-23 is a shortened version of the
original SPAI (Turner, Beidel, Dancu, & Stanley, 1989) and is a widely-used measurement of
social anxiety. It consists of 23 Likert-scale items measured on a 5-point scale ranging from
never (1 point) to always (5 points). The test can be completed and scored in under three
minutes. It includes two subscales: Social Phobia (16 items) and Agoraphobia (7 items). The
overall score (or Difference Score) is calculated by adding up the total Social Phobia points and
subtracting the total Agoraphobia points. This Difference Score was developed because
individuals with Agoraphobia may experience anxiety in some of the same situations as
individuals with SAD (Schry et al., 2012). By subtracting out scores on questions specific to
Agoraphobia, the Difference Score eliminates this potential confounding variable. Thus, the
Difference Score represents one’s true social anxiety score.
A Difference Score of 28 or higher falls above the clinical threshold and is said to be
indicative of possible Social Anxiety Disorder (Schry et al., 2012). This cut-off score has a
sensitivity of about .96 and a specificity of about .39 for detecting generalized SAD. To reach a
higher level of specificity, a cut-off score of 35 (which has a sensitivity of .92 and a specificity of
.68) is suggested (Schry et al., 2012). For the purposes of this study, it was decided to use both
of these suggested cut-off scores. Schry (2012) mentions that elevated levels of social anxiety
are associated directly with alcohol-related problems and indirectly with marijuana-related
17
problems in college students. Another study found evidence that even those with sub-
threshold forms of social anxiety experienced impaired social, occupational, and educational
functioning (Dell'Osso et al., 2003). Thus, the research team chose to focus more attention on
the lower cut-off score because it is important to indentify and treat those students with
elevated levels of social anxiety, who are likely to experience some degree of impaired
functioning without necessarily meeting the diagnostic criteria for having SAD.
When developing the SPAI-23, Roberson-Nay and her colleagues (2007) found that it
reliably discriminated Social Anxiety Disorder from other anxiety disorders and did not differ
significantly from the original SPAI which has repeatedly demonstrated strong psychometric
properties. Schry and her associates (2012) found that the SPAI-23 demonstrated relatively
strong psychometric properties itself: internal consistency for the Social Phobia and
Agoraphobia subscales exceeded .90 and .80, respectively, and test-retest reliability was found
to be between .72 and .78. The SPAI-23 has also shown convergent validity with other social
anxiety measures including: the Social Avoidance and Distress Scale (SADS), the Social
Interaction Anxiety Scale (SIAS), the Social Phobia Scale (SPS), and the Fear of Negative
Evaluation scale (FNE) (Schry et al., 2012; Roberson-Nay et al., 2007).
Perfectionism was measured using the Almost Perfect Scale-Revised (APS-R; Slaney,
Rice, Mobley, Trippi, & Ashby, 2001). The APS-R consists of 23 self-report items measured on a
7-point scale that fall into one of three subscales: High Standards (7 items), Order (4 items), and
Discrepancy (12 items). The High Standards subscale measures one’s performance
18
expectations. The Order subscale measures one’s preferences for organization and order. The
Discrepancy subscale measures the perception that one consistently fails to meet his/her goals
and expectations (Rice & Ashby, 2007). The subscales measure adaptive (high standards, order)
and maladaptive (discrepancy) perfectionism. Reliability and validity estimates are in the
moderate to high range. For example, Slaney (2001) and his colleagues found the APS-R to
have excellent convergent validity with other perfectionism scales and strong internal
consistency between .85 and .92. Rice and his associates (2007) reported test-retest reliability
scores of a 3-week interval ranging from .72 to .83 and an 8-10 week interval ranging from .76
to .87.
19
Chapter 3: Results
Group Formation
A total of 587 undergraduate students completed the survey through Sona Systems.
Psychology professors at UCF often delete a percentage of the data from participants who
complete their survey in the shortest times. This is done in order to eliminate students who
hurriedly and randomly selected answers as quickly as possible solely to receive class credit.
After the quickest 10% were deleted, 528 Sona System participants were left. Those who said
they were currently enrolled in The Burnett Honors College (19 students) were placed in the
High-Achieving group. This left 509 students in the Comparison group.
Since GPA was used as a measure of high achievement to classify students into the High-
Achieving group, the researchers were concerned that the GPAs of freshmen (who had only
been in college for one semester) were not a true representation of their future GPAs. The
“law of regression toward the mean” states that if the first measurement of a variable is
extreme, the second measurement and those thereafter will bring it closer to the true mean.
According to this law, the research team decided to eliminate all freshmen from this study. A
total of 215 students were eliminated because they were freshmen (213 students) or because
they declined to state their year in college (2 students). Another 8 students were eliminated for
putting invalid GPAs (ex: 0.32 or 0 or unknown). Of the remaining 286 students, 25 had a GPA
of 3.8 or higher and were moved to the High-Achieving group. This left a total of 261 students
in the Comparison group and only 44 students in the High-Achieving group.
20
As previously mentioned, in order to gather more High-Achieving participants, all
students enrolled in The Burnett Honors College received an e-mail asking them to participate
in a quick survey on the differences in mental health among different groups of undergraduate
students. A total of 83 students responded to the e-mail and completed the survey through
Qualtrics. Students with the 10% shortest times from this group (all High-Achieving) were not
deleted because they completed the survey without the incentive of class credit and thus had
no reason to do so if they did not want to participate. However, in order to stay consistent with
“the law of regression to the mean” that was used with the Comparison group, students who
said they were freshmen were deleted, bringing the High-Achieving group to a total of 118
students.
After further analysis, an inconsistency was found in the data from 22 participants (21
from the Comparison group and 1 from the High-Achieving group, all from the Sona Systems
sample). Qualtrics survey software allowed the use of a skip function, so students who said
they had not been diagnosed with a psychological disorder did not get to answer the next few
questions which asked if they had been diagnosed with a certain class of disorder (example: an
anxiety disorder, a mood disorder, a personality disorder, etc). Sona Systems software,
however, did not allow the use of a skip function, so students who said they had not been
diagnosed with a psychological disorder could later answer yes to the categorical questions
(stating that they did indeed have an anxiety disorder, a mood disorder, a personality disorder,
etc). Because students who had taken the survey on Qualtrics did not have the chance to later
21
say they had been diagnosed with a certain class of psychological disorder, the data from these
22 students were deleted. This led to a total sample of 357 students, with 240 students in the
Comparison group and 117 students in the High-Achieving group.
The majority of the 22 inconsistencies described above were participants who answered
they did not have a disorder and then later answered they did have an eating disorder or
Attention Deficit Disorder. The research team hypothesized that students were unaware that
these disorders were classified as psychological disorders in the study. Thus, the team
expected that the overall rates of eating disorders and Attention Deficit Disorder reported in
the total study sample were probably less than what is truly representative of the university
population.
Analysis Plan
Relative risk and chi-squared tests were executed to determine if there was a significant
relationship between group classification and psychological disorders, self-injury, and social
anxiety. T-tests were used to compare group means on social anxiety subscales and totals,
perfectionism subscales and totals, GPA, age, etc. In addition, linear regressions were
performed to determine which variables were predictors of group classification, social anxiety,
and perfectionism. The stated alpha value was 0.05. Any p-value less than 0.05 was accepted
as statistically significant.
22
Sample and Group Characteristics
Gender, Race, Age, and Group Classification
The gender, race, and age breakdowns in the High-Achieving and Comparison groups
were not significantly different from each other (X2(1, N = 355) = 1.616, p = .204; X2(7, N = 357)
= 11.882, p = .105; X2(7, N = 357) = 9.907, p = .194, respectively). For that reason, average
percentages of gender, race, and age of the overall sample were reported. Among the total
sample, 72% were female and 28% male. The racial breakdown was 62.7% Caucasian, 16.5%
Hispanic, 9.0% African American, 5.0% Asian, 3.4% Biracial or Multiracial, and 3.4% Other. At
the time of this study, the overall gender breakdown of undergraduates at UCF was 55% female
and 45% male, so females were over-represented in this sample. The racial breakdown of this
sample, however, closely mirrored UCF’s racial breakdown. The majority of students (78.3%)
fell into the “19-22 years” age range, the average age being 20.68 years (SD = 1.717).
GPA and Group Classification
An independent samples t-test was executed to see if the groups (High-Achieving and
Comparison) differed in GPA scores. The High-Achieving group (M = 3.73, SD = 0.236) had a
significantly higher average GPA than the Comparison group (M = 3.12, SD = 0.404), t(355) =
-15.132, p < .001. Since GPA was used to classify students into the High-Achieving group
(moving 25 students with a GPA ≥ 3.8 from the Comparison group to the High-Achieving group),
the researchers also examined differences in GPA based on whether or not a student was
currently enrolled in The Burnett Honors College (moving those 25 students back to the
23
Comparison group). This change in classification revealed a significantly higher High-Achieving2
group mean GPA of 3.69 (SD = 0.244) compared with a Comparison2 group mean GPA of 3.19
(SD = 0.446), t(355) = -10.231, p < .001.
Psychology Major/Minor and Group Classification
A little less than 36% of the High-Achieving group and a little more than 45% of the
Comparison group said they were majoring in Psychology. Psychology minors were much less
common. A little more than 3% of the High-Achieving group and a little less than 6% of the
Comparison group said they were getting a minor in Psychology. A total of 39.3% of the High-
Achieving group and 51.2% of the Comparison group were majoring or minoring in Psychology.
A chi-squared test of independence was used to tell if there was a relationship between Group
Classification and students majoring or minoring in Psychology. The results show that there
was a relationship, X2(1, N = 357) = 4.493, p = .034.
Giftedness and Group Classification
Participants were also asked if they had ever been placed in a gifted class. The possible
answers were “yes”, “no”, and “my school(s) did not offer gifted programs”. Approximately
two-thirds (66.7%) of the High-Achieving group and half (49.2%) of the Comparison group
answered “yes”, that they had been placed in a gifted class. About 27% of the High-Achieving
group and 42% of the Comparison group said they had never been placed in a gifted class. The
remaining students (6.0% of the High-Achieving group and 9.2% of the Comparison group) said
24
their school had not offered a gifted program. The difference in percentages was significant,
X2(2, N = 357) = 9.729, p = .008. Approximately 61% each of males and females said they had
been placed in at least one gifted class while growing up, so there was no difference between
genders.
Psychological Disorders
Disorders and Group Classification (H1 and HA1)
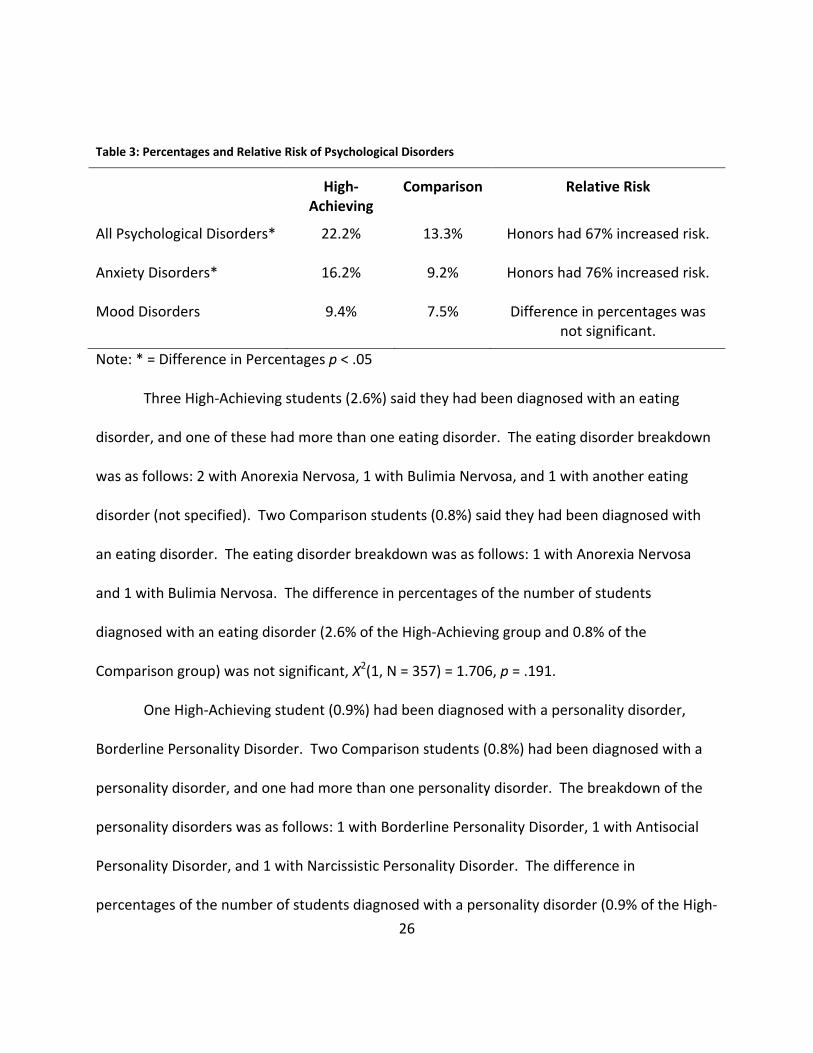
A total of 26 out of 117 High-Achieving students (22.2%) and 32 out of 240 Comparison
students (13.3%) reported having been diagnosed with a psychological disorder. This difference
in percentages between the two groups was significant, X2(1, N = 357) = 4.567, r(355) = .113,
p = .033. A relative risk assessment showed that High-Achieving students had a 67% increased
risk of developing a psychological disorder (see Table 3).
Among the High-Achieving group, 73% of those diagnosed with at least one disorder had
an anxiety disorder. Among the Comparison group, 68.8% of those diagnosed with at least one
disorder had an anxiety disorder. Nineteen High-Achieving students (16.2%) indicated they had
an anxiety disorder and 7 of the 19 students indicated they had more than one anxiety
disorder. The anxiety disorder breakdown was as follows: 14 with Generalized Anxiety
Disorder, 5 with Obsessive Compulsive Disorder, 2 with Post Traumatic Stress Disorder, 1 with
Panic Disorder, 4 with Social Phobia (Social Anxiety Disorder), and 2 with Specific Phobia.
Twenty-two Comparison students (9.2%) indicated that they had an anxiety disorder and 7 of
the 22 students indicated that they had more than one anxiety disorder. The anxiety disorder
25
breakdown was as follows: 14 with Generalized Anxiety Disorder, 4 with Obsessive Compulsive
Disorder, 5 with Post Traumatic Stress Disorder, 4 with Panic Disorder, 3 with Social Phobia
(Social Anxiety Disorder), and 1 with Specific Phobia. The difference in percentages of the
number of students diagnosed with an anxiety disorder (16.2% of the High-Achieving group and
9.2% of the Comparison group) was significant, X2(1, N = 357) = 3.870, p = .049. High-Achieving
students had a 76% increased risk of developing an Anxiety Disorder (see Table 3).
Eleven High-Achieving students (9.4%) said they had been diagnosed with a mood
disorder and 2 of those 11 students had been diagnosed with more than one mood disorder.
The mood disorder breakdown was as follows: 2 with Bipolar I Disorder, 3 with Bipolar II
Disorder, 2 with Dysthymic Disorder, and 6 with Major Depressive Disorder. Eighteen
Comparison students (7.5%) said they had been diagnosed with a mood disorder and 2 of those
18 students had been diagnosed with more than one mood disorder. The mood disorder
breakdown was as follows: 3 with Bipolar I Disorder, 1 with Bipolar II Disorder, 1 with
Dysthymic Disorder, and 15 with Major Depressive Disorder. The difference in percentages of
the number of students diagnosed with a mood disorder (9.4% of the High-Achieving group and
7.5% of the Comparison group) was not significant, X2(1, N = 357) = 0.381, p = .537.
26
Table 3: Percentages and Relative Risk of Psychological Disorders
High-Achieving
Comparison
Relative Risk
All Psychological Disorders* 22.2% 13.3% Honors had 67% increased risk.
Anxiety Disorders* 16.2% 9.2% Honors had 76% increased risk.
Mood Disorders 9.4% 7.5% Difference in percentages was not significant.
Note: * = Difference in Percentages p < .05
Three High-Achieving students (2.6%) said they had been diagnosed with an eating
disorder, and one of these had more than one eating disorder. The eating disorder breakdown
was as follows: 2 with Anorexia Nervosa, 1 with Bulimia Nervosa, and 1 with another eating
disorder (not specified). Two Comparison students (0.8%) said they had been diagnosed with
an eating disorder. The eating disorder breakdown was as follows: 1 with Anorexia Nervosa
and 1 with Bulimia Nervosa. The difference in percentages of the number of students
diagnosed with an eating disorder (2.6% of the High-Achieving group and 0.8% of the
Comparison group) was not significant, X2(1, N = 357) = 1.706, p = .191.
One High-Achieving student (0.9%) had been diagnosed with a personality disorder,
Borderline Personality Disorder. Two Comparison students (0.8%) had been diagnosed with a
personality disorder, and one had more than one personality disorder. The breakdown of the
personality disorders was as follows: 1 with Borderline Personality Disorder, 1 with Antisocial
Personality Disorder, and 1 with Narcissistic Personality Disorder. The difference in
percentages of the number of students diagnosed with a personality disorder (0.9% of the High-
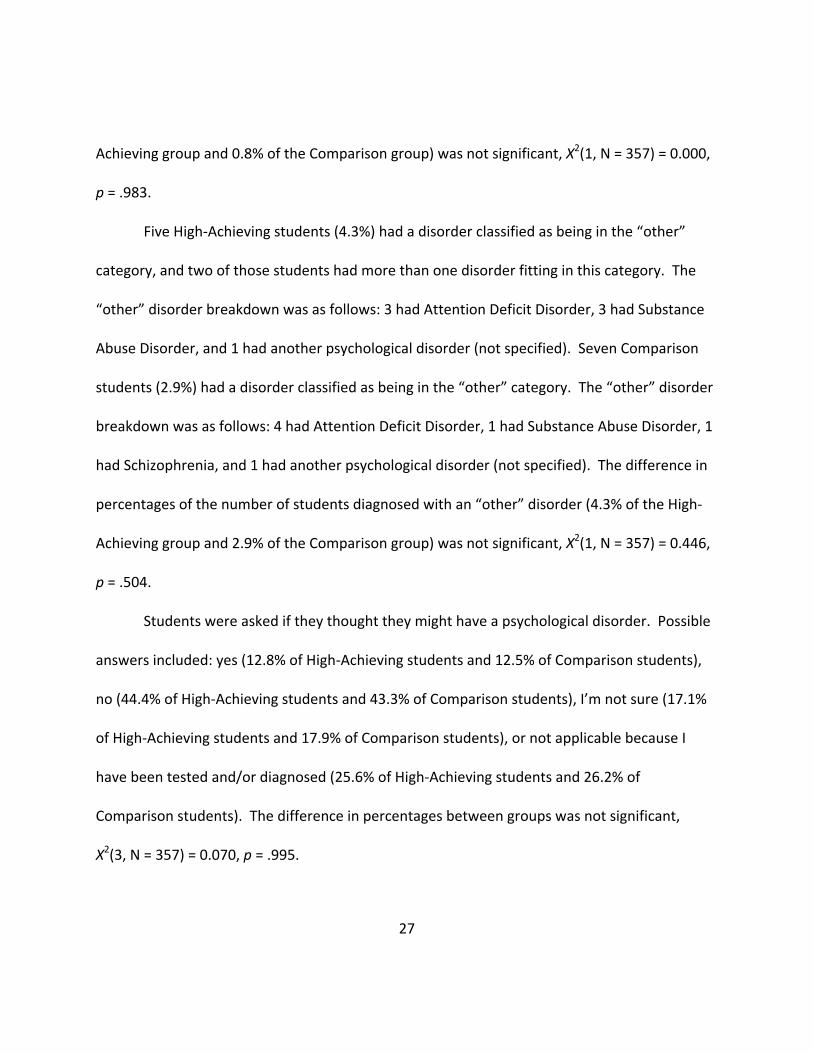
27
Achieving group and 0.8% of the Comparison group) was not significant, X2(1, N = 357) = 0.000,
p = .983.
Five High-Achieving students (4.3%) had a disorder classified as being in the “other”
category, and two of those students had more than one disorder fitting in this category. The
“other” disorder breakdown was as follows: 3 had Attention Deficit Disorder, 3 had Substance
Abuse Disorder, and 1 had another psychological disorder (not specified). Seven Comparison
students (2.9%) had a disorder classified as being in the “other” category. The “other” disorder
breakdown was as follows: 4 had Attention Deficit Disorder, 1 had Substance Abuse Disorder, 1
had Schizophrenia, and 1 had another psychological disorder (not specified). The difference in
percentages of the number of students diagnosed with an “other” disorder (4.3% of the High-
Achieving group and 2.9% of the Comparison group) was not significant, X2(1, N = 357) = 0.446,
p = .504.
Students were asked if they thought they might have a psychological disorder. Possible
answers included: yes (12.8% of High-Achieving students and 12.5% of Comparison students),
no (44.4% of High-Achieving students and 43.3% of Comparison students), I’m not sure (17.1%
of High-Achieving students and 17.9% of Comparison students), or not applicable because I
have been tested and/or diagnosed (25.6% of High-Achieving students and 26.2% of
Comparison students). The difference in percentages between groups was not significant,
X2(3, N = 357) = 0.070, p = .995.
28
Giftedness, Gender, and Psychological Disorders
A chi-squared test was used to determine whether there was a relationship between
giftedness and diagnosis. The data for those who said their school(s) had not offered gifted
programs was removed. Results showed that there was no relationship between giftedness
and diagnosis, X2(1, N = 310) = 0.027, p = .870. A chi-squared test was also run to see if there
was a relationship between gender and diagnosis of a psychological disorder. Two participants
declined to share their gender, so their data was removed from this test. A little over 19% of
females and 9% of males stated they had been diagnosed with a disorder. This 10% difference
was significant, X2(1, N = 355) = 5.069, p = .024, so the research team concluded that there was
a relationship between gender and diagnosis of a psychological disorder.
Self-Injury, Psychological Disorders, and Group Classification
Participants were also asked if they had ever hurt themselves on purpose (cutting,
burning, etc.). The purpose of this question was to measure rates of self-injury. A total of
29.1% of the High-Achieving group and 18.8% of the Comparison group admitted to at least one
incidence of self-injury. A chi-squared test of independence was run and it was determined
that this 10.3% difference was significant, X2(1, N = 357) = 4.852, r(355) = .121, p = .028. High-
Achieving students had a 58% increased risk of self-injury. As expected, self-injury was
correlated (although only weakly) with the diagnosis of a psychological disorder, r(355) = .281,
p < .001. Specifically, it was correlated with the diagnosis of a mood disorder, r(355) = .264,
p < .001, and the diagnosis of an anxiety disorder, r(355) = .213, p < .001.
29
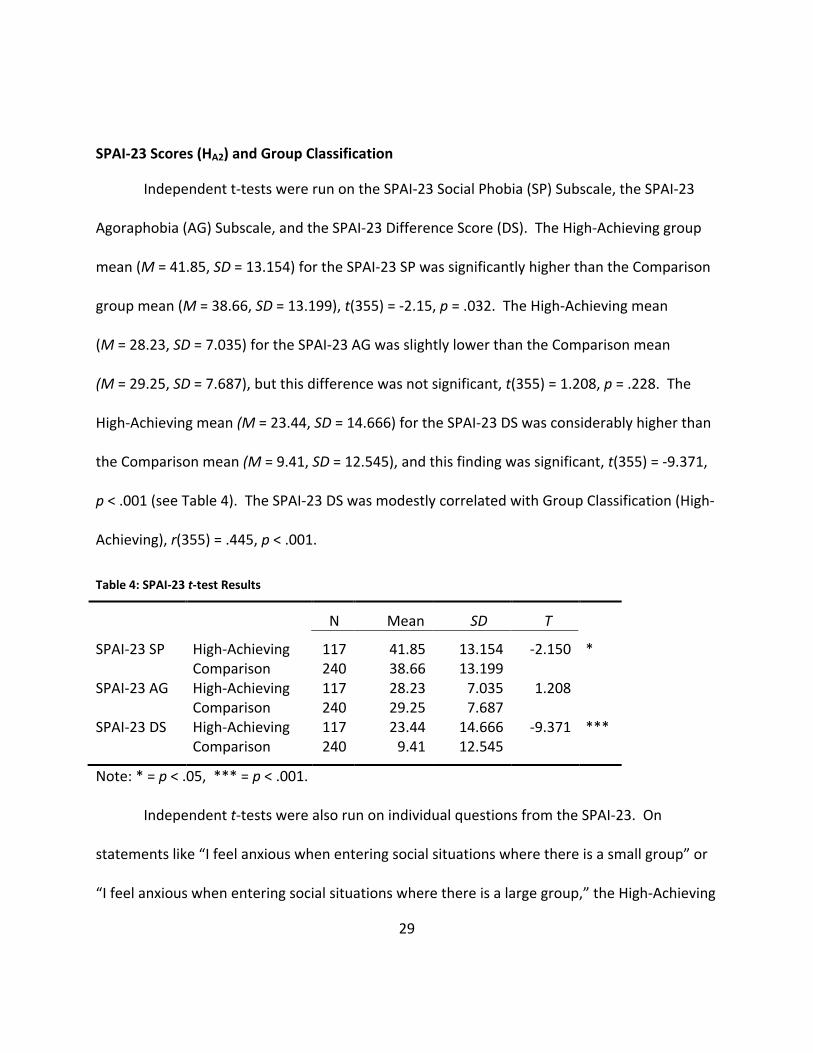
SPAI-23 Scores (HA2) and Group Classification
Independent t-tests were run on the SPAI-23 Social Phobia (SP) Subscale, the SPAI-23
Agoraphobia (AG) Subscale, and the SPAI-23 Difference Score (DS). The High-Achieving group
mean (M = 41.85, SD = 13.154) for the SPAI-23 SP was significantly higher than the Comparison
group mean (M = 38.66, SD = 13.199), t(355) = -2.15, p = .032. The High-Achieving mean
(M = 28.23, SD = 7.035) for the SPAI-23 AG was slightly lower than the Comparison mean
(M = 29.25, SD = 7.687), but this difference was not significant, t(355) = 1.208, p = .228. The
High-Achieving mean (M = 23.44, SD = 14.666) for the SPAI-23 DS was considerably higher than
the Comparison mean (M = 9.41, SD = 12.545), and this finding was significant, t(355) = -9.371,
p < .001 (see Table 4). The SPAI-23 DS was modestly correlated with Group Classification (High-
Achieving), r(355) = .445, p < .001.
Table 4: SPAI-23 t-test Results
N
Mean
SD
T
SPAI-23 SP
High-Achieving Comparison
117 240
41.85 38.66
13.154 13.199
-2.150
*
SPAI-23 AG High-Achieving Comparison
117 240
28.23 29.25
7.035 7.687
1.208
SPAI-23 DS High-Achieving Comparison
117 240
23.44 9.41
14.666 12.545
-9.371 ***
Note: * = p < .05, *** = p < .001.
Independent t-tests were also run on individual questions from the SPAI-23. On
statements like “I feel anxious when entering social situations where there is a small group” or
“I feel anxious when entering social situations where there is a large group,” the High-Achieving
30
mean scores (M = 2.50, SD = 0.970 and M = 2.93, SD = 1.165) were significantly higher than the
Comparison mean scores (M = 2.10, SD = 0.935 and M = 2.52, SD = 1.131), t(355) = -3.747,
p < .001 and t(355) = -3.221, p = .001.
In response to the statement “I feel anxious and I do not know what to do when in a
new situation with other people,” the High-Achieving group (M = 2.91, SD = 1.126) had a higher
mean than the Comparison group (M = 2.53, SD = 1.086) and this finding was significant,
t(355) = -3.076, p = .002. Also, in response to a statement about feeling anxious when
approaching or initiating a conversation with others, the High-Achieving group (M = 2.80,
SD = 1.011) had a significantly higher mean than the Comparison group (M = 2.45, SD = 1.074),
t(355) = -2.940, p = .003. On a statement about making a speech in front of an audience,
however, both groups had relatively high mean scores (High-Achieving: M = 3.44, SD = 1.234
and Comparison: M = 3.51, SD = 1.217), but the differences in mean scores were not significant,
t(355) = .525, p = .600.
Social Anxiety Disorder Cut-off Scores
The amount of students who said they had been diagnosed with Social Anxiety Disorder
in each group (4 in the High-Achieving group and 3 in the Comparison group) was not
significantly different, X2(1, N = 357) = 1.925, p = .165.
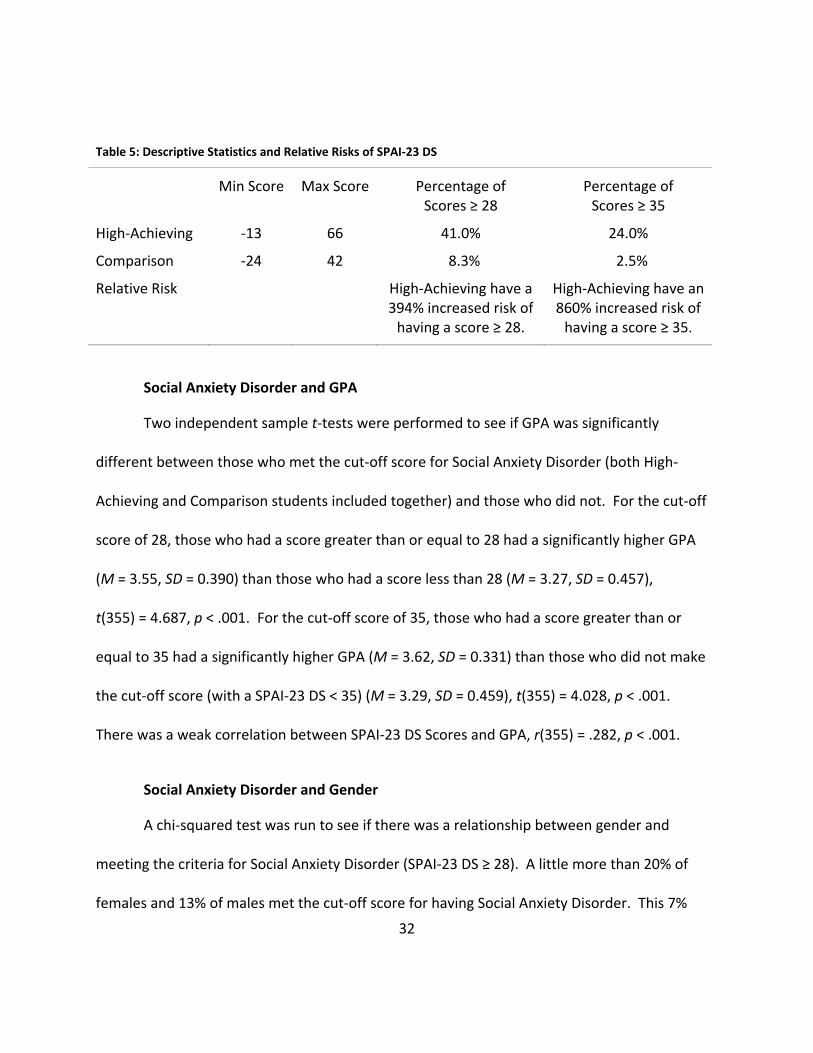
The research team ran an analysis to see how many students from each group met the
suggested SPAI-23 cut-off score (a DS of 28 or higher) for having Social Anxiety Disorder. A total
of 48 out of 117 High-Achieving students (41% of the group) met the cut-off score for having
31
Social Anxiety Disorder (see Table 5). Only four of those 48 said they had been diagnosed, so
that left 44 out of 117 students (38% of the total High-Achieving sample) undiagnosed. A total
of 20 out of 240 Comparison students (8.3% of the group) met the cut-off score for having
Social Anxiety Disorder. Three Comparison students said they had been diagnosed with Social
Anxiety Disorder, but one of these did not meet the cut-off score. That left 18 out of 240
Comparison students (7.5% of the total Comparison sample) as undiagnosed. Approximately
91% of students who met the cut-off score of 28 did not report being diagnosed with Social
Anxiety Disorder. The difference in percentages of students who met the cut-off score of 28 for
Social Anxiety Disorder (41% of the High-Achieving sample and 8.3% of the Comparison sample)
was significant, X2(1, N = 357) = 54.519, p < .001. Group classification and meeting the cut-off
of 28 for having Social Anxiety Disorder were moderately correlated, r(355) = .391, p < .001.
An analysis was also run to see how many students from each group met a secondary
suggested SPAI-23 cut-off score (a DS of 35 or higher) for having Social Anxiety Disorder. A total
of 28 out of 117 High-Achieving students (or 24% of the group) and a total of 6 out of 240
Comparison students (or 2.5% of the group) met this cut-off score for having Social Anxiety
Disorder (see Table 5). The difference in percentages meeting the cut-off score of 35 for Social
Anxiety Disorder was significant, X2(1, N = 357) = 41.927, p < .001.
32
Table 5: Descriptive Statistics and Relative Risks of SPAI-23 DS
Min Score
Max Score
Percentage of Scores ≥ 28
Percentage of Scores ≥ 35
High-Achieving
-13 66 41.0% 24.0%
Comparison -24 42 8.3% 2.5%
Relative Risk High-Achieving have a 394% increased risk of
having a score ≥ 28.
High-Achieving have an 860% increased risk of
having a score ≥ 35.
Social Anxiety Disorder and GPA
Two independent sample t-tests were performed to see if GPA was significantly
different between those who met the cut-off score for Social Anxiety Disorder (both High-
Achieving and Comparison students included together) and those who did not. For the cut-off
score of 28, those who had a score greater than or equal to 28 had a significantly higher GPA
(M = 3.55, SD = 0.390) than those who had a score less than 28 (M = 3.27, SD = 0.457),
t(355) = 4.687, p < .001. For the cut-off score of 35, those who had a score greater than or
equal to 35 had a significantly higher GPA (M = 3.62, SD = 0.331) than those who did not make
the cut-off score (with a SPAI-23 DS < 35) (M = 3.29, SD = 0.459), t(355) = 4.028, p < .001.
There was a weak correlation between SPAI-23 DS Scores and GPA, r(355) = .282, p < .001.
Social Anxiety Disorder and Gender
A chi-squared test was run to see if there was a relationship between gender and
meeting the criteria for Social Anxiety Disorder (SPAI-23 DS ≥ 28). A little more than 20% of
females and 13% of males met the cut-off score for having Social Anxiety Disorder. This 7%
33
difference was not significant, and the researchers concluded that there was no relationship
between gender and meeting the criteria for Social Anxiety Disorder, X2(1, N = 355) = 2.537,
p = .111.
APS-R Scores and Group Classification
Independent t-tests were run on the APS-R Total Scores (TS), the APS-R Standards
Subscale Scores (SS), the APS-R Order Subscale Scores (OS), and the APS-R Discrepancy Subscale
Scores (DS). The High-Achieving group mean (M = 105.81, SD = 16.631) for the APS-R TS was
lower than the Comparison group mean (M = 107.39, SD = 18.360), but the finding was not
significant, t(355) = 0.784, p = .433. The High-Achieving mean (M = 43.88, SD = 4.410) for the
APS-R SS was significantly higher than the Comparison mean (M = 41.53, SD = 5.968),
t(355) = -3.793, p < 0.001. The High-Achieving mean (M = 20.94, SD = 4.685) for the APS-R OS
was slightly lower than the Comparison mean (M = 21.37, SD = 4.730), but this finding was not
significant, t(355) = 0.810, p = 0.418. The High-Achieving mean (M = 40.99, SD = 15.472) for the
APS-R DS was slightly lower than the Comparison mean (M = 44.49, SD = 16.111), but this
finding was slightly insignificant, t(355) = 1.952, p = 0.052 (see Table 6).
34
Table 6: APS-R t-test Results
N
Mean
SD
t
APS-R TS
High-Achieving Comparison
117 240
105.81 107.39
16.631 18.360
0.784
APS-R SS High-Achieving Comparison
117 240
43.88 41.53
4.410 5.968
-3.793 ***
APS-R OS High-Achieving Comparison
117 240
20.94 21.37
4.685 4.730
0.810
APS-R DS High-Achieving Comparison
117 240
40.99 44.49
15.472 16.111
1.952
Note: *** = p < .001.
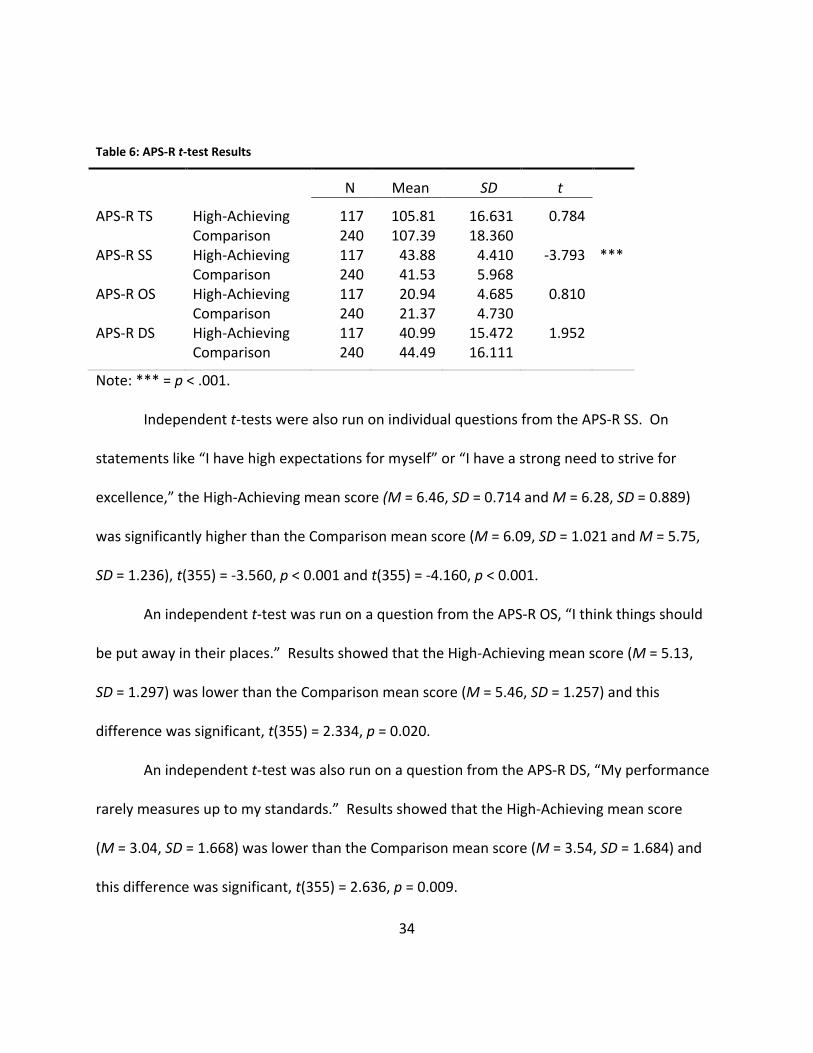
Independent t-tests were also run on individual questions from the APS-R SS. On
statements like “I have high expectations for myself” or “I have a strong need to strive for
excellence,” the High-Achieving mean score (M = 6.46, SD = 0.714 and M = 6.28, SD = 0.889)
was significantly higher than the Comparison mean score (M = 6.09, SD = 1.021 and M = 5.75,
SD = 1.236), t(355) = -3.560, p < 0.001 and t(355) = -4.160, p < 0.001.
An independent t-test was run on a question from the APS-R OS, “I think things should
be put away in their places.” Results showed that the High-Achieving mean score (M = 5.13,
SD = 1.297) was lower than the Comparison mean score (M = 5.46, SD = 1.257) and this
difference was significant, t(355) = 2.334, p = 0.020.
An independent t-test was also run on a question from the APS-R DS, “My performance
rarely measures up to my standards.” Results showed that the High-Achieving mean score
(M = 3.04, SD = 1.668) was lower than the Comparison mean score (M = 3.54, SD = 1.684) and
this difference was significant, t(355) = 2.636, p = 0.009.
35
Correlation Between SPAI-23 AG Subscale and APS-R Subscales
While running statistical tests, the research team discovered that two seemingly
unrelated subscales (the SPAI-23 Agoraphobia Subscale and the APS-R Discrepancy Subscale)
were very highly correlated. The SPAI-23 AG was very strongly correlated with the APS-R TS
and the APS-R DS, r(355) = .894, p < .001 and r(355) = .910, p < .001. However, the SPAI-23 AG
was only weakly correlated with the APS-R SS score, r(355) = .192, p < .001. These findings
could have interesting implications for further research in trying to understand the relationship
between Agoraphobia and the discrepancy aspect of perfectionism.
Regressions
Several exploratory linear regression analyses were employed to see if certain variables
were significant predictors of Psychological Disorders, Group Classification, SPAI-23 DS, and
APS-R TS.
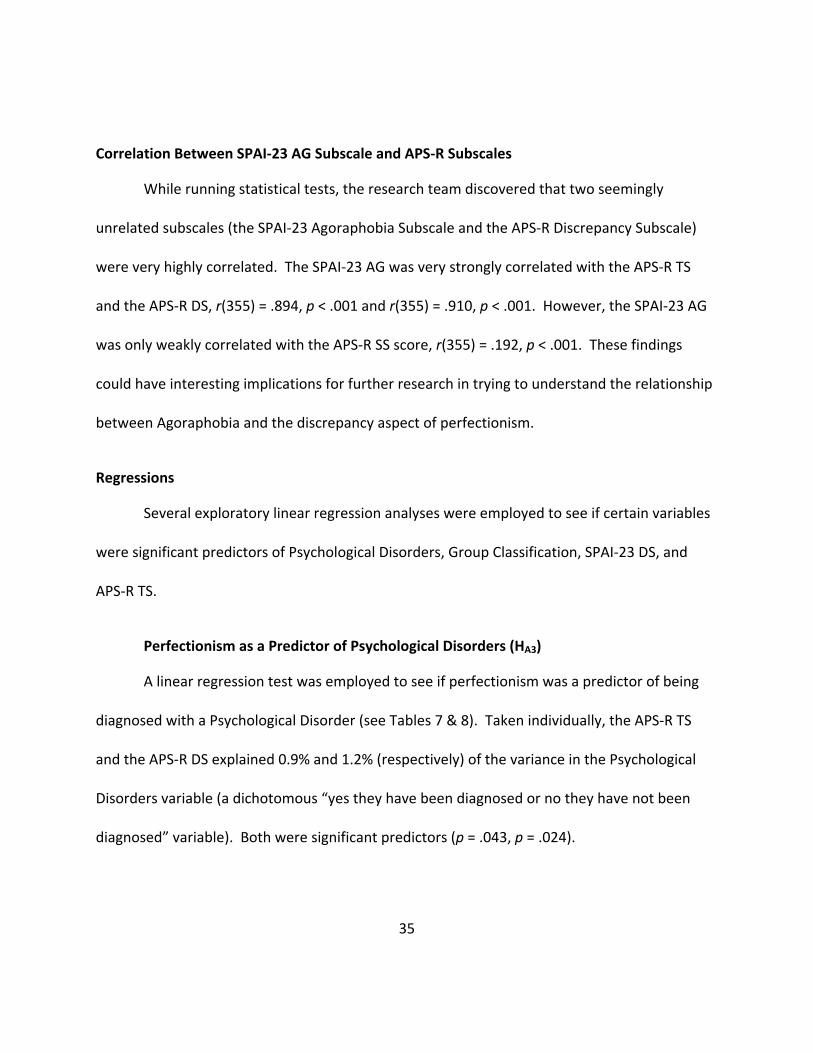
Perfectionism as a Predictor of Psychological Disorders (HA3)
A linear regression test was employed to see if perfectionism was a predictor of being
diagnosed with a Psychological Disorder (see Tables 7 & 8). Taken individually, the APS-R TS
and the APS-R DS explained 0.9% and 1.2% (respectively) of the variance in the Psychological
Disorders variable (a dichotomous “yes they have been diagnosed or no they have not been
diagnosed” variable). Both were significant predictors (p = .043, p = .024).
36
Table 7: APS-R Total Score as a Predictor of Psychological Disorders
Unstandardized Coefficients
Standardized Coefficients
t Sig.
B Std. Error Beta
(Constant) -.076 .119
-.638 .524
APS-R TS .002 .001 .107 2.036 .043 Note: R2 = .012 and Adjusted R2 = .009
Table 8: APS-R Discrepancy Subscale as a Predictor of Psychological Disorders
Unstandardized Coefficients
Standardized Coefficients
t Sig.
B Std. Error Beta
(Constant) .043 .056
.757 .450
APS-R DS .003 .001 .120 2.269 .024 Note: R2 = .014 and Adjusted R2 = .012
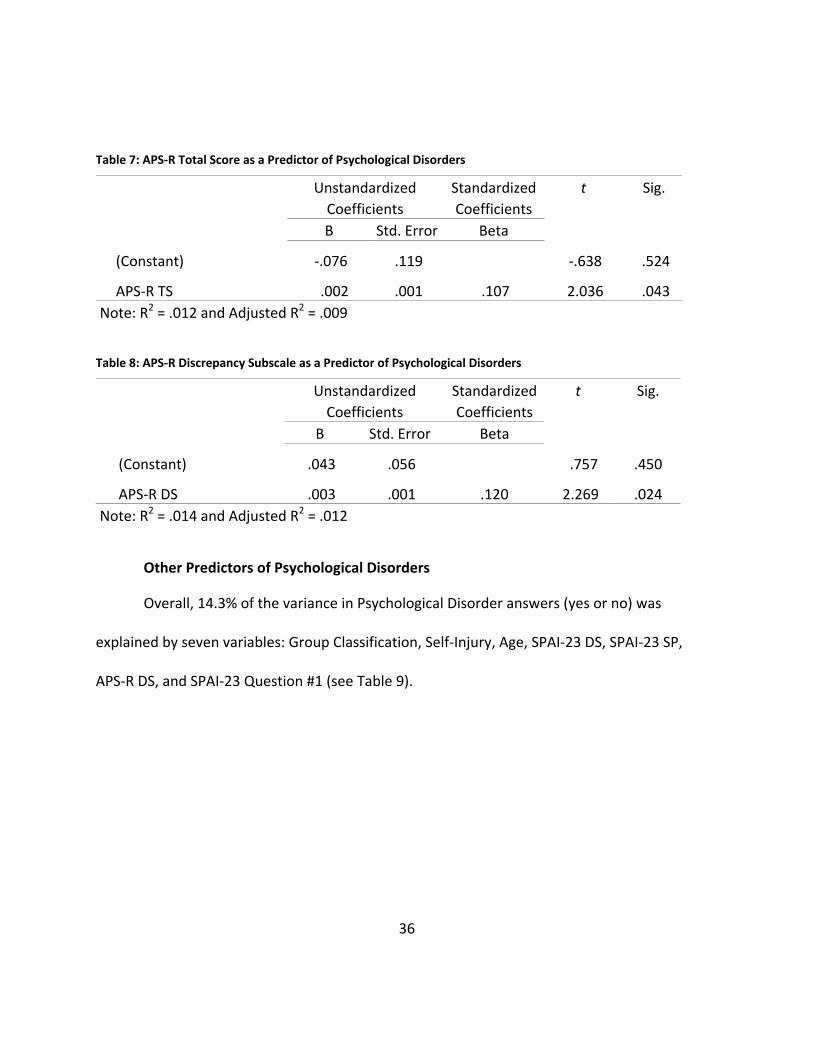
Other Predictors of Psychological Disorders
Overall, 14.3% of the variance in Psychological Disorder answers (yes or no) was
explained by seven variables: Group Classification, Self-Injury, Age, SPAI-23 DS, SPAI-23 SP,
APS-R DS, and SPAI-23 Question #1 (see Table 9).
37
Table 9: Predictors of Psychological Disorders
Unstandardized Coefficients
Standardized Coefficients
t Sig.
B Std. Error Beta
(Constant) -.648 .237
-2.731 .007
SPAI-23 DS -.009 .003 -.367 -3.062 .002 Group Classification .140 .050 .178 2.824 .005 Self-Injury .171 .047 .191 3.650 .000 APS-R DS -.002 .002 -.105 -1.534 .126 SPAI-23 SP .013 .003 .450 3.589 .000 SPAI-23 Question 1 .035 .031 .090 1.102 .271 Age .019 .011 .087 1.756 .080
Note: R2 = .159 and Adjusted R2 = .143
Predictors of Group Classification
A linear regression test was used to see which variables could significantly predict a
participant’s Group Classification (High-Achieving or Comparison). The results of the regression
indicated that six predictors, the APS-R Order Subscale, the APS-R Standards Subscale, the
SPAI-23 DS, the SPAI-23 AG, the SPAI-23 SP, and GPA explained 59.6% of the variance (see Table
10).
38
Table 10: Predictors of Group Classification
Unstandardized Coefficients
Standardized Coefficients
t Sig.
B Std. Error Beta
(Constant) -1.306 .175
-7.471 .000
APS-R OS -.009 .004 -.093 -2.537 .012 APS-R SS .008 .003 .091 2.319 .021 SPAI-23 DS .031 .002 .962 12.950 .000 SPAI-23 AG .024 .003 .381 7.905 .000 SPAI-23 SP -.026 .003 -.728 -9.964 .000 GPA .426 .039 .415 10.804 .000
Note: R2 = .603 and Adjusted R2 = .596
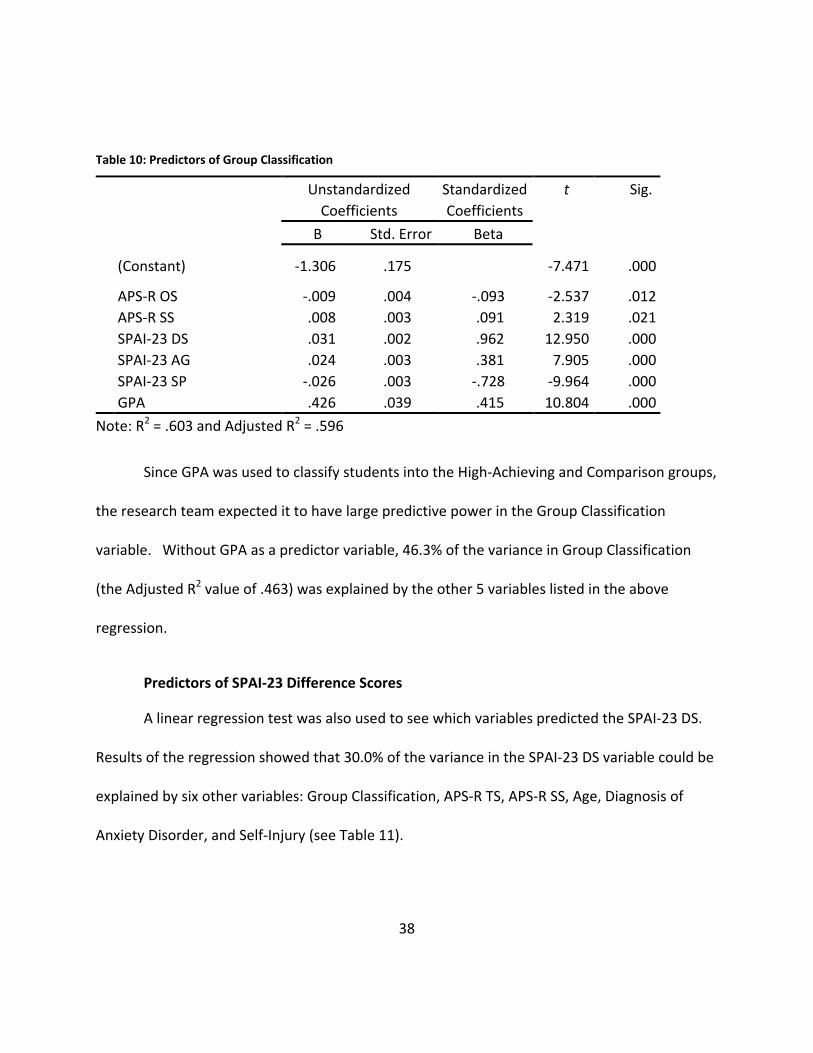
Since GPA was used to classify students into the High-Achieving and Comparison groups,
the research team expected it to have large predictive power in the Group Classification
variable. Without GPA as a predictor variable, 46.3% of the variance in Group Classification
(the Adjusted R2 value of .463) was explained by the other 5 variables listed in the above
regression.
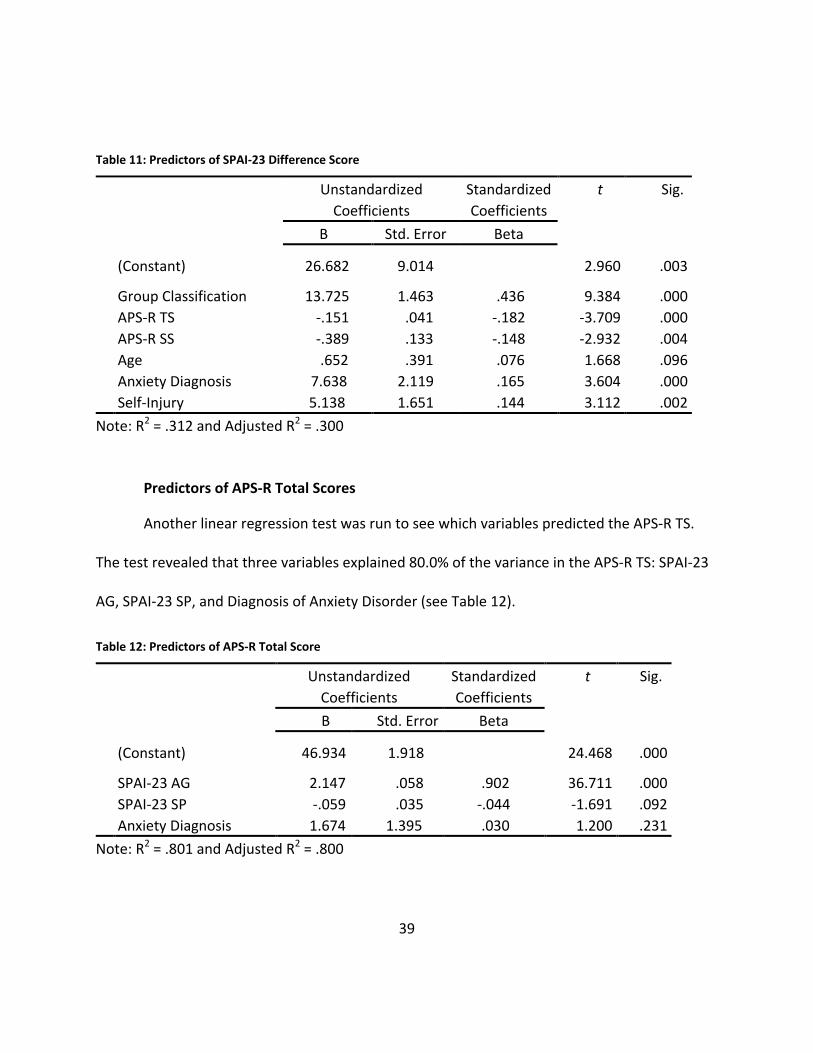
Predictors of SPAI-23 Difference Scores
A linear regression test was also used to see which variables predicted the SPAI-23 DS.
Results of the regression showed that 30.0% of the variance in the SPAI-23 DS variable could be
explained by six other variables: Group Classification, APS-R TS, APS-R SS, Age, Diagnosis of
Anxiety Disorder, and Self-Injury (see Table 11).
39
Table 11: Predictors of SPAI-23 Difference Score
Unstandardized Coefficients
Standardized Coefficients
t Sig.
B Std. Error Beta
(Constant) 26.682 9.014
2.960 .003
Group Classification 13.725 1.463 .436 9.384 .000 APS-R TS -.151 .041 -.182 -3.709 .000 APS-R SS -.389 .133 -.148 -2.932 .004 Age .652 .391 .076 1.668 .096 Anxiety Diagnosis 7.638 2.119 .165 3.604 .000 Self-Injury 5.138 1.651 .144 3.112 .002
Note: R2 = .312 and Adjusted R2 = .300
Predictors of APS-R Total Scores
Another linear regression test was run to see which variables predicted the APS-R TS.
The test revealed that three variables explained 80.0% of the variance in the APS-R TS: SPAI-23
AG, SPAI-23 SP, and Diagnosis of Anxiety Disorder (see Table 12).
Table 12: Predictors of APS-R Total Score
Unstandardized Coefficients
Standardized Coefficients
t Sig.
B Std. Error Beta
(Constant) 46.934 1.918
24.468 .000
SPAI-23 AG 2.147 .058 .902 36.711 .000 SPAI-23 SP -.059 .035 -.044 -1.691 .092 Anxiety Diagnosis 1.674 1.395 .030 1.200 .231
Note: R2 = .801 and Adjusted R2 = .800
40
Chapter 4: Discussion
Numerous studies have focused on the mental health of undergraduate students in
general, but the research team could not find any research regarding the differences in mental
health between high-achieving and typical undergraduate students. The aim of this study was
to determine whether high-achieving students experience a better or worse psychological well-
being than their peers. Primarily the research team addressed four questions: 1) Is there a
statistically significant association between the UCF High-Achieving student population and
reported psychological disorders? 2) Do UCF High-Achieving students have significantly higher
rates of reported psychological disorders than Comparison (typical) students? 3) Do UCF High-
Achieving students have significantly higher rates of social anxiety than Comparison students?
4) Is perfectionism a statistically significant predictor of psychological disorders?
With respect to the first question, the research team found that there was a weak,
positive correlation between the UCF High-Achieving student population and the incidence of
psychological disorders. This correlation was not a strong one, but it was statistically
significant. Therefore, the null hypothesis, that no relationship exists, was rejected.
Was this association due to the increased cognitive capacities of the gifted High-
Achieving students? Because the research team found that there was no relationship between
self-reported inclusion in childhood gifted classes and the diagnosis of a psychological disorder,
the researchers hypothesized that the difference in rates of psychological disorders between
the High-Achieving group and the Comparison group was not due to giftedness. Because only
41
14.3% of the variance in incidence of psychological disorders was explained by seven variables
(Group Classification included), future studies should examine other variables that may account
for more of this variance. Perhaps family history, life satisfaction, high achievement, and stress
levels should be examined as possible predictors.
With respect to the second question, about 22% of the UCF High-Achieving students and
only 13% of the Comparison students reported having been diagnosed with a psychological
disorder. High-Achieving students had a 67% increased risk of having a psychological disorder.
The researchers found the rates of diagnosed anxiety disorders to be particularly interesting.
The High-Achieving group reported almost twice as many (per capita) anxiety disorders as the
Comparison group. High-Achieving students had a 76% increased risk of having an anxiety
disorder.
With respect to the third question, the research team found that High-Achieving
students consistently scored higher than Comparison students on the Social Phobia and Anxiety
Inventory – 23. Specifically, they scored higher on the Social Phobia Subscale and they had
higher Difference Scores. There was no difference between groups on the Agoraphobia
Subscale. This led the team to believe that the variation in Difference Scores between the two
groups was due to higher levels of social anxiety in High-Achieving students.
The amount of students who said they had been diagnosed with Social Anxiety Disorder
was virtually the same in both groups (4 students in the High-Achieving group and 3 students in
the Comparison group). However, the difference in percentages meeting the SPAI-23
42
Difference Score cut-off indicative of Social Anxiety Disorder was surprising. Over 40% of the
High-Achieving students and less than 10% of the Comparison students met the cut-off score of
28. This difference was significant. The research team decided to examine the difference at
the cut-off score of 35 as well. Over 24% of the High-Achieving students and less than 3% of
the Comparison students met this higher cut-off score. This finding was also significant.
Regardless of the cut-off score used, High-Achieving students had a greatly increased risk of
having Social Anxiety Disorder (394% at the cut-off of 28 and 860% at the cut-off of 35).
It is important to note that 9 out of 10 students who met the cut-off score of 28 did not
report having been diagnosed with Social Anxiety Disorder. This sheds light on the need for
greater awareness of psychological disorders (especially Social Anxiety Disorder) among all
undergraduate students. Furthermore, this coupled with the high levels of High-Achieving
students meeting the cut-off score (both 28 and 35) for Social Anxiety Disorder implies a need
for routine evaluations of high-achieving undergraduate students.
High-Achieving students reported feeling more anxiety than Comparison students in
most social situations. High-Achieving students reported more anxiety than Comparison
students when entering both large and small social settings. High-Achieving students were also
more anxious about initiating conversation and being in a new situation with other people.
However, both the High-Achieving and the Comparison groups reported experiencing
significant amounts of anxiety when making a speech in front of an audience. Also, most
43
students (both High-Achieving and Comparison) reported more anxious feelings in large group
settings than in small group settings.
With respect to the fourth question, the researchers found that two measures of
perfectionism (APS-R Total Score and APS-R Discrepancy Score) were statistically significant
predictors of the diagnosis of a psychological disorder (dichotomous “yes” or “no” answers).
Although statistically significant, they predicted very little of the variance in the Psychological
Disorder variable. Although this hypothesis was supported, there was very little practical
significance to the finding.
The only difference in perfectionism scores between the two groups was on the APS-R
Standards Subscale Score. The High-Achieving group scored significantly higher on this
subscale, indicating that high-achieving undergraduate students generally expect more of
themselves than typical undergraduate students do.
Interestingly, the SPAI-23 Agoraphobia Subscale scores were very strongly correlated
with the APS-R Discrepancy Subscale scores and the APS-R Total Scores. However, the SPAI-23
Agoraphobia Subscale was only weakly correlated with the APS-R Standards Subscale. This
connection needs to be studied further, but it seems to suggest that those with high levels of
Agoraphobia perceive that they consistently fail to meet the standards (although maybe not
high standards) that they set for themselves. Perhaps there is a correlation between the
incidence of Agoraphobia and maladaptive perfectionism.
44
The difference in reported self-injury between groups was significant. Approximately
29% of the High-Achieving group and 19% of the Comparison group admitted to at least one
incidence of self-injury. This contradicts the theory reported by Neihart (1999) that increased
cognitive capacity leads to healthier stress-coping mechanisms. As expected, self-injury was
correlated (although only weakly) with diagnosis of a psychological disorder, specifically mood
disorders and anxiety disorders.
In line with Peterson’s (2000) findings that high-achieving students often maintain high
grades even when highly distressed, this study’s sample of High-Achieving students maintained
an average GPA of 3.73 compared to the Comparison average of 3.12. It could be argued that
the High-Achieving sample was bound to have a higher average GPA, because 25 Comparison
students with higher GPAs were moved to the High-Achieving group. However, the average
GPA of those currently enrolled in The Burnett Honors College (3.69) was also significantly
higher than those not currently enrolled in The Burnett Honors College (3.19). This, coupled
with the fact that High-Achieving students experienced higher rates of self-injury, psychological
disorders, and social anxiety, led the researchers to believe that high-achieving students are
able to maintain a high GPA even under distress.
Although the results from this study may have yielded some new and unique
information and insights, the results should be interpreted in the context of several limitations.
First and foremost, the nature of the cross-sectional design of this study presents limitations
45
concerning causality. Also, this study was the first of its kind and thus needs to be replicated
several times before the null hypotheses can be truly rejected.
Secondly, data collection as a whole was a large limitation in this study. The sample was
a non-probabilistic convenience sample, and data was collected from only one large university
in the southeast. It is unknown if findings are generalizable to students at all sizes of
universities in all geographic locations. Furthermore, data was collected during only one
semester. Also, a relatively small number of UCF students participated and group sizes were
unequal. Some of the results that were insignificant might be statistically significant when
comparing two larger, equally-sized groups from UCF.
Another large limitation was based on the instrument of measurement. The results of
this study were based entirely on self-report and some of the survey questions were
retrospective in nature. This introduced and increased the likelihood of false data based on
faulty recall. The survey included several original questions that had not been tested for
psychometric properties, including questions about self-injury and specific types of
psychological disorders. Some disorders were not included in the survey (such as most
somatoform disorders and certain psychotic disorders). This same study might yield different
results if questions about self-injury and psychological disorders were phrased differently. The
survey also included several widely-used screening measurements. Although these
professionally developed and tested scales have fairly strong psychometric properties, it is
46
unknown if a different approach, such as personal interviews or focus groups, would yield the
same results.
Other limitations exist in the group classification process and statistical analyses.
Although often used as a measure of high-achievement, many agree that GPA is a less than
satisfactory measure of high-achievement. Additionally, the chosen cut-off GPA score for group
classification was arbitrary. The selection of other classification criteria might produce different
results. Furthermore, the researchers acknowledge that using binary logistical regressions may
have been more appropriate than using linear regressions. However, the results of the linear
regressions have essentially the same R2 and significance values as the logistical regressions.
Also, use of Sona Systems presented some issues. In this study, 39.3% of the High-
Achieving group and 51.2% of the Comparison group reported majoring or minoring in
Psychology. There is a theory that those who major or minor in Psychology have more personal
psychopathology and/or familial psychopathology than those who major or minor in other
subjects. However, there is a huge lack of research (supportive or contrary) in this area. One
study found that choice of major (specifically Psychology) was a significant predictor of trauma
experienced in childhood and adulthood (Barlow & DeMarni Cromer, 2006). This study showed
that when compared with other majors, Psychology majors had a statistically significant higher
incidence of self-injury (p = .018) but no higher incidence of psychological disorder diagnoses (p
= .111). If this theory is true, results may be even more pronounced when a High-Achieving
group is compared with a Comparison group composed of non-Psychology majors. Future
47
research should examine the differences in mental health between three groups: a High-
Achieving group, a Comparison group composed of psychology majors and minors, and a
Comparison group composed of other majors.
Altogether, the findings of this study indicate that high-achieving undergraduate
students experience a worse psychological well-being than typical undergraduate student
peers. Additionally, high-achieving students may be better at hiding psychological distress than
their peers, so it is important to find ways to identify these students and/or encourage them to
talk about their distress. Findings suggest that high-achieving students may benefit from some
sort of screening and intervention/counseling program aimed at limiting the negative effects of
psychological disorders among this specific group of students. Programs to raise knowledge
and awareness of anxiety disorders (especially Social Anxiety Disorder) should be stressed. In
order to combat the high incidence of self-injury among high-achieving students, this group
should be taught several adaptive coping mechanisms and should be encouraged to talk about
self-injury and other psychological problems with their peers and college staff members.
Since The Burnett Honors College students are separated during UCF Orientation, it
would be fairly easy to give students a Social Anxiety Inventory in order to identify those
students who may benefit from special career mentoring and social encouragement. The UCF
Burnett Honors College already offers several ways (mainly in the form of special events,
luncheons, and volunteer opportunities) to foster relationship bonding, team building, and
community involvement. However, it is unlikely that students experiencing elevated symptoms

48
of social anxiety would be interested in attending these events. Maybe a special event could be
created to reach those who may be afraid to attend most social events. Future studies should
examine different ways to help treat high-achieving students with elevated social anxiety.

49
Appendix A: IRB Approval Letter
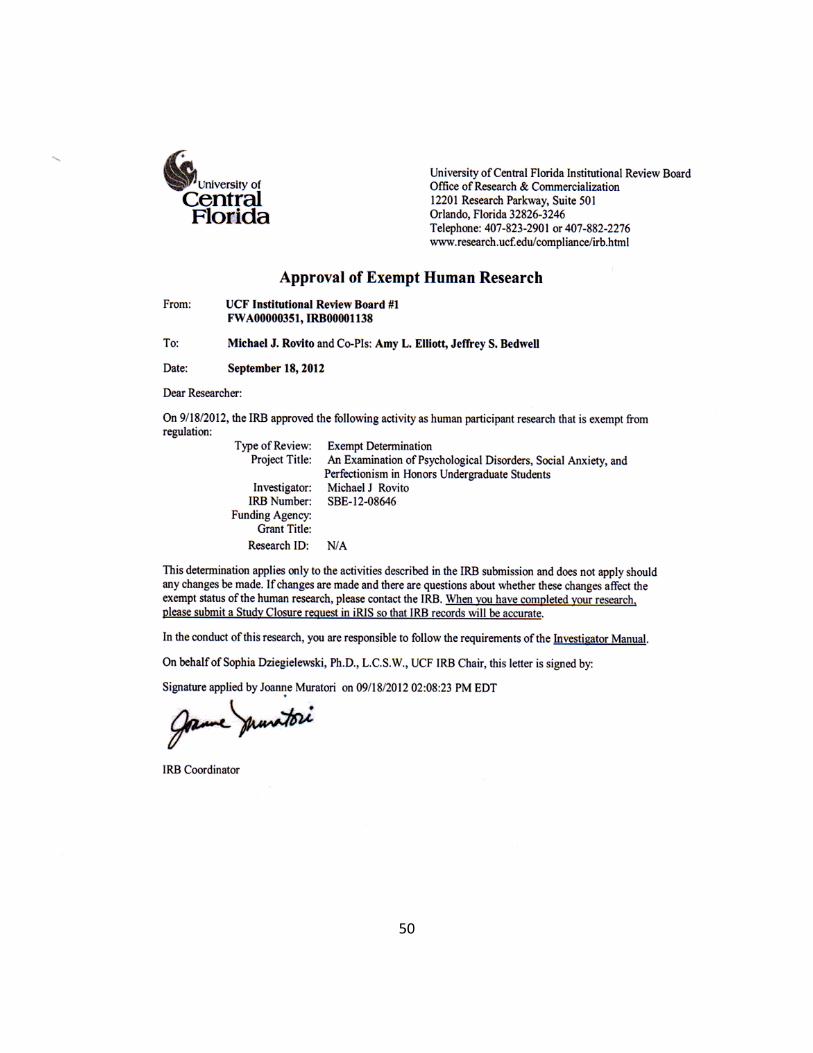
50

51
Appendix B: Original Survey Questions
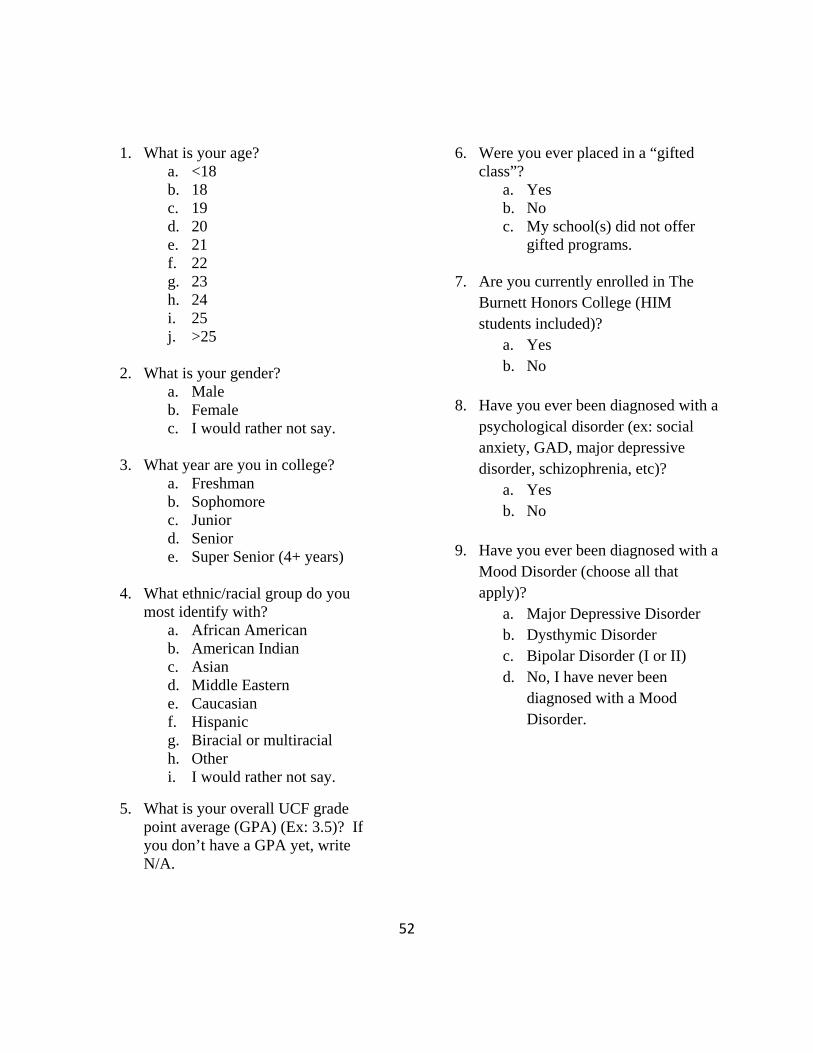
52
1. What is your age? a. <18 b. 18 c. 19 d. 20 e. 21 f. 22 g. 23 h. 24 i. 25 j. >25
2. What is your gender?
a. Male b. Female c. I would rather not say.
3. What year are you in college?
a. Freshman b. Sophomore c. Junior d. Senior e. Super Senior (4+ years)
4. What ethnic/racial group do you
most identify with? a. African American b. American Indian c. Asian d. Middle Eastern e. Caucasian f. Hispanic g. Biracial or multiracial h. Other i. I would rather not say.
5. What is your overall UCF grade point average (GPA) (Ex: 3.5)? If you don’t have a GPA yet, write N/A.
6. Were you ever placed in a “gifted class”?
a. Yes b. No c. My school(s) did not offer
gifted programs.
7. Are you currently enrolled in The Burnett Honors College (HIM students included)?
a. Yes b. No
8. Have you ever been diagnosed with a
psychological disorder (ex: social anxiety, GAD, major depressive disorder, schizophrenia, etc)?
a. Yes b. No
9. Have you ever been diagnosed with a
Mood Disorder (choose all that apply)?
a. Major Depressive Disorder b. Dysthymic Disorder c. Bipolar Disorder (I or II) d. No, I have never been
diagnosed with a Mood Disorder.
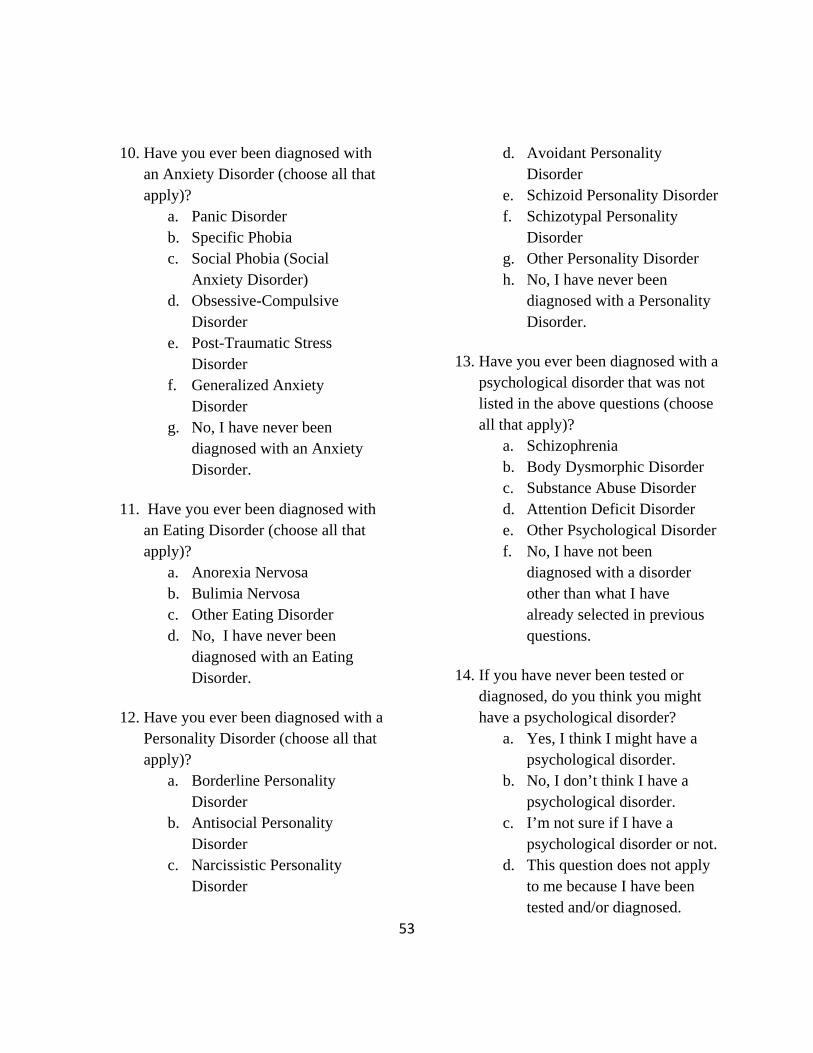
53
10. Have you ever been diagnosed with an Anxiety Disorder (choose all that apply)?
a. Panic Disorder b. Specific Phobia c. Social Phobia (Social
Anxiety Disorder) d. Obsessive-Compulsive
Disorder e. Post-Traumatic Stress
Disorder f. Generalized Anxiety
Disorder g. No, I have never been
diagnosed with an Anxiety Disorder.
11. Have you ever been diagnosed with an Eating Disorder (choose all that apply)?
a. Anorexia Nervosa b. Bulimia Nervosa c. Other Eating Disorder d. No, I have never been
diagnosed with an Eating Disorder.
12. Have you ever been diagnosed with a Personality Disorder (choose all that apply)?
a. Borderline Personality Disorder
b. Antisocial Personality Disorder
c. Narcissistic Personality Disorder
d. Avoidant Personality Disorder
e. Schizoid Personality Disorder f. Schizotypal Personality
Disorder g. Other Personality Disorder h. No, I have never been
diagnosed with a Personality Disorder.
13. Have you ever been diagnosed with a psychological disorder that was not listed in the above questions (choose all that apply)?
a. Schizophrenia b. Body Dysmorphic Disorder c. Substance Abuse Disorder d. Attention Deficit Disorder e. Other Psychological Disorder f. No, I have not been
diagnosed with a disorder other than what I have already selected in previous questions.
14. If you have never been tested or diagnosed, do you think you might have a psychological disorder?
a. Yes, I think I might have a psychological disorder.
b. No, I don’t think I have a psychological disorder.
c. I’m not sure if I have a psychological disorder or not.
d. This question does not apply to me because I have been tested and/or diagnosed.
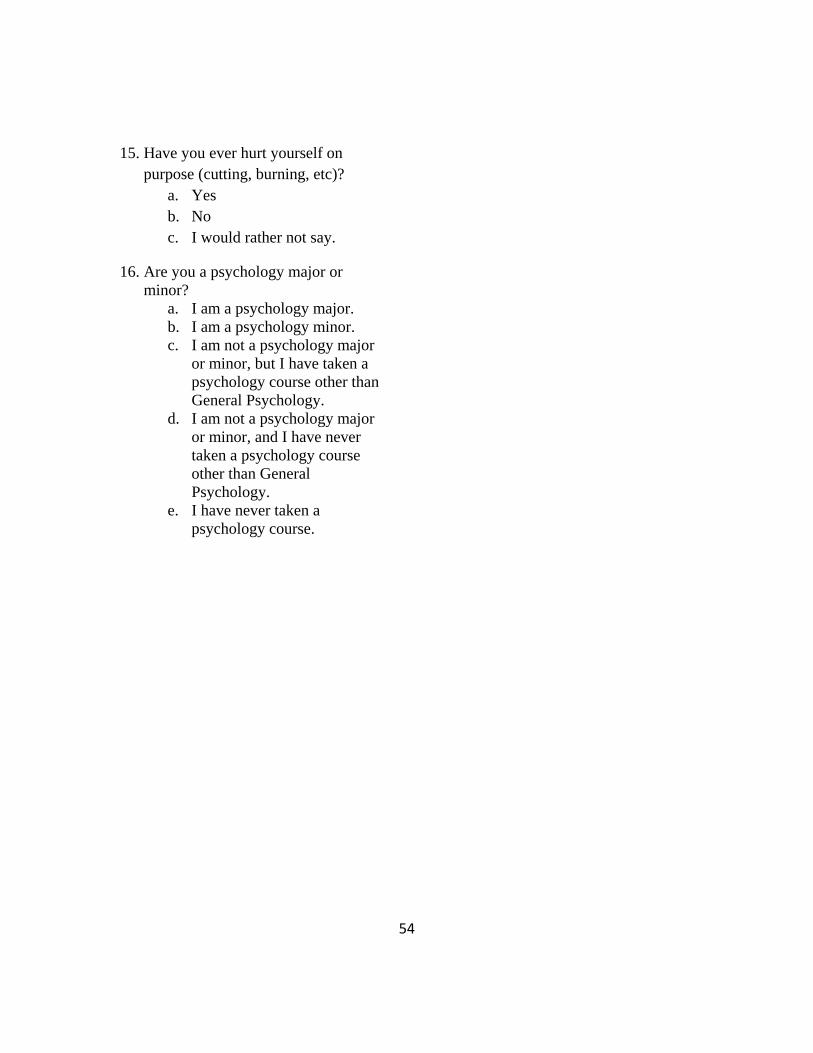
54
15. Have you ever hurt yourself on purpose (cutting, burning, etc)?
a. Yes b. No c. I would rather not say.
16. Are you a psychology major or minor?
a. I am a psychology major. b. I am a psychology minor. c. I am not a psychology major
or minor, but I have taken a psychology course other than General Psychology.
d. I am not a psychology major or minor, and I have never taken a psychology course other than General Psychology.
e. I have never taken a psychology course.
55
References
Adderholdt-Elliott, M. (1991). Perfectionism and the gifted adolescent. In M. Bireley, J.
Genshaft, M. Bireley, J. Genshaft (Eds.), Understanding the gifted adolescent:
Educational, developmental, and multicultural issues (pp. 65-75). New York, NY US:
Teachers College Press.
American College Health Association - National College Health Assessment II: Reference Group
Data Report Spring 2011. (2011). American College Health Association. Retrieved March
19, 2012, from http://www.acha.org.
Barlow, M., & DeMarni Cromer, L. (2006). Trauma-relevant characteristics in a university human
subjects pool population: Gender, major, betrayal, and latency of participation. Journal
Of Trauma & Dissociation, 7(2), 59-75.
Beidel, D. C., Turner, S. M., Stanley, M. A., & Dancu, C. V. (1989). The Social Phobia and Anxiety
Inventory: Concurrent and external validity. Behavior Therapy, 20(3), 417-427.
Blatt, S. J. (1995). The destructiveness of perfectionism: Implications for the treatment of
depression. American Psychologist, 50, 1003-1020.
Bracken, B.A. (1980). Comparison of self-attitudes of gifted children and children in a nongifted
normative group. Psychological Reports, 47(3), 715-718.
Carman, C. A. (2011). Adding personality to gifted identification: Relationships among
traditional and personality-based constructs. Journal Of Advanced Academics, 22(3),
412-446.
56
Chavira, D. A., Stein, M. B., & Malcarne, V. L. (2002). Scrutinizing the relationship between
shyness and social phobia. Journal of Anxiety Disorders, 16, 585-598.
Clark, B. (2008). Growing up gifted: developing the potential of children at school and at home
(7th ed.). Boston: Pearson/Allyn and Bacon Publishers.
Cranford, J. A., Eisenberg, D., & Serras, A. M. (2009). Substance use behaviors, mental health
problems, and use of mental health services in a probability sample of college students.
Addictive Behaviors, 34(2), 134-145.
Dell'Osso, L., Rucci, P., Ducci, F., Ciapparelli, A., Vivarelli, L., Carlini, M., & ... Cassano, G. B.
(2003). Social anxiety spectrum. European Archives Of Psychiatry And Clinical
Neuroscience, 253(6), 286-291.
Dixon, F. A., Lapsley, D. K., & Hanchon, T. A. (2004). An Empirical Typology of Perfectionism in
Gifted Adolescents. Gifted Child Quarterly, 48(2), 95-106.
Eisenberg, D., Golberstein, E., & Gollust, S. E. (2007). Help-seeking and access to mental health
care in a university student population. Medical Care, 45(7), 594-601.
Flett, G. L., Coulter, L., Hewitt, P. L., & Nepon, T. (2011). Perfectionism, rumination, worry, and
depressive symptoms in early adolescents. Canadian Journal Of School Psychology,
26(3), 159-176.
Gallucci, N.T. (1988). Emotional adjustment of gifted children. Gifted Child Quarterly, 32, 273-
276.
57
Hamachek, D.E. (1978). Psychodynamics of normal and neurotic perfectionism. Psychology, 15,
27-33.
Hewitt, P.L. & Flett, G.L. (1991). Perfectionism in the self and social contexts:
Conceptualization, assessment, and association with psychopathology. Journal of
Personality and Social Psychology, 60, 456-470.
Hunt, J., & Eisenberg, D. (2010). Mental health problems and help-seeking behavior among
college students. Journal Of Adolescent Health, 46(1), 3-10.
Juster, H. R., Heimberg, R. G., Frost, R. O., & Holt, C. S. (1996). Social phobia and perfectionism.
Personality And Individual Differences, 21(3), 403-410.
Kessler, R. C., Chiu, W., Demler, O., & Walters, E. E. (2005). Prevalence, Severity, and
Comorbidity of 12-Month DSM-IV Disorders in the National Comorbidity Survey
Replication. Archives Of General Psychiatry, 62(6), 617-627.
Kring, A. M., Johnson, S. L., Davison, G. C., Neale, J. M. (2010). Abnormal Psychology.
Hoboken, NJ: John Wiley & Sons, Inc.
Lewis, R. B., Kitano, M. K., & Lynch, E. W. (1992). Psychological intensities in gifted adults.
Roeper Review, 15(1), 25-31.
Mental health: a report of the Surgeon General. (1999). Rockville, Md.: Dept. of Health and
Human Services, U.S. Public Health Service.
Nail, J.M. & Evans, J.G. (1997). The emotional adjustment of gifted adolescents: A view of
global functioning. Roeper Review, 20(1), 18-21.
58
Neihart, M. (1999). The impact of giftedness on psychological well-being: what does the
empirical literature say?. Roeper Review, 22(1), 10.
Neumeister, K. (2004). Factors Influencing the Development of Perfectionism in Gifted College
Students. Gifted Child Quarterly, 48(4), 259-274.
Peterson, J.S. (2000). A follow-up study of one group of achievers and underachievers four
years after high school graduation. Roeper Review, 22, 217-224.
Peterson, J., Duncan, N., & Canady, K. (2009). A longitudinal study of negative life events, stress,
and school experiences of gifted youth. Gifted Child Quarterly, 53(1), 34-49.
Peterson, J.S., & Ray, K.E. (2006). Bullying among the gifted: The subjective experience. Gifted
Child Quarterly, 50, 252-269.
Pfeiffer, S.I., & Stocking, V.B. (2000). Vulnerabilities of academically gifted students. Special
Services in the Schools. 16,83-93.
Roberson-Nay, R., Strong, D. R., Nay, W. T., Beidel, D. C., & Turner, S. M. (2007). Development
of an abbreviated Social Phobia and Anxiety Inventory (SPAI) using item response
theory: The SPAI-23. Psychological Assessment, 19(1), 133-145.
Rice, K. G., & Ashby, J. S. (2007). An efficient method for classifying perfectionists. Journal Of
Counseling Psychology, 54(1), 72-85.
Schry, A. R., Roberson-Nay, R., & White, S. W. (2012). Measuring Social Anxiety in College
Students: A Comprehensive Evaluation of the Psychometric Properties of the SPAI-23.
Psychological Assessment.
59
Schwartz, A. J. (2006). Are College Students More Disturbed Today? Stability in the Acuity and
Qualitative Character of Psychopathology of College Counseling Center Clients: 19920-
1993 Through 2001-2002. Journal Of American College Health, 54(6), 327-337.
Slaney, R. B., Rice, K. G., & Ashby, J. S. (2002). A programmatic approach to measuring
perfectionism: The Almost Perfect Scales. In G. L. Flett, P. L. Hewitt, G. L. Flett, P. L.
Hewitt (Eds.) , Perfectionism: Theory, research, and treatment (pp. 63-88). American
Psychological Association.
Slaney, R. B., Rice, K. G., Mobley, M., Trippi, J., & Ashby, J. S. (2001). The Revised Almost Perfect
Scale. Measurement And Evaluation In Counseling And Development, 34(3), 130-145.
Sowa, C.J., & May, K.M. (1997). Expanding Lazarus and Folkman’s paradigm to the social and
emotional adjustment of gifted children and adolescents (SEAM). Gifted Child Quarterly,
41, 36-43.
Strahan, E. Y. (2003). The effects of social anxiety and social skills on academic performance.
Personality And Individual Differences, 34(2), 347-366.
Suldo, S. M., Shaunessy, E., & Hardesty, R. (2008). Relationships among stress, coping, and
mental health in high-achieving high school students. Psychology In The Schools, 45(4),
273-290.
Szabos, J. (1989). Bright child, gifted learner. Challenge, 34.
60
Turner, S. M., Beidel, D. C., Dancu, C. V., & Stanley, M. A. (1989). An empirically derived
inventory to measure social fears and anxiety: The Social Phobia and Anxiety Inventory.
Psychological Assessment: A Journal Of Consulting And Clinical Psychology, 1(1), 35-40.
Wheeler, H. A., Blankstein, K. R., Antony, M. M., McCabe, R. E., & Bieling, P. J. (2011).
Perfectionism in anxiety and depression: Comparisons across disorders, relations with
symptom severity, and role of comorbidity. International Journal Of Cognitive Therapy,
4(1), 66-91.
Yadusky-Holahan, M., & Holahan, W. (1983). The effect of academic stress upon the anxiety and
depression levels of gifted high school students. Gifted Child Quarterly, 27(1), 42-46.