Embed Size (px)
Citation preview
Electronic copy available at: http://ssrn.com/abstract=1727281
125
An Examination of Life Insurers’ Risk Attitudes
Yaffa Machnes1
Abstract This paper presents evidence of a significant positive relationship between the ratios of life insurance premiums quoted to smokers relative to the premiums quoted to non-smokers, and the financial strength of the insurance company. This suggests that life insurers reveal increasing relative risk aversion. Key words: risk aversion, life insurance, premium quotes. JE classification: D81, D92, G2
1 Graduate School of Business Administration, Bar-Ilan University, ISRAEL 52900 E-mail: [email protected], Fax; 972-3-5353182, Tel: 972-8-9468544
Electronic copy available at: http://ssrn.com/abstract=1727281
Yaffa Machnes - An Examination of Life Insurers’ Risk Attitudes – Frontiers in Finance and Economics – Vol. 7 No.2 – October 2010, 125 - 137
FFE is hosted and managed by SKEMA Business School
126
1 - Introduction
The economics literature features a long series of empirical papers studying the risk preferences of individual economic agents, for example, the buyers of insurance policies. The risk preferences of the suppliers of insurance policies, in contrast, have not been studied. The current paper addresses this gap in the literature by investigating the risk preferences of stock life insurance companies.
The risk preferences of life insurance companies are studied in this paper by examining the relationship between the financial strength of stock corporations selling life insurance through the Internet, and their willingness to adopt different levels of risk. In order to reveal risk aversion, I examine the differences in life insurance premiums for smokers relative to those for non-smokers.
In Section 2, I survey the literature. The theoretical model, presented in Section 3, shows the relationship between insurers' financial strength and the optimal mix of smokers and non-smokers who buy policies. In Section 4, the empirical investigation shows that insurers exhibit increasing relative risk aversion.
2 - The Literature
In the textbook theory of the firm, which assumes perfect capital
markets, there is no role for the concept of a wealth constraint. If unexpected outlays are suddenly required, the firm can always borrow capital to finance the necessary activities. However, when capital markets are imperfect, firms rely on retained earnings to finance such outlays. Thus, the financial strength of the firm, which is analogous to the wealth of the household, becomes important. For example, in the insurance industry, sudden large claims, such as those occurring after the attack on the World Trade Center in 2001, must be financed out of retained earnings. Therefore, the owners of firms and their managers are interested in maximizing the financial strength of their firms or, in effect, the firms' "wealth". Thus firms, including stock insurance companies, can be expected to have revealed preferences for wealth, or, in effect, a utility function in which financial strength is an argument.
The objectives and preferences of insurance companies have attracted the attention of leading economic theorists during the last forty years. Borch (1962) attributed utility functions to insurers and assumed they are risk averse. In contrast, Rothschild and Stiglitz (1976) assumed that stock insurance companies maximize expected profits because the risk they pool is diversified
Yaffa Machnes - An Examination of Life Insurers’ Risk Attitudes – Frontiers in Finance and Economics – Vol. 7 No.2 – October 2010, 125 - 137
FFE is hosted and managed by SKEMA Business School
127
among many owners of the insurance company. This assumption, while a useful simplification for the purpose of Rothschild and Stiglitz, is highly unrealistic. Stock life insurance companies are managed by agents who are risk averse and behave accordingly, as emphasized by Hart and Holmström (1987). We observe that insurance companies are not indifferent to risk and try to decrease risk in several ways: they buy reinsurance at the cost of unfair premiums and sell participating life insurance policies.
Kraus and Ross (1982), Doherty and Garven (1986), Berger, Cummins and Weiss (1987) and many others distinguished between diversified and non-diversified risks. They assumed that insurers are able to overcome underwriting risks and use the financial markets to meet non-diversified risks like inflation and fluctuating interest rates. However, the Society of Actuaries, which deals with the way premiums are set in practice, lists the different types of risks that life insurers face. Price inadequacy is one of them, as noted by Black and Skipper (2000). In fact, insurers do not know the “true” probability of claims, and thus each additional insurance policy increases the variance of profit (Samuelson, 1963) and the cost of reinsurance.
The risks that insurers face induce their strategies. In order to derive an optimal strategy for insurers, Gerber and Pafumi (1998) attribute utility from wealth to insurers. They consider several possible utility functions that describe the preferences of insurance companies. Further discussions of their paper by several authors raise the issue of an “adjustment-specific” utility function. Longley-Cook (1998), in his discussion, writes that “utility theory forms the philosophical basis for actuarial science” and examines the utility functions suggested by Gerber and Pafumi (1998) according to the measures of risk aversion introduced by Arrow (1970). In this context, one can define “risk aversion” of insurance company in terms of: the ratio of the second and first derivatives of the utility function as a function of financial strength.
This study looks empirically at the revealed risk preferences of stock life insurance companies managed by agents. It examines whether insurers have any systematic preferences toward risk as assumed by Borch, Gerber and Pafumi and Longley-Cook.
Several previous empirical studies, using cross sectional data, have examined the preferences toward risk of individuals, but not firms. As pointed out by Siegel and Hoban (1982), the results of these studies are often contradictory.
Halek and Eisenhauer (2001) and Eisenhauer and Ventura (2003) estimated households' risk preferences. Chetty (2006) and Kaplow (2005) estimated the coefficient of relative risk aversion from the revealed supply of labor by individuals. Bar-Shira, Just and Zilberman (1997) tested farmers’
Yaffa Machnes - An Examination of Life Insurers’ Risk Attitudes – Frontiers in Finance and Economics – Vol. 7 No.2 – October 2010, 125 - 137
FFE is hosted and managed by SKEMA Business School
128
attitudes toward risk using an econometric procedure, and, like the present study, found support for Arrow’s increasing relative risk aversion (IRRA) hypothesis.
On the other hand, the studies of Levy (1994), Bellante and Green (2004), and Ogaki and Zhang (2001) found support for decreasing relative risk aversion (DRRA). The seemingly inconsistent empirical results have been explained recently by Di Mauro and Maffioletti (2004) who show in a series of experiments, that the sign of the outcome domain influences the risk preferences of individuals. Kaplow (2005) also show that risk-taking behavior varies in different market settings. Finally, Chiappori and Salani (2008), using panel data on portfolio composition, show that changes in income result in compensating variations in portfolio composition that leave the fraction invested in risky assets constant.
3 - The Model
The model infers the relationship between the wealth of insurance
companies and their willingness to adopt different levels of risk, based on the premiums they charge. The wealth of stock insurance company is a variable that needs further definition. The market value of a stock insurance company depends on many factors and is estimated by the investors. This estimated value fluctuates over time. As a proxy for a company’s wealth, we will use the financial strength of the insurance companies as measured by the rating agencies. Financial rating is based on a company’s balance sheet, operating performance and business profile. Managers of insurance companies are also concerned mainly with the rating of their company and make efforts to improve it. An important virtue of these ratings is that all companies are measured on the same scale, independent of the size of their activity.
The model assumes that the current financial strength of the insurers is known with certainty while the future financial strength is a random variable, whose probability distribution depends on the risk level of insurance purchasers, and many other factors such as interest rates and inflation, which are assumed to be independent of the portfolio of claims.
This paper examines the willingness of insurers to increase the level of risk they undertake by varying the premiums they quote to both high and low risk applicants. An increase in the premium quote decreases the quantity demanded and the risk taken by insurers. Cutler, Finkelstein and McGarry (2008) found in surveys done in the U.S. during the years 1992-2005, that mortality rates among smokers were greater by 10.4% than among non-smokers, while smokers had lower life insurance coverage than non-smokers
Yaffa Machnes - An Examination of Life Insurers’ Risk Attitudes – Frontiers in Finance and Economics – Vol. 7 No.2 – October 2010, 125 - 137
FFE is hosted and managed by SKEMA Business School
129
by 6.8%. Candidates for life insurance are required to report on their smoking habits and insurance companies can request certification from physicians of the applicant’s health status. Thus misrepresentation of the buyer’s status as a smoker or non-smoker is difficult. Thus, the insurance company knows that some proportion, , of the individuals it insures are smokers and 1- of those it insures are non-smokers (0< <1). affects the risk of the insurers.
To simplify the model, I assume that all stock life insurance companies have the same utility function which describes the preferences of their managers. The manager's utility is assumed to be a function of the company's financial strength.
As shown by Brown and Goolsbee (2002) the life insurance market, particularly the segment operating through the Internet, is highly competitive. Therefore, price discrimination according to the buyer’s willingness to pay for insurance (depending on whether he or she is a smoker or a non-smoker) is impossible. Differences in relative premiums charged by different companies must be explained by differing marginal costs of providing the insurance, which in the present model are related to differing degrees of risk aversion for companies with varying financial strength.
Insurers control risks through and can change the ratio of non-smokers to smokers by selling more or fewer policies to the two different groups. There are several ways to control , but the present model assumes that this is accomplished only through the relative premiums quoted to each of the two groups of candidates. We use the following notation:
X~
= 1 + the random rate of return from the portfolio of non-smokers.
Y~
= 1 + the random rate of return from the portfolio of smokers.
To simplify, we assume there is a linear relationship between X~
and Y~
such that the following equation holds:
Y~
= a + b X~
where a < 0 and b > 1. The restriction b > 1 is based on the assumption that random shocks to the insured’s health, such as bad climate or even unfavorable economic conditions, will decrease the insured’s life expectancy more seriously if the
insured is a smoker than if he or she is a non-smoker. Thus, when X~
< 1/b,
we would expect Y~
to be lower than 1 but these values mean losses which
insurers do everything to prevent. However, for X~
sufficiently large, Y~
can
be expected to take values larger than X~
, since a higher rate of return will compensate for greater variance. Note that the probability of a claim by a smoker is greater then for a non-smoker, but its value is less than 0.5. Due to
Yaffa Machnes - An Examination of Life Insurers’ Risk Attitudes – Frontiers in Finance and Economics – Vol. 7 No.2 – October 2010, 125 - 137
FFE is hosted and managed by SKEMA Business School
130
the binomial distribution of the claim, the variance of profit derived from a policy sold to a smoker is therefore greater relative to the variance of profit from a policy sold to a non-smoker. The variance of the sum of all claims in the insurers portfolio is also greater when is greater. Even if insurers sell many life insurance policies and diversify between shareholders, they still carry the risk of pricing inadequacy embodied in each policy. Insurers buy reinsurance contracts and sell profit sharing policies in order to protect themselves against this risk.
We assume that the insurance company is rational and each policy sold will not decrease its financial strength.
In the initial period the financial strength of the insurance company is known to its manager and we denote it by W. The random financial strength of the insurance company in the next period will be
W~
= [ Y~
+(1- ) X~
]W. For the sake of simplicity, the model ignores risks caused by other
activities in the financial markets and by other products sold by the insurers. We assume that all other sources of risk are independent of the risk of claims by the life insurance policy holders.
Regulations keep W strictly positive and each insurance company will maximize its expected utility U
XE .
U’>0 and U’’<0.
* argmax XE U{[Y
~+(1-) X
~] W }. (1)
We assume an internal solution and look for the effect of changes in financial strength on *.
R denotes relative risk aversion, defined for every possible value of W, where:
R='
''-WU (W)
U (W)
Proposition
When the financial strength of the insurance company increases, the optimal ratio of insured smokers to non-smokers decreases (increases) if relative risk aversion is an increasing (or a decreasing) function of financial strength. Furthermore, if relative risk aversion is constant, the proportion of smokers to non-smokers does not change. Formally,
Sign(d*/dW)= -Sign(d R /dW).

Yaffa Machnes - An Examination of Life Insurers’ Risk Attitudes – Frontiers in Finance and Economics – Vol. 7 No.2 – October 2010, 125 - 137
FFE is hosted and managed by SKEMA Business School
131
Proof
F( )),( WW =XE U{[Y
~+(1-) X
~]W}=
XE U{[(a+b X~
)+(1-) X~
]W}
Solving the equation:
)),(( WWFXE (a+b X
~- X
~)WU’{ }=0 (2)
for the optimal , we have that: 2 2
20
F Fd dW
W
(3)
Due to the second-order condition of maximization, 2
2
F
is negative at *
and the sign of
2F
W determines the sign of d /dW.
2
( ( 1))X
Fa X b
W E
W[(a+b X
~)+(1-) X
~]U’’{ } (4)
Multiplying and dividing (4) by U’{[(a+b X~
)+(1-) X~
]W}, we obtain the relative risk aversion R where the financial strength is measured at the second period.
W~
={[(a+b X~
)+(1-) X~
]W}.
We thus have: 2
( ( 1))X
Fa X b
W E
R U’{[(a+b X
~)+(1-) X
~]W}.
Since U’ and R are positive, the sign of
[a+ X~
(b-1)] R U’{[(a+b X~
)+(1-) X~
]W} depends only on the value of
X~
. It will be zero only if X~
=-a/(b-1). It will be negative for the
interval X~
<-a/(b-1) and positive for the interval X~
>-a/(b-1). Thus, the sign of d /dW depends on R. If R is constant, due to the first order condition of maximization expressed in (2), the right side of (4) is zero. If R is increasing with W, smaller values of R are multiplied by negative values and larger
Yaffa Machnes - An Examination of Life Insurers’ Risk Attitudes – Frontiers in Finance and Economics – Vol. 7 No.2 – October 2010, 125 - 137
FFE is hosted and managed by SKEMA Business School
132
values of R are multiplied by positive values so the expected value will be positive. Dividing by (–W) makes the right side of (4) negative. If R is decreasing the opposite is true: larger values of R are multiplied by negative values. Q.E.D. 4 - Empirical Investigation
Previous empirical studies of the life insurance market include Babble
(1985), who estimated the price elasticity of the demand for life insurance, after creating an index for the different premiums, and a study of the determinants of life insurance premiums by Walden (1985). In Walden’s sample, not surprisingly, smokers pay more for a life insurance policy than non-smokers. Walden also estimated the impact of the rating of the insurance company on the premium. Walden, however, did not look at the relationship between the rating of the insurance company and the ratio of premiums paid by smokers and non-smokers, which is the focus of the present investigation.
During the last decade, insurance companies have entered the electronic market. Companies which compete in the Internet face a competitive market for their product. Thus, other products they sell or the concentration of ownership of the insurance company cannot affect the price of a well defined product.
The present study utilizes data from Standard & Poor’s (S&P) and A.M. Best ratings to estimate financial strength of insurance companies. These ratings measure the ability of insurance companies to pay their insurance policies and contracts in accordance with their terms. The rating system provides an opinion as to insurers’ financial strength and ability to meet ongoing obligations to policy holders. It is derived from an evaluation of a company’s balance sheet strength, operating performance and business profile. Rating is not specific to any particular policy or contract. S&P indicate eight main ratings: AAA, AA, A, BBB, BB, B, CCC, CC and the “+” and “–” designations indicate standing within categories. A. M. Best ratings use different symbols: A++, A+, A, A-, B++, B+, B, B-, C++, C+, C, C-, D.
The premiums charged to smokers and non-smokers were obtained from Internet data on life insurance company quotes. For 38 life insurance companies we have S&P ratings as well as the premiums quoted to smokers and to non-smokers of the same age and gender. Using the A.M. Best data, we have data for only 31 life insurance companies.
Life insurance quotes were collected for 15-year term policies, for seven different age groups. The contract sold is nearly identical for all companies that sell through the Internet, since they sell the simplest standard
Yaffa Machnes - An Examination of Life Insurers’ Risk Attitudes – Frontiers in Finance and Economics – Vol. 7 No.2 – October 2010, 125 - 137
FFE is hosted and managed by SKEMA Business School
133
life insurance policy in order to quote the lowest possible price. Underwriting expenses through the Internet are also minimal as there are no selling agents, and in the case of doubt about the applicant’s health status, there is no sale.
Let sdenote per dollar quote of the premium demanded from
smokers and n per dollar premium demanded from non-smokers. The ratio
between them indicates the relative desirability of each segment to insurers. As stated earlier, the insurance company is assumed to know that there is a monotonically decreasing relationship between the ratio of insurance
premiums that it quotes s/ n
, and the resulting ratio of smokers to non-
smokers among its customers , which in turn, as stated by the Proposition, will optimally increase (decrease) if the company’s relative risk aversion decreases (increases) with its wealth (financial strength). Thus we can use
s/ n
as a proxy for . Here determines the level of risk and a log-
linear regression can present the relationship between the ratio s/ n
and
the certainty equivalent financial strength of the insurance company. We estimate the relationship
log( s/ n
) i = + logWi + ui (5)
where Wi denotes the wealth of company i, and are the regression coefficients and ui is the error term which is assumed to be independent of Wi. I assume that all other factors that determine the relative premium are included in ui. As a proxy for Wi, we use financial strength.
Data from S&P ratings and from A.M. Best ratings could not be merged into one data set, because A.M. Best ratings have fewer rating categories. Therefore two sets of regressions were estimated. In the sample, the lowest published S&P rating of an insurance company which sells insurance through the Internet is BB. The rating B is defined by S&P as “weak financial security characteristics”. I found no insurance company with this rating that sells insurance through the Internet. As only life insurance companies with relatively high ratings are included in the data, we have only seven S&P ratings including the “+” and the “–”signs. Numerical values were assigned to the S&P ratings, so that AAA is indexed by 7, BB is indexed by 1, and all the intermediate ratings receive values between 1 and 7. Equation (5) is estimated fourteen times: for seven age groups and for the two genders. For A.M. Best data there are only four rating categories for the insurance companies that sold through the Internet. For this sample as well, fourteen
Yaffa Machnes - An Examination of Life Insurers’ Risk Attitudes – Frontiers in Finance and Economics – Vol. 7 No.2 – October 2010, 125 - 137
FFE is hosted and managed by SKEMA Business School
134
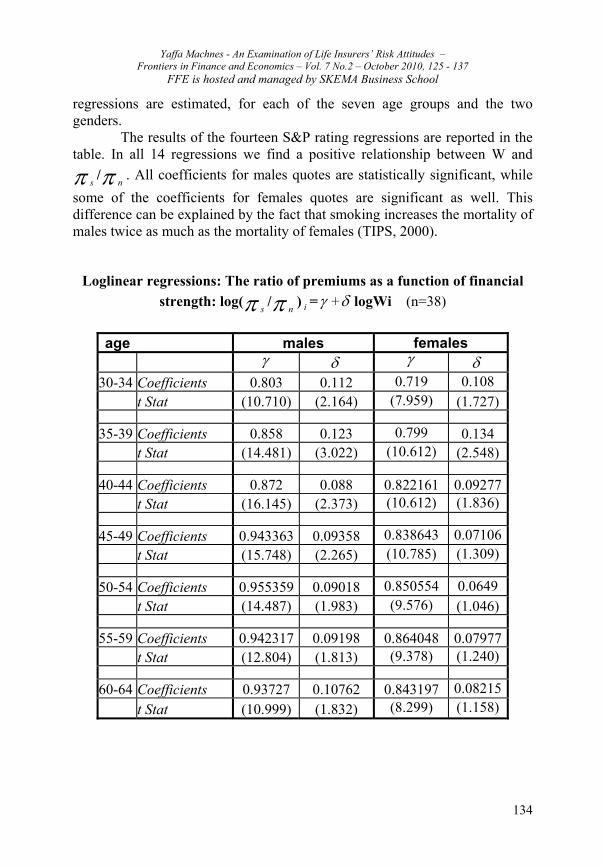
regressions are estimated, for each of the seven age groups and the two genders.
The results of the fourteen S&P rating regressions are reported in the table. In all 14 regressions we find a positive relationship between W and
s/ n
. All coefficients for males quotes are statistically significant, while
some of the coefficients for females quotes are significant as well. This difference can be explained by the fact that smoking increases the mortality of males twice as much as the mortality of females (TIPS, 2000).
Loglinear regressions: The ratio of premiums as a function of financial
strength: log( s/ n
) i = + logWi (n=38)
age males females
30-34 Coefficients 0.803 0.112 0.719 0.108 t Stat (10.710) (2.164) (7.959) (1.727)
35-39 Coefficients 0.858 0.123 0.799 0.134 t Stat (14.481) (3.022) (10.612) (2.548)
40-44 Coefficients 0.872 0.088 0.822161 0.09277 t Stat (16.145) (2.373) (10.612) (1.836)
45-49 Coefficients 0.943363 0.09358 0.838643 0.07106 t Stat (15.748) (2.265) (10.785) (1.309)
50-54 Coefficients 0.955359 0.09018 0.850554 0.0649 t Stat (14.487) (1.983) (9.576) (1.046)
55-59 Coefficients 0.942317 0.09198 0.864048 0.07977 t Stat (12.804) (1.813) (9.378) (1.240)
60-64 Coefficients 0.93727 0.10762 0.843197 0.08215
t Stat (10.999) (1.832) (8.299) (1.158)
Yaffa Machnes - An Examination of Life Insurers’ Risk Attitudes – Frontiers in Finance and Economics – Vol. 7 No.2 – October 2010, 125 - 137
FFE is hosted and managed by SKEMA Business School
135
For A.M. Best ratings, the fourteen regressions again indicate a
positive relationship between W and s/ n
, but most of the regression
coefficients are not statistically significant. Our statistical analysis presented in Table 1 shows that a better
financial strength rating is associated with a relatively higher relative quote to smokers. The first line, for example, tells us that for males aged 30, one S&P scale higher rating (from A to AA for example) raises the price for smokers relative to non-smokers by 11.1% and for females by 10.8%. We can see along the columns in Table 1 that for all age groups the estimates for the constants for females are smaller relative to the constants estimated for males. An overall estimation shows that insurers increase average premiums for smoking males by 6% more than they increase premiums for smoking females
Considering the small number of observations, the small number of ratings and the simple transformation of the ratings into a numerical scale, the empirical outcomes are impressive. The empirical results indicate that life insurers exhibit increasing relative risk aversion (IRRA). 5 - Conclusion
When risk preferences of the managers of life insurance companies depend on the financial strength of their company and follow the assumptions of expected utility theory, we obtain a mathematical relationship between the financial strength of insurers and the optimal ratio of smokers to non-smokers among their insured customers. When financial strength increases, the optimal ratio of smokers to non-smokers decreases if insurers’ preferences exhibit increasing relative risk aversion.
This study examined the revealed risk preferences of stock life insurance companies. By quoting premiums to smokers and non-smokers, insurers determine the ratio of smokers to non-smokers among their customers. The ratio of premium quotes to smokers relative to non-smokers was found to increase with the financial strength of the insurance company, revealing increasing relative risk aversion. These empirical results support Arrow’s hypothesis about agents’ behavior under risk.
These empirical findings call for further study of the risk preferences of other financial institutions, such as pension funds and banks.
Yaffa Machnes - An Examination of Life Insurers’ Risk Attitudes – Frontiers in Finance and Economics – Vol. 7 No.2 – October 2010, 125 - 137
FFE is hosted and managed by SKEMA Business School
136
References
A. M. Best Ratings. http://www.ambest.com/ratings/guide.html Arrow, J.K. 1970. Essays in the Theory of Risk Bearing. (North-Holland,
Amsterdam). Babble, D.F. 1985. The price elasticity of demand for whole life insurance.
Journal of Finance, 40(1), 225-239. Bar-Shira, Z., R.E. Just and D. Zilberman, 1997. Estimation of farmers risk
attitudes: An econometric approach. Agricultural Economics, 17, 211-222.
Bellante, D. and C.A. Green, 2004. Relative risk aversion among the elderly. Review of Financial Economic, 13(3), 269-281.
Berger, A.N., J.D. Cummins and M.A. Weiss, 1997. The coexistence of multiple distribution systems for financial services: The case of property-liability insurance. The Journal of Business, 70, 515-546.
Black, K. and H. Skipper, 2000. Life and Health Insurance. (Prentice Hall, New Jersey). 13-th Edition, p. 264.
Borch, K. 1962. Equilibrium in a reinsurance market. Econometrica, 30, 424-444.
Brown, J.R. and A. Goolsbee, 2002. Does the Internet make markets more competitive? Evidence from the life insurance industry. Journal of Political Economy, 110(3), 481-508.
Chetty, R. 2006. A new method of estimating risk aversion. American Economic Review, 96(5), 1821-1834.
Chiappori, P.A. and B. Salani, 2008. Modeling competition and market equilibrium in insurance: Empirical issues. American Economic Review: Papers & Proceedings, 98(2), 146–150.
Cutler, D.M., A. Finkelstein and K. McGarry, 2008. Preference heterogeneity and insurance markets: Explaining a puzzle of insurance. American Economic Review: Papers & Proceedings, 98(2), 157–162.
Di Mauro, C. and A. Maffioletti, 2004. Attitudes to risk and attitudes to uncertainty: Experimental evidence. Applied Economics, 36(4), 357-72.
Eisenhauer, J.G. and L. Ventura, 2003. Survey measures of risk aversion and prudence. Applied Economics, 35(13), 1477-1484.
Doherty, N.A. and J.R. Garven, 1986. Price regulation in property- liability insurance: A contingent-claims approach. The Journal of Finance, 41, 1031-1050.
Yaffa Machnes - An Examination of Life Insurers’ Risk Attitudes – Frontiers in Finance and Economics – Vol. 7 No.2 – October 2010, 125 - 137
FFE is hosted and managed by SKEMA Business School
137
Gerber, H.U. and G. Pafumi, 1998. Utility functions: From theory to finance. North American Actuarial Journal, 2, 74-100.
Halek, M. and J.G. Eisenhauer, 2001. Demography of risk aversion. Journal of Risk and Insurance, 68(1), 1-24.
Hart, O. and B. Holmström, 1987. The theory of contracts, in T.F. Bewley (ed): Advances in Economic Theory: Fifth World Congress. (Cambridge: Cambridge University Press). pp. 71-156.
Kaplow, L. 2005. The value of a statistical life and the coefficient of relative risk aversion. Journal of Risk and Uncertainty, 31(1), 23-34.
Kraus, A. and S.A. Ross, 1982. Fair profits for the property-liability insurance firm. The Journal of Finance, 37, 1015-1028.
Longley-Cook, A.G. 1998. Discussion of the paper of H.U. Gerber.and G. Pafumi, North American Actuarial Journal, 2, p. 92.
Levy, H. 1994. Absolute and relative risk aversion: An experimental study. Journal of Risk and Uncertainty, 8, 289-307.
Ogaki, M. and Q. Zhang, 2001. Decreasing relative risk aversion and tests of risk sharing. Econometrica, 69(2), 515-526.
Rothschild, M. and J. Stiglitz, 1976. Equilibrium in competitive insurance markets: An essay on the economics of imperfect information.. The Quarterly Journal of Economics, 90, 629-649.
Samuelson, P.A. 1963. Risk and uncertainty: A fallacy of large numbers. Scientia, pp. 46-54.
Siegel, F.W. and J.P. Hoban Jr., 1982. Relative risk aversion revisited. Review of Economics and Statistics, 64, 481–487.
TIPS, Tobacco information and prevention source, cigarette smoking-related mortality. http://www.cdc.gov/tobacco/mortali.htm
Walden, M.L. 1985. The whole life insurance policy as an options package: An empirical investigation. Journal of Risk and Insurance, 52, 44-58.