Embed Size (px)
DESCRIPTION
An Examination of Inflated Bank Capital and Credit Risks in China
Citation preview
Electronic copy available at: http://ssrn.com/abstract=2184082
An examination of inflated bank capital and credit risks in China
Yishu Fu
Business School, University of Adelaide
Email: [email protected]
Shih-Cheng Lee
Faculty of Finance, Yuan Ze University and Business School, University of Adelaide
Email: [email protected]
Lei Xu*
Business School, University of Adelaide
Email: [email protected]
Ralf Zurbruegg
Business School, University of Adelaide
Email: [email protected]
Abstract
Since the historical capital regulation by China Banking Regulatory Commission (CBRC) in
2004, Chinese banks have reported remarkable capital growth in their statements. This study
examines the impacts of heavily issued and cross-held subordinate debt (SD) towards inflated
capital adequacy ratios (CARs) and the credit risks of Chinese banks when they meet regulatory
requirements between 2004 and 2009. Our findings suggest that mandatory capital regulations in
China have significantly improved bank capital levels despite the widespread window-dressing
practice. In addition, the well-capitalised Chinese banks have lowered their credit risks in our
sample period. However, the undercapitalised banks may require more strict regulations.
Key words Subordinate debts, bank capital, risks, regulation, China
JEL Codes G21 G28
* Corresponding author. Postal address: Business School, University of Adelaide, 10 Pulteney
Street, Adelaide, SA 5005, Australia Tel: 61-8-83137272 Fax: 61-8-82234782
Electronic copy available at: http://ssrn.com/abstract=2184082
1. Introduction
Repeated banking crises during the past decades have pushed governments to attend closely the
capital and behaviour of banks. Prior to 1988, regulators across the world tend to set the
minimum ratio between capital and total assets in the hope that capital requirements could
enhance the stability of banking systems. One milestone is Basel I (1988) which develops a risk-
weighted framework and defines Tier 1 and Tier 2 capital. The world-wide adoption of Basel I
has resulted in Basel II (2004) in an attempt to set risks and management requirements in an
international background. The recent global financial crisis (GFC) in 2007 has brought renewed
attention to banking regulation and refined the regulatory benchmarks through Basel III (2010),
which focuses on the benchmarks over capital quality, risk coverage and liquidity.
However, despite continuously tightened regulatory requirements, banks may have exploited the
risk-weighted framework in Basel Accords. One example can be the innovative usage of
subordinate debts by Chinese banks. The effective capital level of Chinese banks diminishes
when they have cross subordinate debt holdings to seemingly increase individual bank‟s capital
cover. This widespread bank behaviour also increases the systematic instability of the system.
Through the improved capital quality requirement, Basel III has excluded such practice with
subordinate debts from effective Tier 2 capital. However, banks can still seek new
unconventional practice to circumvent the tightened regulations.
The growing importance of China in the new financial map after the GFC requires more study
over its banks. The banks control over 90% of aggregate financial resources in the second largest
world economy. More interestingly, the banks seem unaffected by worldwide financial crises
during the past decades. A literature review suggests that there are scarce of studies over bank
capital and risks in this country. Existing studies have focused on the non-performing loans
(NPLs) among Chinese banks (such as Bonin and Huang, 2001; Huang, 2002; Nanto and Sinha,
2002; Gamble, 2003; Gordon, 2003; Kwong and Lee, 2005; Xiao, 2006; Dobson and Kashyap,
2006; Ma, 2006; Xu and Lin, 2007; García-Herrero et al., 2009). A few studies have extend the
discussion to the operational risks, bank efficiency and state ownership reforms of Chinese banks
Electronic copy available at: http://ssrn.com/abstract=2184082
(such as Heilmann, 2005; Xie, 1999; Allen et al., 2005; Ferri, 2009; García-Herrero et al., 2009;
Fu and Heffernan, 2009; Matthews and Zhang, 2010; Shan and Xu, 2012; Ariff and Can, 2012;
Allen et al., 2012). In comparison to the considerable literature that examines the effects of
capital requirements among developed countries, little is known about the behaviour of Chinese
banks in response to mandatory capital requirements and their true capital levels.
The examination of Chinese banks‟ capital and risk behaviour may be of interest in several
aspects. First, this paper provides initiative empirical evidence on banking behaviour in today‟s
second largest economy in response to its historical capital regulation in the country. Second, this
study seeks to find reliable measurements of real capital status of Chinese banks. Due to the
limited size and scope of the capital markets in China, banks may have relied heavily on issuing
and cross-holding each other‟s subordinated debts so as to meet the regulatory capital
requirements. Although this window-dressing technique boost reported CARs, banks may have
not solved the fundamental problem of capital inadequacy at least to certain extent. Furthermore,
this banking practice increases the systemic risks. Third, this study may provide initial evidence
to explain a puzzle that despite the remarkable capital ratios reported by Chinese banks their
thirst for additional capital seems unquenched. Even when banks report CARs well above the
mandatory benchmarks, they still take all possible means to raise additional capital, such as
world-record IPOs, additional shares and rights, bringing noticeable impacts over stock markets
in the country. Fourth, this study over bank capital and risks may lead to further studies over
listed companies in China. Nowadays Chinese banks weigh over half of the market capitalisation
in the stock market and contribute to around 70% of total profits of all listed companies. We can
see more studies over the performance of Chinese listed companies in recent years, such as
Wang (2005) and Kao et al. (2009). However, most of these studies are focused on non-finance
companies by excluding the banks from their samples. Fifth, Chinese banks may differ from US
banks in their ability to adjust capital and risk. The regulatory pressure implied by capital
requirements may be stronger in China since it is the only country seemingly immune from the
recent GFC. In the meantime, most public-listed banks in China are either directly or indirectly
state-owned banks (SOB) and consequently have access to such government supports as capital
injections or bailouts. Sixth, effectiveness of capital regulation in the country can be examined.
Only after joining the World Trade Organization (WTO) has China started imposing
international standards over domestic institutions. Allen and Carletti (2008) suggest reducing the
amount of non-performing loans among the major banks to normal levels is the most important
task for the reform of financial system in the short run while the further development of China‟s
financial market is the most critical task in the long run. Berger et al. (2009) believe that
minority foreign ownership shows the significantly improved efficiency in banks‟ performance.
However, there has been a surprising lack of study in evaluating the effectiveness of government
regulations over its banks. Therefore, the important implications of this initial study may start
similar discussions for forthcoming researches.
In this study, we advance the concept of capital ratios to real capital ratios by eliminating the
effects of cross-holding SD among Chinese banks. Moreover, based on the simultaneous
equations model established by Shrieves and Dahl (1992), Rime (2001), and Van Roy (2008), we
analyse the corresponding adjustments in capital and risk by Chinese banks as they approach the
minimum regulatory capital level. Interestingly we find that mandatory capital regulations in
China have significantly improved bank capital levels despite the widespread window-dressing
practice. The well-capitalised Chinese banks have additionally lowered their credit risks in our
sample period when they meet regulatory capital requirements. However, the undercapitalised
Chinese banks may require more strict regulations.
This paper is structured as follows. Section 2 reviews the theoretical, empirical and latest
literature about bank capital requirements. Section 3 summarises the developments of capital
requirements in China, describes the information about SD issuance among Chinese commercial
banks and introduces the concept about the real capital ratio. Section 4 presents data and
methodology. Section 5 provides the empirical results. Section 6 concludes the paper.
2. Capital requirements and bank behaviour: Review of Literature
2.1 Mean-variance framework and option model
There have been two strands of literature on banks‟ risk levels. One strand focuses on the utility-
maximizing banks and investigates the impacts of higher mandatory capital ratios on banks‟
portfolio risks while the other strand explores the value-maximizing banks and reaches the
opposite conclusions.
The strand of literature focusing on utility-maximizing banks uses the portfolio approach in a
mean-variance framework (Pyle, 1971; Hart and Jaffee, 1974). Within this framework, Koehn
and Santomero (1980) examine the impacts on banks‟ portfolio risk when the regulator increases
the minimum capital to asset ratio. They find that the introduction of mandatory capital ratios
lead banks to shift their portfolio into riskier assets. In addition, this reshuffling effect may
become larger for banks that initially have more risky assets per unit of capital.
However, Furlong & Keeley (1989) and Keeley & Furlong (1990) challenge the above
conclusions. Their studies examine the impacts of more stringent capital regulation on bank asset
portfolio risk for value-maximizing banks based on an option model. Their results indicate that
incentives for value-maximizing banks to increase asset risk decline as the capital increases.
Their studies also suggest that the mean-variance framework is inappropriate because it does not
adequately explain the bank‟s investment opportunity set by ignoring the option value of deposit
insurance and the possibility of bank failure.
Unfortunately there are few studies providing non-US evidence over the changes of bank capital
and risks. Using confidential UK data, Ediz et al. (1998) find that banks adjust their capital levels
more than the difference between the current and the target level, implying that banks overset
their targets each year. Rime (2001) focuses on Swiss banks and provides a simultaneous
measurement over non-US banks. Heid et al. (2004) examine the relationship between capital
and risk levels by investigating German banks over 1993 to 2000. Their results suggest that
banks with low capital buffers tend to rebuild a sufficient capital buffer by decreasing risks and
increasing capital simultaneously. By contrast, banks with high capital may try to maintain their
capital buffer by increasing risk when capital increases. From the option-pricing perspective,
Sheldon (1996) examines the risk effects of capital rules within G-10 countries and figures out
that Basel I does not have risk-increasing impact on banks portfolio. However, very small banks
are selected to represent the sample from certain countries.
In short, economic theories are ambiguous on whether imposing tightened capital leads banks to
hold riskier asset in their portfolio. Existing studies additionally indicate that the market
discipline may also have impacts on the banks‟ response of capital and credit risks to the capital
regulations (Basel Committee on Banking Supervision 1999).
2.2 Adjustment cost and buffer theory
Provided with rigidities and adjustment costs, banks would never hold more capital than that
required by the regulators or by the market. However, banks may not be able to adjust capital or
risk instantaneously because of the adjustment costs or illiquid markets. In the case of
asymmetric information, raising additional equity could transmit a negative signal to the market
(Myers and Majluf, 1984), rendering banks unable or reluctant to react to negative capital shocks
instantaneously. Nevertheless, a breach of the regulation could trigger costly supervisory actions,
or even the bank‟s closure. Consequently banks have incentives to hold a “buffer” of excess
capital as an insurance against a violation of mandatory minimum capital requirement, especially
if the bank‟s capital ratio is quite volatile. Since raising capital is relatively costly compared to
raising insured deposits, this trade-off determines the optimum capital buffer (Milne and
Whalley, 2001). According to the buffer theory, banks would try to maintain a capital buffer in
excess of the regulatory minimum so as to avoid a breach of the minimum capital requirements.
Therefore, banks with high capital buffers would aim at holding their capital buffers while banks
with low capital buffers would aim at rebuilding an appropriate capital buffer.
2.3 Recent studies about the bank capital regulation
Apart from the increased capital and banks‟ risk-taking behaviour, recent studies have taken into
account other factors, such as the banks‟ financial performance, profitability and efficiency, in
the examination of capital regulation impacts. Lin et al. (2005) examine the relationship between
capital adequacy ratio, insolvency risk index and financial performances. Altunbas et al. (2007)
analyze the relationship between capital, risk and efficiency for European banks. Ngo (2008)
explores the relationship between banks‟ capital-risk decisions and their profitability. Deelchand
and Padgett (2009) discuss the performance and capital of cooperative banks in Japan. Fiordelisi
et al. (2011) analyze the inter-temporal relationships among banks‟ efficiency, capital and risk-
taking behaviour in the European Union countries.
Bank capital cover is also considered cyclical in nature. The macro-economic impacts brought
about by the increased capital standards are discussed in some recent studies. For example,
Nachane et al. (2006) suggest that whether monetary policy can be more or less effective in
influencing bank lending depends on a number of factors, such as whether banks are constrained
under the revised Basel Accord, the quality of bank loans and the liquidity of banks‟ balance
sheets. Heid (2007) examines the issues of capital-induced lending cycles and the pro-cyclical
effects on the macro-economy. Jokipii and Milne (2008) find that capital buffers co-move
negatively with the business cycle for banks in the EU but co-move positively for banks in the
accession countries.
3. CBRC Capital regulation and SD issuance in China
Capital requirement is a main banking supervisory instrument in China. For undercapitalised
banks, the CBRC has the authority to require the commercial bank to suspend all but low-risk
activities, suspend the building of new branches, and stop introducing new products or services.
For significantly undercapitalised banks, the CBRC can require removal of their senior
management, take over or even close the banks.
3.1 Recent developments in the capital regulation over Chinese banks
The capital inadequacy of Chinese banks has been subject to criticism for decades (such as Xie,
1999; Dobson and Kashyap, 2006; Xu and Lin, 2007). In 1994, the People‟s Banks of China
(PBC)1 set assessments to commercial banks including capital ratios. These capital ratios were
later covered by the Commercial Bank Law (1995). In the following years the PBC even worked
out more details on capital ratios allocating risk weights to various assets. However, these capital
ratios were introduced as reference to Chinese banks rather than mandatory regulation. Few
banks treated seriously the capital ratios as important financial indicators. It was lack of
1 Before the establishment of CBRC in 2003, PBC took charge of the supervision of Chinese banks.
mandatory regulation that resulted in the poor capital ratios when China joined the WTO in 2001.
China established the CBRC in 2003 to strengthen its finance industry and to avoid similar bank
failures in surrounding countries during the Asian Financial Crisis. The CBRC historically
introduced mandatory regulations over bank capital in the country in 2004. Based on both Basle I
and II, the CBRC bank capital regulations are curtailed for the Chinese banking sector.
According to the CBRC capital rules2, the measurement of bank capital adequacy ratios in China
can be shown as:
Capital adequacy ratio (CAR)
= (total capital – deductions) / (risk-weighted assets + 12.5 * capital charge for market risk)
= (total capital – deductions) / (credit risk-weighted assets + market risk-weighted assets)
= (total capital – deductions) / Total risk-weighted assets (1)
Core capital adequacy ratio (CCAR)
= (core capital – deductions) / (risk-weighted assets + 12.5 * capital charge for market risk)
= (core capital – deductions) / (credit risk-weighted assets + market risk-weighted assets)
= (core capital – deductions) / Total risk-weighted assets (2)
It is worth mentioning that in these equations, risk-weighted assets literally represent credit risk-
weighted assets. Chinese banks only disclose credit risk-weighted assets, market risk capital and
total risk-weighted assets (the sum of credit risk-weighted assets and market risk-weighted assets)
in their financial reports without reporting operational risk-weighted assets. In other words, the
total risk-weighted assets of Chinese banks do not include operational risk-weighted assets under
CBRC regulations.
Through various regulatory decrees and documents, such as the Regulation Rules over Foreign
Banks in China (2004)3 , the Provisional Rules over Risk Evaluation of Joint-Stock Commercial
2 CBRC 2004 No.2 Decree, Regulation Governing Capital Adequacy of Commercial Banks, February 23, 2004. 3 CBRC 2004 No. 4 Decree, Regulation Rules over Foreign Banks in China, July 26, 2004, Article 17
Banks (2004)4, the Guide of Corporate Governance and Relevant Regulation over State-Owned
Commercial Banks (2006)5 , and the Notice of Capital Adequacy Information Disclosure by
Commercial Banks (2009)6, the CBRC further strengthens capital adequacy requirements. In the
meantime, the CBRC capital requirements seem stricter than Basel Accords. In December 2009,
minimum CAR of 11% is imposed onto the largest Chinese banks7, and 10% for the small-and-
medium-sized banks.
In response to the tightened capital regulations, Chinese banks have since reported sharp
increased CARs. The CBRC statistics disclose the average CAR of -2.98%8 in 2003 (with 8
small-sized banks or 0.6% of all banks in the country meet Basel I capital requirement).
However, by 2009 all 239 commercial banks in the country have met CBRC minimum capital
requirements when their average CAR reach 11.4%, well above Basel I & II threshold. By 2010
all commercial banks in China have reported the average 12.2% CAR and 10.1% Core CAR9.
3.2 SD issuance in China
Provided with limited size and scope of capital markets in China, it is doubtful that Chinese
banks could achieve such remarkable capital improvements from negative level to above 10%
under tightened regulations. Although traditional approaches (such as capital injection or bailouts
by the government, issuing shares or convertible bonds, and offloading NPLs) do not bring much
controversy to bank capital, Chinese banks may have inventively issued SD above and beyond
reasonable amount to window-dress their capital ratios.
Table 1 summarises the SDs issued by Chinese banks between 2004 and 2009. We can see that
the large Chinese banks are the major issuers of SD in the interbank market. By comparison, the
aggregate SDs issued by small-and-medium-sized banks is less than half that of the four large
4 CBRC 2004 No. 3 Document, Provisional Rules over Risk Evaluation of Joint-Stock Commercial Banks, February 22, 2004 5 CBRC 2006 No. 22 Document, Guide of Corporate Governance and Relevant Regulation over State-owned Commercial Banks,
April 24, 2006, Article 20 & 23 6 CBRC 2009 No. 97 Document, Notice of Capital Adequacy Information Disclosure by Commercial Banks, November 7, 2009 7 They are the Industrial and Commercial Bank of China (ICBC), the Agricultural Bank of China (ABC), the Bank of China
(BOC), the China Construction Bank (CCB) and the Bank of Communications (BOCM). The ABC is listed in 2010 and therefore
not included in this study. 8 This happens when the difference between the capital and its‟ corresponding deduction, namely net capital, is less than zero. 9 Banking Capital Statistics, February 18th, 2011, CBRC Website
sized banks. As shown by Panel A, CCB ranks the top among the large banks in the amount of
SD outstanding. SD among all the listed banks increases sharply across the 2004-2009 sample
period. Panel B shows SD balance of small-and-medium-sized commercial banks. In 2009,
CMB10
and SPDB11
reduced their SD outstanding due to SD expiration while CMBC12
lowered
its SD balance because of redemption. Although NBCB does not issue SD during the sample
period, it is included in our sample because it holds around 800 million RMB SD of other banks
based on estimation by China International Capital Corporation Limited (CICC)13
.
Table1 here
3.3 Definition of real capital
In order to approximate the real capital level of Chinese banks, we apply the capital calculation
proposed by CBRC in August 200914
and exclude proportions of cross-held SD from Tier 2 bank
capital. This prudential measurement is strict against the banks‟ SD window-dressing tool but
unfortunately not carried out by CBRC in its mandatory regulations15
. Where data about SD
issuance and holdings are available, we would apply the CBRC method (the 2009 Enquiry) to
calculate real CAR. However, due to the scarce data source of SD holdings, we are forced to
discount banks‟ tier 2 capital and investments in securities simultaneously in this study.
According to CBRC, 51% of SD has been cross-held by other banks in the country by 2009 and
only 49% of SD could be regarded as qualified Tier 2 capital following the prudential
measurement. Therefore, each bank‟s real capital can be recalculated as:
(3)
10 CMB‟s 3,500 million RMB SD issued between March 31st and June 10th 2004 went expired in 2009. 11 SPDB‟s 6,000 million RMB SD issued on the June 9th 2004 went expired on the 8th July in 2009. 12 CMBC‟s 5,800 million RMB SD issued in 2004 was redeemed in advance in 2009. 13 NBCB‟s public announcement on September 28th 2009 indicated that 2,500 million RMB SD would be issued soon to
supplement its Tier 2 capital. 14 CBRC, 2009, Notice of Improving Commercial Banks‟ Capital Raising Mechanisms (Enquiry), August 18th 2009. This
Document does not acknowledge the wide-spread practice of cross-holding subordinate debts among Chinese banks. 15 CBRC, 2009, Notice of Improving Commercial Banks‟ Capital Raising Mechanisms, No. 90 Document. This Document
allows Chinese banks to adjust slowly capital ratios inflated by subordinate debts but prohibits banks to start new SD issuing and
cross-holding practice after 2009.
Since we have to adjust banks‟ capital and assets simultaneously, each bank‟s real capital
adequacy ratio (RCAR) can be recalculated by following equation16:
(4)
Similarly, each bank‟s real capital to total assets ratio (RCAP) can be recalculated as follows:
(5)
Comparisons between banks‟ real CAR and inflated CAR, and real CAP and inflated CAP are
provided by Table 2. The average banks‟ RCAR is 9.87%, which is almost 1% less than average
inflated CAR (10.63%). Similarly, the average RCAP from 2004 to 2009 is 5.66%, around 0.5%
less than the average inflated CAP (6.01%). Therefore, we can tell that Chinese banks do
substantially improve their reported CARs by commonly applying the window-dressing
technique through SD.
Table2 here
4. Data and Methodology
4.1 Data
Our sample covers all public-listed banks, including four large-sized and ten small-and-medium-
sized banks, in China between 2004 and 2009 with a total of 172 observations. All data are
manually collected from each bank‟s financial reports. Changes in capital and risk are measured
on quarterly basis, representing the highest frequency for which data is systematically available.
In our sample period, the listed banks are required by China Securities Regulatory Commission
16 CBRC, 2007, Decision of China Banking Regulatory Commission on Revising the Measures for the Management
of Capital Adequacy Ratios of Commercial Banks, No. 11 Document. This Document regulates 100% risk weight for SD.
(CSRC) to announce dual-audited financial reports17
. In addition, a few banks such as CCB and
ICBC are listed in our sample period.
4.2 Methodology
4.2.1 Simultaneous equations with partial adjustment framework
Considering that capital and risk decisions are determined concurrently, we use the simultaneous
model suggested by Shrieves and Dahl (1992), Rime (2001), and Van Roy (2008) to analyse
Chinese commercial banks‟ behavior in response to tightened capital regulation.
(6)
(7)
where and are the observed changes in capital and risk levels respectively for
bank i in period t; and are the discretionary adjustments in capital and risk
respectively; and are exogenously determined factors.
Since banks may not adjust their target capital ratio and risk levels instantaneously, we assume
that and follow a partial adjustment framework. Equation (6) and (7) suggest
that the discretionary changes in capital and changes in risk are proportional to the difference
between the target level in period t and the observed level in period t-1:
(8)
(9)
17 On November 14th 2000, CSRC regulated that listed banks shall have two accounting firms (at least one accounting firm must
be international) to audit their financial reports to avoid discrepancies in auditing practices. This regulation is no longer imposed
by CSRC since 2010.
where and
are bank i‟s target capital and risk levels, respectively.
Substituting equation (8) and (9) into equation (6) and (7), we can express the observed changes
in capital and risk as follows:
(10)
(11)
Therefore, the target capital and risk levels, the lagged capital and risk levels, as well as the
random exogenous shocks determine the adjustments in capital and risk.
4.2.2 Definitions of banks‟ capital and risk
We use two definitions of banks‟ capital: the total capital to assets ratio (CAP) and the total
capital to risk-weighted assets ratio (CAR). The former definition has been applied by Shrieves
and Dahl (1992). The latter has become more popular and many studies have employed CAR to
measure banks‟ capital since the application of risk-weighted capital standards (such as Jacques
and Nigro, 1997; Aggarwal and Jacques, 1998; Ediz et al., 1998; Cannata and Quagliariello,
2006; Saadaoui, 2011).
Academic literatures seem to cover various measurements over bank risks, most of which are
subject to criticisms over weaknesses. In this study, we measure bank risk-taking (RISK) with
credit risk ratio, the ratio of risk-weighted assets (RWA) to total assets (TA). This measurement is
first proposed by Shrieves and Dahl (1992) and subsequently used by Jacques and Nigro (1997),
Aggarwal and Jacques (1998), Rime (2001), Cannata and Quagliariello (2006), Van Roy (2008),
and Saadaoui (2011).
4.2.3 Variables affecting changes in capital and risk
Although it is not easy to observe directly the target capital and risk levels of a bank in equations
(10) and (11), these targets should depend on some sets of observable variables which describe
the bank‟s financial condition and the state of Chinese economy. We use the bank size (SIZE),
profitability (ROA), asset quality (LLOSS), changes in the credit risk ratio ( ), the degrees
of regulatory pressure (CARLOW and CARHIGH) and year dummies (YEAR) to approximate
the target capital to assets ratio ( . Besides, we employ SIZE, LLOSS, changes in the
capital to assets ratio ( ), CARLOW, CARHIGH, and YEAR to proxy the target credit risk
ratio ( ). Shrieves and Dahl (1992) use all these variables, except ROA which is emphasized
by Aggarwal and Jacqures (1998), and the regulatory pressure variables (RPL and RPG) which
are proposed by Aggarwal and Jacques (1998 & 2001), Godlewski (2005), Jacques and Nigro
(1997), Rime (2001) and Van Roy (2008).
Size
Bank size, measured by the natural log of total assets, is related to both bank‟s target capital and
risk. Size can affect target capital and risk level due to its relationship with risk diversification,
investment opportunities and access to equity capital markets.
Current profits
Current profits, measured by ROA, can affect the bank‟s target capital if the bank chooses to
increase capital through retained earnings rather than share offering. In the existence of
information asymmetry, equity issues could transmit negative signal about the bank‟s value to
the market.
Asset quality
Asset quality can affect the bank‟s target risk. This study uses the ratio of loan loss reserve to
total assets (LLOSS) to measure asset quality. LLOSS represents capital that the bank sets to
cover bad loans. Since increases in LLOSS lead to decreases in the risk-weighted assets, LLOSS
has negative effects in the risk equation.
Regulatory pressure
Previous studies use several ways to evaluate regulatory pressure. For example, Ediz et al. (1998)
apply a probabilistic approach with the dummy variable, which equals to one when the capital
adequacy ratio falls below the risk-based capital requirement plus one bank-specific standard
deviation of that bank‟s capital adequacy ratio series, and zero otherwise. However, their method
is not suitable for our study as the following two reasons. First, this study‟s sample data are
unbalanced. We need to use a different number of observations for each bank to calculate the
standard deviation of capital adequacy ratio, which is not appropriate. Second, this definition
implies that regulatory pressure is endogenous since bank behavior has influence on the
regulatory pressure (Van Roy, 2008).
Since Chinese banks with CARs above or below the regulatory requirement may react differently,
we partition regulatory pressure into two variables, CARLOW and CARHIGH, which can
recognise the nonlinear relationship between the regulatory capital standards and the changes
either in portfolio risk or capital ratios for both the undercapitalised and the adequately-
capitalised banks (Aggarwal and Jacques, 1998 & 2001; Godlewski, 2005; Jacques and Nigro,
1997; Rime, 2001).
The first regulatory pressure variable, CARLOW, equals to ( )
for banks with CAR below the regulatory RBC requirements and 0 otherwise. We use this
variable to study the reactions of undercapitalised banks to the increased capital standards. Banks
with positive CARLOW are subject to the regulatory pressure to enhance their capital ratios
because they fail to meet the minimum CBRC regulatory risk-based capital ratio. Thus, we
expect that CARLOW should have a positive effect on capital ratios and a negative effect on
portfolio risks, because banks may either increase capital or reduce risk-weighted assets to meet
the regulatory minimum risk-based standards.
Another regulatory pressure variable, CARHIGH, equals to (1/ -1/ ) for
banks with CAR above the peer market average and 0 otherwise. This variable is introduced to
examine the behaviour of the adequately-capitalised banks facing the binding capital
requirements. Although banks with CARs in excess of binding requirements are not explicitly
constrained by regulation, capital standards can still significantly influence banks‟ capital ratios
or risks in their portfolio of assets, banks may decrease their capital ratios or increase their
portfolio risk. Alternatively, these banks may choose to improve their capital ratios or reduce
risks to accumulate more buffers against shocks to equity in the future. By doing so, they can
signal to both the market and bank regulators so as to seek reduction in regulatory costs.
Simultaneous changes in risk and changes in capital
Since banks‟ capital and risk choices are interdependent, this study uses the simultaneous
equations to estimate them concurrently. Shrieves and Dahl (1992) claim that the relative
importance of the marginal benefits and marginal costs of asset risk and leverage will decide
whether changes in bank risk have a positive or negative relationship with the changes in bank
capital. When the bank‟s exploitation of the deposit insurance subsidy dominates the bank‟s
behaviour, we should observe a negative relationship between changes in risk and capital, and a
lasting trend toward lower capital and higher risk levels. However, some combination of
leverage and risk related cost factors would result in a positive relationship between the changes
in risk and the changes in capital.
Year dummy variables
In order to measure the effects of macroeconomic and regulatory shocks in any given year, the
simultaneous equations include dummy variables for each year, except 2004 to avoid perfect
multicollinearity.
Table 3 shows the mean values of above important variables for each of the six sub-periods. We
notice that Chinese banks have relatively high capital adequacy ratios either measured by RCAR
or CAR and very low ROA in our sample period. However, the RCARs and the CARs indicate
different regulatory pressure over banks while banks are under constant pressure to adjust their
capital levels. In the meantime, despite rapid expansion in banks sizes, Chinese banks have
lowered their loan loss provisions as another means to boost their capital ratios. In other words,
Chinese banks may have lowered their asset quality when they report historically high CARs.
Table 3 here
4.2.4 Empirical specification
With the analysis of above variables, the model defined by equations (10) and (11) can be
written as:
(12)
(13)
where i is a bank index (i=1,…,14)
t is a time index (t=2005,…,2009)
~IID (0, )
~IID (0 )
The emphasis of this study is on the regulatory pressure variables, denoted by CARHIGH and
CARLOW. Moreover, and test the overall relationship between changes in capital and risk.
We pool the cross-sectional data over the research period and use the three-stage least squares
(Jacques and Nigro, 1997; Aggarwal and Jacques, 1998; Rime, 2001; Van Roy, 2008) to estimate
the simultaneous equations (12) and (13). In short, this methodology can take into account the
simultaneity of banks adjustments in capital and risk and obtain asymptotically more efficient
estimates than the two-stage least squares.
5. Results
5.1 Results on RCAR and CAR
Table 4 provides the results of the simultaneous equations when we use the ratio of banks‟
capital (both real and inflated capital) to RWA and the ratio of RWA to total assets as dependent
variables. The left-hand part of Table 4 shows the results for the ratio of the real capital to RWA.
In the real capital equation, regulatory variables for adequately-capitalised banks (RCARHIGH)
has a significantly positive impact on the ratio of real total capital to RWA, which is consistent
with the findings by Haubrich and Wachtel (1993) in arguing the desire of well-capitalised banks
to signal both the market and bank regulators that they not only meet but clearly exceed the
minimum regulatory capital standards. Ceteris paribus, adequately-capitalised banks increase
their real capital ratio by 1.31 percents more than other banks, suggesting that CBRC risk-based
capital standard is effective in raising capital ratios among banks which are already incompliance
with the minimum risk-based standards. However, regulatory variable for undercapitalised banks
(RCARLOW) shows a negative and significant effect on banks‟ real capital level. Ceteris paribus,
undercapitalised banks decrease their real capital ratio by 0.2 percent more than other banks.
This result is not against the notion that risk-based capital has an impact on undercapitalised
banks. In fact, it indicates that mildly undercapitalised banks would experience relatively large
increases in their capital ratio either by raising capital or reducing risk-weighted assets, while the
most severely undercapitalised banks may experience relatively small increases in their capital
ratio. One possible explanation for this is that because constrained banks have the low ROA and
high expense of raising capital from external sources, severely undercapitalised banks may have
the extremely limited ability to meet the risk-based standards by raising capital, while mildly
undercapitalised banks may have been relatively more successful in raising their capital ratio. In
additions, most of Chinese banks are state-owned banks although they are undergoing the
process of partial privatization. The central government bailout and the almost zero possibility of
going bankruptcy give the capital-insufficient banks incentives to operate without actively
improving their poor capital positions. This result is consistent with the findings by Jacques and
Nigro (1997) that commercial banks which are deficient in risk-based capital, regulation have the
negative and significant effects on their capital ratios. In the controlling variables, SIZE has a
significantly negative impact, indicating that large Chinese banks increase the ratio of their
capital to RWA less than other banks. One plausible reason is that large banks can get access to
capital markets easily so that they can operate with lower capital. The Too-Big-to-Fail effect also
suggests that large banks feel less pressure to increase their capital ratio. The parameter on the
lagged capital is negative and significant, indicating that Chinese banks have adjusted their
capital ratios fast to desired levels since 2004.
In the risk equation, both regulatory variables RCARHIGH and RCARLOW have no significant
impact on banks‟ risk, suggesting that adequately-capitalised banks and undercapitalised banks
neither increased nor decreased the share of risk-weighted assets in their portfolio. The parameter
on lagged risk is negative and significant, indicating that Chinese banks were adjusting their risk
to desired levels fast from 2004 to 2009. All the time dummies in the equation are
significantly negative when RCAR is employed as the dependent variable. This result provides
evidence that banks in China decrease credit risk at the beginning of 2004, ceteris paribus.
Similarly, the right-hand part of Table 4 presents the results for the ratio of the inflated total
capital to RWA. All the variables in the system display the same sign and level of significance as
the measurement on banks‟ real capital ratio. Ceteris paribus, undercapitalised banks decrease
their capital ratio by 0.18 percent more than other banks while adequately-capitalised banks
increase their capital ratio by 1.31 percents more than other banks.
According to Table 4, changes in capital and credit risk are negatively and significantly related.
Specifically, Chinese banks adjust risk when capital changes but they do not adjust capital when
risk changes. In the case of relationship between RCAR and RISK, an increase of 1 percent in
the real capital ratio decreases the credit risk ratio by about 0.42 percent. This result indicates
that CBRC regulation is effective to limit adequately-capitalised banks‟ risk-taking behaviour.
However, this negative relationship between the changes in the real capital ratio and the changes
in the credit risk implicitly suggest that, binding capital requirements could cause the increase in
the portfolio risk for the under-capitalised banks. Comparisons with the previous empirical
studies, this discovery of negative relationship between the changes in the capital and risk is
consistent with the findings of Gunther and Robinson (1990), McManus and Rosen (1991),
Berger (1995), Jacques and Nigro (1997), Aggarwal and Jacques (1998), and Van Roy (2008).
The results from Aggrawal and Jacques (1998) indicate that an increase of 1% in the capital ratio
of banks causes a decrease of 0.058% in their credit risk in 1992 while an increase of 1% in the
credit risk ratio leads to a decrease of 0.476% in capital ratio, when the ratio of non-performing
loans to total assets is employed to measure the risk. The results on Japanese banks of Van Roy
(2008) suggest that an increase of 1% in the core capital-to-assets ratio of banks leads to a
decrease of 2.83% in the credit-risk ratio, assuming all other factors being equal. In other words,
Van Roy (2008) discovers that Japanese banks improve their tier one capital ratio by increasing
their tier 1 ratio and lowering their credit risk simultaneously. Shrieves and Dahl (1992) argue
that a negative correlation may result from the mispricing of deposit insurance. Jacques and
Nigro (1997) further argue that methodological flaws in the risk-based capital standards could
account for a negative relationship between risk and capital.
Table 4 here
5.2 Results on RCAP and CAP
Table 5 shows the results of the simultaneous equations when the ratio of banks‟ capital (both
real and inflated capital) to total assets and the ratio of RWA to total assets are used as dependent
variables. The left-hand part of Table 5 presents the result for RCAP. One of the regulatory
pressure variables, RCARHIGH has a significantly positive effect on capital but no impact on
risk. Ceteris paribus, adequately-capitalised banks increase their real capital by 0.52 percent
more than other banks. The other regulatory pressure variable RCARLOW has a significantly
negative impact on the ratio of real total capital to RWA but no impact on risk. Ceteris paribus,
undercapitalised banks decrease their real capital ratio by 0.09 percent more than other banks. In
the controlling variables, both SIZE and LLOSS have significant impacts with expected signs. In
the capital equation, SIZE has a significantly negative impact, indicating that large Chinese
banks increase the ratio of their capital to RWA less than other banks. In the risk equation,
LLOSS has a significant and negative impact on credit risk, reflecting banks‟ increased capital
for covering bad loans. The right-hand part shows the estimates for CAP. Similarly, CARHIGH
has a significantly positive impact on the banks‟ inflated capital level for adequately-capitalised
banks. Specifically, these banks increase the total inflated capital ratio by 0.48 percent more than
other banks.
With the respect of the overall relationship either between CAP and RISK or between CAP
and RISK, we observe a negative and significant relationship between changes in capital and
changes in risk. In the case of relationship between RCAP and RISK, an increase of 1 percent
in the real capital to assets ratio decrease the credit risk by about 1.24 percents while a same
increase in the credit risk ratio causes a decrease in RCAP by about 0.08 percent.
To sum up, CBRC capital regulations have a positive effect on the improvement of Chinese
banks‟ capital adequacy (both real and inflated capital) and the decrease in their risk-taking
behaviour for adequately-capitalised banks regardless of the effect of cross-holding SD.
However, our results are less conclusive about the impacts of the capital requirements on the
capital constrained banks.
Table 5 here
5.3 Robustness
In Sections 5.1 and 5.2, we examine the impacts of CBRC regulation on both real and inflated
capital ratios. In this section, core capital ratios are used for robustness check. Using the three-
stage least squares, we find that our estimation of the coefficients and the relationship between
the changes in the capital ratios and the changes in the credit risk level for Chinese banks, is
robust to alternative specifications.
Table 6 provides the results of the simultaneous equations when the ratio of banks‟ core capital
ratios and credit risk ratios are used as dependent variables. As noted, this alternative
specification yields similar estimations for Chinese banks. The left-hand part suggests that
CBRC regulation CCARHIGH has a positive effect on the capital ratios and the risk-taking
behaviour for adequately-capitalised banks. As for the undercapitalised banks, the regulation
pressure CCARLOW has no significant effect on both banks‟ capital ratio and credit risk-taking
behaviour. Regarding the overall relationship between the changes in capital ratios and that in
credit risk levels, a negative impact can be identified on the changes of capital ratios.
Specifically, Chinese banks adjust risk when their capital changes but they do not adjust capital
when risk changes. All other things being equal, an increase of 1 percent in bank‟s leads
to a decrease of 0.68 percent in the banks‟ . In the capital equation, most of the time
dummies, except that for 2005 and 2006, have significant positive effects on capital level,
suggesting that Chinese banks increase their target capital levels at the beginning of 2004.
Similarly, the right-hand part of Table 6 presents the results for the ratio of the core capital to
total assets. Most of the variables in the system display the same sign and level of significance as
the measurement on the ratio of core capital to RWA except for the changes in in the
capital equation, which shows a negative and significant effect on banks‟ core capital level as
well. Ceteris paribus, an increase of 1 percent in bank‟s leads to a decrease of around 0.06
percent in .
Table 6 here
6. Conclusion
This study initiatively explores the notion of real capital ratio by considering the cross-holding
portion of SDs and uses simultaneous measurements to examine how Chinese banks respond to
the regulatory capital regulations during the period 2004-2009. Our findings can be summarised
as follows. First, Chinese banks do improve their capital ratios by substantially cross-holding
other banks‟ SDs. Second, CBRC regulatory pressure has significant positive impacts on the
ratio of bank‟s capital to risk-weighted assets and the ratio of capital to total assets regardless of
the banks‟ window-dressing technique, without influencing bank‟s risk. This finding suggests
that Chinese banks may choose to increase the required capital through retained earnings or
equity issues, rather than adjusting the risk of their portfolio of assets. Third, our finding could
suggest the desire of adequately-capitalised banks to maintain larger buffers of capital and to
signal both regulators and market that they can clearly exceed the regulatory capital standards.
Fourth, changes in banks‟ credit risk and changes in capital ratios are significantly negatively
related, indicating that CBRC capital regulations are not only useful to improve capital level but
also helpful to limit risk-taking behaviour for adequately-capitalised banks. However, results for
the undercapitalised banks are not satisfying. More regulation should be implemented for the
undercapitalised banks.

In short, we can conclude that CBRC capital regulations are effective in increasing the capital
buffers for adequately-capitalised banks and in controlling their credit risk despite the window-
dressing through SDs. Our findings have rather important policy implications for that the capital
regulations have achieved to a large extent the desired effects on banks‟ capital and risk-taking
behaviour. This is consistent with the traditional view that Chinese regulators maintain rather
strict control over its financial institutions. However, the regulators‟ control has been weakened
by the common window-dressing practice and the risk-taking behaviour of undercapitalised
banks in the country.
References
Aggarwal, R. and K. Jacques. 1998. Assessing the impact of prompt corrective action on bank
capital and risk. Federal Reserve Bank of New York Policy Review 4: 23–31.
Aggarwal, R. and K. Jacques. 2001. The impact of FDICIA and prompt corrective action on
bank capital and risk: Estimates using a simultaneous equations model. Journal of Banking
and Finance 25: 1139-1160.
Altunbas, Y., S. Carbo, EPM. Gardener, and P. Molyneux. 2007. Examining the relationships
between capital, risk and efficiency in European banking. European Financial
Management 13: 49–70.
Allen, F., J. Qian, and M. Qian. 2005. Law, finance, and economic growth in China,
Journal of Financial Economics 77: 57-116.
Allen, F., and E. Carletti. 2008. Mark-to-market accounting and liquidity pricing, Journal of
Accounting and Economics 45: 358-378.
Allen, F., J. Qian, C. Shan, and M. Zhao. Forthcoming. The IPO of Industrial and Commercial
Bank of China and the „Chinese Model‟ of Privatizing Large Financial Institutions,
European Journal of Finance
Ariff, M. and L. Can. 2012. Cost and profit efficiency of Chinese banks: a non-parametric
analysis. China Economic Review 19: 260-273.
Basel Committee on Banking Supervision. 1999. Capital requirements and bank behaviour: The
impact of the Basel Accord. BIS Working Paper No. 1.
Berger, A.N. 1995. The Relationship between capital and earnings in banking. Journal of Money,
Credit, and Banking 27: 432-56.
Berger, A.N., I. Hasan, and M. Zhou. 2009. Bank ownership and efficiency in China: what will
happen in the world's largest nation? Journal of Banking and Finance 33: 113-130.
Bonin, J.P. and Y. Huang. 2001. Dealing with the bad loans of the Chinese banks.
Journal of Asian Economics 12: 197-214
Cannata, F. and M. Quagliariello. 2006. Capital and risk in Italian banks: A simultaneous
equation approach. Journal of Banking Regulation 7: 283-297.
Deelchand, T. and C. Padgett. 2009. The Relationship between risk, capital and efficiency:
evidence from Japanese cooperative banks. ICMA Centre Discussion Paper. DP 2009-12.
Dobson, W. and A.K. Kashyap. 2006. The contradiction in China's gradualist banking
reforms. Brookings Papers on Economic Activity 37: 103-148
Ediz, T., I. Michael, and W. Perraudin. 1998. Capital regulation and UK banks‟ behaviour.
Financial Stability Review 5, Bank of England.
Ferri, G. 2009. Are new tigers supplanting old mammoths in China's banking system? Evidence
from a sample of city commercial banks. Journal of Banking and Finance 33: 131-140.
Fiordelisi, F., D. Marques-Ibanez, and P. Molyneux. 2011. Efficiency and risk-taking in
European banking. Journal of Banking and Finance 35: 1315-1326
Fu, X. and S. Heffernan. 2009. The effects of reform on China's bank structure and performance.
Journal of Banking and Finance 33: 39-52
Furlong, F.T. and M.C. Keeley. 1989. Capital regulation and bank risk-taking: a note. Journal of
Banking and Finance 13: 883-891.
Gamble, W. 2003. Going Bust, Harvard International Review 25:54-57
García-Herrero, A., S. Gavilá, and D. Santabárbara. 2009. What explains the low profitability of
Chinese banks? Journal of Banking and Finance 33: 2080-2092.
Godlewski, C.J. 2005. Capital regulation and credit risk taking in emerging market economics.
Journal of Banking Regulation 6: 128-145.
Gordon, M.J. 2003. Is China's financial system threatened by its policy loans debt?
Journal of Asian Economics 14: 181-188
Gunther, J.W. and K.J. Robinson. 1990. Moral hazard and Texas banking in the 1980s: Was
there a connection? Federal Reserve Bank of Dallas Financial Industry Studies: 1-8.
Hart, O.D. and D.M. Jaffee. 1974. On the application of portfolio theory to depository financial
intermediaries. Review of Economic Studies 41: 129–47.
Haubrich, J.G. and P. Watchel. 1993. Capital requirements and shifts in commercial bank
portfolios. Economic Review, Federal Reserve Bank of Cleveland 29: 2-15.
Heid, F., D. Porath, and S. Stolz. 2004. Does capital regulation matter for bank behaviour?
Evidence for German savings banks. Discussion paper No. 03/2004, Deutsche Bundesbank.
Heid, F. 2007. The cyclical effects of the Basel II capital requirements. Journal of Banking and
Finance 31: 3885–3900.
Heilmann, S. 2005. Regulatory innovation by Leninist means: communist party supervision in
China's financial industry. China Quarterly 181: 1-21.
Huang, Y. 2002, Is meltdown of the Chinese banks inevitable? China Economic Review 13: 382-
387.
Jacques, K. and P. Nigro. 1997. Risk-based capital, portfolio risk, and bank capital: A
simultaneous equations approach. Journal of Economics and Business 49: 533-547.
Jokipii, T. and A. Milne. 2008. The cyclical behaviour of European bank capital buffers. Journal
of Banking and Finance 32: 1440–1451.
Kao, J.L., D.H. Wu, and Z.F. Yang. 2009. Regulations, earnings management, and post-IPO
performance: the Chinese evidence. Journal of Banking and Finance 33: 63-76.
Keeley, M.C. and F.T. Furlong. 1990. A re-examination of the mean-variance analysis of bank
capital regulation. Journal of Banking and Finance 14: 69-84.
Koehn, M. and A.M. Santomero. 1980. Regulation of bank capital and portfolio risk. Journal of
Finance 35: 1235-1244.
Kwong, C.C.L. and P.K. Lee. 2005. Bad loans versus sluggish rural industrial growth: a dilemma
of China‟s banking reform. Journal of the Asia Pacific Economy 10: 1-25.
Lin, S.L., J.H. Penm, S.C. Garg, and C.S. Chang. 2005. Risk based capital adequacy in assessing
on insolvency-risk and financial performances in Taiwan‟s banking industry. Research in
International Business and Finance 19: 111–153.
Ma, G. (2006), Who pays China‟s bank restructuring bill? CEPII Working Paper No. 2006–04.
McManus, D., and R. Rosen. 1991. Risk and capitalization in banking. In Rebuilding Banking,
Proceedings of the 27th Conference on Bank Structure and Competition, Federal Reserve
Bank of Chicago, 296-321.
Matthews, K. and X. Zhang. 2010. Bank productivity in China 1997–2007: measurement and
convergence. China Economic Review 21: 617-628.
Milne, A. and E. Whalley. 2001. Bank capital regulation and incentives for risk-taking. Mimeo.
City University Business School, London.
Myers, S.C. and N.C. Majluf. 1984. Corporate financing and investment decisions when firms
have information that investors do not have. Journal of Financial Economics 13: 187-221.
Nanto, D.K. and R. Sinha. 2002. China's banking reform, Post-Communist Economies 14: 469-
493
Nachane, D.M., S. Ghosh, and P. Ray. 2006. Basel II and bank lending behavior: some likely
implications for monetary policy. Economic and Political Weekly 41: 1053-1058
Ngo, PTH. 2008. Capital-Risk decisions and profitability in banking: Regulatory versus
economic capital. 21st Australasian Finance and Banking Conference 2008, Working
Paper Series.
Pyle, D.H. 1971. On the theory of financial intermediation. Journal of Finance 26: 737–47.
Rime, B. 2001. Capital requirements and bank behavior: Empirical evidence for Switzerland.
Journal of Banking and Finance 25: 789-805.
Saadaoui, Z. 2011. Risk-based capital standards and bank behavior in emerging and developed
countries. Journal of Banking Regulation 12: 180-191.
Shan, G. and L. Xu, 2012, Do Internal Governance Mechanisms Impact on Firm Performance?
Empirical Evidence from Financial Sector in China. Journal of Asia-Pacific Business 13:
114-142.
Sheldon, G. 1996. Capital adequacy rules requirements and the risk-seeking behaviour of banks:
a firm-level analysis. Swiss Journal of Economics and Statistics 132: 709-734
Shrieves, R.E. and D. Dahl. 1992. The relationship between risk and capital in commercial banks.
Journal of Banking and Finance 16: 439-457.
Wang, J. 2010. A comparison of shareholder identity and governance mechanisms in the
monitoring of CEOs of listed companies in China. China Economic Review 21: 24-37.
Xiao, G. 2006. Nonperforming debts in Chinese enterprises: patterns, causes, and implications
for banking reform. Asian Economic Papers 4: 61-113.
Xie, P. 1999. Bank restructuring in China. BIS Policy Papers 6, August: 124–129.
Xu, L. and C.T. Lin. 2007. Can Chinese banks compete after accession to WTO? Journal of
Asian Economics 18: 883-903
Van Roy, P. 2008. Capital requirements and bank behaviour in the early 1990: Cross-country
evidence. International Journal of Central Banking 4: 29–60.
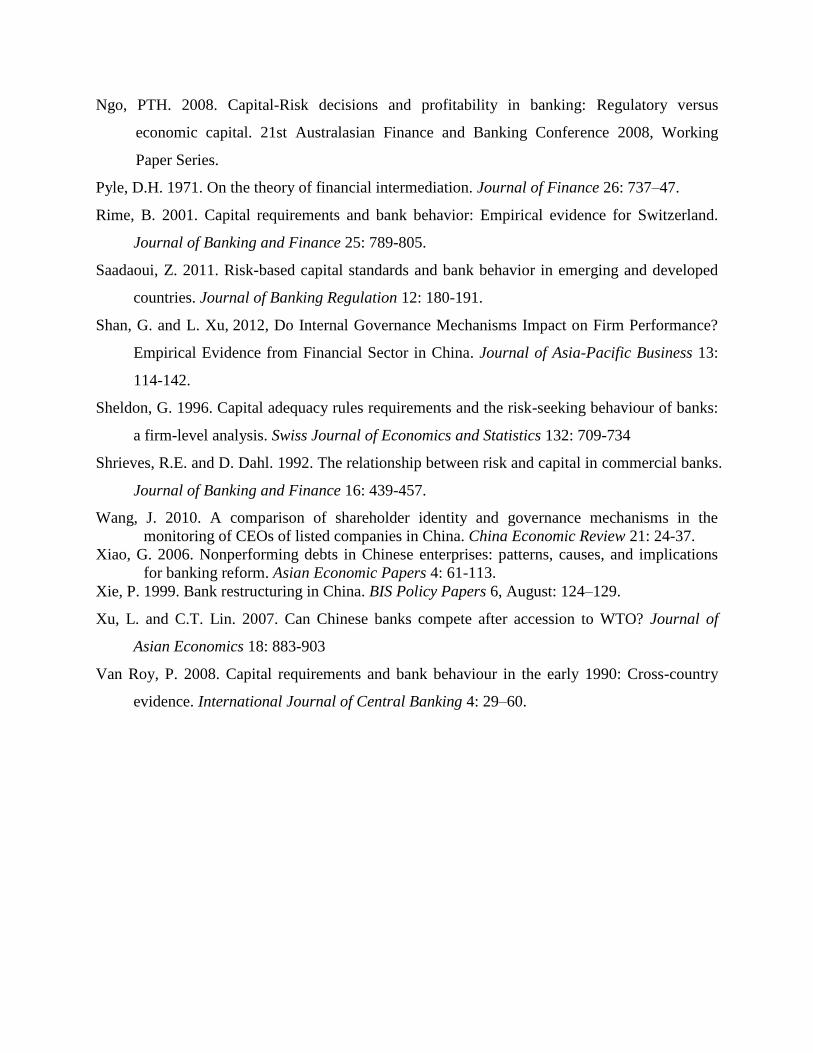
Appendix A: List of Abbreviations
PBOC The People‟s Bank of China
CBRC China Banking Regulatory Commission
CICC China International Capital Corporation Limited
ICBC Industrial and Commercial Bank of China Limited
BOCM Bank of Communication
CCB China Construction Bank
BOC Bank of China
BOB Bank of Beijing
NJCB Bank of Nanjing
CMBC China Minsheng Banking Corporate.Ltd
NBCB Bank of Ningbo
SPDB Shanghai Pudong Development Bank
HXB Huaxia Bank
CNCB China Citic Bank
CMB China Merchants Bank
SDB Shenzhen Development Bank
CIB Industrial Bank Co.Ltd
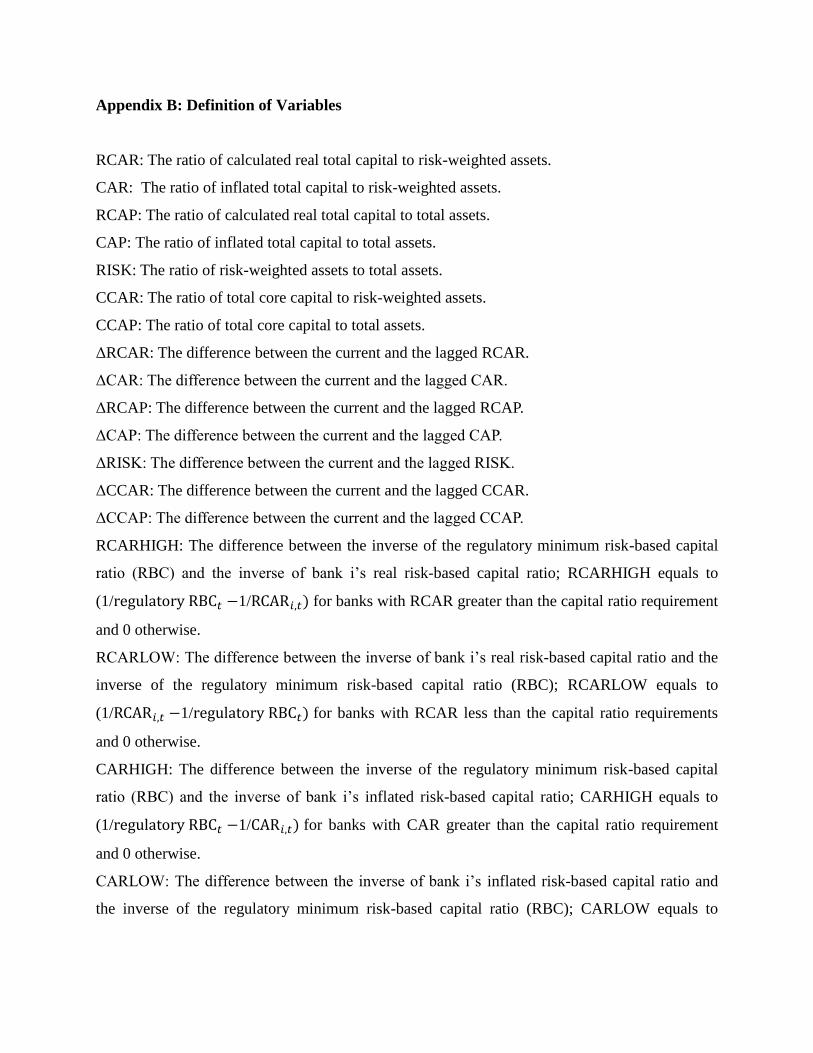
Appendix B: Definition of Variables
RCAR: The ratio of calculated real total capital to risk-weighted assets.
CAR: The ratio of inflated total capital to risk-weighted assets.
RCAP: The ratio of calculated real total capital to total assets.
CAP: The ratio of inflated total capital to total assets.
RISK: The ratio of risk-weighted assets to total assets.
CCAR: The ratio of total core capital to risk-weighted assets.
CCAP: The ratio of total core capital to total assets.
ΔRCAR: The difference between the current and the lagged RCAR.
ΔCAR: The difference between the current and the lagged CAR.
ΔRCAP: The difference between the current and the lagged RCAP.
ΔCAP: The difference between the current and the lagged CAP.
ΔRISK: The difference between the current and the lagged RISK.
ΔCCAR: The difference between the current and the lagged CCAR.
ΔCCAP: The difference between the current and the lagged CCAP.
RCARHIGH: The difference between the inverse of the regulatory minimum risk-based capital
ratio (RBC) and the inverse of bank i‟s real risk-based capital ratio; RCARHIGH equals to
(1/ 1/ for banks with RCAR greater than the capital ratio requirement
and 0 otherwise.
RCARLOW: The difference between the inverse of bank i‟s real risk-based capital ratio and the
inverse of the regulatory minimum risk-based capital ratio (RBC); RCARLOW equals to
(1/ 1/ for banks with RCAR less than the capital ratio requirements
and 0 otherwise.
CARHIGH: The difference between the inverse of the regulatory minimum risk-based capital
ratio (RBC) and the inverse of bank i‟s inflated risk-based capital ratio; CARHIGH equals to
(1/ 1/ for banks with CAR greater than the capital ratio requirement
and 0 otherwise.
CARLOW: The difference between the inverse of bank i‟s inflated risk-based capital ratio and
the inverse of the regulatory minimum risk-based capital ratio (RBC); CARLOW equals to

(1/ 1/ for banks with CAR less than the capital ratio requirements and
0 otherwise.
CCARHIGH: The difference between the inverse of the regulatory minimum risk-based core
capital ratio (core RBC) and the inverse of bank i‟s risk-based core capital ratio; CCARHIGH
equals to (1/ 1/ for banks with CCAR greater than the core
capital ratio requirement and 0 otherwise.
CCARLOW: The difference between the inverse of bank i‟s risk-based core capital ratio and the
inverse of the regulatory minimum risk-based core capital ratio (core RBC); CCARLOW equals
to (1/ 1/ for banks with CCAR less than the core capital ratio
requirement and 0 otherwise.
ROA: The ratio of net income to total assets.
SIZE: The natural log of total assets.
LLOSS: The ratio of loan loss reserve to total assets.
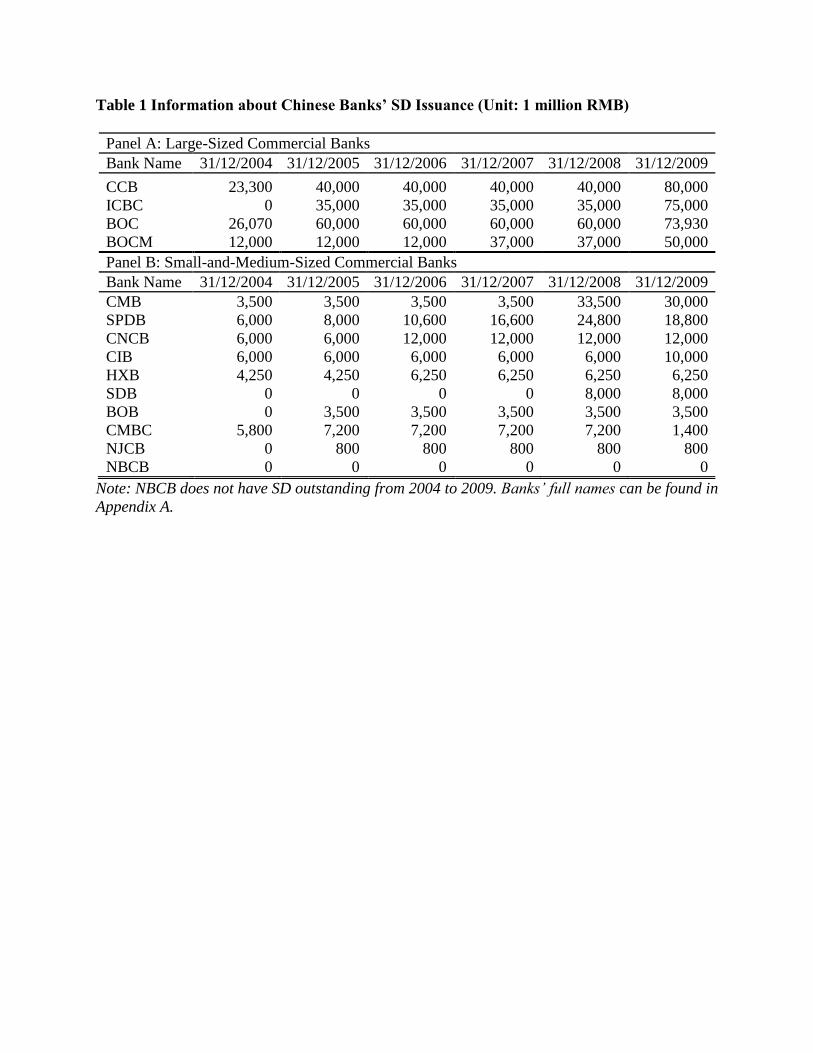
Table 1 Information about Chinese Banks’ SD Issuance (Unit: 1 million RMB)
Panel A: Large-Sized Commercial Banks
Bank Name 31/12/2004 31/12/2005 31/12/2006 31/12/2007 31/12/2008 31/12/2009
CCB 23,300 40,000 40,000 40,000 40,000 80,000
ICBC 0 35,000 35,000 35,000 35,000 75,000
BOC 26,070 60,000 60,000 60,000 60,000 73,930
BOCM 12,000 12,000 12,000 37,000 37,000 50,000
Panel B: Small-and-Medium-Sized Commercial Banks
Bank Name 31/12/2004 31/12/2005 31/12/2006 31/12/2007 31/12/2008 31/12/2009
CMB 3,500 3,500 3,500 3,500 33,500 30,000
SPDB 6,000 8,000 10,600 16,600 24,800 18,800
CNCB 6,000 6,000 12,000 12,000 12,000 12,000
CIB 6,000 6,000 6,000 6,000 6,000 10,000
HXB 4,250 4,250 6,250 6,250 6,250 6,250
SDB 0 0 0 0 8,000 8,000
BOB 0 3,500 3,500 3,500 3,500 3,500
CMBC 5,800 7,200 7,200 7,200 7,200 1,400
NJCB 0 800 800 800 800 800
NBCB 0 0 0 0 0 0
Note: NBCB does not have SD outstanding from 2004 to 2009. Banks’ full names can be found in
Appendix A.
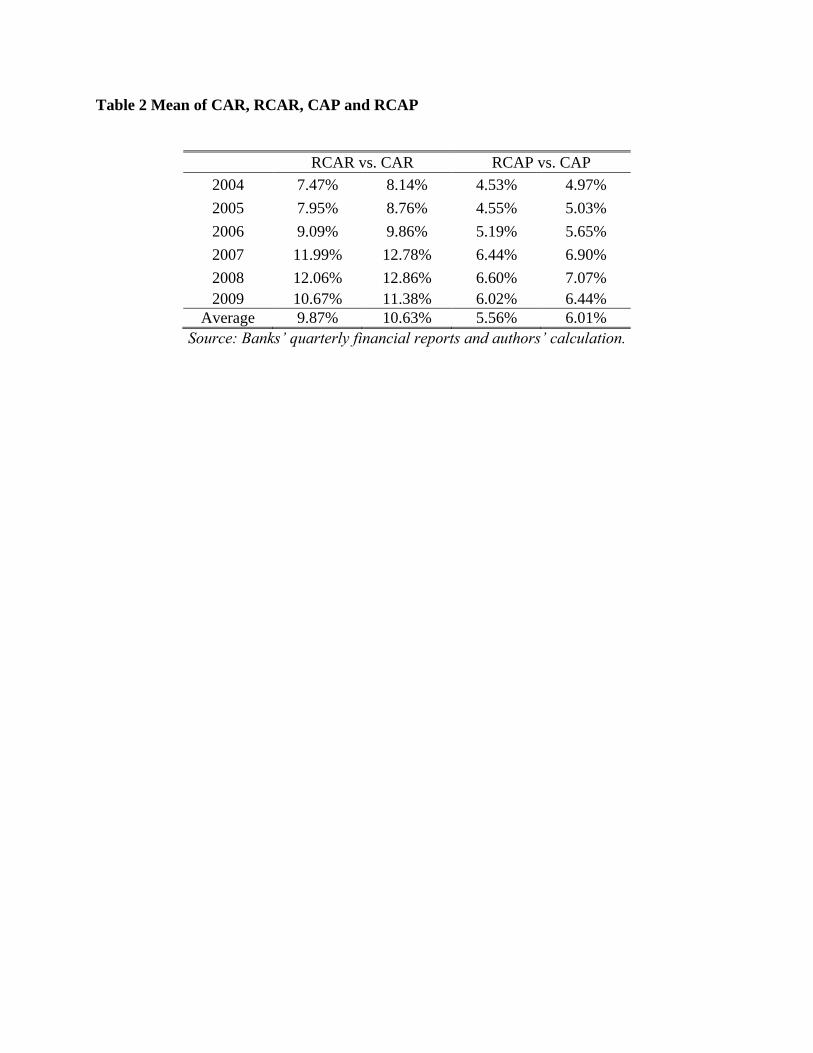
Table 2 Mean of CAR, RCAR, CAP and RCAP
RCAR vs. CAR RCAP vs. CAP
2004 7.47% 8.14% 4.53% 4.97%
2005 7.95% 8.76% 4.55% 5.03%
2006 9.09% 9.86% 5.19% 5.65%
2007 11.99% 12.78% 6.44% 6.90%
2008 12.06% 12.86% 6.60% 7.07%
2009 10.67% 11.38% 6.02% 6.44%
Average 9.87% 10.63% 5.56% 6.01%
Source: Banks’ quarterly financial reports and authors’ calculation.
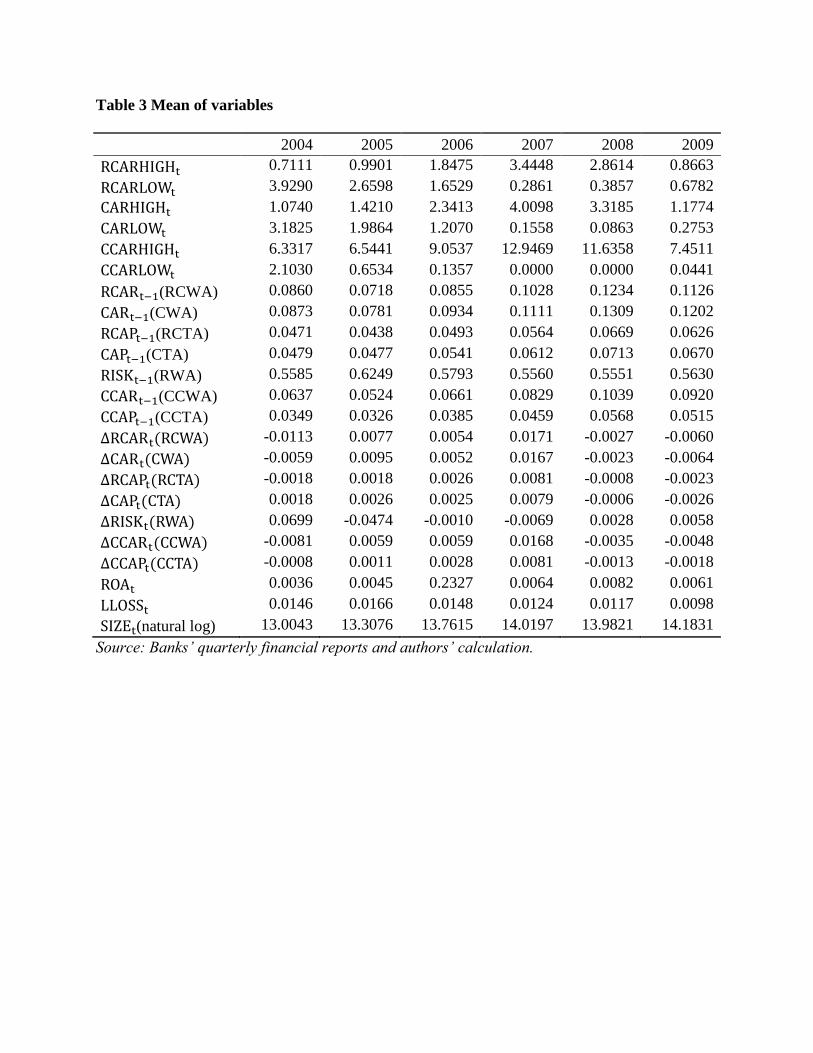
Table 3 Mean of variables
2004 2005 2006 2007 2008 2009
0.7111 0.9901 1.8475 3.4448 2.8614 0.8663
3.9290 2.6598 1.6529 0.2861 0.3857 0.6782
1.0740 1.4210 2.3413 4.0098 3.3185 1.1774
3.1825 1.9864 1.2070 0.1558 0.0863 0.2753
6.3317 6.5441 9.0537 12.9469 11.6358 7.4511
2.1030 0.6534 0.1357 0.0000 0.0000 0.0441
(RCWA) 0.0860 0.0718 0.0855 0.1028 0.1234 0.1126
(CWA) 0.0873 0.0781 0.0934 0.1111 0.1309 0.1202
(RCTA) 0.0471 0.0438 0.0493 0.0564 0.0669 0.0626
(CTA) 0.0479 0.0477 0.0541 0.0612 0.0713 0.0670
(RWA) 0.5585 0.6249 0.5793 0.5560 0.5551 0.5630
(CCWA) 0.0637 0.0524 0.0661 0.0829 0.1039 0.0920
(CCTA) 0.0349 0.0326 0.0385 0.0459 0.0568 0.0515
-0.0113 0.0077 0.0054 0.0171 -0.0027 -0.0060
-0.0059 0.0095 0.0052 0.0167 -0.0023 -0.0064
-0.0018 0.0018 0.0026 0.0081 -0.0008 -0.0023
0.0018 0.0026 0.0025 0.0079 -0.0006 -0.0026
0.0699 -0.0474 -0.0010 -0.0069 0.0028 0.0058
-0.0081 0.0059 0.0059 0.0168 -0.0035 -0.0048
-0.0008 0.0011 0.0028 0.0081 -0.0013 -0.0018
0.0036 0.0045 0.2327 0.0064 0.0082 0.0061
0.0146 0.0166 0.0148 0.0124 0.0117 0.0098
(natural log) 13.0043 13.3076 13.7615 14.0197 13.9821 14.1831
Source: Banks’ quarterly financial reports and authors’ calculation.
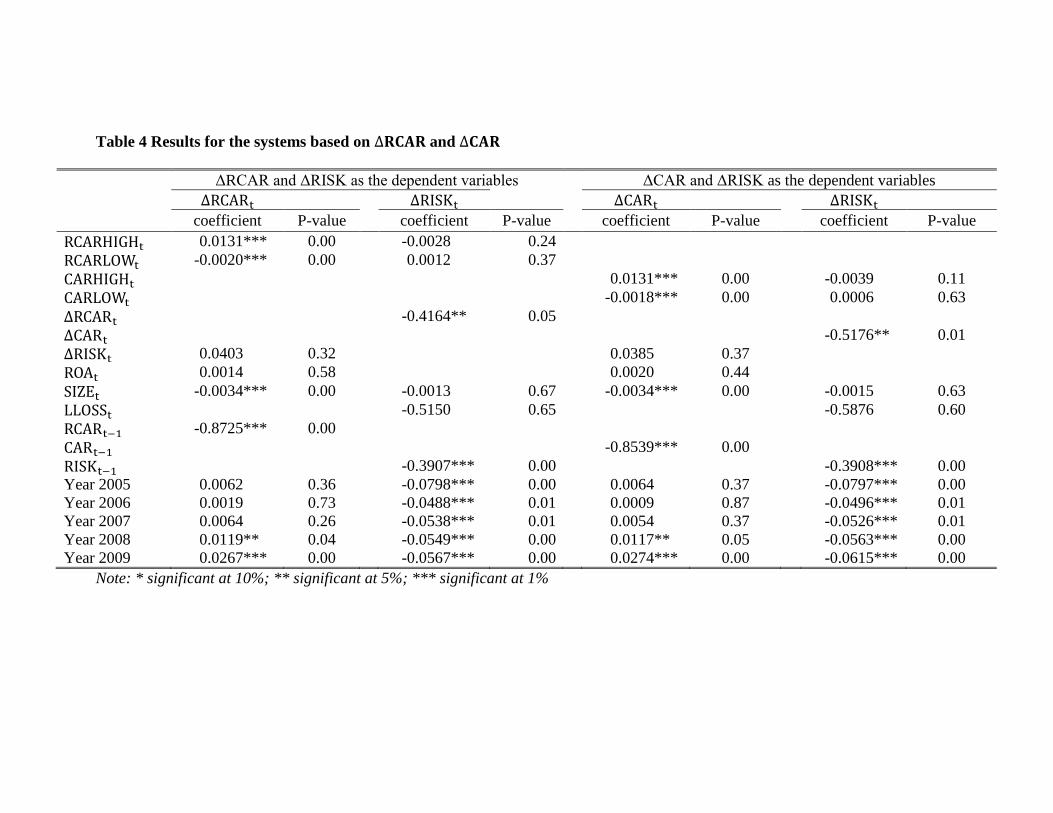
Table 4 Results for the systems based on and
ΔRCAR and ΔRISK as the dependent variables ΔCAR and ΔRISK as the dependent variables
coefficient P-value coefficient P-value coefficient P-value coefficient P-value
0.0131*** 0.00 -0.0028 0.24
-0.0020*** 0.00 0.0012 0.37
0.0131*** 0.00 -0.0039 0.11
-0.0018*** 0.00 0.0006 0.63
-0.4164** 0.05
-0.5176** 0.01
0.0403 0.32 0.0385 0.37
0.0014 0.58 0.0020 0.44
-0.0034*** 0.00 -0.0013 0.67 -0.0034*** 0.00 -0.0015 0.63
-0.5150 0.65 -0.5876 0.60
-0.8725*** 0.00
-0.8539*** 0.00
-0.3907*** 0.00 -0.3908*** 0.00
Year 2005 0.0062 0.36 -0.0798*** 0.00 0.0064 0.37 -0.0797*** 0.00
Year 2006 0.0019 0.73 -0.0488*** 0.01 0.0009 0.87 -0.0496*** 0.01
Year 2007 0.0064 0.26 -0.0538*** 0.01 0.0054 0.37 -0.0526*** 0.01
Year 2008 0.0119** 0.04 -0.0549*** 0.00 0.0117** 0.05 -0.0563*** 0.00
Year 2009 0.0267*** 0.00 -0.0567*** 0.00 0.0274*** 0.00 -0.0615*** 0.00
Note: * significant at 10%; ** significant at 5%; *** significant at 1%
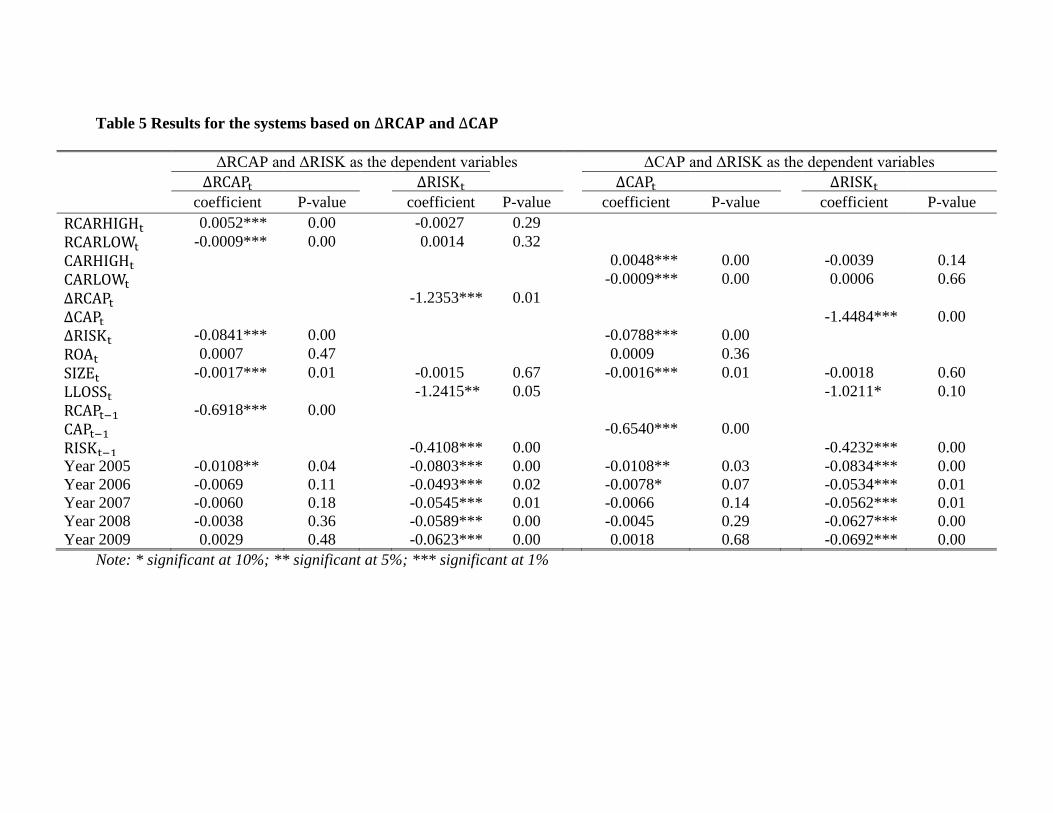
Table 5 Results for the systems based on and
ΔRCAP and ΔRISK as the dependent variables ΔCAP and ΔRISK as the dependent variables
coefficient P-value coefficient P-value coefficient P-value coefficient P-value
0.0052*** 0.00 -0.0027 0.29
-0.0009*** 0.00 0.0014 0.32
0.0048*** 0.00 -0.0039 0.14
-0.0009*** 0.00 0.0006 0.66
-1.2353*** 0.01
-1.4484*** 0.00
-0.0841*** 0.00 -0.0788*** 0.00
0.0007 0.47 0.0009 0.36
-0.0017*** 0.01 -0.0015 0.67 -0.0016*** 0.01 -0.0018 0.60
-1.2415** 0.05 -1.0211* 0.10
-0.6918*** 0.00
-0.6540*** 0.00
-0.4108*** 0.00 -0.4232*** 0.00
Year 2005 -0.0108** 0.04 -0.0803*** 0.00 -0.0108** 0.03 -0.0834*** 0.00
Year 2006 -0.0069 0.11 -0.0493*** 0.02 -0.0078* 0.07 -0.0534*** 0.01
Year 2007 -0.0060 0.18 -0.0545*** 0.01 -0.0066 0.14 -0.0562*** 0.01
Year 2008 -0.0038 0.36 -0.0589*** 0.00 -0.0045 0.29 -0.0627*** 0.00
Year 2009 0.0029 0.48 -0.0623*** 0.00 0.0018 0.68 -0.0692*** 0.00
Note: * significant at 10%; ** significant at 5%; *** significant at 1%
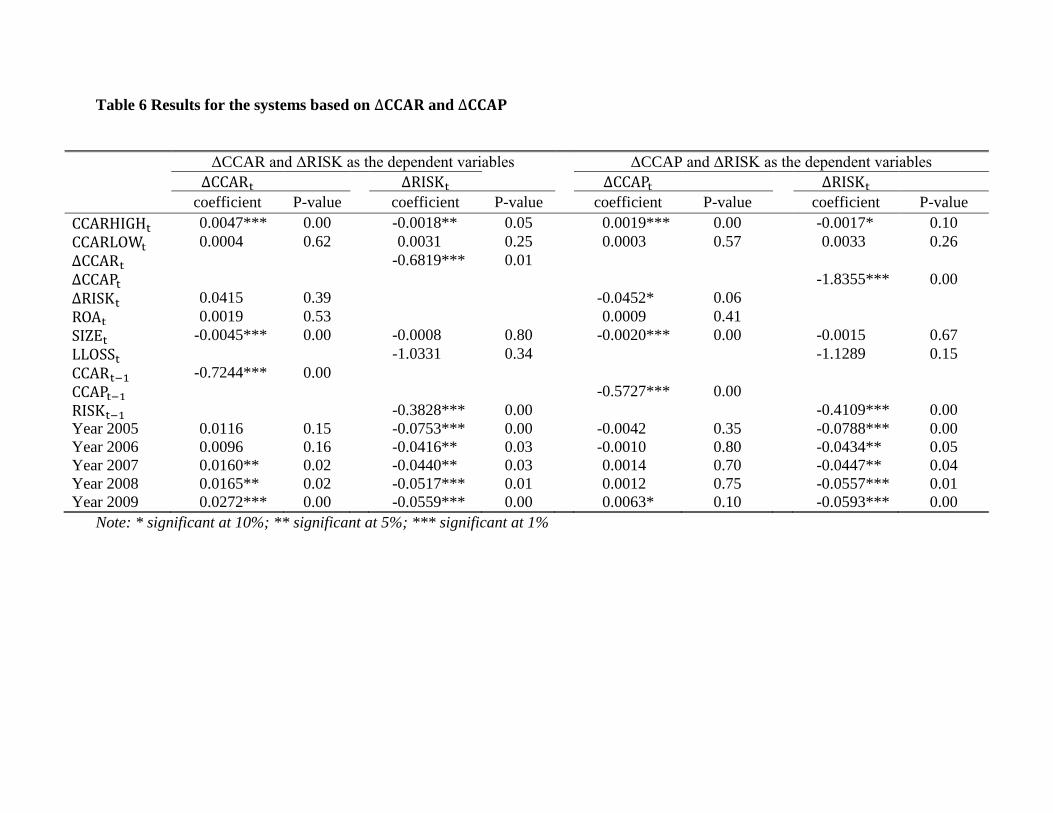
Table 6 Results for the systems based on and
ΔCCAR and ΔRISK as the dependent variables ΔCCAP and ΔRISK as the dependent variables
coefficient P-value coefficient P-value coefficient P-value coefficient P-value
0.0047*** 0.00 -0.0018** 0.05 0.0019*** 0.00 -0.0017* 0.10
0.0004 0.62 0.0031 0.25 0.0003 0.57 0.0033 0.26
-0.6819*** 0.01
-1.8355*** 0.00
0.0415 0.39 -0.0452* 0.06
0.0019 0.53 0.0009 0.41
-0.0045*** 0.00 -0.0008 0.80 -0.0020*** 0.00 -0.0015 0.67
-1.0331 0.34 -1.1289 0.15
-0.7244*** 0.00
-0.5727*** 0.00
-0.3828*** 0.00 -0.4109*** 0.00
Year 2005 0.0116 0.15 -0.0753*** 0.00 -0.0042 0.35 -0.0788*** 0.00
Year 2006 0.0096 0.16 -0.0416** 0.03 -0.0010 0.80 -0.0434** 0.05
Year 2007 0.0160** 0.02 -0.0440** 0.03 0.0014 0.70 -0.0447** 0.04
Year 2008 0.0165** 0.02 -0.0517*** 0.01 0.0012 0.75 -0.0557*** 0.01
Year 2009 0.0272*** 0.00 -0.0559*** 0.00 0.0063* 0.10 -0.0593*** 0.00
Note: * significant at 10%; ** significant at 5%; *** significant at 1%


![BAYESIAN INFERENCE FOR ZERO-INFLATED …scientificadvances.co.in/admin/img_data/562/images/[2] JSATA... · Keywords and phrases: Bayes, zero-inflated Poisson, regression analysis,](https://img.pdfslide.us/doc/110x75/5a78eb487f8b9ae6228ef3c1/bayesian-inference-for-zero-inflated-2-jsatakeywords-and-phrases-bayes.jpg)