Embed Size (px)
Citation preview
sustainability
Article
An Evolutionary Game Study of an EcologicalIndustry Chain Based on Multi-Agent Simulation:A Case Study of the Poyang Lake Eco-Economic Zone
Si-hua Chen
School of Information Technology, Jiangxi University of Finance and Economics, No.168, East Shuanggang Road,Chang bei, Nanchang 330013, China; [email protected]; Tel.: +86-135-7629-2649
Received: 7 April 2017; Accepted: 1 July 2017; Published: 4 July 2017
Abstract: With rapid economic growth, the ecological environment is subject to a huge test.The environment has become a bottleneck restricting the further development of the economy.Built on waste recycling, ecological industry chain is an important way to realize the sustainabledevelopment of economy and society. This paper establishes a three stage evolutionary game model ofecological industry chain. By mathematically analyzing the equilibrium points of replicator dynamicsequations, we get the evolutionary stable strategies. By studying the evolutionary rules and takingthe bottom-up modeling method, this paper constructs a multi-agent computational experimentalmodel to analyze the evolutionary paths and trend of each subject. Besides, the case of Poyang Lakeecological economic zone is applied to verify the evolutionary game model.
Keywords: eco-industrial chain; sustainability; ESS; multi-agent simulations
1. Introduction
Industries not only create wealth for human beings but also threaten people’s living environmentby producing billions of tons of pollutants. In some countries, such a contradiction even growsin depth [1]. Therefore, curbing environmental pollution and finding out a feasible way tofundamentally solve environmental problems is becoming a common concern for all around theworld. Currently, there are the following problems in environmental control: first of all, how toeffectively reduce the “industrial wastes” is the top priority of environmental control. For a long time,in the process of industrial production such problems as high energy and resource consumptionper unit product, and serious environmental pollution continue to develop and have not beeneffectively curbed. In China, in recent years the percentage of living pollution and agriculturalpollution keeps increasing. The majority of pollution comes from the industries, which accounts formore than 70% of the total pollutant emission [2]. Therefore, how to effectively curb the “industrialpollutants” and turn them into useful resources directly influences the development level of industries.Secondly, the traditional “End of Pipe (EOP)” approach refers to the development and application ofeffective pollution control technologies at the end of the production process. However, EOP does notinvolve in the effective use of resources and therefore cannot fundamentally solve the environmentalproblems [3]. At present, the main control measures of pollutant processing are undertaken byindividual enterprises. The mutual utilization of pollutants is seldom taken into account. In fact,the majority of “industrial pollutants” are very precious and useful resources, which have higheconomic values. Thirdly, as the subjects of protection most enterprises do not have high enthusiasmto control pollution. As we know, pollution control needs large investment. In addition, the failureof traditional way of environmental protection lies in the lack of connection between enterprises’economic returns and pollution control. Enterprises do not benefit from pollution control and hencetheir enthusiasm for environment protection is low [4].
Sustainability 2017, 9, 1165; doi:10.3390/su9071165 www.mdpi.com/journal/sustainability
Sustainability 2017, 9, 1165 2 of 27
Considering the above problems, people are striving to understand the complex operationmechanisms of natural ecological system and economic and social systems, and their interactivemechanism. The aim is to solve their contradiction and conflicts. Generally industrial productionhas great impact on environment. Hence, to solve the problem, the relationship between industrialproduction and natural environment is paid the highest attention. In addition, people begin toreconstruct the economic system according to the material recycling rule and energy flow rule ofnatural ecological system [5]. As such, the economic system can be taken into the recycling process ofnatural ecological system. With the practices the industrial ecological thought develops and graduallythe industrial ecology theory is formed.
As a new industrial mode, ecological industry imitates the material circulation process of naturalecology to plan industrial system. Ecological industry chain is the basic unit and the fundamentalfeature of ecological industrial system [6]. Ecological industry chain refers to the clustering ofenterprises in a region, which have industrial relationship and are linked by resources such as rawmaterial, by-products, information, capital and talents. These enterprises imitate the natural ecologicalsystem and respectively play the roles of producer, consumer and decomposer. Constructing ecologicalindustry chain to realize material circulation and energy cascade utilization is the core of modernecological industry. The ecological industry chain supports the benign operation of the whole ecologicalindustrial system. Once the chain is broken, the whole ecological industrial system will not exist.The effective operation of ecological industrial chain is the key for the stability and sustainability ofthe whole ecological industrial system [7,8].
It is agreed that the construction of ecological industry chain should follow the ecology theoryand rules. It should increase the economic returns of enterprises and at the same time produceenvironmental benefits. However, there are two main limitations concerning the current studies ofecological industry chain: one is that most models were built on the assumption that enterprises werecompletely rational. Nevertheless, in reality enterprises are operating in uncertainty and cannot havecomplete rationality. They adjust their behaviors based on continuous learning. The other is that thesestudies only considered the connection between upstream enterprises and downstream enterprises.The relationship of horizontal enterprises is seldom discussed.
This paper posits that the interest relationship of member enterprises in the ecological industrychain is a dynamic and repeated game process. All member enterprises are bounded rationality.Both upstream and downstream enterprises may conduct opportunistic behaviors. Each partyin the game cannot guarantee they can adopt the optimal strategy at the very beginning. In the processthey need continuous learning and adjustment to maximize their benefits. Therefore, in this paper webuild a phased three-person evolutionary game model of an ecological industry chain. This modelnot only discusses the game relationship between enterprises and the government but also analyzesthe evolutionary rules of both horizontal and vertical interest relationships between member enterprisesin the industry chain. Besides, it applies multi-agent experimental modeling method to simulatethe evolutionary paths.
2. Literature Review
By literature review, we find the current studies on ecological industry chain mainly centeredon two perspectives: the qualitative study of the formation of ecological industry chain andthe quantitative study of the planning of ecological industry chain.
2.1. Qualitative Study of the Formation of Ecological Industry Chain
As the formation mechanism of ecological industry chain is concerned, the traditional economictheory holds that industry chain can produce agglomeration economics effect by enterprise clustering,achieve economies of scale and economies of scope and therefore obtain competitive advantages.According to the market mechanism, the main inducements for enterprises to proactively clusterare: savings of transportation fee and energy, sharing of resource infrastructure, rapid flow of
Sustainability 2017, 9, 1165 3 of 27
information and cooperation of management [9]. The formation of ecological industry chain is drivenby the common need of enterprises for production factors. The driving force of ecological industrychain is basically the obtainment of economic benefits [10].
From the social and economic natures of enterprises in an ecological industrial park andthe constraints of decision-making, we can easily draw the same conclusion [11]. The transactionalcost theory of new institutional economy pointed out that the formation of ecological industry chainwas due primarily to the savings of transactional cost. By cost reduction, the enterprises mainlyadopt the cost leadership strategy to enhance competitiveness [12]. The formation of ecologicalindustry chain is a complex and systematic process. In the whole process, members of the chain seekan institutional arrangement to better utilize both internal and external resources of the industry chain.It contributes to achieving the competitive advantages by low cost or differentiation or both whileprotecting the environment as far as possible [13,14].
In the review, we can find that the ecological industry chains are often formed in the eco-industrypark (EIP) [15,16]. Eco-industry park is an industrial system which carefully plans the exchange ofraw material and energy. In the system, the sustainable development of economy, ecology and societyis realized by investing the least energy and raw material to achieve the minimization of production ofwastes [17,18].
2.2. Quantitative Study of Planning of Ecological Industry Chain
Using Kalundberg industrial ecology system as object, Bailey established a system dynamicresponse model. Based on it, he built a multi-objective linear programming model: the optimizationobjectives include minimizing the deviations between the supply and demand of materials amongmember enterprises, and minimizing the wastes of the whole system; the optimization variablesinclude various control variables such as steam generation rate and steam adjustment time [19].Wang Shuguang proposed a mixed integer non-linear programming model (MINILP) of minimumemission decision support system [20]. The objective functions include minimization of net wasteproduction, minimization of the park membership fee, maximization of net park income and creationof more job opportunities.
Chen Dingjiang introduced the logical expression constraints and nonlinear constraints and usedthe member model as a module. Through the link model, it forms different topological structures andEIP models. The member model mainly expresses the input and output relationship of material, energyand capital in the ecological industry chain. Apart from that, the link model introduces the logicalexpression to denote the link constraint relationship among EIP members and transforms it intoalgebraic inequality constraint consisting of integer variables and continuous variables [21,22].
The integrated scheme of ecological industry system derived from mathematical programmingmethod can guarantee the maximization of the benefits of the whole system. However, such schemeoften encounters obstacles in implementation. In the market economic environment, each enterprisecan make decisions by themselves. They can make their own response according to the changes ofexternal environment and their goal is to maximize their benefits. When their interests are in conflictswith the interests of the collective, if there is no compulsion (such as compulsion from the superiormanagement department), generally they will not conduct their behaviors based on the interests ofthe collective.
3. Evolutionary Game Analysis of Ecological Industry Chain
The studies on the game of ecological industry chain mainly focus on the game analysis ofthe upstream and downstream enterprises in the industrial chain and the game analysis of thespeculative behaviors of enterprises [23]. In this paper, we take Poyang Lake ecological zone as anexample to investigate. As we all know, the pollution in China is serious. As China’s largest freshwaterlake, the water quality of Poyang Lake is directly related to the water safety of 300 million peoplein the surrounding areas of Poyang Lake and even in the middle and lower reaches of the Yangtze
Sustainability 2017, 9, 1165 4 of 27
River. Therefore, the construction of Poyang Lake ecological zone has great significance and has risento the national strategy of China. As a result, it provides a lively example to study the ecologicalindustry chain. The author firstly reviewed the studies on ecological industry chain of Poyang Lakeeco economic zone and found that the universe network characteristics of the ecological industry chainin this region are: a structure with a large state-owned enterprises as the center and several privatesmall enterprises as the downstream enterprises. The large enterprises have very important positions inlocal employment and taxation. In addition, the leaders of some large enterprises are often concurrentlytaking the administrative duties of the government departments. With these initial impressions, theauthor went to Poyang Lake eco economic zone and conducted investigation. The author haveinterviewed the managers in charge of the production and sales departments of the large state-ownedupstream enterprise, the managers in charge of the production and procurement departments ofthe small private downstream enterprises, the local governmental administrative departments andthe relevant personnel of the environmental protection department. Through investigation, we foundthere were three outstanding problems: first, there is serious problem of stealthily discharging ofproduction enterprises; second, there is a shortage of the raw material of the downstream recyclingenterprises; third, the game relationship between enterprises is complicated [24–28].
Concerning the first problem, because of the high cost of pollution reduction, enterprises do notwant to buy recycling equipment, to make R&D or buy recycling technology and are inclined to takeopportunistic behaviors instead. The current solution is government supervision. Through monitoringand reporting of the masses, the government can learn about the waste disposal of enterprises andaccordingly decide whether to reward or punish them. However, the reality is that due to the legal andfinancial constraints, the incentives to enterprises are not enough to balance the investment of wastedisposal of enterprises. Thus, rewarding enterprises is often like adding brilliance to present splendor;government also will not severely exert penalties on enterprises. This is mainly because enterprisesemploy local residents and contribute tax revenues to the government. If penalties are large, enterprisesmay go into bankruptcy or go out of business, which will not be good to the government. In addition,enterprises know it quite well. So enterprises often have strong motives to discharge stealthily.
Concerning the second problem, first the downstream recycling enterprises should have basicprofits to survive. However, in actual situation the normal profits of the downstream recyclingenterprises are often not guaranteed (otherwise there will not be the first problem). Therefore, to ensurethe wastes are processed, the government often provides preferential tax policies so that the profitsof the downstream recycling enterprises can be guaranteed. In many cases, the government’spreferential measures are directly related to the quantity of wastes recycled. The production capabilityof the downstream recycling enterprises corresponds with the emission of the upstream enterprises.If the upstream enterprises stealthily discharge the wastes, then the downstream enterprises cannotget enough raw material, which influences the normal profits of the downstream enterprises.
Concerning the third problem, usually the market mechanism can decide whether to competeor cooperate. However, because of the uniqueness of the problem, that is, there is governmentintervention, the problem becomes more complex. This paper divides it into two aspects: firstlythe wastes of the upstream enterprises should be processed and turned into resources and then canbe provided to the downstream enterprises. Generally the resourced processing costs much more thansimple processing. In addition, although simple processing will cause punishment of the government,the penalties exerted are much smaller than those on stealthily discharge. So this is one of the reasonswhy the upstream enterprises do not have the motives to turn the wastes into resources. Secondly,the government often exercises restriction on the price of the resourced wastes so that it is beneficialfor the recycling enterprises. This is one of the main reasons why the upstream enterprises do not wantto turn the wastes into resources; secondly, the downstream enterprises will compete for the resourcedwastes. Such behaviors belong to the normal market competition.
Based on the above analysis, in the first round of game with the government, the possiblestrategies for the upstream enterprises are (stealthily discharge, recycle). The government has
Sustainability 2017, 9, 1165 5 of 27
two strategy choices in the game: to supervise the processing of the wastes and not to supervisethe processing of the wastes. If the upstream enterprises choose the latter one, then they willface the second round of game with the downstream enterprises and the possible strategies are(resourced processing, simple processing). In the horizontal game between the downstream enterprises,the possible strategies are (competition, cooperation). Because in real situation the subjects of the gamehave bounded rationality, it is impossible to find the optimal strategy at the beginning of the game.Usually in the process of market competition and through learning and adjustment enterprises canfind out the optimal strategies.
The ecological industry chain in the Poyang Lake ecological economic zone is a typical upstreamcontrol chain. The upstream resource-based enterprises are the key of the whole industry chain. In suchecological industry chain, the downstream enterprises depend much on the supply of the resourcedwastes provided by the upstream enterprises while the upstream enterprises are selective to supplythe resourced wastes to the downstream enterprises. Directed by the supply of resources, the upstreamenterprises will rationally select the downstream enterprises. Hence, there are three fundamentalrelationships in the game of ecological industry chain, that is, the game between enterprises andthe government, the vertical cooperation game between the upstream and downstream enterprisesand the horizontal co-opetition game among the downstream enterprises.
3.1. Evolutionary Game between Enterprises and the Government
According to the above analysis, we can know that in the first round of the game the upstreamenterprises have two strategies: to dispose the wastes or not to dispose the wastes; the governmenthas two strategies: to supervise or not to supervise. The enterprises need to pay extra cost to disposethe wastes and the government needs to pay cost to supervise. If the government finds the enterprisesare discharging wastes stealthily, then it will punish the enterprises; if not, it will reward the enterprises.The stealthy discharging of the enterprises will influence the reputation of the government. Besides,it may cost the government to curb the pollution. In addition, the penalties exerted by the governmentwill lead to the decrease of economic returns of the enterprises. As a result, it will bring negative impacton the government in employment and tax revenues. We treat the three negative influences as the costof the government to curb pollution when the enterprises stealthily discharge the wastes. We assume:the enterprises may try to hide their stealthy discharging behaviors. Hence, if the governmentdoes not supervise and the society has not discovered the discharges, then it will not influencethe government’s reputation.
The definitions of variables see Table 1.
Table 1. Relevant variables.
Variables Definitions
c1 Cost of enterprises to dispose wastesp1 Incentives to enterprises when the government monitors the waste disposal of enterprisesp2 Reputation benefits of enterprises to dispose wastes, such as the improvement of brand valuec2 Cost of government supervisionc3 Penalties on enterprises when the government finds enterprises not disposing wastesc4 Cost of the government to control pollutionc5 Reputation loss of enterprises not to dispose wastes
Therefore, the payoff matrix of the game between the government and enterprises see Table 2.We suppose the enterprises to dispose the wastes account for x and the enterprises not to dispose
the wastes account for 1− x. The government to supervise the enterprises discharging the wastesaccounts for y while the government not to supervise accounts for 1− y.
Sustainability 2017, 9, 1165 6 of 27
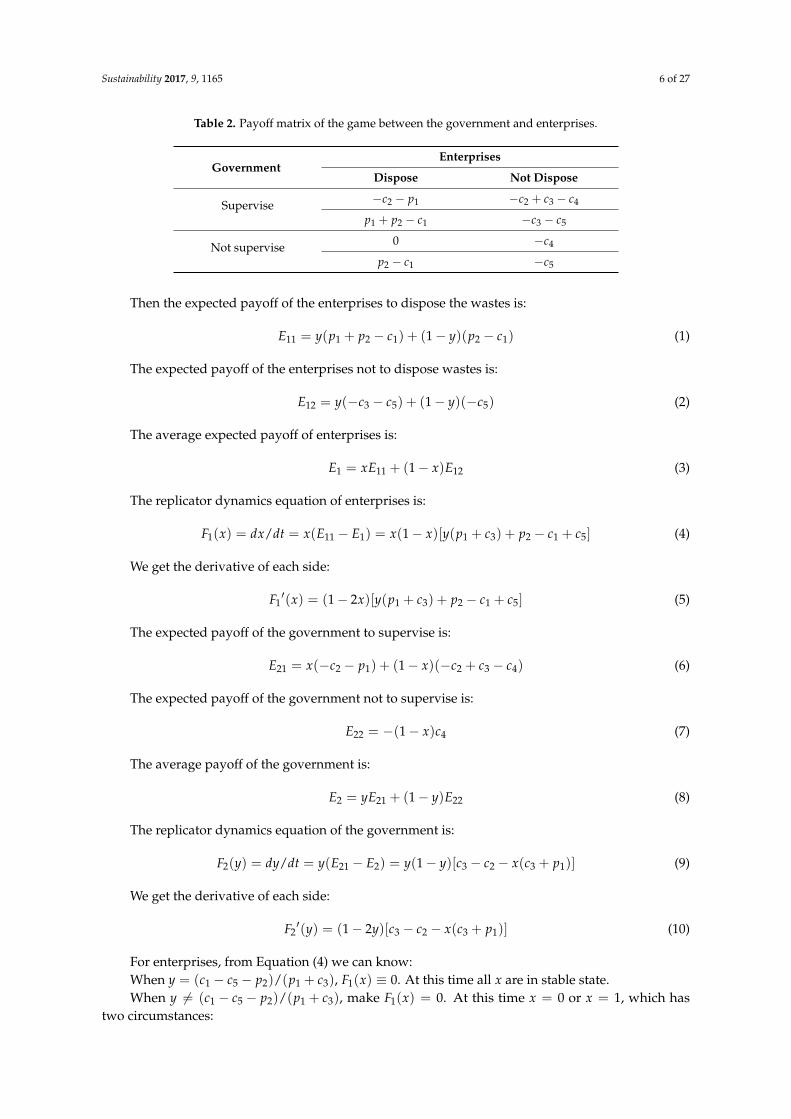
Table 2. Payoff matrix of the game between the government and enterprises.
GovernmentEnterprises
Dispose Not Dispose
Supervise −c2 − p1 −c2 + c3 − c4
p1 + p2 − c1 −c3 − c5
Not supervise 0 −c4
p2 − c1 −c5
Then the expected payoff of the enterprises to dispose the wastes is:
E11 = y(p1 + p2 − c1) + (1− y)(p2 − c1) (1)
The expected payoff of the enterprises not to dispose wastes is:
E12 = y(−c3 − c5) + (1− y)(−c5) (2)
The average expected payoff of enterprises is:
E1 = xE11 + (1− x)E12 (3)
The replicator dynamics equation of enterprises is:
F1(x) = dx/dt = x(E11 − E1) = x(1− x)[y(p1 + c3) + p2 − c1 + c5] (4)
We get the derivative of each side:
F1′(x) = (1− 2x)[y(p1 + c3) + p2 − c1 + c5] (5)
The expected payoff of the government to supervise is:
E21 = x(−c2 − p1) + (1− x)(−c2 + c3 − c4) (6)
The expected payoff of the government not to supervise is:
E22 = −(1− x)c4 (7)
The average payoff of the government is:
E2 = yE21 + (1− y)E22 (8)
The replicator dynamics equation of the government is:
F2(y) = dy/dt = y(E21 − E2) = y(1− y)[c3 − c2 − x(c3 + p1)] (9)
We get the derivative of each side:
F2′(y) = (1− 2y)[c3 − c2 − x(c3 + p1)] (10)
For enterprises, from Equation (4) we can know:When y = (c1 − c5 − p2)/(p1 + c3), F1(x) ≡ 0. At this time all x are in stable state.When y 6= (c1 − c5 − p2)/(p1 + c3), make F1(x) = 0. At this time x = 0 or x = 1, which has
two circumstances:
Sustainability 2017, 9, 1165 7 of 27
(1) When y < (c1 − c5 − p2)/(p1 + c3), then F1′(x)x=0 < 0. So x = 0 is the equilibrium point.
(2) When y > (c1 − c5 − p2)/(p1 + c3), then F1′(x)x=1 < 0 and x = 1 is the equilibrium point.
For the government, from Equation (9) we can know:When x = (c3 − c2)/(p1 + c3), F2(y) ≡ 0. At this time all y are in stable state.When x 6= (c3 − c2)/(p1 + c3), make F2(y) = 0. At this time y = 0 or y = 1, which has
two circumstances:(1) When x < (c3 − c2)/(p1 + c3), then F2
′(y)y=1 < 0 and y = 1 is the equilibrium point.(2) When x > (c3 − c2)/(p1 + c3), then F2
′(y)y=0 < 0 and y = 0 is the equilibrium point.Based on the above analysis, the equilibrium points of the replicator dynamics equation is (0,0),
(0,1), (1,0), (1,1), ((c3 − c2)/(p1 + c3), (c1 − c5 − p2)/(p1 + c3)). The stability of the equilibrium pointscan be drawn from the analysis of the local stability of Jacobian matrix [29,30]. The Jacobian matrix is:
J1 =
((1− 2x)[y(p1 + c3) + p2 − c1 + c5] x(1− x)(p1 + c3)
y(1− y)(p1 + c3) (1− 2y)[c3 − c2 − x(c3 + p1)]
)(11)
In each equilibrium point, the determinant and trace of the Jacobian matrix as well as the resultsare shown in Table 3.
Table 3. Stability analysis of the game between enterprises and the government.
Equilibrium Point Determinant Value Trace Value
0,0 (p2 − c1 + c5)(c3 − c2) c3 + c5 + p2 − c1 − c20,1 (p1 + c3 + p2 − c1 + c5)(c2 − c3) c2 + c5 + p1 + p2 − c11,0 (c5 + p2 − c1)(c2 + p1) c2 + c5 + p1 + p2 − c11,1 (c1 − c3 − c5 − p1 − p2)(c2 + p1) c1 + c2 − c3 − c5 − p2
c3−c2p1+c3
, c1−c5−p2p1+c3
A1B1C1D1
(p1+c3)2
A1B1+C1D1(p1+c3)
Note: A1 = c3 − c2, B1 = p1 + c2, C1 = c1 − c5 − p2, D1 = c1 − c3 − c5 − p1 − p2.
According to investigation and interviews, generally the cost of the enterprises to disposewastes is very high, which is far more than the aggregate of the reputation benefits of enterprisesto dispose wastes and the reputation loss of enterprises not to dispose wastes. Otherwise, there is noneed of the government to supervise and the enterprises will proactively dispose wastes. Hence,p2 − c1 + c5 < 0. The penalties exerted by the government on the violation enterprises are bigger thanthe cost of government supervision. Otherwise, the government will try its best to reduce supervision.Hence, c3 − c2 > 0. For (0,0), the determinant value is smaller than 0. No matter its trace is biggerthan 0, it is not the evolutionary stable strategy (ESS). However, if the penalties on the violationenterprises is small or even smaller than the cost of government supervision, then c3 − c2 < 0. That is,the determinant value is bigger than 0 and at the same time c3 + c5 + p2− c1− c2 < 0. Then (0,0) is ESS.
For (0,1), generally p1 + c3 + p2 − c1 + c5 > 0. If the value is smaller than 0, then enterprises willnot dispose the wastes no matter how the government supervises them. Based the above analysis,c3− c2 > 0 and hence the determinant value is smaller than 0. So it is not ESS. For (1,0), the determinantvalue is smaller than 0. So it is not ESS. For (1,1), the determinant value and the trace of the determinanthave the same sign. So it is not ESS.
3.2. Vertical Evolutionary Game between the Upstream and Downstream Enterprises
Based on the analysis, we know there are two choices for the upstream enterprises to disposewastes. One is to make primary processing until the wastes are harmless. Usually such processedwastes cannot reach the requirement of the downstream enterprises. The downstream enterprisesmust make further processing and then they can be used as raw material; another is to turn the wastesinto resources and provide them to the downstream enterprises. In addition, the downstreamenterprises can directly use them to produce. The downstream enterprises also have two choices,that is, to accept the wastes of the upstream enterprises or not to accept. If the upstream enterprises
Sustainability 2017, 9, 1165 8 of 27
process the wastes and turn them into resources, the government will provide some subsidies tomotivate them. When the downstream enterprises accept the wastes of the upstream enterprises,the government will also provide some subsidies.
For the definitions of variables see Table 4.
Table 4. Relevant variables.
Variables Definition
p3Subsidy incentives of the government to the upstream enterprises for turning the wastesinto resources
p4Subsidy incentives of the government to the downstream enterprises for acceptingthe resources of the upstream enterprises
p5Benefits of the upstream enterprises to turn wastes into resources, that is, cost ofthe downstream enterprises to procure the resourced wastes
p6 Benefits of the downstream enterprises to utilize wastes
p7Benefits of the upstream enterprises to simply process the wastes, that is, cost ofthe downstream enterprises to procure the simply processed wastes
c6 Cost of the upstream enterprises to turn the wastes into resources
c7 Cost of the upstream enterprises to simply process the wastes
c8 Negative externality of the upstream enterprises to simply process the wastes
c9Cost of the downstream enterprises to turn the simply processed wastes intoproducible resources
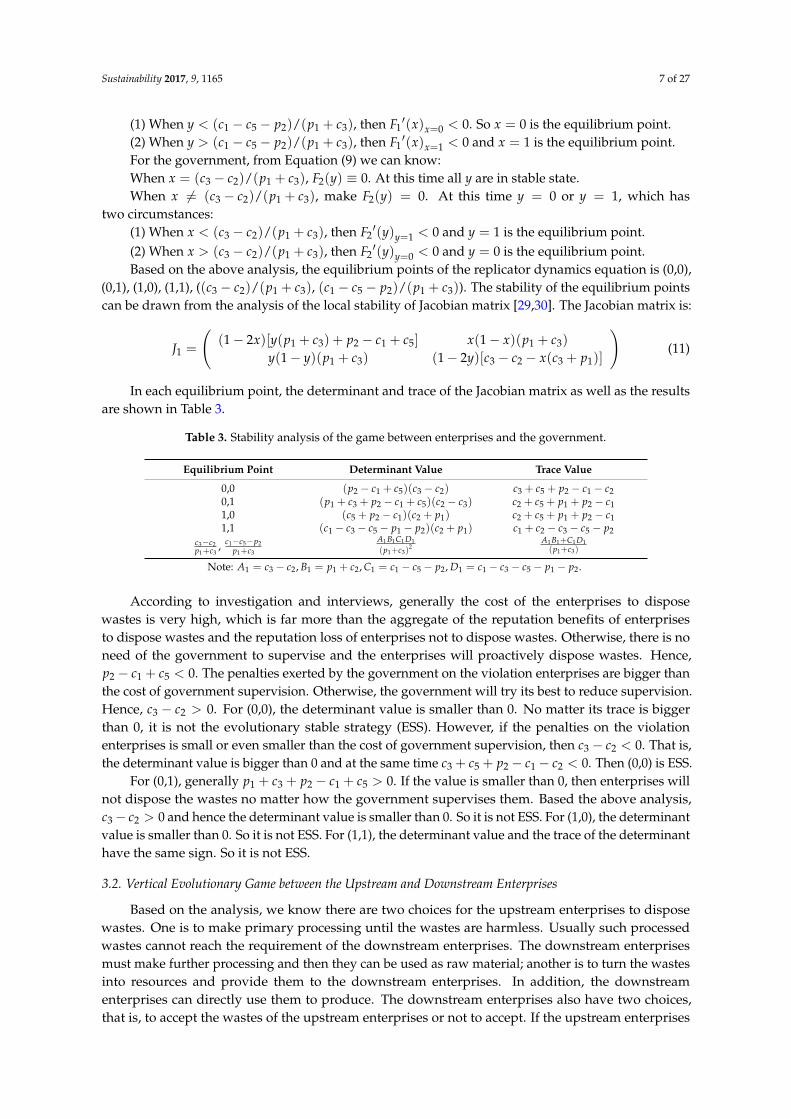
Therefore, the payoff matrix of the game between the upstream enterprises and the downstreamenterprises see Table 5.
Table 5. The payoff matrix of the game between the upstream enterprises and the downstream enterprises.
Downstream EnterprisesUpstream Enterprises
Resourced Processing Simple Processing
Accept p4 + p6 − p5 p4 + p6 − p7 − c9p3 + p5 − c6 p7 − c7 − c8
Not accept 0 0p3 − c6 −c7 − c8
We suppose m is the probability of the upstream enterprises to turn wastes into resources andprovide them to the downstream enterprises. Then 1−m is the probability of the upstream enterprisesto make primary processing of the wastes and not provide them to the downstream enterprises.n is the probability of the downstream enterprises to accept the resources provided by the upstreamenterprises. 1− n is the probability of the downstream enterprises not to accept the resources ofthe upstream enterprises. m, n are the functions of time t. The formula derivation is similar withSection 3.1 and we can get.
The replicator dynamics equation of the upstream enterprises is:
F3(m) = dm/dt = m(E31 − E3) = m(1−m)[n(p5 − p7) + p3 + c7 + c8 − c6] (12)
We get the derivative of each side:
F3′(m) = (1− 2m)[n(p5 − p7) + p3 + c7 + c8 − c6] (13)
The replicator dynamics equation of the downstream enterprises is:
F4(n) = dn/dt = n(E41 − E4) = n(1− n)[m(p7 + c9 − p5) + p4 + p6 − p7 − c9] (14)
Sustainability 2017, 9, 1165 9 of 27
We get the derivative of each side:
F4′(n) = (1− 2n)[m(p7 + c9 − p5) + p4 + p6 − p7 − c9] (15)
For the upstream enterprises, from Equation (12) we can know:When n = (p3 + c7 + c8 − c6)/(p7 − p5), F3(m) ≡ 0. At this time all m are in stable state.When n 6= (p3 + c7 + c8 − c6)/(p7 − p5), make F3(m) = 0. At this time m = 0 or m = 1.
There are two circumstances:When n < (p3 + c7 + c8 − c6)/(p7 − p5), F3
′(m)m=1 < 0. So m = 1 is the equilibrium point.When n > (p3 + c7 + c8 − c6)/(p7 − p5), F3
′(m)m=1 < 0. So m = 0 is the equilibrium point.For the downstream enterprises, from Equation (14) we can know:When m = (p7 + c9 − p4 − p6)/(p7 + c9 − p5), F4(n) ≡ 0. At this time all m are in stable state.When m 6= (p7 + c9 − p4 − p6)/(p7 + c9 − p5), make F4(n) = 0. At this time n = 0 or n = 1.
There are two circumstances:When m < (p7 + c9 − p4 − p6)/(p7 + c9 − p5), F4
′(n)n=0 < 0. So n = 0 is the equilibrium point.When m > (p7 + c9 − p4 − p6)/(p7 + c9 − p5), F4
′(n)n=1 < 0. So n = 1 is the equilibrium point.Based on the above analysis, the equilibrium points of the replicator dynamics equation is (0,0),
(0,1), (1,0), (1,1), ((p7 + c9 − p4 − p6)/(p7 + c9 − p5), (p3 + c7 + c8 − c6)/(p7 − p5)). According toFriedman’s method, the stability of the equilibrium points can be drawn from the analysis of the localstability of Jacobian matrix. The Jacobian matrix is:
J2 =
((1− 2m)[n(p5 − p7) + p3 + c7 + c8 − c6] m(1−m)(p7 − p5)
n(1− n)(p7 + c9 − p5) (1− 2n)[m(p7 + c9 − p5) + p4 + p6 − p7 − c9]
)(16)
In each equilibrium point, the determinant and trace of the Jacobian matrix as well as the resultsare shown in Table 6.
Table 6. Stability analysis of the game between the upstream enterprises and the downstream enterprises.
Equilibrium Point Determinant Value Trace Value
0,0 (p3 + c7 + c8 − c6)(p4 + p6 − p7 − c9) p3 + p4 + p6 + c7 + c8 − p7 − c6 − c9
0,1 (p3 + p5 + c7 + c8 − p7 − c6)(p7 + c9 − p4 − p6) p3 + p5 + c7 + c8 + c9 − p4 − p6 − c6
1,0 (p3 + c7 + c8 − c6)(p5 − p4 − p6) p3 + p5 + c7 + c8 − p4 − p6 − c6
1,1 (p7 + c6 − p3 − p5 − c7 − c8)(p5 − p4 − p6) p7 + c6 − p3 − p4 − p6 − c7 − c8
p7+c9−p4−p6p7+c9−p5
,p3+c7+c8−c6
p7−p5
A2 B2
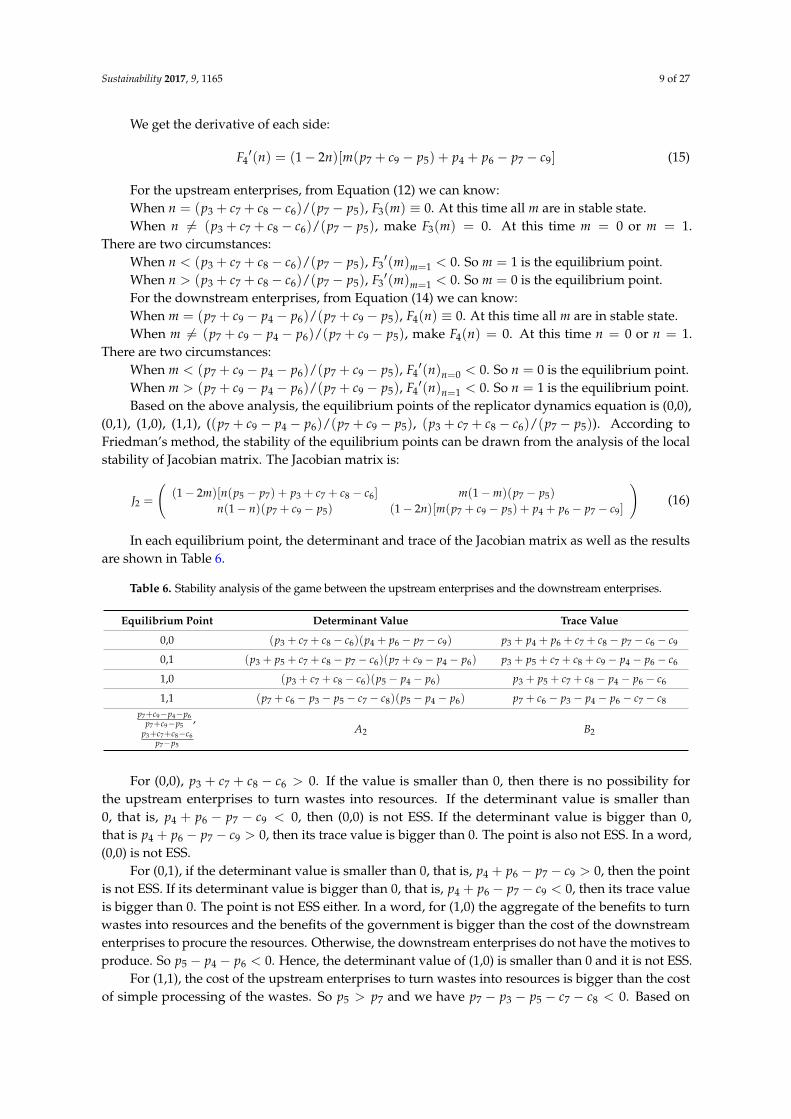
For (0,0), p3 + c7 + c8 − c6 > 0. If the value is smaller than 0, then there is no possibility forthe upstream enterprises to turn wastes into resources. If the determinant value is smaller than0, that is, p4 + p6 − p7 − c9 < 0, then (0,0) is not ESS. If the determinant value is bigger than 0,that is p4 + p6 − p7 − c9 > 0, then its trace value is bigger than 0. The point is also not ESS. In a word,(0,0) is not ESS.
For (0,1), if the determinant value is smaller than 0, that is, p4 + p6 − p7 − c9 > 0, then the pointis not ESS. If its determinant value is bigger than 0, that is, p4 + p6 − p7 − c9 < 0, then its trace valueis bigger than 0. The point is not ESS either. In a word, for (1,0) the aggregate of the benefits to turnwastes into resources and the benefits of the government is bigger than the cost of the downstreamenterprises to procure the resources. Otherwise, the downstream enterprises do not have the motives toproduce. So p5 − p4 − p6 < 0. Hence, the determinant value of (1,0) is smaller than 0 and it is not ESS.
For (1,1), the cost of the upstream enterprises to turn wastes into resources is bigger than the costof simple processing of the wastes. So p5 > p7 and we have p7 − p3 − p5 − c7 − c8 < 0. Based on
Sustainability 2017, 9, 1165 10 of 27
the above analysis, p5 − p4 − p6 < 0 and p3 + c7 + c8 > c6. So its determinant value is positive and itstrace value is negative. Therefore, (1,1) is ESS.
For ( p7+c9−p4−p6p7+c9−p5
, p3+c7+c8−c6p7−p5
), because of p5 > p7, the point has not practical significance and wedo not further discuss it.
3.3. Horizontal Evolutionary Game between the Downstream Enterprises
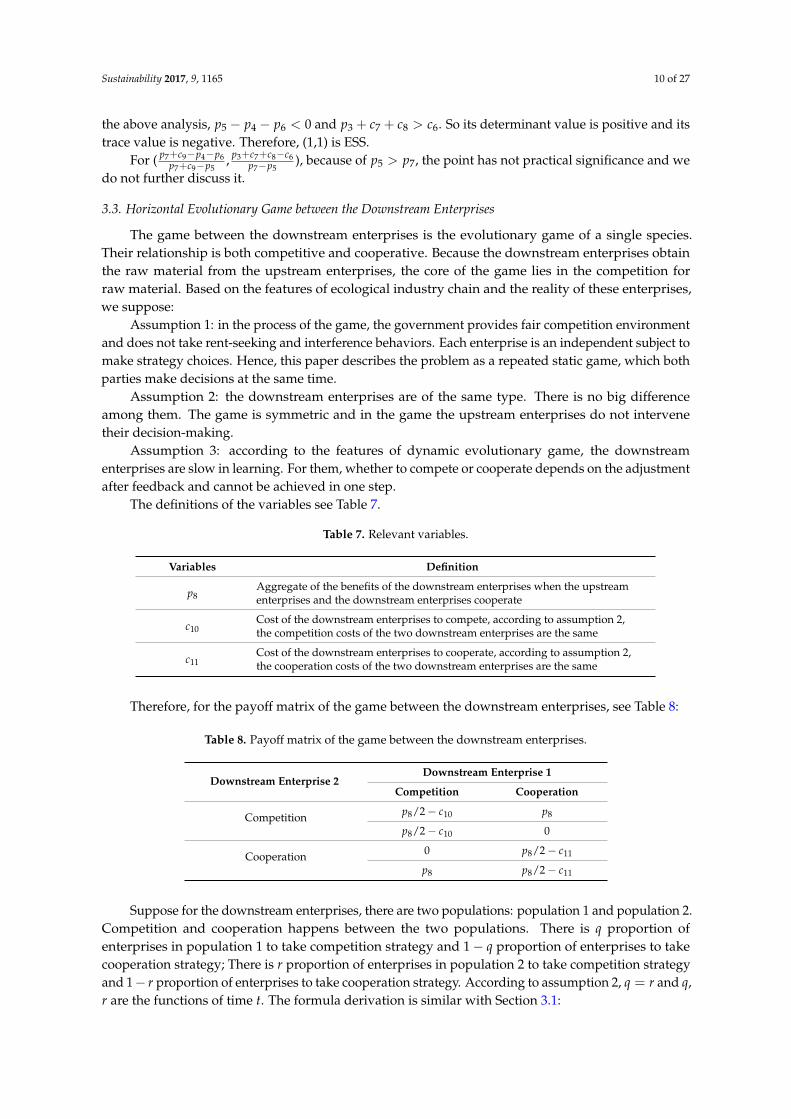
The game between the downstream enterprises is the evolutionary game of a single species.Their relationship is both competitive and cooperative. Because the downstream enterprises obtainthe raw material from the upstream enterprises, the core of the game lies in the competition forraw material. Based on the features of ecological industry chain and the reality of these enterprises,we suppose:
Assumption 1: in the process of the game, the government provides fair competition environmentand does not take rent-seeking and interference behaviors. Each enterprise is an independent subject tomake strategy choices. Hence, this paper describes the problem as a repeated static game, which bothparties make decisions at the same time.
Assumption 2: the downstream enterprises are of the same type. There is no big differenceamong them. The game is symmetric and in the game the upstream enterprises do not intervenetheir decision-making.
Assumption 3: according to the features of dynamic evolutionary game, the downstreamenterprises are slow in learning. For them, whether to compete or cooperate depends on the adjustmentafter feedback and cannot be achieved in one step.
The definitions of the variables see Table 7.
Table 7. Relevant variables.
Variables Definition
p8Aggregate of the benefits of the downstream enterprises when the upstreamenterprises and the downstream enterprises cooperate
c10Cost of the downstream enterprises to compete, according to assumption 2,the competition costs of the two downstream enterprises are the same
c11Cost of the downstream enterprises to cooperate, according to assumption 2,the cooperation costs of the two downstream enterprises are the same
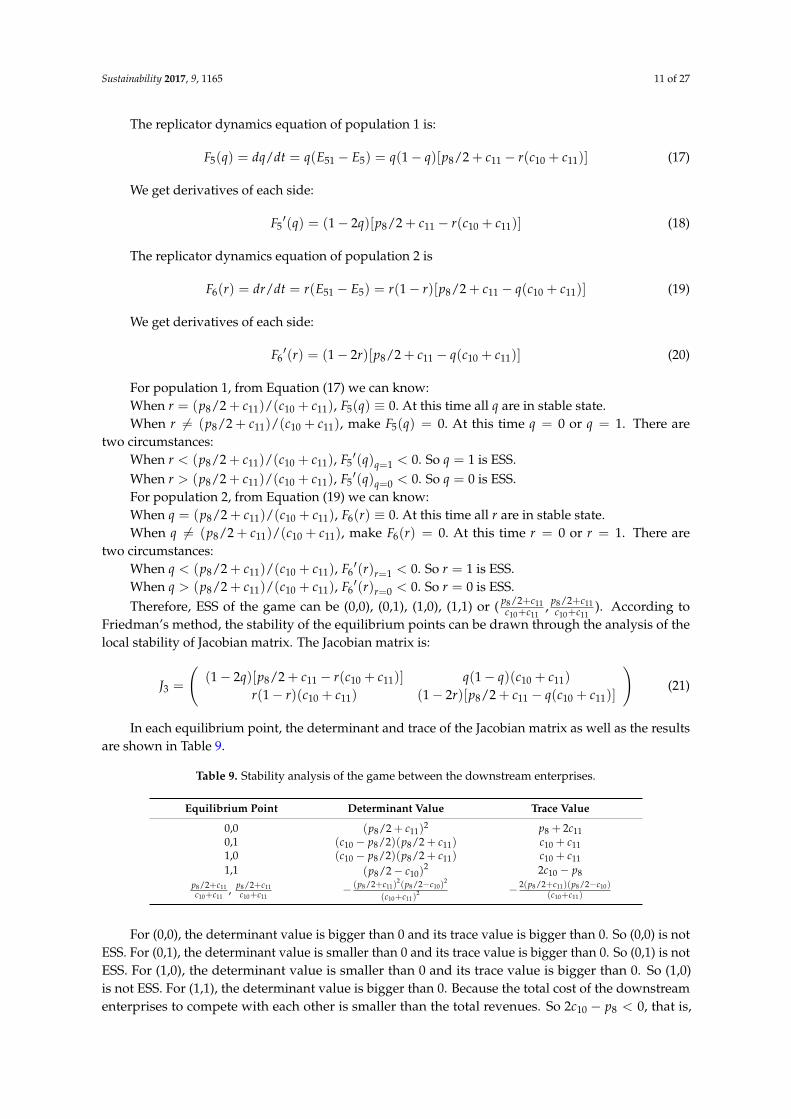
Therefore, for the payoff matrix of the game between the downstream enterprises, see Table 8:
Table 8. Payoff matrix of the game between the downstream enterprises.
Downstream Enterprise 2Downstream Enterprise 1
Competition Cooperation
Competition p8/2− c10 p8
p8/2− c10 0
Cooperation 0 p8/2− c11
p8 p8/2− c11
Suppose for the downstream enterprises, there are two populations: population 1 and population 2.Competition and cooperation happens between the two populations. There is q proportion ofenterprises in population 1 to take competition strategy and 1− q proportion of enterprises to takecooperation strategy; There is r proportion of enterprises in population 2 to take competition strategyand 1− r proportion of enterprises to take cooperation strategy. According to assumption 2, q = r and q,r are the functions of time t. The formula derivation is similar with Section 3.1:
Sustainability 2017, 9, 1165 11 of 27
The replicator dynamics equation of population 1 is:
F5(q) = dq/dt = q(E51 − E5) = q(1− q)[p8/2 + c11 − r(c10 + c11)] (17)
We get derivatives of each side:
F5′(q) = (1− 2q)[p8/2 + c11 − r(c10 + c11)] (18)
The replicator dynamics equation of population 2 is
F6(r) = dr/dt = r(E51 − E5) = r(1− r)[p8/2 + c11 − q(c10 + c11)] (19)
We get derivatives of each side:
F6′(r) = (1− 2r)[p8/2 + c11 − q(c10 + c11)] (20)
For population 1, from Equation (17) we can know:When r = (p8/2 + c11)/(c10 + c11), F5(q) ≡ 0. At this time all q are in stable state.When r 6= (p8/2 + c11)/(c10 + c11), make F5(q) = 0. At this time q = 0 or q = 1. There are
two circumstances:When r < (p8/2 + c11)/(c10 + c11), F5
′(q)q=1 < 0. So q = 1 is ESS.When r > (p8/2 + c11)/(c10 + c11), F5
′(q)q=0 < 0. So q = 0 is ESS.For population 2, from Equation (19) we can know:When q = (p8/2 + c11)/(c10 + c11), F6(r) ≡ 0. At this time all r are in stable state.When q 6= (p8/2 + c11)/(c10 + c11), make F6(r) = 0. At this time r = 0 or r = 1. There are
two circumstances:When q < (p8/2 + c11)/(c10 + c11), F6
′(r)r=1 < 0. So r = 1 is ESS.When q > (p8/2 + c11)/(c10 + c11), F6
′(r)r=0 < 0. So r = 0 is ESS.Therefore, ESS of the game can be (0,0), (0,1), (1,0), (1,1) or ( p8/2+c11
c10+c11, p8/2+c11
c10+c11). According to
Friedman’s method, the stability of the equilibrium points can be drawn through the analysis of thelocal stability of Jacobian matrix. The Jacobian matrix is:
J3 =
((1− 2q)[p8/2 + c11 − r(c10 + c11)] q(1− q)(c10 + c11)
r(1− r)(c10 + c11) (1− 2r)[p8/2 + c11 − q(c10 + c11)]
)(21)
In each equilibrium point, the determinant and trace of the Jacobian matrix as well as the resultsare shown in Table 9.
Table 9. Stability analysis of the game between the downstream enterprises.
Equilibrium Point Determinant Value Trace Value
0,0 (p8/2 + c11)2 p8 + 2c11
0,1 (c10 − p8/2)(p8/2 + c11) c10 + c111,0 (c10 − p8/2)(p8/2 + c11) c10 + c111,1 (p8/2− c10)
2 2c10 − p8p8/2+c11c10+c11
, p8/2+c11c10+c11
− (p8/2+c11)2(p8/2−c10)
2
(c10+c11)2 − 2(p8/2+c11)(p8/2−c10)
(c10+c11)
For (0,0), the determinant value is bigger than 0 and its trace value is bigger than 0. So (0,0) is notESS. For (0,1), the determinant value is smaller than 0 and its trace value is bigger than 0. So (0,1) is notESS. For (1,0), the determinant value is smaller than 0 and its trace value is bigger than 0. So (1,0)is not ESS. For (1,1), the determinant value is bigger than 0. Because the total cost of the downstreamenterprises to compete with each other is smaller than the total revenues. So 2c10 − p8 < 0, that is,
Sustainability 2017, 9, 1165 12 of 27
its trace value is smaller than 0. So (1,1) is ESS. For ( p8/2+c11c10+c11
, p8/2+c11c10+c11
), the determinant value is smallerthan 0 and its trace value is smaller than 0. So it is not ESS.
4. Simulation Analysis of Multi-Agent Modeling of Ecological Industry Chain
This paper uses Netlogo platform to make computational experiment analysis. Netlogo is aprogrammable modeling platform for the analysis of natural and social problems [31]. It is issuedby Uri Wilensky in 1999. The purpose is to provide a powerful and easily usable computer aidtool for scientific education institutions. In addition, it is CCL (Center for Connected Learning andComputer-based modeling) that is responsible for the continuous development of the software [32].
In order to obtain the data of variables of the games, the author visited the Poyang Lake EcologicalEconomic Zone and interviewed the managers of the representative enterprise-Jiangxi LAN-STARspark silicone company. Besides, the author also visited some governmental agencies such as the localadministrative committee and the local environmental protection bureau. Jiangxi LAN-STAR sparksilicone company is a large scale company, whose silicone monomer yield is the No. 1 in Asia andNo. 3 in the world.
The company is a typical chemical enterprise. It has large number of industrial wastes andthe categories are varied. There are abundant downstream enterprises using its wastes as raw material,such as the Fortune 500 company Cabot Corp and Hongrun Chemical Co., Ltd. So around JiangxiLAN-STAR spark silicone company, an ecological industry chain has been formed.
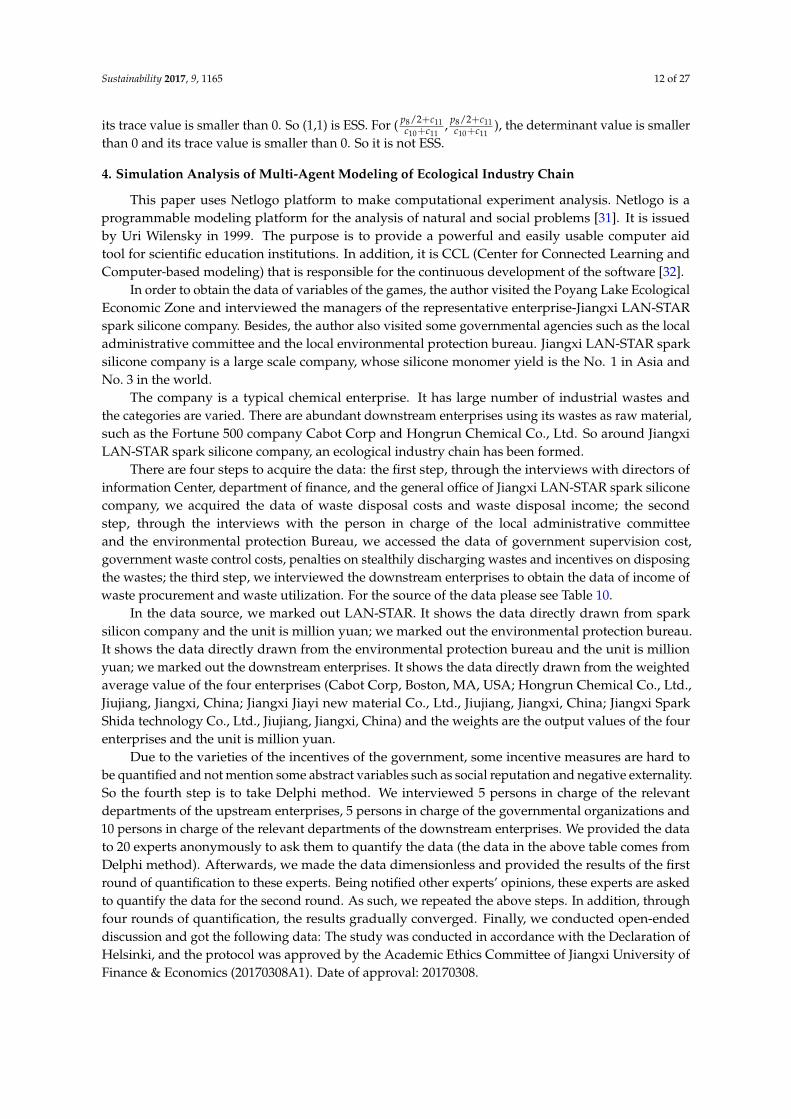
There are four steps to acquire the data: the first step, through the interviews with directors ofinformation Center, department of finance, and the general office of Jiangxi LAN-STAR spark siliconecompany, we acquired the data of waste disposal costs and waste disposal income; the secondstep, through the interviews with the person in charge of the local administrative committeeand the environmental protection Bureau, we accessed the data of government supervision cost,government waste control costs, penalties on stealthily discharging wastes and incentives on disposingthe wastes; the third step, we interviewed the downstream enterprises to obtain the data of income ofwaste procurement and waste utilization. For the source of the data please see Table 10.
In the data source, we marked out LAN-STAR. It shows the data directly drawn from sparksilicon company and the unit is million yuan; we marked out the environmental protection bureau.It shows the data directly drawn from the environmental protection bureau and the unit is millionyuan; we marked out the downstream enterprises. It shows the data directly drawn from the weightedaverage value of the four enterprises (Cabot Corp, Boston, MA, USA; Hongrun Chemical Co., Ltd.,Jiujiang, Jiangxi, China; Jiangxi Jiayi new material Co., Ltd., Jiujiang, Jiangxi, China; Jiangxi SparkShida technology Co., Ltd., Jiujiang, Jiangxi, China) and the weights are the output values of the fourenterprises and the unit is million yuan.
Due to the varieties of the incentives of the government, some incentive measures are hard tobe quantified and not mention some abstract variables such as social reputation and negative externality.So the fourth step is to take Delphi method. We interviewed 5 persons in charge of the relevantdepartments of the upstream enterprises, 5 persons in charge of the governmental organizations and10 persons in charge of the relevant departments of the downstream enterprises. We provided the datato 20 experts anonymously to ask them to quantify the data (the data in the above table comes fromDelphi method). Afterwards, we made the data dimensionless and provided the results of the firstround of quantification to these experts. Being notified other experts’ opinions, these experts are askedto quantify the data for the second round. As such, we repeated the above steps. In addition, throughfour rounds of quantification, the results gradually converged. Finally, we conducted open-endeddiscussion and got the following data: The study was conducted in accordance with the Declaration ofHelsinki, and the protocol was approved by the Academic Ethics Committee of Jiangxi University ofFinance & Economics (20170308A1). Date of approval: 20170308.

Sustainability 2017, 9, 1165 13 of 27
Table 10. Source of data.
Item Definitions Source
c1 Cost of enterprises to dispose wastes LAN-STAR
c2 Cost of government supervision Administrative Committee
c3Penalties on enterprises when the government finds enterprises notdisposing wastes
Environmental ProtectionBureau
c4 Cost of the government to control pollution Environmental ProtectionBureau
c5 Reputation loss of enterprises not to dispose wastes Delphi method
c6 Cost of the upstream enterprises to turn the wastes into resources LAN-STAR
c7 Cost of the upstream enterprises to simply process the wastes LAN-STAR
c8Negative externality of the upstream enterprises to simply processthe wastes Delphi method
c9Cost of the downstream enterprises to turn the simply processedwastes into producible resources Downstream Enterprises
c10 Cost of the downstream enterprises to compete Downstream Enterprises
c11 Cost of the downstream enterprises to cooperate Downstream Enterprises
p1Incentives to enterprises when the government monitors the wastedisposal of enterprises Delphi method
p2Reputation benefits of enterprises to dispose wastes, such as theimprovement of brand value Delphi method
p3Subsidy incentives of the government to the upstream enterprises forturning the wastes into resources Delphi method
p4Subsidy incentives of the government to the downstream enterprisesfor accepting the resources of the upstream enterprises Delphi method
p5Benefits of the upstream enterprises to turn wastes into resources, thatis, cost of the downstream enterprises to procure the resourced wastes LAN-STAR
p6 Benefits of the downstream enterprises to utilize wastes Downstream Enterprises
p7 Benefits of the upstream enterprises to simply process the wastes LAN-STAR
p8Aggregate of the benefits of the downstream enterprises when theupstream enterprises and the downstream enterprises cooperate Downstream Enterprises
The cost of enterprises to dispose wastes is 6, the incentive the government gives to the enterprisesfor dispose wastes is 1, the reputation income of enterprises to dispose the wastes is 2, the cost ofgovernmental supervision is 1, the penalties the government exercises on enterprises for not disposingthe wastes is 2, the cost of the government to curb pollution is 6, the loss of enterprises’ reputation fornot disposing the wastes is 2.
The subsidy incentives the government provides to the upstream enterprises for disposingthe wastes is 1, the subsidy incentives the government provides to the downstream enterprises forusing the wastes to produce is 1, the benefits of the upstream enterprises to turn the wastes intoresources, that is, the cost of the downstream enterprises to procure the wastes which have alreadybecome resources is 2, the benefits of the downstream enterprises to utilize the wastes is 2, the benefitsof the upstream enterprises to make simple disposal of the wastes, that is, the cost of the downstreamenterprises to procure the simply processed wastes is 0.5, the negative externality of the upstreamenterprises to simply process the wastes is 1, the cost of the downstream enterprises to turn the simplyprocessed wastes into producible resources is 2. When the upstream enterprises and the downstreamenterprises cooperate, the total benefits of the downstream enterprises is 10, the horizontal competitioncost of the downstream enterprises is 3, the cooperation cost of the downstream enterprises is 2.All the values satisfy the conditions that we analyzed in Section 3.
The model consists of a game environment and four different types of Agents. The related definitionsplease refer to Tables 2, 5 and 8. The environment here is simple grid settings. The grid is modeled into
Sustainability 2017, 9, 1165 14 of 27
a real space environment in which Agents can move follow the grid direction. At the initial moment ofthe game, Agents are selected according to a certain probability. Then in accordance with the conductrules, in the experimental period t, each Agent games with any Agent it meets. According to the payoffof the game, following the evolutionary replicator dynamics point of view, the game party with lesspayoff may compare the expected payoffs of different strategies by learning and imitation and thendecide its strategy of next period (t + 1) to obtain higher payoff.
Suppose the probability of player S1 at the t moment to choose strategy A is xt.Then the probability to choose strategy B is 1 − xt, xt ∈ (0, 1); the probability of player S2 atthe t moment to choose strategy A is yt. Then the probability to choose strategy B is 1− yt, yt ∈ (0, 1).We suppose Us1 and Us2 are two strategies and U′s1 and U′s2 are the expected payoff function ofcorresponding strategy.
Us1(t) = yta11 + (1− yt)a12 (22)
Us2(t) = yta21 + (1− yt)a22 (23)
U′s1(t) = xtb11 + (1− xt)b21 (24)
U′s2(t) = xtb12 + (1− xt)b22 (25)
Suppose the strategy of i in Agents 1 chooses at t moment is s1i(t) = s1. If Us2(t) > Us1(t),then the strategy i chooses at t + 1 moment is s1i(t + 1) = s2; if s1i(t) = s2, Us2(t) < Us1(t),then the strategy i chooses at t + 1 moment is s1i(t + 1) = s1.
Suppose the strategy of j in Agents 2 chooses at t moment is s1j(t) = s1. If U′s2(t) > U′s1(t),then the strategy j chooses at t + 1 moment is s1j(t + 1) = s2; if s1j(t) = s2, U′s2(t) < U′s1(t),then the strategy i chooses at t + 1 moment is s1j(t + 1) = s1.
4.1. Simulation Analysis of the Game between the Enterprises and the Government
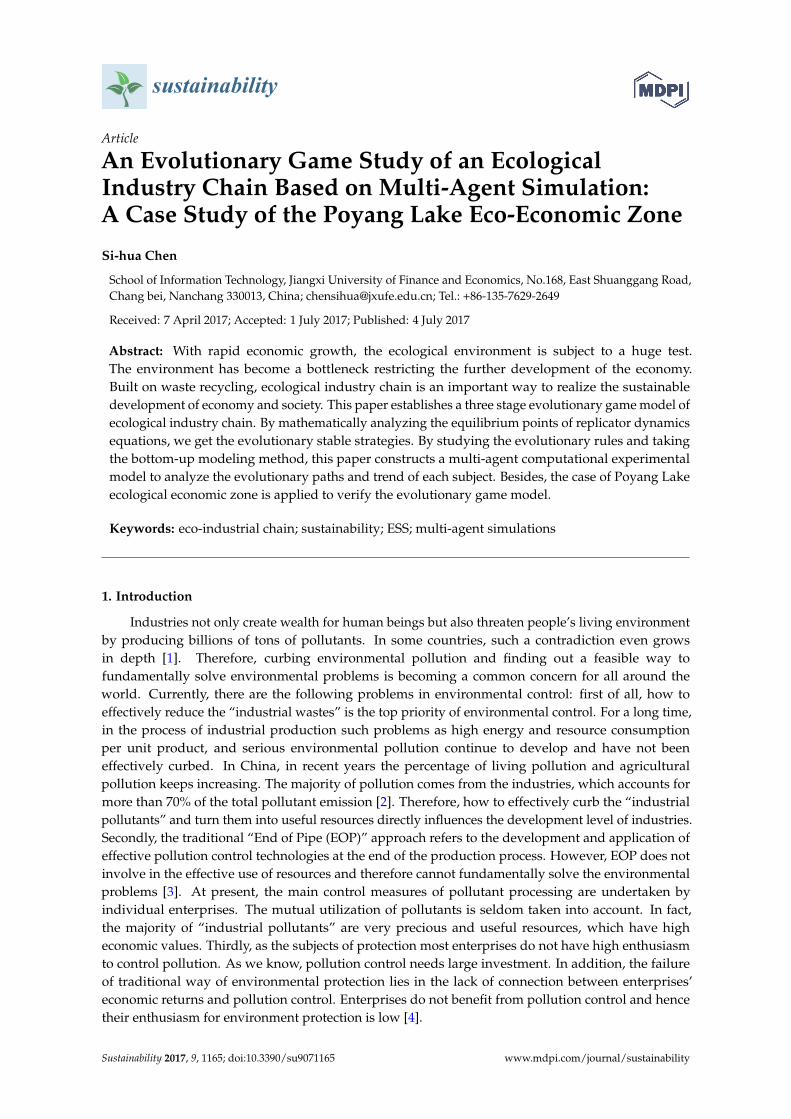
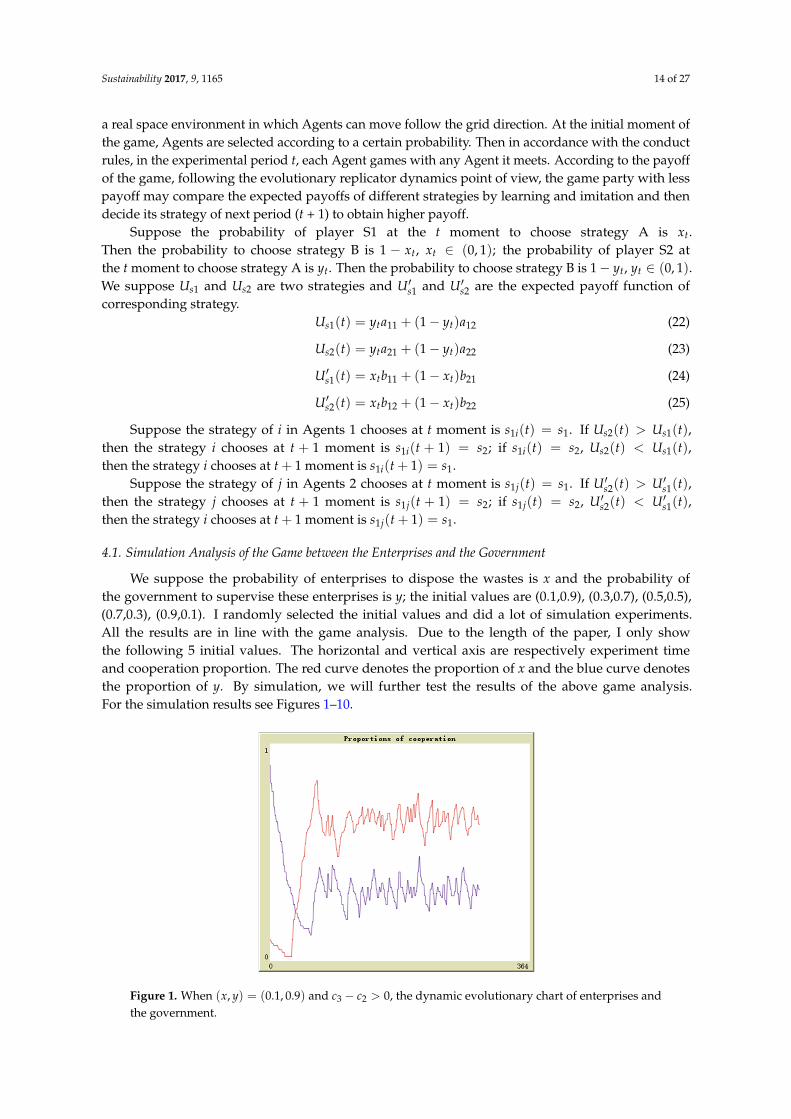
We suppose the probability of enterprises to dispose the wastes is x and the probability ofthe government to supervise these enterprises is y; the initial values are (0.1,0.9), (0.3,0.7), (0.5,0.5),(0.7,0.3), (0.9,0.1). I randomly selected the initial values and did a lot of simulation experiments.All the results are in line with the game analysis. Due to the length of the paper, I only showthe following 5 initial values. The horizontal and vertical axis are respectively experiment timeand cooperation proportion. The red curve denotes the proportion of x and the blue curve denotesthe proportion of y. By simulation, we will further test the results of the above game analysis.For the simulation results see Figures 1–10.
Sustainability 2017, 9, 1165 15 of 28
Suppose the strategy of j in Agents 2 chooses at t moment is 1 1( )js t s . If ' '2 1( ) ( )s sU t U t ,
then the strategy j chooses at 1t moment is 1 2( 1)js t s ; if 1 2( )js t s , ' '2 1( ) ( )s sU t U t ,
then the strategy i chooses at 1t moment is 1 1( 1)js t s .
4.1. Simulation Analysis of the Game between the Enterprises and the Government
We suppose the probability of enterprises to dispose the wastes is x and the probability of the government to supervise these enterprises is y; the initial values are (0.1,0.9), (0.3,0.7), (0.5,0.5), (0.7,0.3), (0.9,0.1). I randomly selected the initial values and did a lot of simulation experiments. All the results are in line with the game analysis. Due to the length of the paper, I only show the following 5 initial values. The horizontal and vertical axis are respectively experiment time and cooperation proportion. The red curve denotes the proportion of x and the blue curve denotes the proportion of y. By simulation, we will further test the results of the above game analysis. For the simulation results see Figures 1–10.
Figure 1. When ( , ) (0.1,0.9)x y and 3 2 0c c , the dynamic evolutionary chart of
enterprises and the government.
Figure 2. When ( , ) (0.3,0.7)x y and 3 2 0c c , the dynamic evolutionary chart of
enterprises and the government.
Figure 1. When (x, y) = (0.1, 0.9) and c3 − c2 > 0, the dynamic evolutionary chart of enterprises andthe government.
Sustainability 2017, 9, 1165 15 of 27
Sustainability 2017, 9, 1165 15 of 28
Suppose the strategy of j in Agents 2 chooses at t moment is 1 1( )js t s . If ' '2 1( ) ( )s sU t U t ,
then the strategy j chooses at 1t moment is 1 2( 1)js t s ; if 1 2( )js t s , ' '2 1( ) ( )s sU t U t ,
then the strategy i chooses at 1t moment is 1 1( 1)js t s .
4.1. Simulation Analysis of the Game between the Enterprises and the Government
We suppose the probability of enterprises to dispose the wastes is x and the probability of the government to supervise these enterprises is y; the initial values are (0.1,0.9), (0.3,0.7), (0.5,0.5), (0.7,0.3), (0.9,0.1). I randomly selected the initial values and did a lot of simulation experiments. All the results are in line with the game analysis. Due to the length of the paper, I only show the following 5 initial values. The horizontal and vertical axis are respectively experiment time and cooperation proportion. The red curve denotes the proportion of x and the blue curve denotes the proportion of y. By simulation, we will further test the results of the above game analysis. For the simulation results see Figures 1–10.
Figure 1. When ( , ) (0.1,0.9)x y and 3 2 0c c , the dynamic evolutionary chart of
enterprises and the government.
Figure 2. When ( , ) (0.3,0.7)x y and 3 2 0c c , the dynamic evolutionary chart of
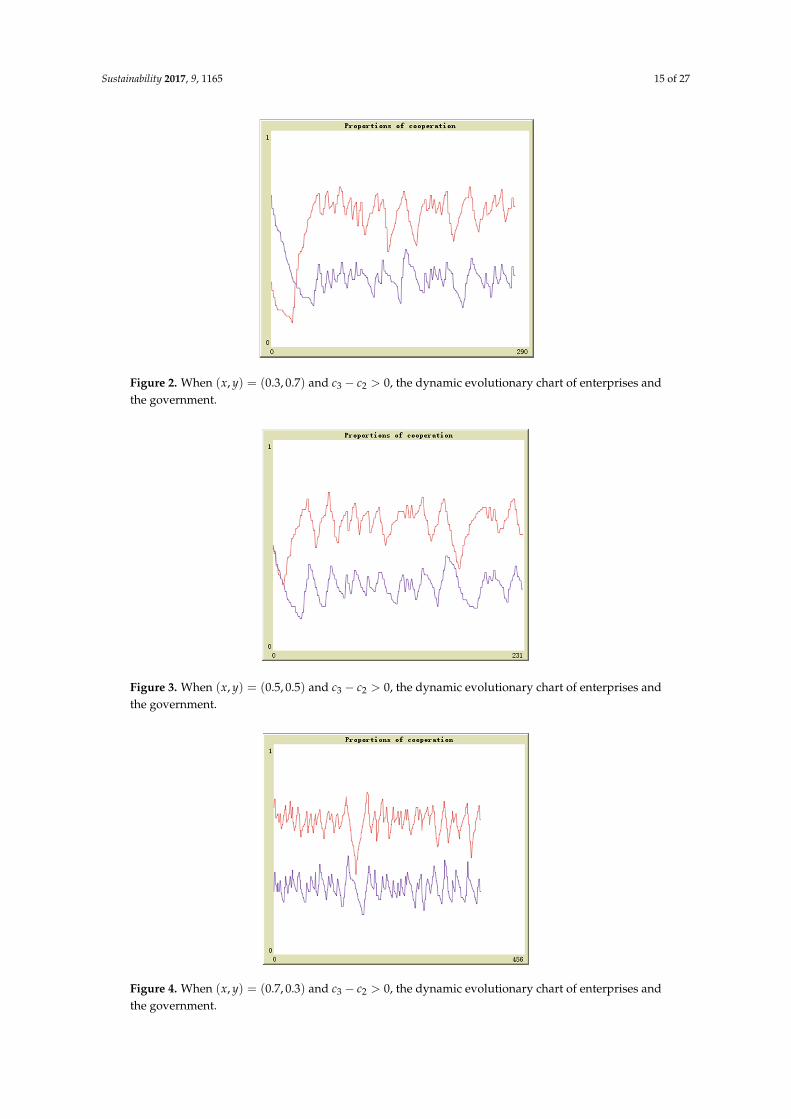
enterprises and the government. Figure 2. When (x, y) = (0.3, 0.7) and c3 − c2 > 0, the dynamic evolutionary chart of enterprises andthe government.
Sustainability 2017, 9, 1165 16 of 28
Figure 3. When ( , ) (0.5,0.5)x y and 3 2 0c c , the dynamic evolutionary chart of
enterprises and the government.
Figure 4. When ( , ) (0.7,0.3)x y and 3 2 0c c , the dynamic evolutionary chart of
enterprises and the government.
Figure 5. When ( , ) (0.9,0.1)x y and 3 2 0c c , the dynamic evolutionary chart of
enterprises and the government.
Figure 3. When (x, y) = (0.5, 0.5) and c3 − c2 > 0, the dynamic evolutionary chart of enterprises andthe government.
Sustainability 2017, 9, 1165 16 of 28
Figure 3. When ( , ) (0.5,0.5)x y and 3 2 0c c , the dynamic evolutionary chart of
enterprises and the government.
Figure 4. When ( , ) (0.7,0.3)x y and 3 2 0c c , the dynamic evolutionary chart of
enterprises and the government.
Figure 5. When ( , ) (0.9,0.1)x y and 3 2 0c c , the dynamic evolutionary chart of
enterprises and the government.
Figure 4. When (x, y) = (0.7, 0.3) and c3 − c2 > 0, the dynamic evolutionary chart of enterprises andthe government.
Sustainability 2017, 9, 1165 16 of 27
Sustainability 2017, 9, 1165 16 of 28
Figure 3. When ( , ) (0.5,0.5)x y and 3 2 0c c , the dynamic evolutionary chart of
enterprises and the government.
Figure 4. When ( , ) (0.7,0.3)x y and 3 2 0c c , the dynamic evolutionary chart of
enterprises and the government.
Figure 5. When ( , ) (0.9,0.1)x y and 3 2 0c c , the dynamic evolutionary chart of
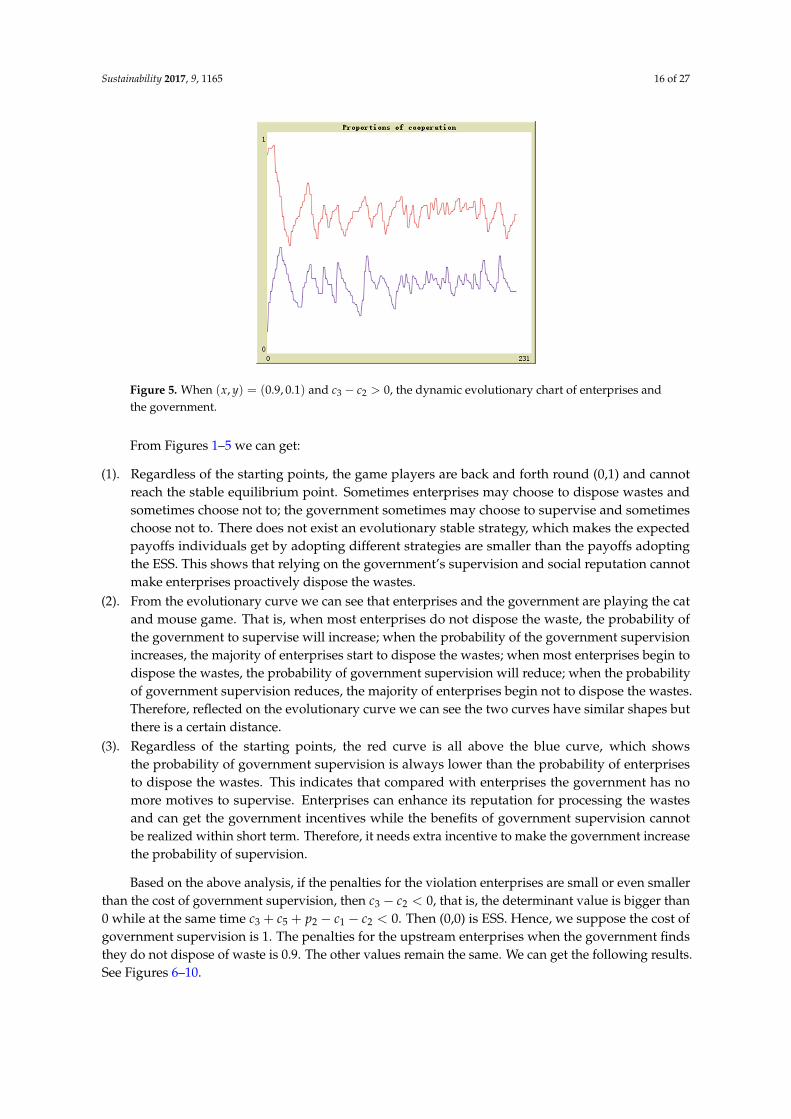
enterprises and the government. Figure 5. When (x, y) = (0.9, 0.1) and c3 − c2 > 0, the dynamic evolutionary chart of enterprises andthe government.
From Figures 1–5 we can get:
(1). Regardless of the starting points, the game players are back and forth round (0,1) and cannotreach the stable equilibrium point. Sometimes enterprises may choose to dispose wastes andsometimes choose not to; the government sometimes may choose to supervise and sometimeschoose not to. There does not exist an evolutionary stable strategy, which makes the expectedpayoffs individuals get by adopting different strategies are smaller than the payoffs adoptingthe ESS. This shows that relying on the government’s supervision and social reputation cannotmake enterprises proactively dispose the wastes.
(2). From the evolutionary curve we can see that enterprises and the government are playing the catand mouse game. That is, when most enterprises do not dispose the waste, the probability ofthe government to supervise will increase; when the probability of the government supervisionincreases, the majority of enterprises start to dispose the wastes; when most enterprises begin todispose the wastes, the probability of government supervision will reduce; when the probabilityof government supervision reduces, the majority of enterprises begin not to dispose the wastes.Therefore, reflected on the evolutionary curve we can see the two curves have similar shapes butthere is a certain distance.
(3). Regardless of the starting points, the red curve is all above the blue curve, which showsthe probability of government supervision is always lower than the probability of enterprisesto dispose the wastes. This indicates that compared with enterprises the government has nomore motives to supervise. Enterprises can enhance its reputation for processing the wastesand can get the government incentives while the benefits of government supervision cannotbe realized within short term. Therefore, it needs extra incentive to make the government increasethe probability of supervision.
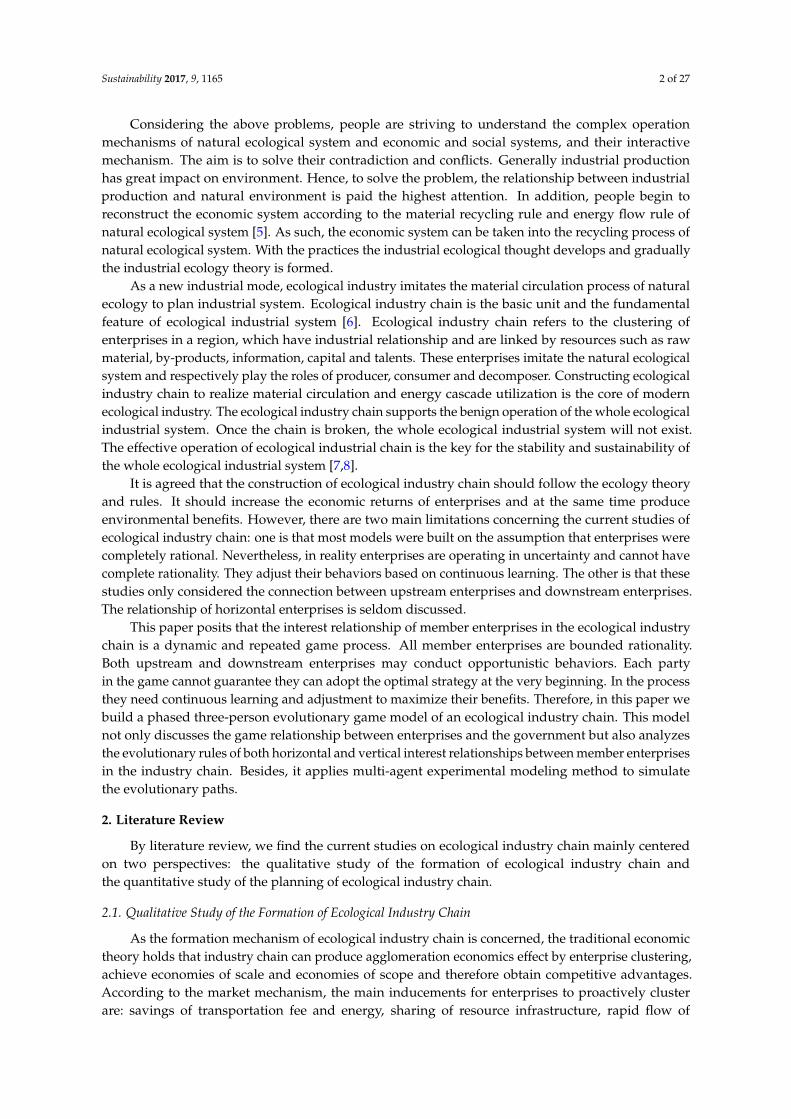
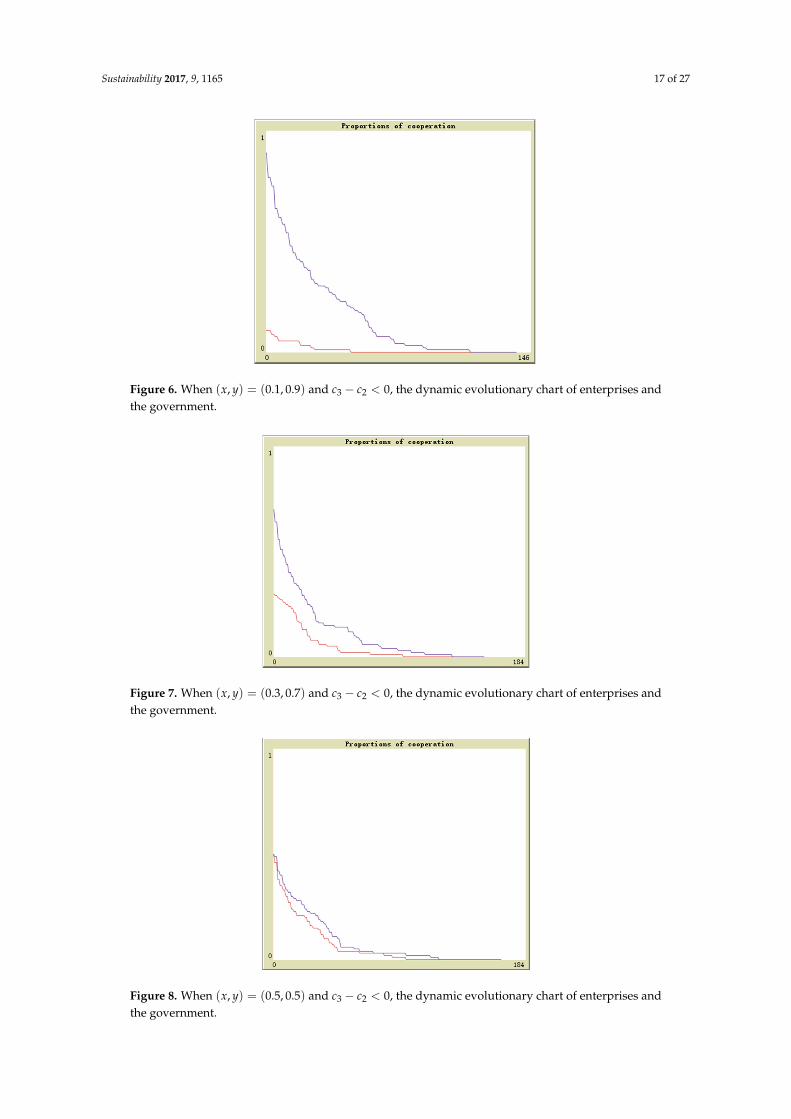
Based on the above analysis, if the penalties for the violation enterprises are small or even smallerthan the cost of government supervision, then c3 − c2 < 0, that is, the determinant value is bigger than0 while at the same time c3 + c5 + p2 − c1 − c2 < 0. Then (0,0) is ESS. Hence, we suppose the cost ofgovernment supervision is 1. The penalties for the upstream enterprises when the government findsthey do not dispose of waste is 0.9. The other values remain the same. We can get the following results.See Figures 6–10.
Sustainability 2017, 9, 1165 17 of 27
Sustainability 2017, 9, 1165 17 of 28
From Figures 1–5 we can get:
(1). Regardless of the starting points, the game players are back and forth round (0,1) and cannot reach the stable equilibrium point. Sometimes enterprises may choose to dispose wastes and sometimes choose not to; the government sometimes may choose to supervise and sometimes choose not to. There does not exist an evolutionary stable strategy, which makes the expected payoffs individuals get by adopting different strategies are smaller than the payoffs adopting the ESS. This shows that relying on the government’s supervision and social reputation cannot make enterprises proactively dispose the wastes.
(2). From the evolutionary curve we can see that enterprises and the government are playing the cat and mouse game. That is, when most enterprises do not dispose the waste, the probability of the government to supervise will increase; when the probability of the government supervision increases, the majority of enterprises start to dispose the wastes; when most enterprises begin to dispose the wastes, the probability of government supervision will reduce; when the probability of government supervision reduces, the majority of enterprises begin not to dispose the wastes. Therefore, reflected on the evolutionary curve we can see the two curves have similar shapes but there is a certain distance.
(3). Regardless of the starting points, the red curve is all above the blue curve, which shows the probability of government supervision is always lower than the probability of enterprises to dispose the wastes. This indicates that compared with enterprises the government has no more motives to supervise. Enterprises can enhance its reputation for processing the wastes and can get the government incentives while the benefits of government supervision cannot be realized within short term. Therefore, it needs extra incentive to make the government increase the probability of supervision.
Based on the above analysis, if the penalties for the violation enterprises are small or even smaller than the cost of government supervision, then 3 2 0c c , that is, the determinant value is
bigger than 0 while at the same time 3 5 2 1 2 0c c p c c . Then (0,0) is ESS. Hence, we suppose the cost of government supervision is 1. The penalties for the upstream enterprises when the government finds they do not dispose of waste is 0.9. The other values remain the same. We can get the following results. See Figures 6–10.
Figure 6. When ( , ) (0.1,0.9)x y and 3 2 0c c , the dynamic evolutionary chart of
enterprises and the government. Figure 6. When (x, y) = (0.1, 0.9) and c3 − c2 < 0, the dynamic evolutionary chart of enterprises andthe government.
Sustainability 2017, 9, 1165 18 of 28
Figure 7. When ( , ) (0.3,0.7)x y and 3 2 0c c , the dynamic evolutionary chart of
enterprises and the government.
Figure 8. When ( , ) (0.5,0.5)x y and 3 2 0c c , the dynamic evolutionary chart of
enterprises and the government.
Figure 9. When ( , ) (0.7,0.3)x y and 3 2 0c c , the dynamic evolutionary chart of
enterprises and the government.
Figure 7. When (x, y) = (0.3, 0.7) and c3 − c2 < 0, the dynamic evolutionary chart of enterprises andthe government.
Sustainability 2017, 9, 1165 18 of 28
Figure 7. When ( , ) (0.3,0.7)x y and 3 2 0c c , the dynamic evolutionary chart of
enterprises and the government.
Figure 8. When ( , ) (0.5,0.5)x y and 3 2 0c c , the dynamic evolutionary chart of
enterprises and the government.
Figure 9. When ( , ) (0.7,0.3)x y and 3 2 0c c , the dynamic evolutionary chart of
enterprises and the government.
Figure 8. When (x, y) = (0.5, 0.5) and c3 − c2 < 0, the dynamic evolutionary chart of enterprises andthe government.
Sustainability 2017, 9, 1165 18 of 27
Sustainability 2017, 9, 1165 18 of 28
Figure 7. When ( , ) (0.3,0.7)x y and 3 2 0c c , the dynamic evolutionary chart of
enterprises and the government.
Figure 8. When ( , ) (0.5,0.5)x y and 3 2 0c c , the dynamic evolutionary chart of
enterprises and the government.
Figure 9. When ( , ) (0.7,0.3)x y and 3 2 0c c , the dynamic evolutionary chart of
enterprises and the government. Figure 9. When (x, y) = (0.7, 0.3) and c3 − c2 < 0, the dynamic evolutionary chart of enterprises andthe government.Sustainability 2017, 9, 1165 19 of 28
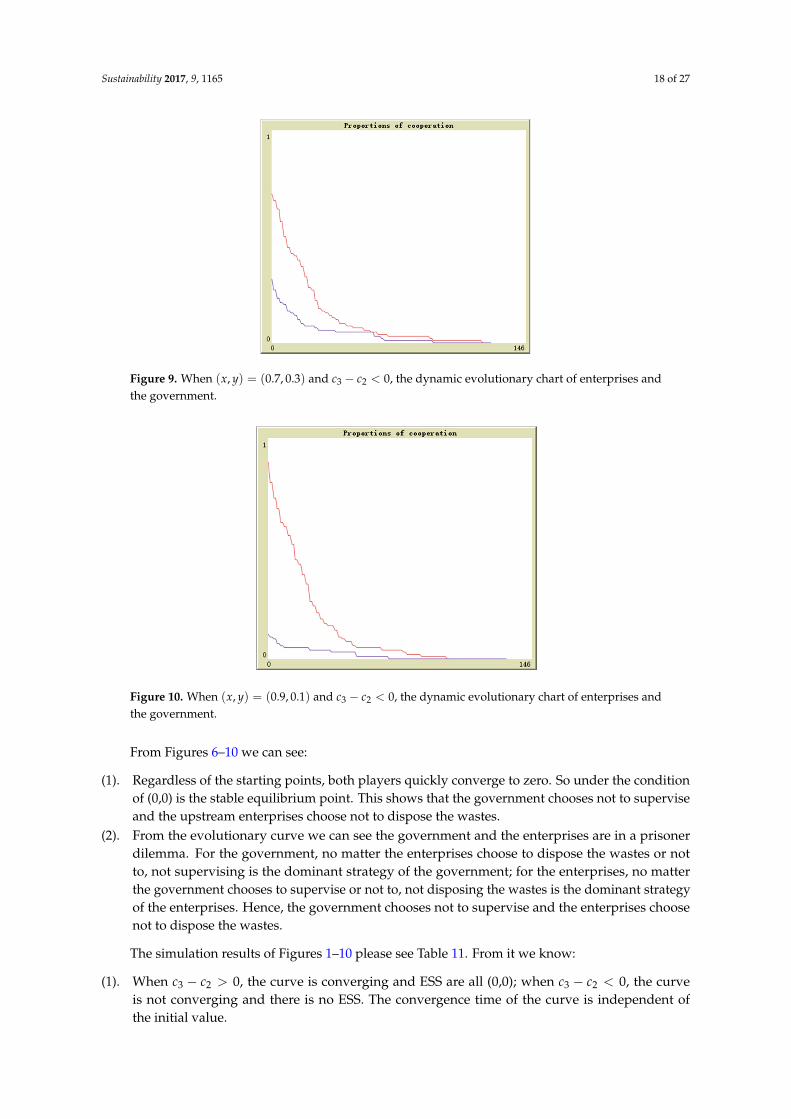
Figure 10. When ( , ) (0.9,0.1)x y and 3 2 0c c , the dynamic evolutionary chart of
enterprises and the government.
From Figures 6–10 we can see:
(1). Regardless of the starting points, both players quickly converge to zero. So under the condition of (0,0) is the stable equilibrium point. This shows that the government chooses not to supervise and the upstream enterprises choose not to dispose the wastes.
(2). From the evolutionary curve we can see the government and the enterprises are in a prisoner dilemma. For the government, no matter the enterprises choose to dispose the wastes or not to, not supervising is the dominant strategy of the government; for the enterprises, no matter the government chooses to supervise or not to, not disposing the wastes is the dominant strategy of the enterprises. Hence, the government chooses not to supervise and the enterprises choose not to dispose the wastes.
The simulation results of Figures 1–10 please see Table 11. From it we know:
(1). When 3 2 0c c , the curve is converging and ESS are all (0,0); when 3 2 0c c , the curve is not converging and there is no ESS. The convergence time of the curve is independent of the initial value.
(2). No matter 3 2 0c c or 3 2 0c c , the enterprises will not dispose the wastes with a hundred percent. Hence, depending on the government supervision cannot guarantee the enterprises to dispose the wastes.
(3). Comparing with the condition that no enterprises will dispose the wastes when 3 2 0c c ,
3 2 0c c can guarantee some enterprises will dispose the wastes. Therefore, from this perspective we can find to guarantee the penalties on violation enterprises bigger than the cost of government supervision has great significance.
Table 11. Summary of the simulation results.
Initial Value (x,y) Parameter Condition Converge or Not ESS Convergence Time (ticks) (0.1,0.9) 3 2 0c c not converge none none
(0.1,0.9) 3 2 0c c converge (0,0) 114
(0.3,0.7) 3 2 0c c not converge none none
(0.3,0.7) 3 2 0c c converge (0,0) 133
(0.5,0.5) 3 2 0c c not converge none none
(0.5,0.5) 3 2 0c c converge (0,0) 120
(0.7,0.3) 3 2 0c c not converge none none
(0.7,0.3) 3 2 0c c converge (0,0) 118 (0.9,0.1) 3 2 0c c not converge none none
Figure 10. When (x, y) = (0.9, 0.1) and c3 − c2 < 0, the dynamic evolutionary chart of enterprises andthe government.
From Figures 6–10 we can see:
(1). Regardless of the starting points, both players quickly converge to zero. So under the conditionof (0,0) is the stable equilibrium point. This shows that the government chooses not to superviseand the upstream enterprises choose not to dispose the wastes.
(2). From the evolutionary curve we can see the government and the enterprises are in a prisonerdilemma. For the government, no matter the enterprises choose to dispose the wastes or notto, not supervising is the dominant strategy of the government; for the enterprises, no matterthe government chooses to supervise or not to, not disposing the wastes is the dominant strategyof the enterprises. Hence, the government chooses not to supervise and the enterprises choosenot to dispose the wastes.
The simulation results of Figures 1–10 please see Table 11. From it we know:
(1). When c3 − c2 > 0, the curve is converging and ESS are all (0,0); when c3 − c2 < 0, the curveis not converging and there is no ESS. The convergence time of the curve is independent ofthe initial value.
Sustainability 2017, 9, 1165 19 of 27
(2). No matter c3 − c2 > 0 or c3 − c2 < 0, the enterprises will not dispose the wastes with a hundredpercent. Hence, depending on the government supervision cannot guarantee the enterprises todispose the wastes.
(3). Comparing with the condition that no enterprises will dispose the wastes when c3 − c2 < 0,c3 − c2 > 0 can guarantee some enterprises will dispose the wastes. Therefore, from thisperspective we can find to guarantee the penalties on violation enterprises bigger than the cost ofgovernment supervision has great significance.
Table 11. Summary of the simulation results.
Initial Value (x,y) Parameter Condition Converge or Not ESS Convergence Time (ticks)
(0.1,0.9) c3 − c2 > 0 not converge none none(0.1,0.9) c3 − c2 < 0 converge (0,0) 114(0.3,0.7) c3 − c2 > 0 not converge none none(0.3,0.7) c3 − c2 < 0 converge (0,0) 133(0.5,0.5) c3 − c2 > 0 not converge none none(0.5,0.5) c3 − c2 < 0 converge (0,0) 120(0.7,0.3) c3 − c2 > 0 not converge none none(0.7,0.3) c3 − c2 < 0 converge (0,0) 118(0.9,0.1) c3 − c2 > 0 not converge none none(0.9,0.1) c3 − c2 < 0 converge (0,0) 97
4.2. Simulation Analysis of the Game between the Upstream Enterprises and the Downstream Enterprises
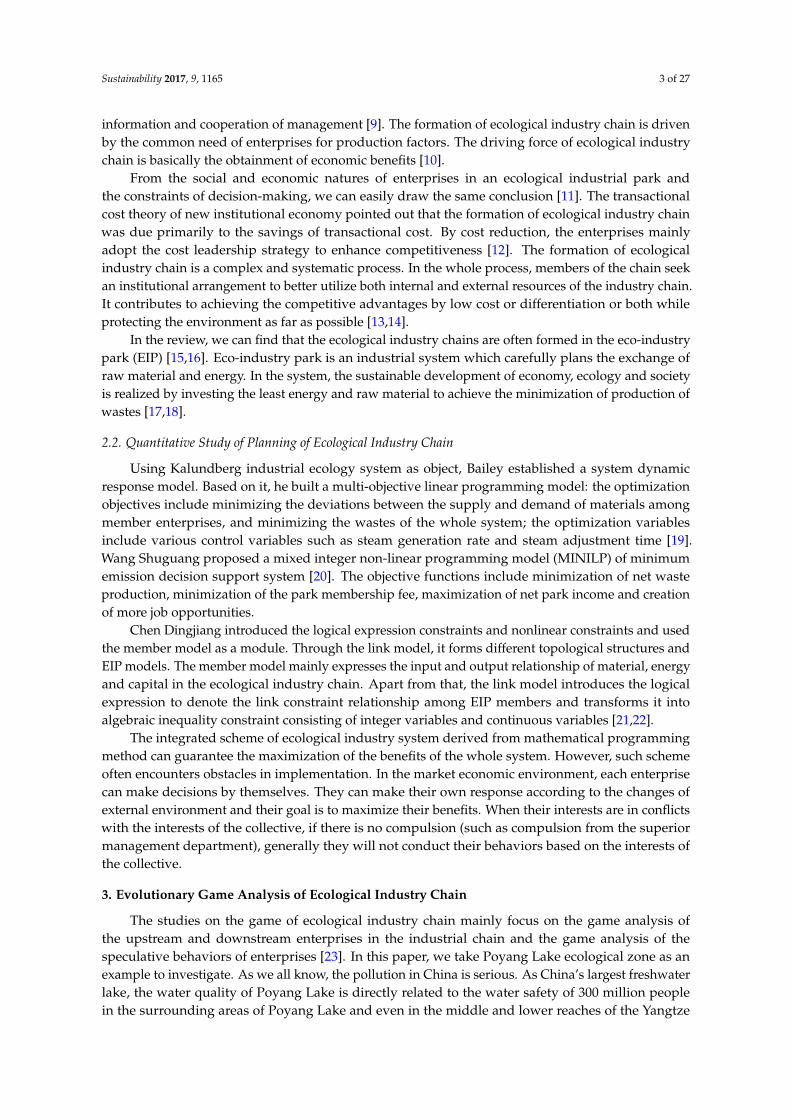
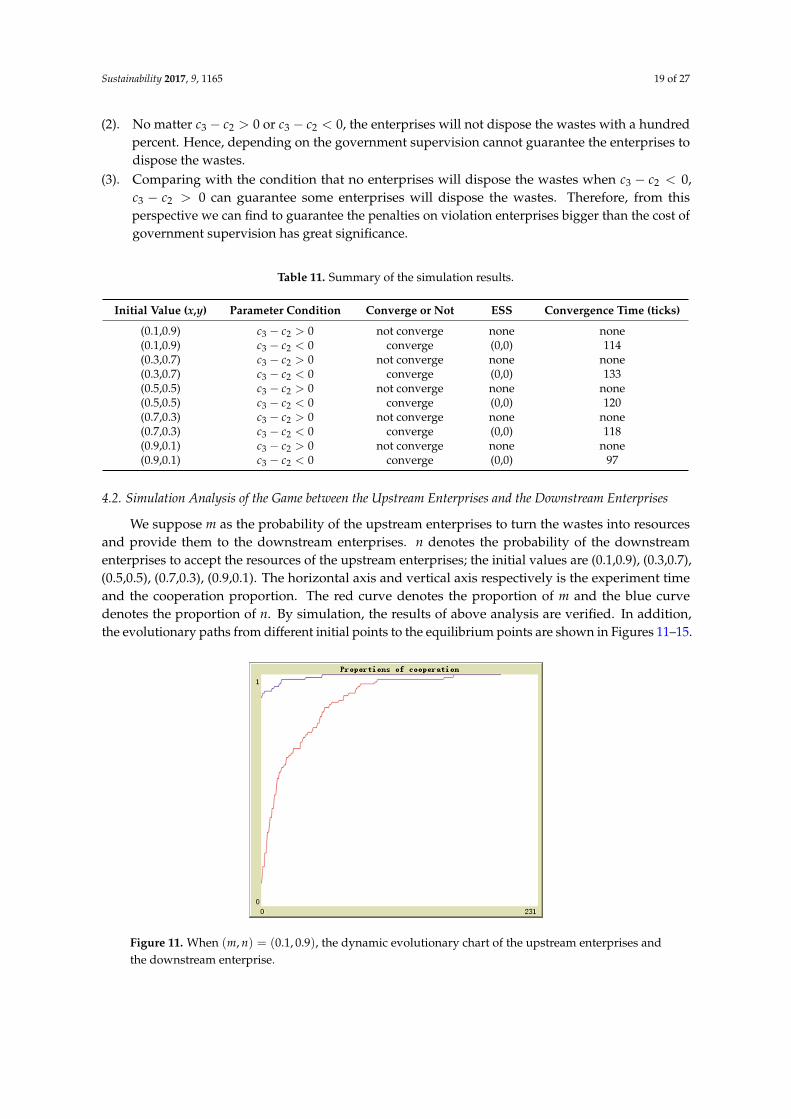
We suppose m as the probability of the upstream enterprises to turn the wastes into resourcesand provide them to the downstream enterprises. n denotes the probability of the downstreamenterprises to accept the resources of the upstream enterprises; the initial values are (0.1,0.9), (0.3,0.7),(0.5,0.5), (0.7,0.3), (0.9,0.1). The horizontal axis and vertical axis respectively is the experiment timeand the cooperation proportion. The red curve denotes the proportion of m and the blue curvedenotes the proportion of n. By simulation, the results of above analysis are verified. In addition,the evolutionary paths from different initial points to the equilibrium points are shown in Figures 11–15.
Sustainability 2017, 9, 1165 20 of 28
(0.9,0.1) 3 2 0c c converge (0,0) 97
4.2. Simulation Analysis of the Game between the Upstream Enterprises and the Downstream Enterprises
We suppose m as the probability of the upstream enterprises to turn the wastes into resources and provide them to the downstream enterprises. n denotes the probability of the downstream enterprises to accept the resources of the upstream enterprises; the initial values are (0.1,0.9), (0.3,0.7), (0.5,0.5), (0.7,0.3), (0.9,0.1). The horizontal axis and vertical axis respectively is the experiment time and the cooperation proportion. The red curve denotes the proportion of m and the blue curve denotes the proportion of n. By simulation, the results of above analysis are verified. In addition, the evolutionary paths from different initial points to the equilibrium points are shown in Figures 11–15.
Figure 11. When ( , ) (0.1,0.9)m n , the dynamic evolutionary chart of the upstream enterprises
and the downstream enterprise.
Figure 12. When ( , ) (0.3,0.7)m n , the dynamic evolutionary chart of the upstream enterprises
and the downstream enterprise.
Figure 11. When (m, n) = (0.1, 0.9), the dynamic evolutionary chart of the upstream enterprises andthe downstream enterprise.
Sustainability 2017, 9, 1165 20 of 27
Sustainability 2017, 9, 1165 20 of 28
(0.9,0.1) 3 2 0c c converge (0,0) 97
4.2. Simulation Analysis of the Game between the Upstream Enterprises and the Downstream Enterprises
We suppose m as the probability of the upstream enterprises to turn the wastes into resources and provide them to the downstream enterprises. n denotes the probability of the downstream enterprises to accept the resources of the upstream enterprises; the initial values are (0.1,0.9), (0.3,0.7), (0.5,0.5), (0.7,0.3), (0.9,0.1). The horizontal axis and vertical axis respectively is the experiment time and the cooperation proportion. The red curve denotes the proportion of m and the blue curve denotes the proportion of n. By simulation, the results of above analysis are verified. In addition, the evolutionary paths from different initial points to the equilibrium points are shown in Figures 11–15.
Figure 11. When ( , ) (0.1,0.9)m n , the dynamic evolutionary chart of the upstream enterprises
and the downstream enterprise.
Figure 12. When ( , ) (0.3,0.7)m n , the dynamic evolutionary chart of the upstream enterprises
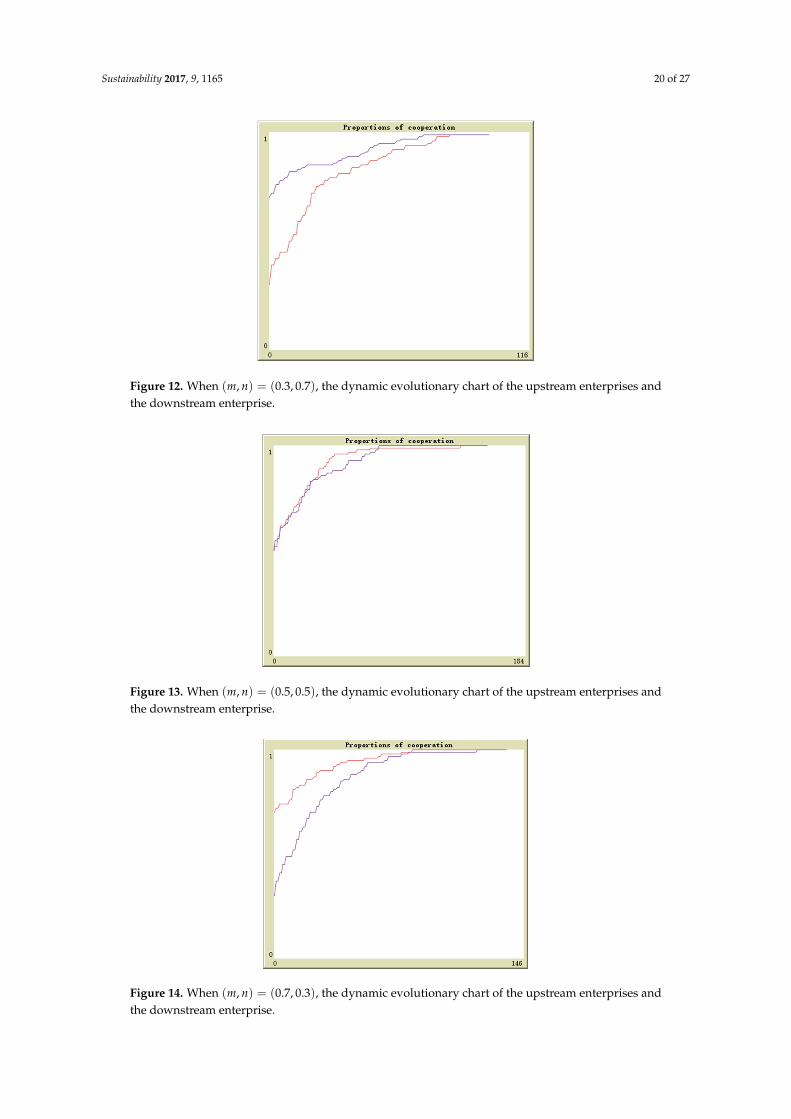
and the downstream enterprise. Figure 12. When (m, n) = (0.3, 0.7), the dynamic evolutionary chart of the upstream enterprises andthe downstream enterprise.
Sustainability 2017, 9, 1165 21 of 28
Figure 13. When ( , ) (0.5,0.5)m n , the dynamic evolutionary chart of the upstream enterprises
and the downstream enterprise.
Figure 14. When ( , ) (0.7,0.3)m n , the dynamic evolutionary chart of the upstream enterprises
and the downstream enterprise.
Figure 15. When ( , ) (0.9,0.1)m n , the dynamic evolutionary chart of the upstream enterprises
and the downstream enterprise.
Figure 13. When (m, n) = (0.5, 0.5), the dynamic evolutionary chart of the upstream enterprises andthe downstream enterprise.
Sustainability 2017, 9, 1165 21 of 28
Figure 13. When ( , ) (0.5,0.5)m n , the dynamic evolutionary chart of the upstream enterprises
and the downstream enterprise.
Figure 14. When ( , ) (0.7,0.3)m n , the dynamic evolutionary chart of the upstream enterprises
and the downstream enterprise.
Figure 15. When ( , ) (0.9,0.1)m n , the dynamic evolutionary chart of the upstream enterprises
and the downstream enterprise.
Figure 14. When (m, n) = (0.7, 0.3), the dynamic evolutionary chart of the upstream enterprises andthe downstream enterprise.
Sustainability 2017, 9, 1165 21 of 27
Sustainability 2017, 9, 1165 21 of 28
Figure 13. When ( , ) (0.5,0.5)m n , the dynamic evolutionary chart of the upstream enterprises
and the downstream enterprise.
Figure 14. When ( , ) (0.7,0.3)m n , the dynamic evolutionary chart of the upstream enterprises
and the downstream enterprise.
Figure 15. When ( , ) (0.9,0.1)m n , the dynamic evolutionary chart of the upstream enterprises
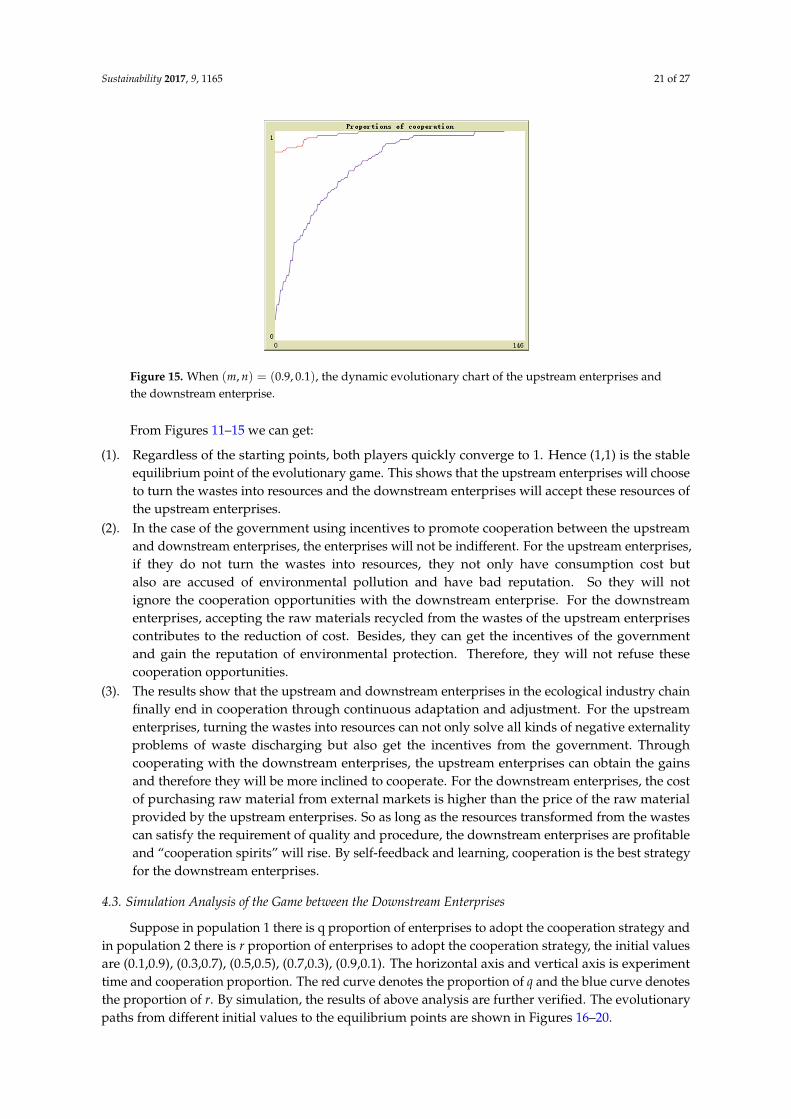
and the downstream enterprise. Figure 15. When (m, n) = (0.9, 0.1), the dynamic evolutionary chart of the upstream enterprises andthe downstream enterprise.
From Figures 11–15 we can get:
(1). Regardless of the starting points, both players quickly converge to 1. Hence (1,1) is the stableequilibrium point of the evolutionary game. This shows that the upstream enterprises will chooseto turn the wastes into resources and the downstream enterprises will accept these resources ofthe upstream enterprises.
(2). In the case of the government using incentives to promote cooperation between the upstreamand downstream enterprises, the enterprises will not be indifferent. For the upstream enterprises,if they do not turn the wastes into resources, they not only have consumption cost butalso are accused of environmental pollution and have bad reputation. So they will notignore the cooperation opportunities with the downstream enterprise. For the downstreamenterprises, accepting the raw materials recycled from the wastes of the upstream enterprisescontributes to the reduction of cost. Besides, they can get the incentives of the governmentand gain the reputation of environmental protection. Therefore, they will not refuse thesecooperation opportunities.
(3). The results show that the upstream and downstream enterprises in the ecological industry chainfinally end in cooperation through continuous adaptation and adjustment. For the upstreamenterprises, turning the wastes into resources can not only solve all kinds of negative externalityproblems of waste discharging but also get the incentives from the government. Throughcooperating with the downstream enterprises, the upstream enterprises can obtain the gainsand therefore they will be more inclined to cooperate. For the downstream enterprises, the costof purchasing raw material from external markets is higher than the price of the raw materialprovided by the upstream enterprises. So as long as the resources transformed from the wastescan satisfy the requirement of quality and procedure, the downstream enterprises are profitableand “cooperation spirits” will rise. By self-feedback and learning, cooperation is the best strategyfor the downstream enterprises.
4.3. Simulation Analysis of the Game between the Downstream Enterprises
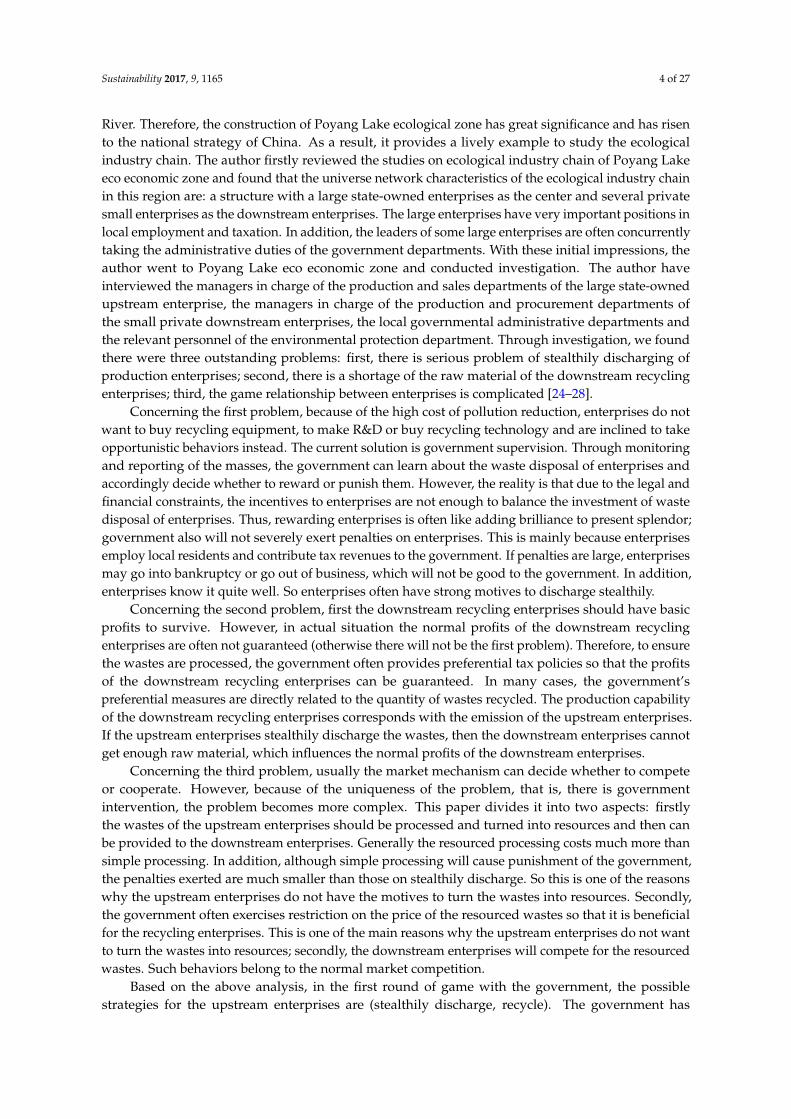
Suppose in population 1 there is q proportion of enterprises to adopt the cooperation strategy andin population 2 there is r proportion of enterprises to adopt the cooperation strategy, the initial valuesare (0.1,0.9), (0.3,0.7), (0.5,0.5), (0.7,0.3), (0.9,0.1). The horizontal axis and vertical axis is experimenttime and cooperation proportion. The red curve denotes the proportion of q and the blue curve denotesthe proportion of r. By simulation, the results of above analysis are further verified. The evolutionarypaths from different initial values to the equilibrium points are shown in Figures 16–20.
Sustainability 2017, 9, 1165 22 of 27
Sustainability 2017, 9, 1165 22 of 28
From Figures 11–15 we can get:
(1). Regardless of the starting points, both players quickly converge to 1. Hence (1,1) is the stable equilibrium point of the evolutionary game. This shows that the upstream enterprises will choose to turn the wastes into resources and the downstream enterprises will accept these resources of the upstream enterprises.
(2). In the case of the government using incentives to promote cooperation between the upstream and downstream enterprises, the enterprises will not be indifferent. For the upstream enterprises, if they do not turn the wastes into resources, they not only have consumption cost but also are accused of environmental pollution and have bad reputation. So they will not ignore the cooperation opportunities with the downstream enterprise. For the downstream enterprises, accepting the raw materials recycled from the wastes of the upstream enterprises contributes to the reduction of cost. Besides, they can get the incentives of the government and gain the reputation of environmental protection. Therefore, they will not refuse these cooperation opportunities.
(3). The results show that the upstream and downstream enterprises in the ecological industry chain finally end in cooperation through continuous adaptation and adjustment. For the upstream enterprises, turning the wastes into resources can not only solve all kinds of negative externality problems of waste discharging but also get the incentives from the government. Through cooperating with the downstream enterprises, the upstream enterprises can obtain the gains and therefore they will be more inclined to cooperate. For the downstream enterprises, the cost of purchasing raw material from external markets is higher than the price of the raw material provided by the upstream enterprises. So as long as the resources transformed from the wastes can satisfy the requirement of quality and procedure, the downstream enterprises are profitable and “cooperation spirits” will rise. By self-feedback and learning, cooperation is the best strategy for the downstream enterprises.
4.3. Simulation Analysis of the Game between the Downstream Enterprises
Suppose in population 1 there is q proportion of enterprises to adopt the cooperation strategy and in population 2 there is r proportion of enterprises to adopt the cooperation strategy, the initial values are (0.1,0.9), (0.3,0.7), (0.5,0.5), (0.7,0.3), (0.9,0.1). The horizontal axis and vertical axis is experiment time and cooperation proportion. The red curve denotes the proportion of q and the blue curve denotes the proportion of r. By simulation, the results of above analysis are further verified. The evolutionary paths from different initial values to the equilibrium points are shown in Figures 16–20.
Figure 16. When ( , ) (0.1,0.9)q r , the dynamic evolutionary chart of the downstream
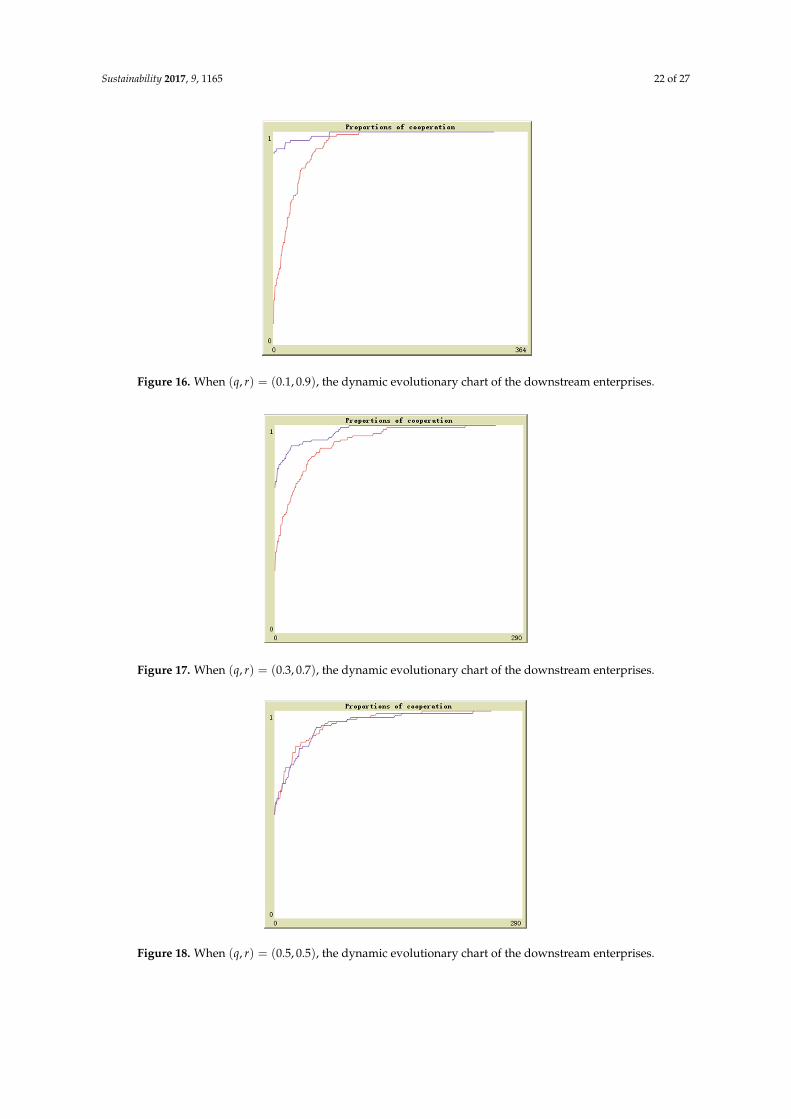
enterprises. Figure 16. When (q, r) = (0.1, 0.9), the dynamic evolutionary chart of the downstream enterprises.
Sustainability 2017, 9, 1165 23 of 28
Figure 17. When ( , ) (0.3,0.7)q r , the dynamic evolutionary chart of the downstream
enterprises.
Figure 18. When ( , ) (0.5,0.5)q r , the dynamic evolutionary chart of the downstream
enterprises.
Figure 19. When ( , ) (0.7,0.3)q r , the dynamic evolutionary chart of the downstream
enterprises.
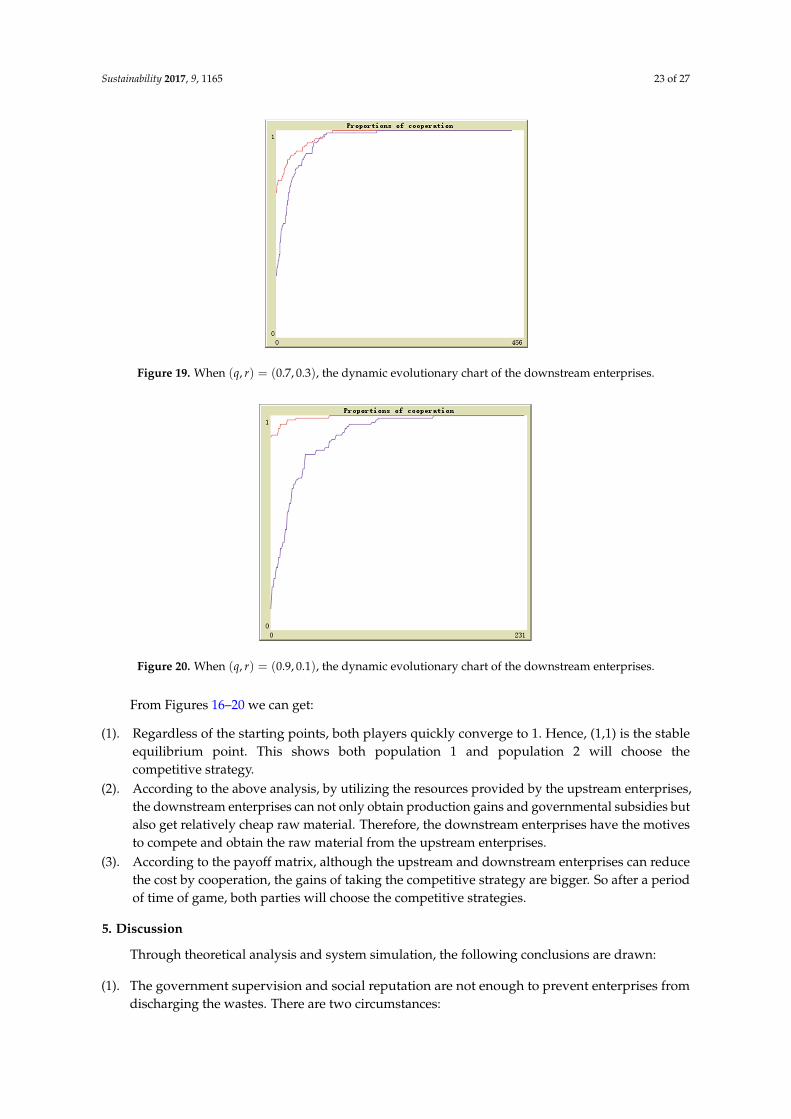
Figure 17. When (q, r) = (0.3, 0.7), the dynamic evolutionary chart of the downstream enterprises.
Sustainability 2017, 9, 1165 23 of 28
Figure 17. When ( , ) (0.3,0.7)q r , the dynamic evolutionary chart of the downstream
enterprises.
Figure 18. When ( , ) (0.5,0.5)q r , the dynamic evolutionary chart of the downstream
enterprises.
Figure 19. When ( , ) (0.7,0.3)q r , the dynamic evolutionary chart of the downstream
enterprises.
Figure 18. When (q, r) = (0.5, 0.5), the dynamic evolutionary chart of the downstream enterprises.
Sustainability 2017, 9, 1165 23 of 27
Sustainability 2017, 9, 1165 23 of 28
Figure 17. When ( , ) (0.3,0.7)q r , the dynamic evolutionary chart of the downstream
enterprises.
Figure 18. When ( , ) (0.5,0.5)q r , the dynamic evolutionary chart of the downstream
enterprises.
Figure 19. When ( , ) (0.7,0.3)q r , the dynamic evolutionary chart of the downstream
enterprises. Figure 19. When (q, r) = (0.7, 0.3), the dynamic evolutionary chart of the downstream enterprises.
Sustainability 2017, 9, 1165 24 of 28
Figure 20. When ( , ) (0.9,0.1)q r , the dynamic evolutionary chart of the downstream
enterprises.
From Figures 16–20 we can get:
(1). Regardless of the starting points, both players quickly converge to 1. Hence, (1,1) is the stable equilibrium point. This shows both population 1 and population 2 will choose the competitive strategy.
(2). According to the above analysis, by utilizing the resources provided by the upstream enterprises, the downstream enterprises can not only obtain production gains and governmental subsidies but also get relatively cheap raw material. Therefore, the downstream enterprises have the motives to compete and obtain the raw material from the upstream enterprises.
(3). According to the payoff matrix, although the upstream and downstream enterprises can reduce the cost by cooperation, the gains of taking the competitive strategy are bigger. So after a period of time of game, both parties will choose the competitive strategies.
5. Discussion
Through theoretical analysis and system simulation, the following conclusions are drawn:
(1). The government supervision and social reputation are not enough to prevent enterprises from discharging the wastes. There are two circumstances: ① When government penalties on violation enterprises are bigger than the cost of
government supervision, through multi-agent computational experiment analysis we can find regardless of the starting points, both players are back and forth around (0,1) and cannot reach the stable equilibrium point; from the evolutionary curve we can see both enterprises and the government are playing the cat and mouse game. That is, when most enterprises choose not to dispose the wastes, the probability of government supervision increases; when the probability of government supervision increases, most enterprises begin to dispose the wastes; when most enterprises begin to dispose the wastes, the probability of government supervision decreases; when the probability of government supervision decreases, most enterprises begin not to dispose the wastes. Therefore, reflected on the evolutionary curve, we can see the two curves have similar shapes but there is a certain distance. From the simulation we can see that the red curve is always above the blue curve, indicating that the probability of government supervision is always lower than the probability of waste disposal of the upstream enterprises. Comparing with enterprises, the government has no greater motive to supervise. By disposing the wastes the upstream enterprises can improve reputation and get the
Figure 20. When (q, r) = (0.9, 0.1), the dynamic evolutionary chart of the downstream enterprises.
From Figures 16–20 we can get:
(1). Regardless of the starting points, both players quickly converge to 1. Hence, (1,1) is the stableequilibrium point. This shows both population 1 and population 2 will choose thecompetitive strategy.
(2). According to the above analysis, by utilizing the resources provided by the upstream enterprises,the downstream enterprises can not only obtain production gains and governmental subsidies butalso get relatively cheap raw material. Therefore, the downstream enterprises have the motivesto compete and obtain the raw material from the upstream enterprises.
(3). According to the payoff matrix, although the upstream and downstream enterprises can reducethe cost by cooperation, the gains of taking the competitive strategy are bigger. So after a periodof time of game, both parties will choose the competitive strategies.
5. Discussion
Through theoretical analysis and system simulation, the following conclusions are drawn:
(1). The government supervision and social reputation are not enough to prevent enterprises fromdischarging the wastes. There are two circumstances:
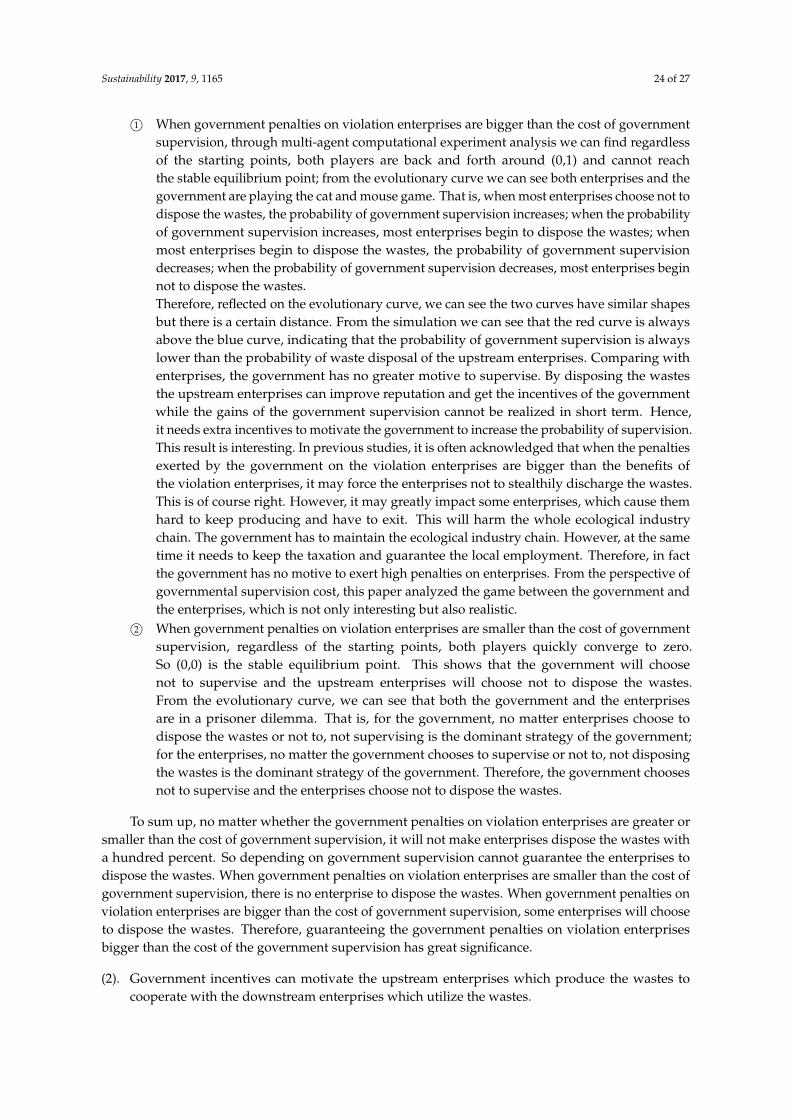
Sustainability 2017, 9, 1165 24 of 27
1© When government penalties on violation enterprises are bigger than the cost of governmentsupervision, through multi-agent computational experiment analysis we can find regardlessof the starting points, both players are back and forth around (0,1) and cannot reachthe stable equilibrium point; from the evolutionary curve we can see both enterprises and thegovernment are playing the cat and mouse game. That is, when most enterprises choose not todispose the wastes, the probability of government supervision increases; when the probabilityof government supervision increases, most enterprises begin to dispose the wastes; whenmost enterprises begin to dispose the wastes, the probability of government supervisiondecreases; when the probability of government supervision decreases, most enterprises beginnot to dispose the wastes.Therefore, reflected on the evolutionary curve, we can see the two curves have similar shapesbut there is a certain distance. From the simulation we can see that the red curve is alwaysabove the blue curve, indicating that the probability of government supervision is alwayslower than the probability of waste disposal of the upstream enterprises. Comparing withenterprises, the government has no greater motive to supervise. By disposing the wastesthe upstream enterprises can improve reputation and get the incentives of the governmentwhile the gains of the government supervision cannot be realized in short term. Hence,it needs extra incentives to motivate the government to increase the probability of supervision.This result is interesting. In previous studies, it is often acknowledged that when the penaltiesexerted by the government on the violation enterprises are bigger than the benefits ofthe violation enterprises, it may force the enterprises not to stealthily discharge the wastes.This is of course right. However, it may greatly impact some enterprises, which cause themhard to keep producing and have to exit. This will harm the whole ecological industrychain. The government has to maintain the ecological industry chain. However, at the sametime it needs to keep the taxation and guarantee the local employment. Therefore, in factthe government has no motive to exert high penalties on enterprises. From the perspective ofgovernmental supervision cost, this paper analyzed the game between the government andthe enterprises, which is not only interesting but also realistic.
2© When government penalties on violation enterprises are smaller than the cost of governmentsupervision, regardless of the starting points, both players quickly converge to zero.So (0,0) is the stable equilibrium point. This shows that the government will choosenot to supervise and the upstream enterprises will choose not to dispose the wastes.From the evolutionary curve, we can see that both the government and the enterprisesare in a prisoner dilemma. That is, for the government, no matter enterprises choose todispose the wastes or not to, not supervising is the dominant strategy of the government;for the enterprises, no matter the government chooses to supervise or not to, not disposingthe wastes is the dominant strategy of the government. Therefore, the government choosesnot to supervise and the enterprises choose not to dispose the wastes.
To sum up, no matter whether the government penalties on violation enterprises are greater orsmaller than the cost of government supervision, it will not make enterprises dispose the wastes witha hundred percent. So depending on government supervision cannot guarantee the enterprises todispose the wastes. When government penalties on violation enterprises are smaller than the cost ofgovernment supervision, there is no enterprise to dispose the wastes. When government penalties onviolation enterprises are bigger than the cost of government supervision, some enterprises will chooseto dispose the wastes. Therefore, guaranteeing the government penalties on violation enterprisesbigger than the cost of the government supervision has great significance.
(2). Government incentives can motivate the upstream enterprises which produce the wastes tocooperate with the downstream enterprises which utilize the wastes.
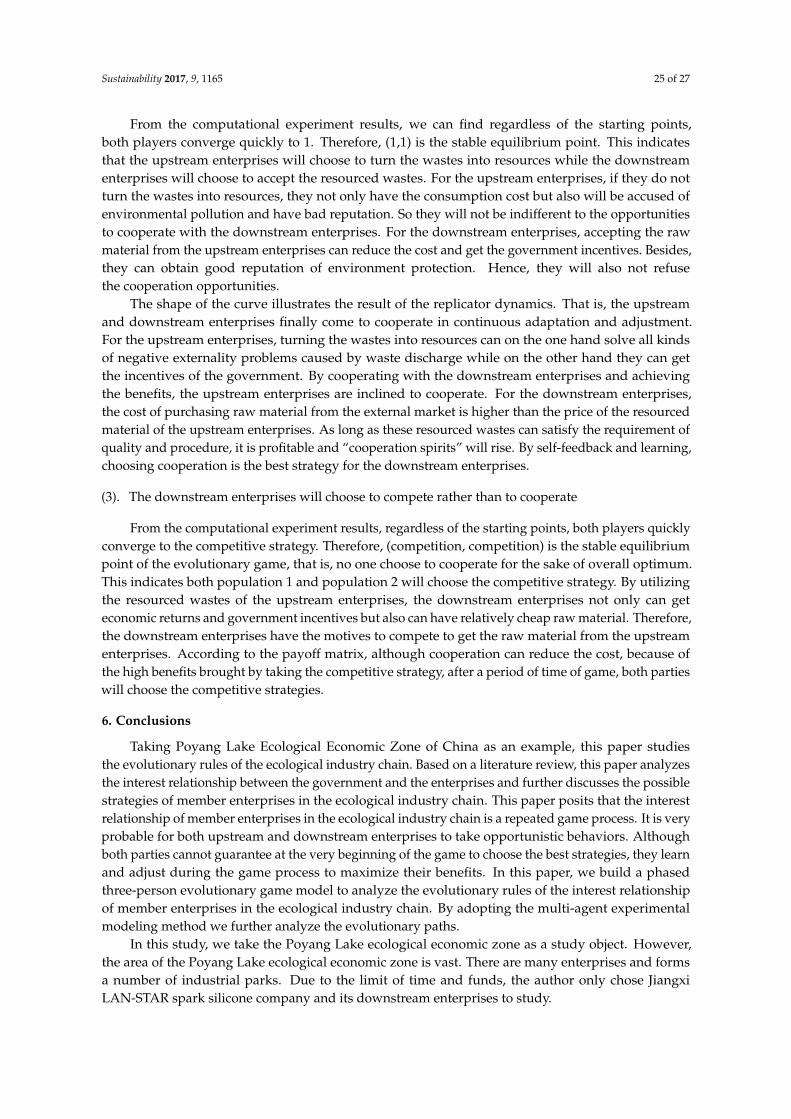
Sustainability 2017, 9, 1165 25 of 27
From the computational experiment results, we can find regardless of the starting points,both players converge quickly to 1. Therefore, (1,1) is the stable equilibrium point. This indicatesthat the upstream enterprises will choose to turn the wastes into resources while the downstreamenterprises will choose to accept the resourced wastes. For the upstream enterprises, if they do notturn the wastes into resources, they not only have the consumption cost but also will be accused ofenvironmental pollution and have bad reputation. So they will not be indifferent to the opportunitiesto cooperate with the downstream enterprises. For the downstream enterprises, accepting the rawmaterial from the upstream enterprises can reduce the cost and get the government incentives. Besides,they can obtain good reputation of environment protection. Hence, they will also not refusethe cooperation opportunities.
The shape of the curve illustrates the result of the replicator dynamics. That is, the upstreamand downstream enterprises finally come to cooperate in continuous adaptation and adjustment.For the upstream enterprises, turning the wastes into resources can on the one hand solve all kindsof negative externality problems caused by waste discharge while on the other hand they can getthe incentives of the government. By cooperating with the downstream enterprises and achievingthe benefits, the upstream enterprises are inclined to cooperate. For the downstream enterprises,the cost of purchasing raw material from the external market is higher than the price of the resourcedmaterial of the upstream enterprises. As long as these resourced wastes can satisfy the requirement ofquality and procedure, it is profitable and “cooperation spirits” will rise. By self-feedback and learning,choosing cooperation is the best strategy for the downstream enterprises.
(3). The downstream enterprises will choose to compete rather than to cooperate
From the computational experiment results, regardless of the starting points, both players quicklyconverge to the competitive strategy. Therefore, (competition, competition) is the stable equilibriumpoint of the evolutionary game, that is, no one choose to cooperate for the sake of overall optimum.This indicates both population 1 and population 2 will choose the competitive strategy. By utilizingthe resourced wastes of the upstream enterprises, the downstream enterprises not only can geteconomic returns and government incentives but also can have relatively cheap raw material. Therefore,the downstream enterprises have the motives to compete to get the raw material from the upstreamenterprises. According to the payoff matrix, although cooperation can reduce the cost, because ofthe high benefits brought by taking the competitive strategy, after a period of time of game, both partieswill choose the competitive strategies.
6. Conclusions
Taking Poyang Lake Ecological Economic Zone of China as an example, this paper studiesthe evolutionary rules of the ecological industry chain. Based on a literature review, this paper analyzesthe interest relationship between the government and the enterprises and further discusses the possiblestrategies of member enterprises in the ecological industry chain. This paper posits that the interestrelationship of member enterprises in the ecological industry chain is a repeated game process. It is veryprobable for both upstream and downstream enterprises to take opportunistic behaviors. Althoughboth parties cannot guarantee at the very beginning of the game to choose the best strategies, they learnand adjust during the game process to maximize their benefits. In this paper, we build a phasedthree-person evolutionary game model to analyze the evolutionary rules of the interest relationshipof member enterprises in the ecological industry chain. By adopting the multi-agent experimentalmodeling method we further analyze the evolutionary paths.
In this study, we take the Poyang Lake ecological economic zone as a study object. However,the area of the Poyang Lake ecological economic zone is vast. There are many enterprises and formsa number of industrial parks. Due to the limit of time and funds, the author only chose JiangxiLAN-STAR spark silicone company and its downstream enterprises to study.
Sustainability 2017, 9, 1165 26 of 27
Although they can well represent the current situation of eco industrial chain of Poyang Lakeecological economic zone, from the development perspective, the rapid development of the PoyangLake ecological economic zone may indicate the companies we choose are slightly less representative.
Eco industrial chain has become the focus of academic attention and there is considerable room forresearch in the future. Although the author has made great efforts to improve the paper in the preliminarypreparation and the actual writing stage, the present research achievements, as mentioned above, still havemany deficiencies due to the limitation of time, energy and length. It also shows that this study canextend the related topics for further research, including the following directions for future research:
Firstly, the limitation of the sample directly affects the persuasiveness of the empirical results.In the next studies, we will strive to cover more different types of industrial clusters so as to analyzethe problems of the ecological industry chain in Poyang Lake eco economic zone more comprehensively.
Secondly, in the game analysis we only consider the government regulation behavior withoutconsidering the governmental support behaviors in financing, tax and other public services. In the nextstudy, we should take all these actual behaviors into overall consideration and therefore better providesupport for management decision-making. Nevertheless, how to reasonably quantify these behaviorsis a major challenge for future research.
Thirdly, in the evolutionary game analysis between the upstream and downstream enterprises andamong the downstream enterprises, we have not taken the characteristics of the networks into account.Part of the reason is that this paper is developed based on the Poyang Lake ecological economic zone.Due to the limited scope, the enterprises in the network are directly connected with each other. Hence,this paper assumes the enterprises are in stochastic gam, which is in line with the actual situation.However, if we want to generalize it, we must consider the influence of network structure and networkreciprocity, which can be the work direction of future studies.
Fourthly, this paper assumes that the behavioral subjects have bounded rationality and theymay have different perceptions to earnings. Some studies pointed out that the perception to earningsdepends on individual and contextual factors. By designing the value function of each subject,to combine the individual and contextual factors, the benefit perception functions of different subjectscan be obtained. On the basis of the game analysis, to further conduct computational experiments andsimulation of system dynamics is an interesting direction.
Acknowledgments: This work is supported by the NSFC Grant No. (71361013, 71462009, 71463020,71273122); Outstanding Young Scholars of Jiangxi Provincial Science Fund of PRC Grant No. (20171BCB23050);Science and technology project of Jiangxi Provincial Department of Education Grant No. (GJJ160435, GJJ160440);Jiangxi Province Science Foundation of China under Grants No. (20171BAA208013).
Conflicts of Interest: The author declares no conflict of interest.
References
1. Silva, S.; Soares, I.; Afonso, O. Tax on emissions or subsidy to renewables? Evaluating the effects onthe economy and on the environment. Appl. Econ. Lett. 2016, 10, 1–5. [CrossRef]
2. Tang, Q.Y.; Qian, X.Y. Environmental Protection and Sustainable Development; Higher Education Press:Beijing, China, 2000; pp. 1–25.
3. Alwi, S.R.W.; Klemeš, J.J.; Varbanov, P.S. Cleaner energy planning, management and technologies:Perspectives of supply-demand side and end-of-pipe management. J. Clean. Prod. 2016, 136, 1–13. [CrossRef]
4. Romero-Hermida, I.; Morales-Flórez, V.; Santos, A.; Villena, A.; Esquivias, L. Technological Proposals forRecycling Industrial Wastes for Environmental Applications. Minerals 2016, 43, 746–757. [CrossRef]
5. Deng, N.S.; Wu, F. Industrial Ecology—Theory and Application; Chemical Industry Press: Beijing, China, 2003;pp. 3–4.
6. Roberts, B.H. The application of industrial ecology principles and planning guidelines for the developmentof eco-industrial parks: An Australian case study. J. Clean. Prod. 2004, 12, 997–1010. [CrossRef]
7. Wang, Q.S.; Yuan, X.L.; Zuo, J.; Zhang, J.; Hong, J.L.; Lin, C. Optimization of Ecological Industrial Chaindesign based on reliability theory—A case study. J. Clean. Prod. 2016, 124, 175–182. [CrossRef]
Sustainability 2017, 9, 1165 27 of 27
8. Chen, S.H. The influencing factors of enterprise sustainable innovation: An empirical study. Sustainability2016, 8, 425–443. [CrossRef]
9. Weber, C.A.; Current, J.R.; Benton, W.C. Vendor selection Criteria and Method. Eur. J. Oper. Res. 1991, 50,2–18. [CrossRef]
10. Pellenbarg, P.H. Sustainable business sites in the Netherlands: A survey of policies and experiences. J. Environ.Plan. Manag. 2002, 45, 59–84. [CrossRef]
11. Wang, H.; Ye, X. Analysis on Driver Mechanism of Enterprises in Eco-Industrial Parks. Environ. Prot. 2005, 7,72–75. [CrossRef]
12. Wang, Z.H. Study on the symbiosis mechanism of enterprises in eco-industrial park based on transactioncost theory. Sci. Sci. Manag. S. T. 2002, 8, 9–13.
13. Cai, X.J.; Li, S.J.; Liu, Q.H. Study on Establishing Mechanism and Stability of Symbiotic Industry Chainin Eco-industry Parks. Soft Sci. 2006, 3, 12–15.
14. Chen, S.-H. The game analysis of negative externality of environmental logistics and governmental regulation.Int. J. Environ. Pollut. 2013, 51, 143–155. [CrossRef]
15. Raina, G.F.W.; Diaz-Grande, J.A.; Burgos, A.C. Sustainability in industrialised architecture: Closingthe materials cycle. Inf. Constr. 2011, 61, 37–51.
16. Lowe, E.A. Creating by-product resource exchanges: Strategies for eco-industrial parks. J. Clean. Prod. 1997,5, 51–65. [CrossRef]
17. Haskins, C. Multidisciplinary investigation of eco-industrial parks. Syst. Eng. 2006, 9, 313–330. [CrossRef]18. Liwarska-Bizukojc, E.; Bizukojc, M.; Marcinkowski, A.; Doniec, A. The conceptual model of an eco-industrial
park based upon ecological relationships. J. Clean. Prod. 2009, 17, 732–741. [CrossRef]19. Bailey, R. Designing Robust Industrial Ecosystems: A Systems Approach. Master’s Thesis, Georgia Institute
of Technology, Atlanta, GA, USA, 1997.20. Wang, S.G. Research on the Problem of Minimum Emission Community. Master’s Thesis, Tsinghua University,
Beijing, China, 1998.21. Chen, D.J. Research on Integration and Complexity of Industrial Ecosystem. Ph.D. Thesis, Tsinghua University,
Beijing, China, 2003.22. Wei, H. An Inventory Controlled Supply Chain Model Based on Improved BP Neural Network. Discret. Dyn.
Nat. Soc. 2013, 5, 1–7. [CrossRef]23. Lou, H.H.; Kulkarnima, S.H. A game theory based approach for energy analysis Industrial ecosystem under
uncertainty. Clear. Technol. Environ. Policy 2002, 3, 166–172.24. He, X.W. Evaluation of Regional Resources, Environment Carrying Capacity and Optimization of Industrial
Structure Adjustment—A Case Study of Poyang Lake Eco-Economic Zone. Enterp. Econ. 2015, 10, 148–151.25. Wang, J.; Kong, F.B. Efficiency Evaluation of Regional Industrial Ecology—A Case Study of Poyang Lake
Eco-Economic Zone. Econ. Geogr. 2012, 32, 101–107.26. Chen, W.H.; Guan, X.Y.; Liu, S.Q. Low Carbonization and Ecological Civilization Realization—A Case Study
of Poyang Lake Eco-Economic Zone. Manag. World 2011, 1, 170–181.27. Yang, T.P. Analysis of Development Patter n on County Ecological Economy in Less-Developed Regions and
its Implications—Case Studies of Hukou County and Pengze County in Poyang Lake Ecological EconomicZone. Econ. Geogr. 2012, 1, 15–20.
28. He, W.; Chen, S.H. Game analysis of determinants of stability of semiconductor modular productionnetworks. Sustainability 2014, 6, 4772–4794. [CrossRef]
29. Friedman, D. On economic applications of evolutionary game theory. J. Evol. Econ. 1998, 8, 15–43. [CrossRef]30. Chen, S.H. An Evolutionary Game Model of Knowledge Workers’ Counterproductive Work Behaviors Based
on Preferences. Complexity 2017, 2017, 1–11. [CrossRef]31. Thiele, J.C.; Grimm, V. NetLogo meets R: Linking agent-based models with a toolbox for their analysis.
Environ. Model. Softw. 2010, 25, 972–974. [CrossRef]32. Sklar, E. NetLogo, a multi-agent simulation environment. Artif. Life 2007, 13, 303–311. [CrossRef] [PubMed]
© 2017 by the author. Licensee MDPI, Basel, Switzerland. This article is an open accessarticle distributed under the terms and conditions of the Creative Commons Attribution(CC BY) license (http://creativecommons.org/licenses/by/4.0/).


![Tian-tai Metaphysics vs. Hua-yan Metaphysics A Comparative Study [Online Version Only] By Jee Loo Liu](https://img.pdfslide.us/doc/110x75/555886d1d8b42a5d328b4f8a/tian-tai-metaphysics-vs-hua-yan-metaphysics-a-comparative-study-online-version-only-by-jee-loo-liu.jpg)