Embed Size (px)
Citation preview
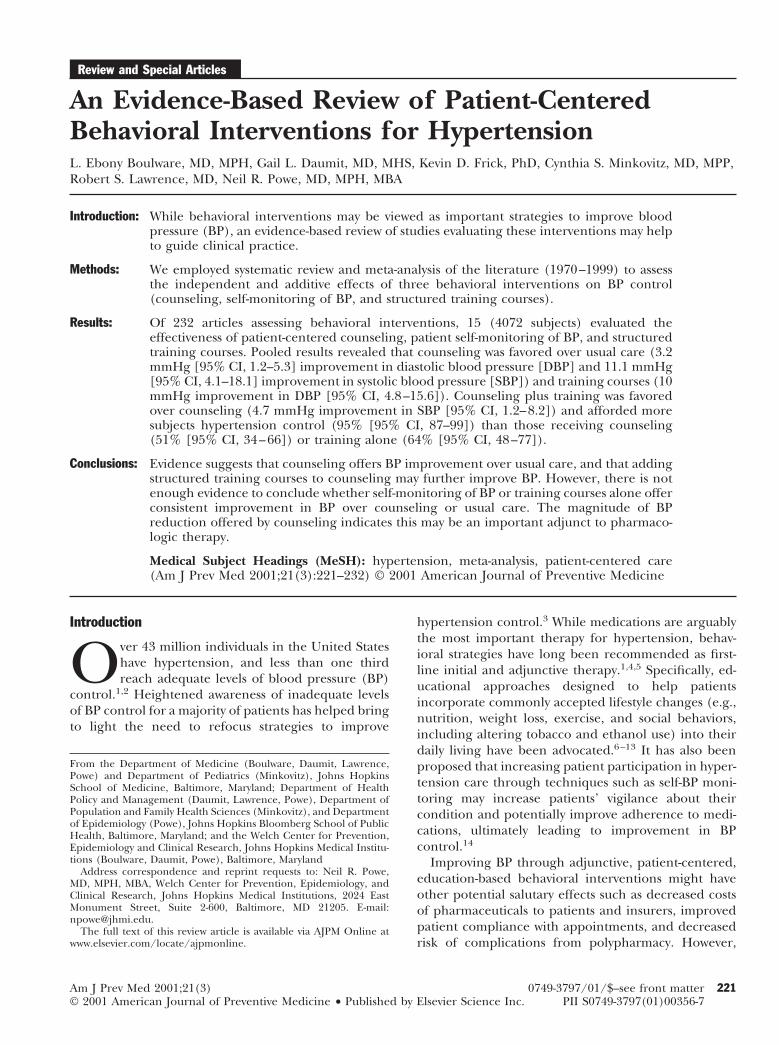
Review and Special Articles
An Evidence-Based Review of Patient-CenteredBehavioral Interventions for HypertensionL. Ebony Boulware, MD, MPH, Gail L. Daumit, MD, MHS, Kevin D. Frick, PhD, Cynthia S. Minkovitz, MD, MPP,Robert S. Lawrence, MD, Neil R. Powe, MD, MPH, MBA
Introduction: While behavioral interventions may be viewed as important strategies to improve bloodpressure (BP), an evidence-based review of studies evaluating these interventions may helpto guide clinical practice.
Methods: We employed systematic review and meta-analysis of the literature (1970–1999) to assessthe independent and additive effects of three behavioral interventions on BP control(counseling, self-monitoring of BP, and structured training courses).
Results: Of 232 articles assessing behavioral interventions, 15 (4072 subjects) evaluated theeffectiveness of patient-centered counseling, patient self-monitoring of BP, and structuredtraining courses. Pooled results revealed that counseling was favored over usual care (3.2mmHg [95% CI, 1.2–5.3] improvement in diastolic blood pressure [DBP] and 11.1 mmHg[95% CI, 4.1–18.1] improvement in systolic blood pressure [SBP]) and training courses (10mmHg improvement in DBP [95% CI, 4.8–15.6]). Counseling plus training was favoredover counseling (4.7 mmHg improvement in SBP [95% CI, 1.2–8.2]) and afforded moresubjects hypertension control (95% [95% CI, 87–99]) than those receiving counseling(51% [95% CI, 34–66]) or training alone (64% [95% CI, 48–77]).
Conclusions: Evidence suggests that counseling offers BP improvement over usual care, and that addingstructured training courses to counseling may further improve BP. However, there is notenough evidence to conclude whether self-monitoring of BP or training courses alone offerconsistent improvement in BP over counseling or usual care. The magnitude of BPreduction offered by counseling indicates this may be an important adjunct to pharmaco-logic therapy.
Medical Subject Headings (MeSH): hypertension, meta-analysis, patient-centered care(Am J Prev Med 2001;21(3):221–232) © 2001 American Journal of Preventive Medicine
Introduction
Over 43 million individuals in the United Stateshave hypertension, and less than one thirdreach adequate levels of blood pressure (BP)
control.1,2 Heightened awareness of inadequate levelsof BP control for a majority of patients has helped bringto light the need to refocus strategies to improve
hypertension control.3 While medications are arguablythe most important therapy for hypertension, behav-ioral strategies have long been recommended as first-line initial and adjunctive therapy.1,4,5 Specifically, ed-ucational approaches designed to help patientsincorporate commonly accepted lifestyle changes (e.g.,nutrition, weight loss, exercise, and social behaviors,including altering tobacco and ethanol use) into theirdaily living have been advocated.6–13 It has also beenproposed that increasing patient participation in hyper-tension care through techniques such as self-BP moni-toring may increase patients’ vigilance about theircondition and potentially improve adherence to medi-cations, ultimately leading to improvement in BPcontrol.14
Improving BP through adjunctive, patient-centered,education-based behavioral interventions might haveother potential salutary effects such as decreased costsof pharmaceuticals to patients and insurers, improvedpatient compliance with appointments, and decreasedrisk of complications from polypharmacy. However,
From the Department of Medicine (Boulware, Daumit, Lawrence,Powe) and Department of Pediatrics (Minkovitz), Johns HopkinsSchool of Medicine, Baltimore, Maryland; Department of HealthPolicy and Management (Daumit, Lawrence, Powe), Department ofPopulation and Family Health Sciences (Minkovitz), and Departmentof Epidemiology (Powe), Johns Hopkins Bloomberg School of PublicHealth, Baltimore, Maryland; and the Welch Center for Prevention,Epidemiology and Clinical Research, Johns Hopkins Medical Institu-tions (Boulware, Daumit, Powe), Baltimore, Maryland
Address correspondence and reprint requests to: Neil R. Powe,MD, MPH, MBA, Welch Center for Prevention, Epidemiology, andClinical Research, Johns Hopkins Medical Institutions, 2024 EastMonument Street, Suite 2-600, Baltimore, MD 21205. E-mail:[email protected].
The full text of this review article is available via AJPM Online atwww.elsevier.com/locate/ajpmonline.
221Am J Prev Med 2001;21(3) 0749-3797/01/$–see front matter© 2001 American Journal of Preventive Medicine • Published by Elsevier Science Inc. PII S0749-3797(01)00356-7
some physicians may have difficulty employing suchtechniques because of increasing time pressures, lim-ited resources and reimbursement for interventionssuch as counseling, and uncertainty regarding whichapproaches to patient education are most effective. Atthe same time, other physicians may employ thesetechniques without substantive evidence to support thetime, energy, and resources required to appropriatelycarry out these interventions.
To address these issues, we performed a systematicreview to assess the independent and incremental ef-fects of three commonly performed patient education–based behavioral interventions on BP control: counsel-ing techniques, structured training courses, and patientself-monitoring of BP.
MethodsStudy Design and Eligibility Criteria
We conducted a systematic review of the literature describingbehavioral interventions for hypertension. We sought toaddress two hypotheses in this review: (1) that the structure ofmultidimensional patient education may be important inrelaying commonly accepted lifestyle advice, and (2) thatpatient self-BP monitoring (alone or in combination withpatient education), by more directly involving patients intheir care, may offer independent and/or incremental advan-tages over education approaches alone. To address thesehypotheses, we investigated the effectiveness of counseling,structured training courses, and patient self-BP monitoringinterventions when used singly or in combination to improveBP control.
We included only peer-reviewed English-language articles,published from January 1970 through July 1999, which fo-cused on counseling, structured training courses, and patientself-BP monitoring. Self-monitoring of BP was defined ashome BP monitoring performed by the patient for thepurposes of recording or monitoring BP. Counseling wasdefined as individual or group discussion and teaching with apersonalized approach, set in a nonclassroom format inwhich individuals or group members might often share theirpersonal experiences. Training courses, which were curricu-lum-based courses aimed at teaching several people at once,were less personal than group counseling and usually oc-curred in a classroom setting with one or more curriculumleaders. Both counseling and training interventions weremultidimensional in nature, primarily advocating general,commonly accepted lifestyle practice changes: encouraginghealthy diet, weight loss, exercise, and tobacco cessation. Wesought to assess common clinical practice in terms of coun-seling structure and general content of patient education,and we hypothesized that many primarily diet-focused inter-ventions might, through attempts to drastically decreaseweight and serum sodium, have additional effects on bloodpressure reduction. Thus, although we included studies in-corporating general dietary counseling as a part of a multidi-mensional education program, we eliminated several studiesthat were centered primarily on diet and weight loss—focusing on efficacy of treatment rather than effective-ness—or that focused on a specific diet prescription. For
example, studies with interventions featuring meals that wereprepared for participants were excluded, as were studies withinterventions featuring diets with a prescribed amount ofsodium, potassium, magnesium, or calorie intake. Finally, weincluded studies that were primarily “patient-centered.” Thatis, we sought to evaluate studies that were designed to detectthe effects of changes in patient behavior on BP as a result ofthe intervention, not interventions in which the healthcareprovider was the unit of analysis.
We excluded efficacy studies for drug therapy for hyper-tension and any articles that did not measure a clinicaloutcome (e.g., blood pressure, hypertension control, or pa-tient compliance with medical regimen). In addition, weexcluded articles with a total sample size of ,50 people or,25 people in each study arm.
Identification of Articles
To find eligible articles, we searched medical and psychologyelectronic databases (Medline, PsychInfo, CINAHL, HealthStar, Sociologic Abstracts, Social Science Abstracts, EI Com-pendex, and Current Contents) using keywords and medicalsubject headings (MeSH) including: blood pressure, commu-nity based, coping behavior, counseling (group, individual),disease detection, health behavior, health education, hyper-tension, locus of control, managed care, meta-analysis, occu-pational health, patient compliance, physician behavior, pre-ventive health services, research synthesis, screening, andtreatment compliance. For each relevant article, we reviewedthe references for additional candidate studies, and we ob-tained references from experts in hypertension.
Data Extraction
Using a structured abstraction instrument, data were ab-stracted on content, quality, and outcomes of studies.15 Sixreviewers participated in literature abstraction, with two re-viewers independently abstracting data on each article. Gen-eral information (e.g., study subject characteristics, setting, anddesign) was abstracted, as well as more specific characteristicsof the intervention (e.g., leader of intervention, length ofeach session of the intervention, frequency of sessions, dura-tion of the entire study, and the criteria used for BP control).
Follow-up BP measurements for study groups receiving theintervention of interest were abstracted. Up to seven discreteoutcomes were reported: difference in either (1) diastolicblood pressure (DBP) or (2) systolic blood pressure (SBP)between treatment and control groups at follow-up, differ-ence in change in (3) DBP or (4) SBP between treatment andcontrol groups, change in either (5) DBP or (6) SBP atfollow-up, and (7) percentage of subjects with hypertensioncontrol at follow-up. Difference in change in DBP and SBPbetween follow-up represents the difference between thechange in BP for one group from start to end of the studyminus the change in the other group from start to end of thestudy. After initial independent data abstraction by eachreviewer, the two reviewers adjudicated differences in qualityratings and data abstraction until they came to an agreement.
Assessment of Article Quality
We developed a 100-point scale to describe the internal andexternal validity of the studies, as well as the reporting of
222 American Journal of Preventive Medicine, Volume 21, Number 3
important study characteristics. This scale included threedimensions: (1) study population description, (2) interven-tion design/outcomes description, and (3) methods of anal-ysis and results reporting. Study population description fo-cused on the articles’ descriptions of sociodemographiccharacteristics of those who enrolled versus those who did notenroll and reasons for eligible subjects not enrolling. Studyintervention design/outcomes description focused on howthe intervention was described, quality of randomization andblinding (if applicable), handling of withdrawals or cross-overs, comparability of treatment groups (if applicable),length and frequency of the intervention, percentage ofsubjects completing the intervention, and assessment of out-comes. Study analysis focused on appropriateness of statisticaltests chosen and presentation of statistical significance. Di-mensions were weighted similar to Chalmers et al.16 (Studypopulation/design570% of the total possible score; studyanalysis530% of the total possible score.)
Data Synthesis and Statistical Analysis
We evaluated initial agreement between raters for the assess-ment of article quality by calculating the observed percentageagreement and the k coefficient for interrater reliability.17
To include all evidence available to evaluate these interven-tions, we assigned a “study type” to each article for thepurpose of statistical analysis: (1) single-intervention group,and (2) between-intervention groups. An intervention groupwas defined as a group of study participants receiving aparticular intervention.
Single-Intervention Group Analysis
If an article described a study comparing more than oneintervention but not all the interventions met the eligibilitycriteria for this review, we abstracted information on only theintervention groups receiving the interventions of interest.We then analyzed these abstracted results as if the study weredesigned to evaluate only that intervention (with no compan-ion or control groups available for comparison). For exam-ple, if a study compared two groups of patients—one receiv-ing biofeedback and one receiving counseling—we abstractedonly information on the group of participants receivingcounseling. In what we call the “single-group” statisticalanalysis, we then pooled abstracted information from thisstudy along with information similarly abstracted from otherstudies with intervention groups who received counseling. Assuch, individual intervention groups were treated as smallseparate prospective studies, and results were pooled toobtain the magnitude of BP improvements among singlegroups from beginning to end of each intervention.
Between-Intervention Groups Analysis
Studies with suitable comparison intervention groups con-taining either usual care or one of the three interventions ofinterest were incorporated into a separate analysis, evaluatingdifferences between treatment (interventions of interest) andcontrol (usual care or alternative intervention) groups. If astudy group contained any other interventions besides thethree interventions of interest, it was excluded from bothtypes of analyses.
For each analysis, results were pooled across studies, using
both fixed- and random-effects models to estimate summaryeffects for all combined studies.17,18 In the fixed-effectsanalyses, homogeneity was assessed both overall and withinsubgroups (chi-square test). Variances for individual studyresults were calculated from standard errors when provided,from p values or reported t-test results for studies for whichraw data were not available, using the largest p value consis-tent with the published data for studies not reporting exactp values (e.g., p,0.05 was considered to be p50.05). Fordifferences between treatment and control groups, if raw datawere not provided, pooled variance estimates were calculatedas described by Greenland.18 Calculations were performedusing Microsoft Excel 2000 (Microsoft Corp, Redmond, WA)and STATA Statistical Software: Release 6.0 (Statacorp, Col-lege Station, TX).
Subgroup analysis for articles focusing on counseling wasperformed by categorizing articles by year of publication,leader of intervention, duration of intervention, age of par-ticipants, percentage of white participants, and quality scoresof articles.
ResultsYield of Relevant Articles
The initial search identified 232 articles focusing onhypertension detection and management. Of these, 15articles (studying a total of 4072 people) containedinterventions focusing exclusively on counseling, self-monitoring of BP, and training courses.19–33
Characteristics of Articles
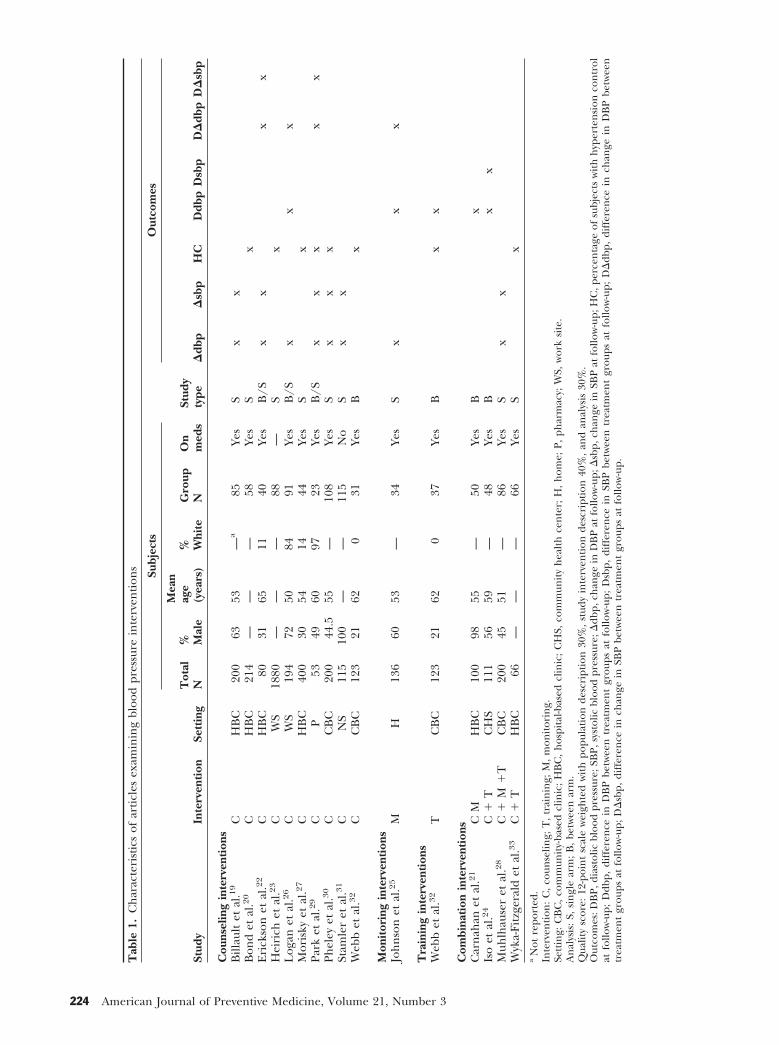
Table 1 describes primary characteristics of the articlesincluded in the analysis. The majority of articles werepublished between 1980 and 1999, with most focusingon counseling. Study settings varied, with the majorityoccurring at hospital- or community-based clinics. Themean total number of subjects per study was 310 (range53 to 1880, median 130), and among those articlesreporting gender, the mean percentage of male sub-jects was 53% (range 21 to 100, median 49). Amongarticles reporting on age and race, the mean age ofsubjects was 57 years (range 50 to 65, median 55), andthe mean percentage of white subjects was 34% (range0 to 97, median 11). The mean intervention group sizewas 63 (range 23 to 115, median 54). Seven studiescontained intervention and design characteristics com-patible for the between-intervention group analysis,while nine studies contained interventions that couldbe used only for the single-intervention group analysis.Subjects in 13 of the studies were taking concomitantantihypertensive medications.
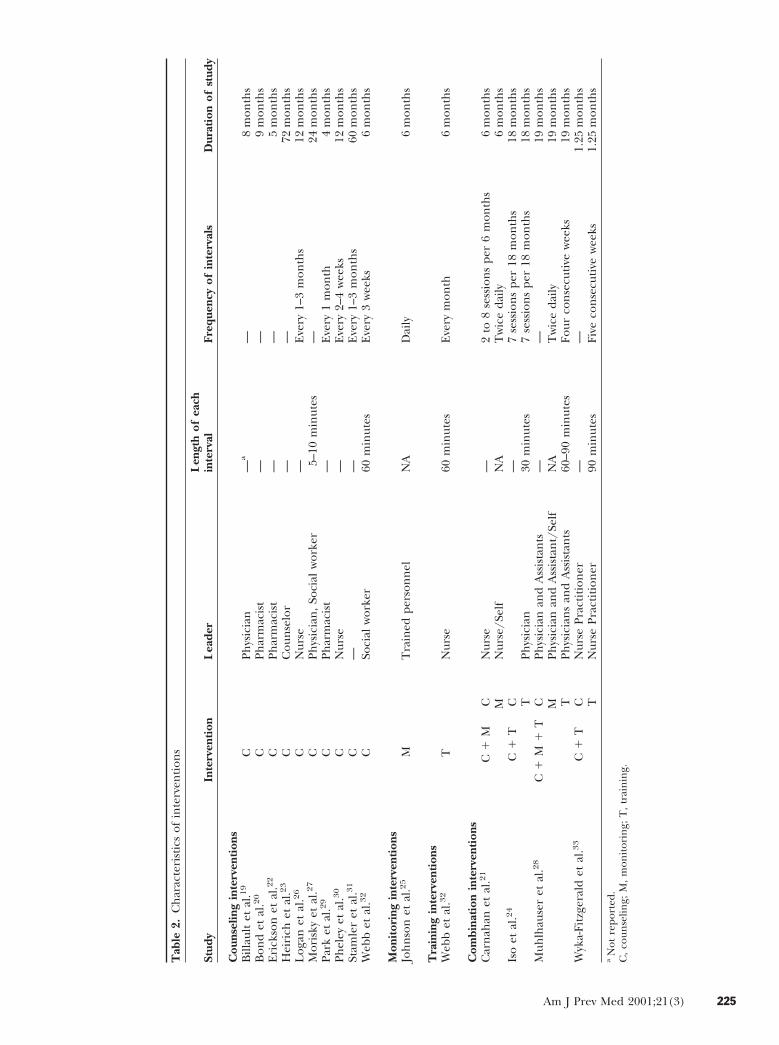
Table 2 includes selected characteristics of eachindividual intervention. Nurses, physicians, and phar-macists led the majority of interventions. The length ofeach episode of the intervention of interest varied from5 to 90 minutes; 12 studies did not report on the lengthof each intervention interval.19–24,26,28–31,33 The fre-quency with which episodes of each intervention oc-
Am J Prev Med 2001;21(3) 223
Tab
le1.
Ch
arac
teri
stic
sof
arti
cles
exam
inin
gbl
ood
pres
sure
inte
rven
tion
s
Stud
yIn
terv
enti
onSe
ttin
g
Subj
ects
Stud
yty
pe
Out
com
es
Tot
alN
% Mal
e
Mea
nag
e(y
ears
)% W
hite
Gro
upN
On
med
sD
dbp
Dsb
pH
CD
dbp
Dsb
pD
Ddb
pD
Dsb
p
Cou
nsel
ing
inte
rven
tion
sB
illau
ltet
al.1
9C
HB
C20
063
53—
a85
Yes
Sx
xB
ond
etal
.20
CH
BC
214
——
—58
Yes
Sx
Eri
ckso
net
al.2
2C
HB
C80
3165
1140
Yes
B/S
xx
xx
Hei
rich
etal
.23
CW
S18
80—
——
88—
Sx
Log
anet
al.2
6C
WS
194
7250
8491
Yes
B/S
xx
xM
oris
kyet
al.2
7C
HB
C40
030
5414
44Ye
sS
xPa
rket
al.2
9C
P53
4960
9723
Yes
B/S
xx
xx
xPh
eley
etal
.30
CC
BC
200
44.5
55—
108
Yes
Sx
xx
Stam
ler
etal
.31
CN
S11
510
0—
—11
5N
oS
xx
Web
bet
al.3
2C
CB
C12
321
620
31Ye
sB
x
Mon
itor
ing
inte
rven
tion
sJo
hn
son
etal
.25
MH
136
6053
—34
Yes
Sx
xx
Tra
inin
gin
terv
enti
ons
Web
bet
al.3
2T
CB
C12
321
620
37Ye
sB
xx
Com
bina
tion
inte
rven
tion
sC
arn
ahan
etal
.21
CM
HB
C10
098
55—
50Ye
sB
xIs
oet
al.2
4C
1T
CH
S11
156
59—
48Ye
sB
xx
Muh
lhau
ser
etal
.28
C1
M1
TC
BC
200
4551
—86
Yes
Sx
xW
yka-
Fitz
gera
ldet
al.3
3C
1T
HB
C66
——
—66
Yes
Sx
aN
otre
port
ed.
Inte
rven
tion
:C
,co
unse
ling;
T,
trai
nin
g;M
,m
onit
orin
g.Se
ttin
g:C
BC
,co
mm
unit
y-ba
sed
clin
ic;
HB
C,
hos
pita
l-bas
edcl
inic
;C
HS,
com
mun
ity
hea
lth
cen
ter;
H,
hom
e;P,
phar
mac
y;W
S,w
ork
site
.A
nal
ysis
:S,
sin
gle
arm
;B
,be
twee
nar
m.
Qua
lity
scor
e:12
-poi
nt
scal
ew
eigh
ted
wit
hpo
pula
tion
desc
ript
ion
30%
,st
udy
inte
rven
tion
desc
ript
ion
40%
,an
dan
alys
is30
%.
Out
com
es:D
BP,
dias
tolic
bloo
dpr
essu
re;S
BP,
syst
olic
bloo
dpr
essu
re;D
dbp,
chan
gein
DB
Pat
follo
w-u
p;D
sbp,
chan
gein
SBP
atfo
llow
-up;
HC
,per
cen
tage
ofsu
bjec
tsw
ith
hyp
erte
nsi
onco
ntr
olat
follo
w-u
p;D
dbp,
diff
eren
cein
DB
Pbe
twee
ntr
eatm
ent
grou
psat
follo
w-u
p;D
sbp,
diff
eren
cein
SBP
betw
een
trea
tmen
tgr
oups
atfo
llow
-up;
DD
dbp,
diff
eren
cein
chan
gein
DB
Pbe
twee
ntr
eatm
ent
grou
psat
follo
w-u
p;D
Dsb
p,di
ffer
ence
inch
ange
inSB
Pbe
twee
ntr
eatm
ent
grou
psat
follo
w-u
p.
224 American Journal of Preventive Medicine, Volume 21, Number 3
Tab
le2.
Ch
arac
teri
stic
sof
inte
rven
tion
s
Stud
yIn
terv
enti
onL
eade
rL
engt
hof
each
inte
rval
Freq
uenc
yof
inte
rval
sD
urat
ion
ofst
udy
Cou
nsel
ing
inte
rven
tion
sB
illau
ltet
al.1
9C
Phys
icia
n—
a—
8m
onth
sB
ond
etal
.20
CPh
arm
acis
t—
—9
mon
ths
Eri
ckso
net
al.2
2C
Phar
mac
ist
——
5m
onth
sH
eiri
chet
al.2
3C
Cou
nse
lor
——
72m
onth
sL
ogan
etal
.26
CN
urse
—E
very
1–3
mon
ths
12m
onth
sM
oris
kyet
al.2
7C
Phys
icia
n,
Soci
alw
orke
r5–
10m
inut
es—
24m
onth
sPa
rket
al.2
9C
Phar
mac
ist
—E
very
1m
onth
4m
onth
sPh
eley
etal
.30
CN
urse
—E
very
2–4
wee
ks12
mon
ths
Stam
ler
etal
.31
C—
—E
very
1–3
mon
ths
60m
onth
sW
ebb
etal
.32
CSo
cial
wor
ker
60m
inut
esE
very
3w
eeks
6m
onth
s
Mon
itor
ing
inte
rven
tion
sJo
hn
son
etal
.25
MT
rain
edpe
rson
nel
NA
Dai
ly6
mon
ths
Tra
inin
gin
terv
enti
ons
Web
bet
al.3
2T
Nur
se60
min
utes
Eve
rym
onth
6m
onth
s
Com
bina
tion
inte
rven
tion
sC
arn
ahan
etal
.21
C1
MC
Nur
se—
2to
8se
ssio
ns
per
6m
onth
s6
mon
ths
MN
urse
/Sel
fN
AT
wic
eda
ily6
mon
ths
Iso
etal
.24
C1
TC
—7
sess
ion
spe
r18
mon
ths
18m
onth
sT
Phys
icia
n30
min
utes
7se
ssio
ns
per
18m
onth
s18
mon
ths
Muh
lhau
ser
etal
.28
C1
M1
TC
Phys
icia
nan
dA
ssis
tan
ts—
—19
mon
ths
MPh
ysic
ian
and
Ass
ista
nt/
Self
NA
Tw
ice
daily
19m
onth
sT
Phys
icia
ns
and
Ass
ista
nts
60–9
0m
inut
esFo
urco
nse
cuti
vew
eeks
19m
onth
sW
yka-
Fitz
gera
ldet
al.3
3C
1T
CN
urse
Prac
titi
oner
——
1.25
mon
ths
TN
urse
Prac
titi
oner
90m
inut
esFi
veco
nse
cuti
vew
eeks
1.25
mon
ths
aN
otre
port
ed.
C,
coun
selin
g;M
,m
onit
orin
g;T
,tr
ain
ing.
Am J Prev Med 2001;21(3) 225
curred during the study varied as well, ranging fromevery 2 weeks to every 3 months for counseling inter-ventions, daily to twice daily for monitoring interven-tions, and weekly to several months for combinedinterventions. Finally, the mean study duration was 17.2months (range 1.25 to 72, median 12 months).
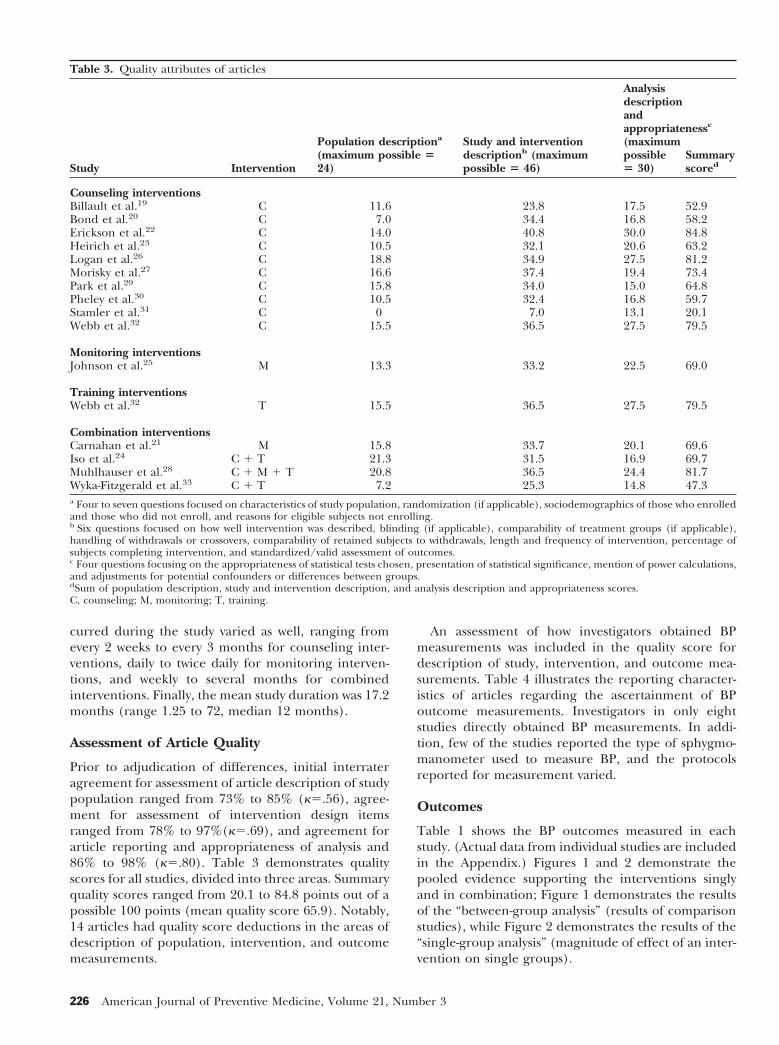
Assessment of Article Quality
Prior to adjudication of differences, initial interrateragreement for assessment of article description of studypopulation ranged from 73% to 85% (k5.56), agree-ment for assessment of intervention design itemsranged from 78% to 97%(k5.69), and agreement forarticle reporting and appropriateness of analysis and86% to 98% (k5.80). Table 3 demonstrates qualityscores for all studies, divided into three areas. Summaryquality scores ranged from 20.1 to 84.8 points out of apossible 100 points (mean quality score 65.9). Notably,14 articles had quality score deductions in the areas ofdescription of population, intervention, and outcomemeasurements.
An assessment of how investigators obtained BPmeasurements was included in the quality score fordescription of study, intervention, and outcome mea-surements. Table 4 illustrates the reporting character-istics of articles regarding the ascertainment of BPoutcome measurements. Investigators in only eightstudies directly obtained BP measurements. In addi-tion, few of the studies reported the type of sphygmo-manometer used to measure BP, and the protocolsreported for measurement varied.
Outcomes
Table 1 shows the BP outcomes measured in eachstudy. (Actual data from individual studies are includedin the Appendix.) Figures 1 and 2 demonstrate thepooled evidence supporting the interventions singlyand in combination; Figure 1 demonstrates the resultsof the “between-group analysis” (results of comparisonstudies), while Figure 2 demonstrates the results of the“single-group analysis” (magnitude of effect of an inter-vention on single groups).
Table 3. Quality attributes of articles
Study Intervention
Population descriptiona
(maximum possible 524)
Study and interventiondescriptionb (maximumpossible 5 46)
Analysisdescriptionandappropriatenessc
(maximumpossible5 30)
Summaryscored
Counseling interventionsBillault et al.19 C 11.6 23.8 17.5 52.9Bond et al.20 C 7.0 34.4 16.8 58.2Erickson et al.22 C 14.0 40.8 30.0 84.8Heirich et al.23 C 10.5 32.1 20.6 63.2Logan et al.26 C 18.8 34.9 27.5 81.2Morisky et al.27 C 16.6 37.4 19.4 73.4Park et al.29 C 15.8 34.0 15.0 64.8Pheley et al.30 C 10.5 32.4 16.8 59.7Stamler et al.31 C 0 7.0 13.1 20.1Webb et al.32 C 15.5 36.5 27.5 79.5
Monitoring interventionsJohnson et al.25 M 13.3 33.2 22.5 69.0
Training interventionsWebb et al.32 T 15.5 36.5 27.5 79.5
Combination interventionsCarnahan et al.21 M 15.8 33.7 20.1 69.6Iso et al.24 C 1 T 21.3 31.5 16.9 69.7Muhlhauser et al.28 C 1 M 1 T 20.8 36.5 24.4 81.7Wyka-Fitzgerald et al.33 C 1 T 7.2 25.3 14.8 47.3a Four to seven questions focused on characteristics of study population, randomization (if applicable), sociodemographics of those who enrolledand those who did not enroll, and reasons for eligible subjects not enrolling.b Six questions focused on how well intervention was described, blinding (if applicable), comparability of treatment groups (if applicable),handling of withdrawals or crossovers, comparability of retained subjects to withdrawals, length and frequency of intervention, percentage ofsubjects completing intervention, and standardized/valid assessment of outcomes.c Four questions focusing on the appropriateness of statistical tests chosen, presentation of statistical significance, mention of power calculations,and adjustments for potential confounders or differences between groups.dSum of population description, study and intervention description, and analysis description and appropriateness scores.C, counseling; M, monitoring; T, training.
226 American Journal of Preventive Medicine, Volume 21, Number 3
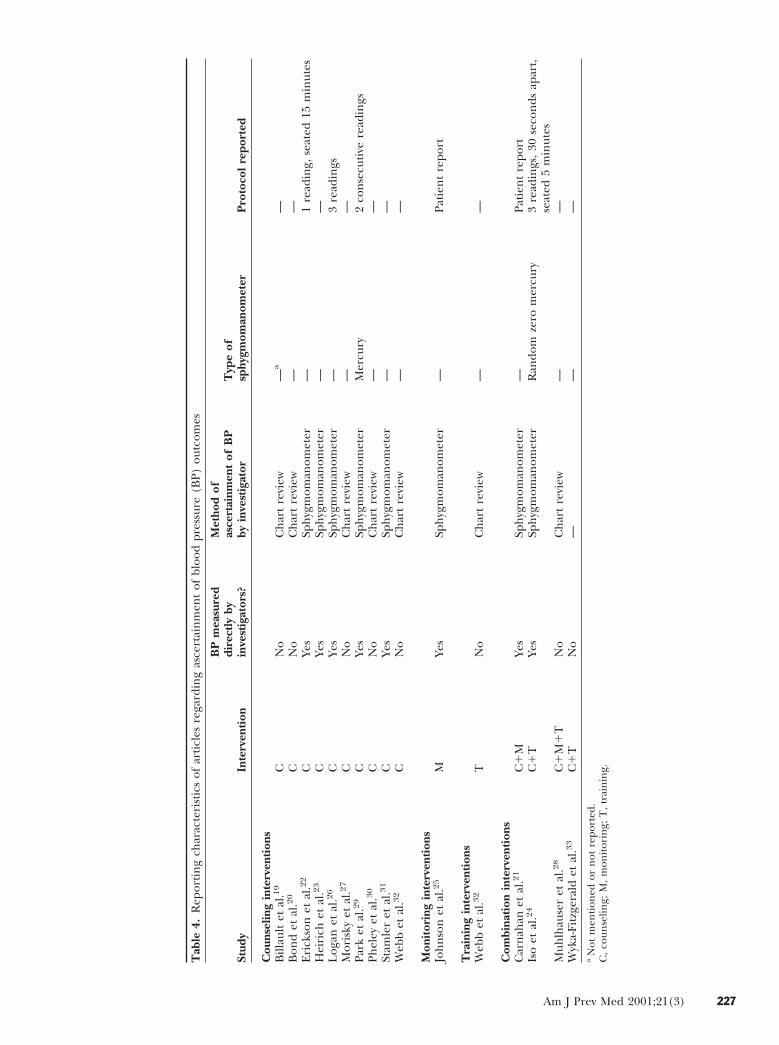
Tab
le4.
Rep
orti
ng
char
acte
rist
ics
ofar
ticl
esre
gard
ing
asce
rtai
nm
ent
ofbl
ood
pres
sure
(BP)
outc
omes
Stud
yIn
terv
enti
on
BP
mea
sure
ddi
rect
lyby
inve
stig
ator
s?
Met
hod
ofas
cert
ainm
ent
ofB
Pby
inve
stig
ator
Typ
eof
sphy
gmom
anom
eter
Pro
toco
lre
port
ed
Cou
nsel
ing
inte
rven
tion
sB
illau
ltet
al.1
9C
No
Ch
art
revi
ew—
a—
Bon
det
al.2
0C
No
Ch
art
revi
ew—
—E
rick
son
etal
.22
CYe
sSp
hyg
mom
anom
eter
—1
read
ing,
seat
ed15
min
utes
Hei
rich
etal
.23
CYe
sSp
hyg
mom
anom
eter
——
Log
anet
al.2
6C
Yes
Sph
ygm
oman
omet
er—
3re
adin
gsM
oris
kyet
al.2
7C
No
Ch
art
revi
ew—
—Pa
rket
al.2
9C
Yes
Sph
ygm
oman
omet
erM
ercu
ry2
con
secu
tive
read
ings
Phel
eyet
al.3
0C
No
Ch
art
revi
ew—
—St
amle
ret
al.3
1C
Yes
Sph
ygm
oman
omet
er—
—W
ebb
etal
.32
CN
oC
har
tre
view
——
Mon
itor
ing
inte
rven
tion
sJo
hn
son
etal
.25
MYe
sSp
hyg
mom
anom
eter
—Pa
tien
tre
port
Tra
inin
gin
terv
enti
ons
Web
bet
al.3
2T
No
Ch
art
revi
ew—
—
Com
bina
tion
inte
rven
tion
sC
arn
ahan
etal
.21
C1
MYe
sSp
hyg
mom
anom
eter
—Pa
tien
tre
port
Iso
etal
.24
C1
TYe
sSp
hyg
mom
anom
eter
Ran
dom
zero
mer
cury
3re
adin
gs,
30se
con
dsap
art,
seat
ed5
min
utes
Muh
lhau
ser
etal
.28
C1
M1
TN
oC
har
tre
view
——
Wyk
a-Fi
tzge
rald
etal
.33
C1
TN
o—
——
aN
otm
enti
oned
orn
otre
port
ed.
C,
coun
selin
g;M
,m
onit
orin
g;T
,tr
ain
ing.
Am J Prev Med 2001;21(3) 227
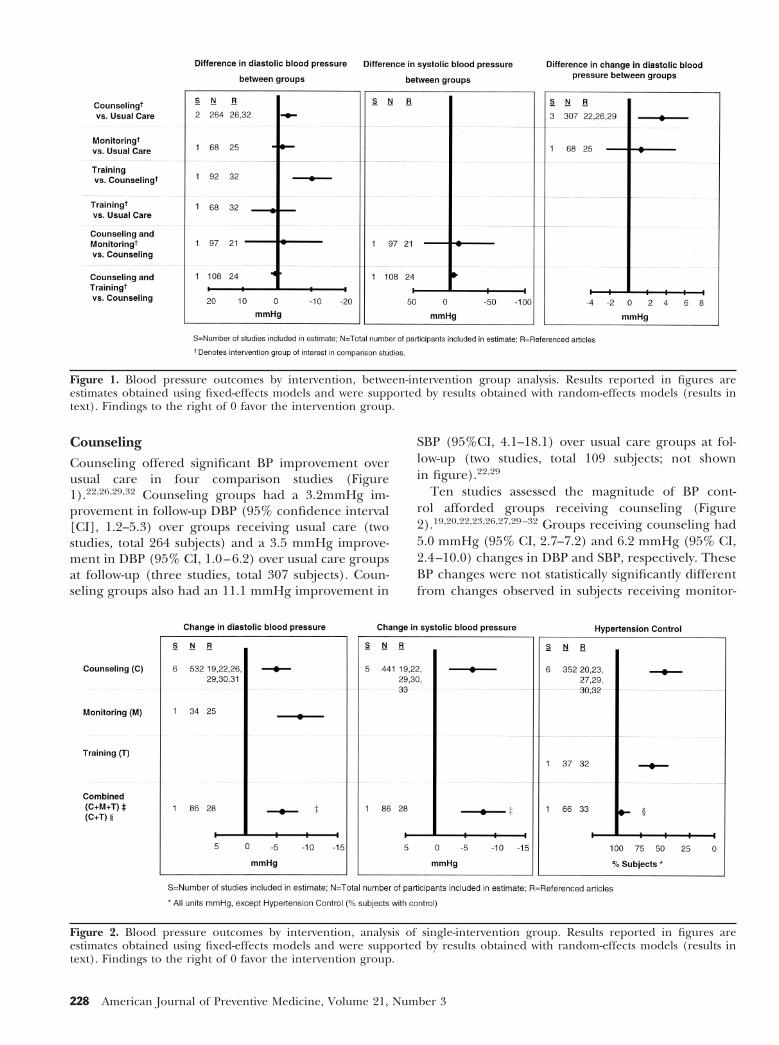
CounselingCounseling offered significant BP improvement overusual care in four comparison studies (Figure1).22,26,29,32 Counseling groups had a 3.2mmHg im-provement in follow-up DBP (95% confidence interval[CI], 1.2–5.3) over groups receiving usual care (twostudies, total 264 subjects) and a 3.5 mmHg improve-ment in DBP (95% CI, 1.0–6.2) over usual care groupsat follow-up (three studies, total 307 subjects). Coun-seling groups also had an 11.1 mmHg improvement in
SBP (95%CI, 4.1–18.1) over usual care groups at fol-low-up (two studies, total 109 subjects; not shownin figure).22,29
Ten studies assessed the magnitude of BP cont-rol afforded groups receiving counseling (Figure2).19,20,22,23,26,27,29–32 Groups receiving counseling had5.0 mmHg (95% CI, 2.7–7.2) and 6.2 mmHg (95% CI,2.4–10.0) changes in DBP and SBP, respectively. TheseBP changes were not statistically significantly differentfrom changes observed in subjects receiving monitor-
Figure 1. Blood pressure outcomes by intervention, between-intervention group analysis. Results reported in figures areestimates obtained using fixed-effects models and were supported by results obtained with random-effects models (results intext). Findings to the right of 0 favor the intervention group.
Figure 2. Blood pressure outcomes by intervention, analysis of single-intervention group. Results reported in figures areestimates obtained using fixed-effects models and were supported by results obtained with random-effects models (results intext). Findings to the right of 0 favor the intervention group.
228 American Journal of Preventive Medicine, Volume 21, Number 3
ing or subjects receiving all three interventions incombination. Similarly, 51% (95% CI, 34–66) of sub-jects had BP control at follow-up after receiving coun-seling. While the magnitude of hypertension controlwas statistically significantly less than that experiencedby groups receiving counseling plus monitoring, it wasnot statistically significantly different from groups re-ceiving training.
Because of heterogeneity among some studies thatassessed the effect of counseling on difference in DBPbetween treatment and control groups at follow-up(p50.038), the absolute magnitude of change in DBP(p,0.01) and SBP (p,0.01), and hypertension control(p,0.01), we also used a random-effects model, whichassumed BP changes varied not only within each of thestudies (as reflected by the study standard error) butalso between studies. Using this approach, estimatesfrom comparison studies of counseling versus usualcare were not appreciably different, but confidenceintervals were wider: Counseling offered a 5.4 mmHg(95% CI, 23.1–13.9) improvement over usual care infollow-up DBP. For the two remaining estimates fromcomparison studies (difference in change in SBP andDBP), there was no significant heterogeneity and thefixed-effects estimates were maintained, supportingcounseling over usual care. Using the random-effectsapproach, the estimates of magnitude of BP reductionwere similar as well, although confidence intervals werewider: The magnitude of DBP and SBP reductions were5.0 mmHg (95% CI, 21.8–11.6) and 7.8 mmHg (95%CI, 21.0–16.6), respectively. Random-effects modelingdid not appreciably change the estimate of percentageof subjects afforded hypertension control with counsel-ing: 51% (95% CI, 31–73).
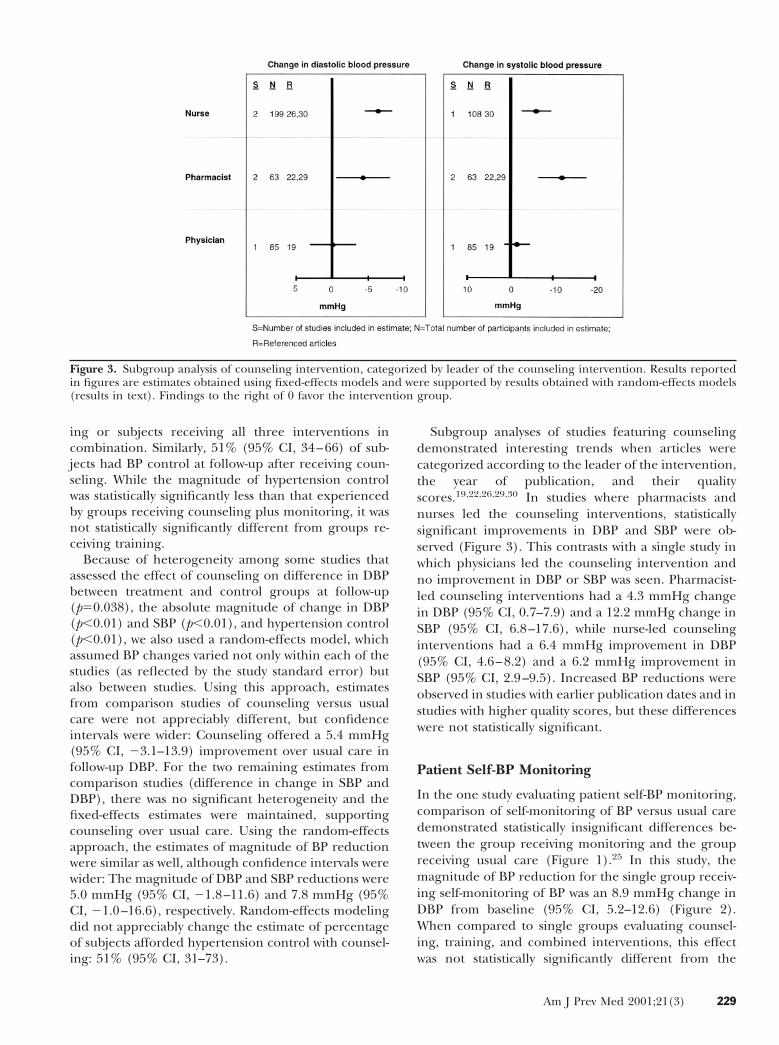
Subgroup analyses of studies featuring counselingdemonstrated interesting trends when articles werecategorized according to the leader of the intervention,the year of publication, and their qualityscores.19,22,26,29,30 In studies where pharmacists andnurses led the counseling interventions, statisticallysignificant improvements in DBP and SBP were ob-served (Figure 3). This contrasts with a single study inwhich physicians led the counseling intervention andno improvement in DBP or SBP was seen. Pharmacist-led counseling interventions had a 4.3 mmHg changein DBP (95% CI, 0.7–7.9) and a 12.2 mmHg change inSBP (95% CI, 6.8–17.6), while nurse-led counselinginterventions had a 6.4 mmHg improvement in DBP(95% CI, 4.6–8.2) and a 6.2 mmHg improvement inSBP (95% CI, 2.9–9.5). Increased BP reductions wereobserved in studies with earlier publication dates and instudies with higher quality scores, but these differenceswere not statistically significant.
Patient Self-BP Monitoring
In the one study evaluating patient self-BP monitoring,comparison of self-monitoring of BP versus usual caredemonstrated statistically insignificant differences be-tween the group receiving monitoring and the groupreceiving usual care (Figure 1).25 In this study, themagnitude of BP reduction for the single group receiv-ing self-monitoring of BP was an 8.9 mmHg change inDBP from baseline (95% CI, 5.2–12.6) (Figure 2).When compared to single groups evaluating counsel-ing, training, and combined interventions, this effectwas not statistically significantly different from the
Figure 3. Subgroup analysis of counseling intervention, categorized by leader of the counseling intervention. Results reportedin figures are estimates obtained using fixed-effects models and were supported by results obtained with random-effects models(results in text). Findings to the right of 0 favor the intervention group.
Am J Prev Med 2001;21(3) 229
change in DBP seen in individuals receiving counselingalone or all three interventions combined.
Training Courses
One comparison study evaluated training courses, com-paring training to both usual care and counselingseparately.32 Counseling was favored over trainingcourses (decrease in DBP at follow-up of 10 mmHg[95% CI, 4.8–15.6]; Figure 1). Sixty-four percent ofsubjects (95% CI, 48–77) in this study had hyperten-sion control at follow-up. This effect was not signifi-cantly larger than the magnitude of hypertension con-trol afforded by counseling, but the effect wassignificantly less than the percentage of subjects withhypertension control who received counseling andtraining combined (95% [95% CI, 87–99]) (Figure 2).
Combination Interventions
Four studies featured combined interventions, includ-ing two comparison studies of combined interventionsversus counseling: (1) counseling plus monitoring ver-sus counseling, and (2) counseling plus training versuscounseling.21,24,28,33 SBP changes were different for thetwo interventions. No statistically significant SBP reduc-tion was seen for counseling plus monitoring overcounseling; in contrast, counseling plus training of-fered a 4.7 mmHg (95% CI, 1.2–8.2) SBP reductionover counseling. Neither combination offered improve-ments in DBP over counseling (Figure 1).
Two studies assessed the magnitude of BP reductionafforded to groups receiving combined interven-tions.28,33 Subjects receiving counseling, monitoring,and training combined as a single intervention experi-enced reductions in both DBP and SBP: change in DBP6.0 mmHg (95% CI, 3.6–8.4), change in SBP 8.0mmHg (95% CI, 4.4–11.6). These BP reductions werenot statistically significantly different from those ob-served in groups receiving counseling alone or moni-toring alone. In contrast, among subjects receivingcounseling plus training in a separate study, 95%achieved hypertension control (95% CI, 87–99). Thisrepresented a statistically significant improvement overthe magnitude of hypertension control afforded sub-jects receiving training alone and for subjects receivingcounseling alone (Figure 2).
Discussion
While patient-centered, education-based behavioral in-terventions may be viewed as important strategies toeducate patients and improve BP control, definition ofthe clinical benefits through careful and systematicreview of these approaches in hypertension care isnecessary to guide evidence-based practice. As such,this systematic review assessed in incremental and com-
bined fashion the BP benefit provided by these threepatient-centered behavioral interventions.
Pooled results favor counseling over usual care withan absolute decrease in DBP of 3.2 mmHg and im-provements in changes in DBP and SBP of 3.5 mmHgand 11.1 mmHg, respectively. Counseling is also fa-vored over training courses, offering a 10.2 mmHgreduction in DBP over training at follow-up. The mag-nitudes of DBP and SBP reductions for single groupsreceiving counseling alone are 5.0 mmHg and 6.2mmHg, respectively. In contrast, neither self-monitoringof BP nor training courses offer any statistically significantimprovement in DBP at follow-up over usual care, and thecombined interventions do not demonstrate substantialimprovement over counseling except when looking athypertension control in one study, in which 95% ofsubjects achieved hypertension control, which is statisti-cally significantly more than with counseling and training.
Nearly all articles we reviewed used these interven-tions as adjunctive therapy to pharmacologic ap-proaches for hypertension management. A previoussystematic review of first-line pharmacologic agentsused to treat hypertension (beta blockers, calciumchannel blockers, and thiazide diuretics) reported thatSBP and DBP benefits gained from these agents rangedfrom 10.0 mmHg to 15.6 mmHg and from 5.0 mmHgto 7.3 mmHg, respectively.34 Our results indicate thatadditional BP benefit gained from adding counselingcould be as high as 5 to 6 mmHg reductions in bothDBP and SBP. This improvement may be mediated byenhanced patient compliance with medication regi-mens and physician visits, improved patient behaviors,as well as potentially heightened patient awarenessregarding ongoing needs for continued aggressive hy-pertension management.
Notwithstanding the strength of this systematic re-view, there are limitations. First, despite an extensivesearch, 15 articles met our criteria, focusing specificallyon these three commonly practiced interventions. Be-cause we sought to address only the effects of thesethree behavioral interventions singly or in combinationwith each other, it was necessary to eliminate manystudies that included these interventions combinedwith other important interventions. This resulted in avery small number of studies evaluating patient self-BPmonitoring or training courses, limiting our statisticalpower to estimate accurately the effect of these twointerventions. Second, there was moderate heterogene-ity of interventions in terms of content, leader, andduration. This reflects variation in how these interven-tions have been implemented and evaluated. Althoughour subgroup analyses were limited in statistical power,there is a strong suggestion that effectiveness of theseinterventions may differ based on these more detailedaspects of intervention implementation. However, thesmall number of studies available inhibited our abilityto draw conclusions regarding any possible dose-re-
230 American Journal of Preventive Medicine, Volume 21, Number 3
sponse effects in terms of length and frequency ofinterventions. Third, there were few randomized exper-imental trials, which are considered the best studydesign to derive inferences about the efficacy of inter-ventions. Many of our studies employed noncompara-tive designs and reported varying outcomes, prohibit-ing less complex approaches to evaluating interventioneffectiveness. Lack of control groups may also prohibitassessment of potential placebo and Hawthorne ef-fects.35 Finally, our review of article quality revealedthat, in many cases, less than optimal attention was paidtoward reporting important aspects of study populationand intervention description. Nevertheless, this body ofevidence is what is available to guide clinical practice.
In summary, this study provides substantive evidencethat behavioral interventions can play an importantrole in improving BP management. Counseling is sup-ported by the evidence as an effective technique tofurther lower BP beyond the benefit afforded by med-ications alone. Substantial evidence is lacking on train-ing or self-monitoring of BP interventions. Theoreti-cally, combining interventions should provide even aneven greater degree of BP control, although consistentevidence is lacking to support this theory.
There is a clear need for more focused research thataddresses individual interventions separately. Improve-ments in descriptions of interventions (e.g., the leaderof the intervention, the precise content of counseling,the length and duration of the interventions) as well asprovision of more standardized reporting mechanismsfor outcomes will further strengthen the existing evi-dence regarding patient-centered interventions for hy-pertension and will help guide development of recom-mendations for clinical practice.30–33
We are grateful to Lynda Anderson, PhD, and Gail Janes,PhD, at the Centers for Disease Control and Prevention(Atlanta, GA) for their valuable support and contributions.This study was supported in part by a National ResearchService Award #2T32PE10025, Health Resource and ServicesAdministration (LEB); grant #K08MH0178701, National In-stitute of Mental Health (GLD); grant #5T32HL07024, Na-tional Heart, Lung and Blood Institute (GLD); and grant#K240502643, National Institute of Diabetes and Digestiveand Kidney Diseases (NRP).
References1. The sixth report of the Joint National Committee on prevention, detection,
evaluation, and treatment of high blood pressure. Arch Intern Med1997;157:2413–46 (erratum appears in 1998;158:573).
2. Burt VL, Whelton P, Roccella EJ, et al. Prevalence of hypertension in theU.S. adult population: results from the Third National Health andNutrition Examination Survey, 1988 –1991. Hypertension 1995;25:305–13.
3. U.S. Department of Health and Human Services. U.S. Department ofHealth and Human Services. Healthy People 2010: understanding andimproving health and objectives for improving health, 2nd ed. 2 vols.Washington, DC: U.S. Government Printing Office, 2000.
4. Psaty BM, Smith NL, Siscovick DS, et al. Health outcomes associated withantihypertensive therapies used as first-line agents. A systematic review andmeta-analysis. JAMA 1997;277:739–45.
5. Moser M, Hebert PR. Prevention of disease progression, left ventricularhypertrophy and congestive heart failure in hypertension treatment trials.J Am Coll Cardiol 1996;27:1214–8.
6. Puddey IB, Parker M, Beilin LJ, Vandongen R, Masarei JR. Effects ofalcohol and caloric restrictions on blood pressure and serum lipids inoverweight men. Hypertension 1992;20:533–41.
7. Appel LJ, Moore TJ, Obarzanek E, et al. A clinical trial of the effects ofdietary patterns on blood pressure: DASH Collaborative Research Group.N Engl J Med 1997;336:1117–24.
8. Hypertension Prevention Collaborative Research Group. Effects ofweight loss and sodium reduction intervention on blood pressure andhypertension incidence in overweight people with high-normal bloodpressure: the trials of hypertension prevention. Arch Intern Med1997;157:657– 67.
9. U.S. Department of Health and Human Services. Physical activity andhealth. A report of the Surgeon General. Washington, DC: U.S. Depart-ment of Health and Human Services, 1996.
10. Stamler J, Caggiula AW, Grandits GA. Relation of body mass and alcohol,nutrient, fiber, and caffeine intakes to blood pressure in the specialintervention and usual care groups in the Multiple Risk Factor InterventionTrial. Am J Clin Nutr 1997;65(suppl 1):338–65.
11. Greenberg G, Thompson SG, Brennan, PJ. The relationship betweensmoking and the response to anti-hypertensive treatment in mild hyper-tensives in the Medical Research Council’s trial of treatment. Int JEpidemiol 1987;16:25–30.
12. U.S. Department of Health and Human Services. The health benefits ofsmoking cessation. A report of the Surgeon General. Washington, DC: U.S.Department of Health and Human Services, 1990.
13. Fodor JG, Whitmore B, Leenen F, Larochelle P. Lifestyle modifications toprevent and control hypertension. 5. Recommendations on dietary salt.Canadian Hypertension Society, Canadian Coalition for High Blood Pres-sure Prevention and Control, Laboratory Centre for Disease Control atHealth Canada, Heart and Stroke Foundation of Canada. Can Med AssocJ 1999;160(suppl 9):S29–34.
14. Pickering T. Recommendations for the use of home (self) and ambulatoryblood pressure monitoring: American Society of Hypertension Ad HocPanel. Am J Hypertens 1996;9:1–11.
15. Daumit GL, Boulware LE, Powe NR, et al. A system for evaluating theeffectiveness of preventive interventions. Public Health Rep, 2001. Inpress.
16. Chalmers TC, Smith H, Blackburn B, et al. A method for assessing thequality of a randomized control trial. Control Clin Trials 1981;2:31–49.
17. Orwin RL. Evaluating coding decisions. In: Cooper H, Hedges LV, eds. Thehandbook of research synthesis. New York: Russell Sage Foundation, 1994:139–62.
18. Greenland S. Quantitative methods in the review of epidemiologic litera-ture. Epidemiol Rev 1987;9:1–30.
19. Billault B, Degoulet P, Devries C, Plouin PF, Chatellier G, Menard J. Useof a standardized personal medical record by patients with hyperten-sion: a randomized controlled prospective trial. MD Computing 1995;12:31–5.
20. Bond CA, Monson R. Sustained improvement in drug documentation,compliance, and disease control: a four-year analysis of an ambulatory caremodel. Arch Intern Med 1984;144:1159–62.
21. Carnahan JE, Nugent CA. The effects of self-monitoring by patients on thecontrol of hypertension. Am J Med Sci 1975;269:69–73.
22. Erickson SR, Slaughter R, Halapy H. Pharmacists’ ability to influenceoutcomes of hypertension therapy. Pharmacotherapy 1997;17:140–7.
23. Heirich MA, Foote A, Erfurt JC, Konopka B. Work-site physical fitnessprograms: comparing the impact of different program designs on cardio-vascular risks. J Occup Med 1993;35:510–17.
24. Iso H, Shimamoto T, Yokota K, Sankai T, Jacobs DR, Komachi Y. Commu-nity-based education classes for hypertension control: a 1.5-year random-ized controlled trial. Hypertension 1996;27:968–74.
25. Johnson AL, Taylor DW, Sackett DL, Dunnett CW, Shimizu AG. Self-recording of blood pressure in the management of hypertension. Can MedAssoc J 1978;119:1034–9.
26. Logan AG. Clinical effectiveness and cost-effectiveness of monitoringblood pressure of hypertensive employees at work. Hypertension 1983;5:828 –36.
27. Morisky DE, Levine DM, Green LW. Five-year blood pressure control and
Am J Prev Med 2001;21(3) 231
mortality following health education for hypertensive patients. Am J PublicHealth 1983;73:153–62.
28. Muhlhauser I, Sawicki PT, and Didjurgeit U. Evaluation of a structuredtreatment and teaching programme on hypertension in general practice.Clin Exp Hypertens 1993;15:125–42.
29. Park JJ, Kelly P, Carter BL, Burgess PP. Comprehensive pharmaceuticalcare in the chain setting. J Am Pharmaceutical Assoc 1996;NS36:443–51.
30. Pheley AM, Terry P, Pietz L, Fowles J, McCoy CE, Smith H. Evaluation of anurse-based hypertension management program: screening, management,and outcomes. J Cardiovasc Nurs 1995;9:54–61.
31. Stamler J, Farinaro E, Mojonnier LM, Hall Y, Moss D, Stamler R. Preventionand control of hypertension by nutritional hygienic means: long-term
experience of the Chicago Coronary Prevention Evaluation Program.JAMA 1980;243:1819–23.
32. Webb PA. Effectiveness of patient education and psychosocial counselingin promoting compliance and control among hypertensive patients. J FamPract 1980;10:1047–55.
33. Wyka-Fitzgerald CA. Long-term evaluation of group education for highblood pressure control. Cardiovasc Nurs 1984;20:13–17.
34. Wright JM, Lee CH, Chambers GK. Systematic review of antihypertensivetherapies: does the evidence assist in choosing a first-line drug? Can MedAssoc J 1999;161:25–32.
35. Fletcher RH, Fletcher SW, Wagner EH. Clinical epidemiology: the essen-tials. Baltimore: Williams & Wilkins, 1996.
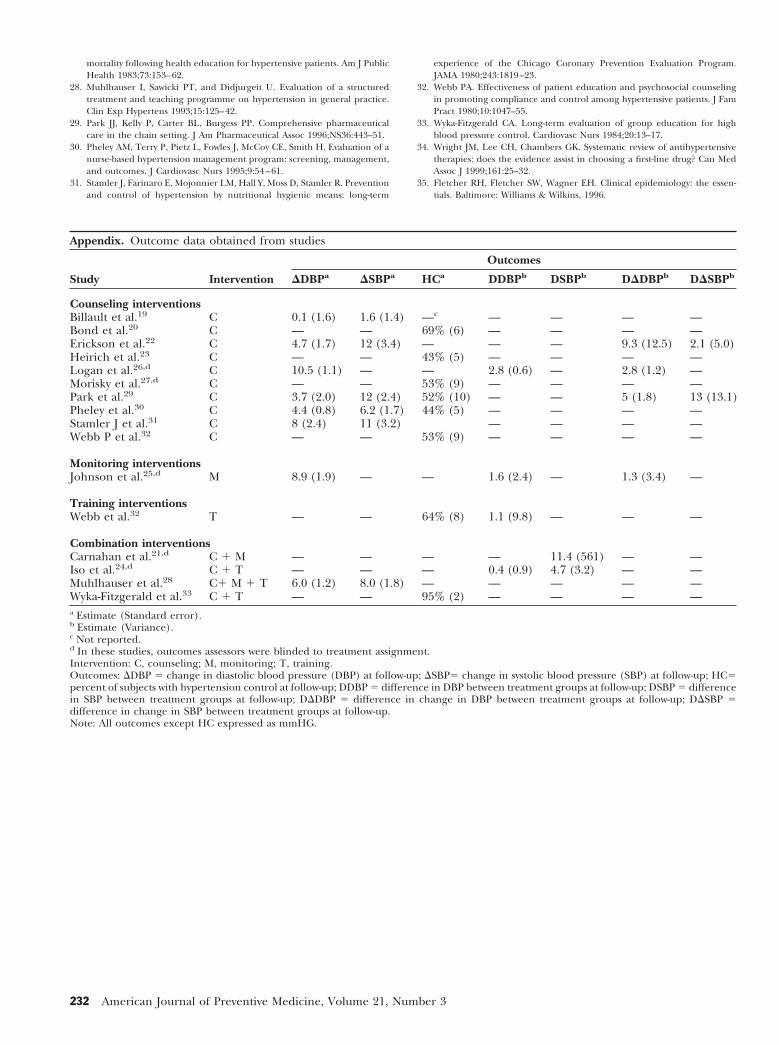
Appendix. Outcome data obtained from studies
Study Intervention
Outcomes
DDBPa DSBPa HCa DDBPb DSBPb DDDBPb DDSBPb
Counseling interventionsBillault et al.19 C 0.1 (1.6) 1.6 (1.4) —c — — — —Bond et al.20 C — — 69% (6) — — — —Erickson et al.22 C 4.7 (1.7) 12 (3.4) — — — 9.3 (12.5) 2.1 (5.0)Heirich et al.23 C — — 43% (5) — — — —Logan et al.26,d C 10.5 (1.1) — — 2.8 (0.6) — 2.8 (1.2) —Morisky et al.27,d C — — 53% (9) — — — —Park et al.29 C 3.7 (2.0) 12 (2.4) 52% (10) — — 5 (1.8) 13 (13.1)Pheley et al.30 C 4.4 (0.8) 6.2 (1.7) 44% (5) — — — —Stamler J et al.31 C 8 (2.4) 11 (3.2) — — — —Webb P et al.32 C — — 53% (9) — — — —
Monitoring interventionsJohnson et al.25,d M 8.9 (1.9) — — 1.6 (2.4) — 1.3 (3.4) —
Training interventionsWebb et al.32 T — — 64% (8) 1.1 (9.8) — — —
Combination interventionsCarnahan et al.21,d C 1 M — — — — 11.4 (561) — —Iso et al.24,d C 1 T — — — 0.4 (0.9) 4.7 (3.2) — —Muhlhauser et al.28 C1 M 1 T 6.0 (1.2) 8.0 (1.8) — — — — —Wyka-Fitzgerald et al.33 C 1 T — — 95% (2) — — — —a Estimate (Standard error).b Estimate (Variance).c Not reported.d In these studies, outcomes assessors were blinded to treatment assignment.Intervention: C, counseling; M, monitoring; T, training.Outcomes: DDBP 5 change in diastolic blood pressure (DBP) at follow-up; DSBP5 change in systolic blood pressure (SBP) at follow-up; HC5percent of subjects with hypertension control at follow-up; DDBP 5 difference in DBP between treatment groups at follow-up; DSBP 5 differencein SBP between treatment groups at follow-up; DDDBP 5 difference in change in DBP between treatment groups at follow-up; DDSBP 5difference in change in SBP between treatment groups at follow-up.Note: All outcomes except HC expressed as mmHG.
232 American Journal of Preventive Medicine, Volume 21, Number 3