Embed Size (px)
Citation preview

NeuroImage: Clinical 7 (2015) 7–17
Contents lists available at ScienceDirect
NeuroImage: Clinical
j ourna l homepage: www.e lsev ie r .com/ locate /yn ic l
An evaluation of volume-based morphometry for prediction of mildcognitive impairment and Alzheimer's disease
Daniel Schmitter a,b,f,1, Alexis Roche a,b,c,e,⁎,1, Bénédicte Maréchal a,b,e, Delphine Ribes a,b, Ahmed Abdulkadir g,Meritxell Bach-Cuadra c,e,b, Alessandro Daducci e, Cristina Granziera d,a,b,e, Stefan Klöppel g, Philippe Maeder c,Reto Meuli c, Gunnar Krueger a,b,e, for the Alzheimer's Disease Neuroimaging Initiative 2
aAdvanced Clinical Imaging Technology, Siemens Healthcare Sector, CH-1015 Lausanne, SwitzerlandbCentre d'Imagerie BioMédicale (CIBM), CH-1015 Lausanne, SwitzerlandcDepartment of Radiology, Centre Hospitalier Universitaire Vaudois (CHUV), CH-1015 Lausanne, SwitzerlanddService of Neurology, Centre Hospitalier Universitaire Vaudois (CHUV), CH-1015 Lausanne, SwitzerlandeSignal Processing Laboratory 5, Ecole Polytechnique Fédérale (EPFL), CH-1015 Lausanne, SwitzerlandfBiomedical Imaging Group, Ecole Polytechnique Fédérale (EPFL), CH-1015 Lausanne, SwitzerlandgGroup of Pattern Recognition and Image Processing, University of Freiburg, D-79110 Freiburg, Germany
⁎ Corresponding author at: Department of Radiology, CVaudois (CHUV), CH-1015 Lausanne, Switzerland.
1 The first two authors contributed equally to this work2 Data used in preparation of this article were obtaine
Neuroimaging Initiative (ADNI) database (adni.loni.ucla.within the ADNI contributed to the design and implemendata but did not participate in analysis or writing of thADNI investigators can be found at: http://adni.loni.ucla.to_apply/ADNI_Acknowledgement_List.pdf.
http://dx.doi.org/10.1016/j.nicl.2014.11.0012213-1582/© 2014 The Authors. Published by Elsevier Inc
a b s t r a c t
a r t i c l e i n f oArticle history:Received 12 February 2014Received in revised form 17 June 2014Accepted 4 November 2014Available online 8 November 2014
Keywords:Magnetic resonance imagingBrain morphometryImage segmentationAlzheimer's diseaseMild cognitive impairmentClassificationSupport vector machine
Voxel-based morphometry from conventional T1-weighted images has proved effective to quantify Alzheimer'sdisease (AD) related brain atrophy and to enable fairly accurate automated classification of AD patients,mild cog-nitive impaired patients (MCI) and elderly controls. Little is known, however, about the classification power ofvolume-basedmorphometry, where features of interest consist of a few brain structure volumes (e.g. hippocam-pi, lobes, ventricles) as opposed to hundreds of thousands of voxel-wise graymatter concentrations. In thiswork,we experimentally evaluate two distinct volume-basedmorphometry algorithms (FreeSurfer and an in-house al-gorithm called MorphoBox) for automatic disease classification on a standardized data set from the Alzheimer'sDiseaseNeuroimaging Initiative. Results indicate that both algorithms achieve classification accuracy comparableto the conventional whole-brain voxel-based morphometry pipeline using SPM for AD vs elderly controls andMCI vs controls, and higher accuracy for classification of AD vsMCI and early vs late AD converters, thereby dem-onstrating the potential of volume-based morphometry to assist diagnosis of mild cognitive impairment andAlzheimer's disease.
© 2014 The Authors. Published by Elsevier Inc. This is an open access article under the CC BY-NC-ND license(http://creativecommons.org/licenses/by-nc-nd/4.0/).
1. Introduction
Automated image-based brainmorphometry analysis is increasinglyused to quantify structural changes during normal aging and progres-sion of certain diseases. This trend relates to both the widespread avail-ability of brain imaging equipment in clinical routine and research, andthe concurrent development of neuroinformatics which has material-ized in several free aswell as commercial image analysis software pack-ages released over the past 15 years: SPM, FSL, FreeSurfer, BrainVisa,Mindboggle, NeuroQuant, and NeuroQLab, to mention a few.
entre Hospitalier Universitaire
.d from the Alzheimer's Diseaseedu). As such, the investigatorstation of ADNI and/or providedis report. A complete listing ofedu/wp-content/uploads/how_
. This is an open access article under
Brain morphometry methods ultimately aim to extract imaging bio-marker information that characterizes structural patterns of changesacross groups of subjects, e.g. healthy and diseased. Methods vary inthe type of imaging biomarkers they use. In voxel-based morphometry(VBM) fromhigh resolution T1-weighted brainmagnetic resonance im-aging (MRI) data, imaging biomarkers are derived from processed im-ages such as gray matter concentration maps, that are registered to areference space in order to enable voxel-by-voxel comparisons acrosssubjects (Ashburner and Friston, 2000). Several thousand voxel bio-markers need to be evaluated if the analysis is performed throughoutthe whole brain, as is common practice. Voxel-based brain morphome-try has proven a valuable exploratory tool to characterize structuralchanges in various diseases aswell as in several aspects of normal devel-opment (Mietchen and Gaser, 2009).
This paper focuses on the diagnosis of mild cognitive impairment(MCI) and Alzheimer's disease (AD). Several groups have shown thatVBM combined with high-dimensional classification techniques can ac-curately distinguish AD patients, MCI patients and elderly controls (Liuet al., 2004; Klöppel et al., 2008; Duchesne et al., 2008; Cuingnet et al.,
the CC BY-NC-ND license (http://creativecommons.org/licenses/by-nc-nd/4.0/).

8 D. Schmitter et al. / NeuroImage: Clinical 7 (2015) 7–17
2011; Liu et al., 2012). Automatic voxel-based classification of AD pa-tients vs frontotemporal demented patients has also been shown feasi-ble (Klöppel et al., 2008; Davatzikos et al., 2008).
As a natural alternative and complementary approach to voxel-based morphometry, however, imaging biomarker information mayalso be obtained from volumes of specific brain structures of interest(Huppertz et al., 2010; Giorgio and De Stefano, 2013). There is nowwidespread agreement that medial temporal atrophy, in particular hip-pocampal atrophy, is a sensitive AD biomarker (Frisoni et al., 2009,2010; Jack et al., 2011). Note that other biomarkers than voxels and vol-umes include cortical thickness measurements (Fischl and Dale, 2000;Jones et al., 2000), cortical folding patterns (Mangin et al., 2004), andlongitudinal metrics of volume changes (Freeborough and Fox, 1997),not to mention potential disease biomarkers available from other mo-dalities than T1-weighted imaging.
It is not yet clear how accurate fully automated volume-based mor-phometry (VolBM) can be at predicting disease compared to VBM.Cuingnet et al. (2011) reported hippocampus volume estimationmethods that are competitive with whole-brain VBM to detect AD atan early stage. Other studies showed that volumes of medial temporallobe regions computed using NeuroQuant exhibit statistically signifi-cant differences between early AD patients and controls (Brewer et al.,2008) and correlate with clinical scores (Kovacevic et al., 2009).
It is sometimes argued that whole-brain voxel-level information isideal for classification in that it captures the whole pattern of disease-induced anatomical changes. In practice, however, high-dimensionalclassifiers suffer from the so-called curse of dimensionality, which in-herently limits their accuracy unless trained from unrealistically largedatasets. Moreover, high-dimensional classifiers tend to appear as“black boxes” to clinicians as opposed to rather simple volumetric mea-sures of brain tissue or structure that are well known to be affected byage or disease. The interpretation of voxel-based classifiers in terms ofspatial patterns of changes is an open methodological issue (Gaonkarand Davatzikos, 2012).
We here provide an experimental evaluation of VolBM for automatedAD and MCI classification, with comparison to the whole-brain VBM ap-proach using SPM previously reported, e.g., in Klöppel et al. (2008) andCuingnet et al. (2011). The remainder of this paper is structured as fol-lows. Sections 2–4 describe the data, brain morphometry algorithmsand multivariate classification algorithms used in our evaluation. Experi-mental results are reported in Section 5 and discussed in Section 6.
2. Analysis dataset
2.1. ADNI background
Data used in the disease classification experiments described in thefollowing were obtained from the Alzheimer's Disease NeuroimagingInitiative (ADNI) database (adni.loni.ucla.edu). The ADNI was launchedin 2003 by the National Institute on Aging (NIA), the National Instituteof Biomedical Imaging and Bioengineering (NIBIB), the Food and DrugAdministration (FDA), private pharmaceutical companies and non-profit organizations, as a $60million, 5-year public–private partnership.The primary goal of ADNI has been to test whether serial magnetic res-onance imaging (MRI), positron emission tomography (PET), other bio-logical markers, and clinical and neuropsychological assessment can be
Table 1Comparison of the segmentation algorithms underlying the morphometry methods eval-uated in this work.
Segmentation model Atlas prior Labeling
SPM Tissue-wise Yes SoftFreeSurfer Structure-wise Yes HardMorphoBox Tissue-wisea No Soft
a MorphoBox segments brain structures in a post-processing step, see text.
combined to measure the progression of mild cognitive impairment(MCI) and early Alzheimer's disease (AD). Determination of sensitiveand specific markers of very early AD progression is intended to aid re-searchers and clinicians to develop new treatments and monitor theireffectiveness, as well as lessen the time and cost of clinical trials. ThePrincipal Investigator of this initiative is Michael W. Weiner, MD, VAMedical Center and University of California — San Francisco. ADNI isthe result of the efforts of many co-investigators from a broad range ofacademic institutions and private corporations, and subjects havebeen recruited from over 50 sites across the U.S. and Canada. The initialgoal of ADNI was to recruit 800 subjects but ADNI has been followed byADNI-GO and ADNI-2. To date these three protocols have recruited over1500 adults, ages 55 to 90, to participate in the research, consisting ofcognitively normal older individuals, people with early or late MCI,and people with early AD. The follow-up duration of each group is spec-ified in the protocols for ADNI-1, ADNI-2 and ADNI-GO. Subjects origi-nally recruited for ADNI-1 and ADNI-GO had the option to be followedin ADNI-2. For up-to-date information, see www.adni-info.org.
2.2. ADNI standardized analysis set
Our analysis dataset was obtained from the ADNI standardized anal-ysis sets described in Wyman et al. (2012), which consist of both1.5 Tesla (1.5 T) and 3 Tesla (3 T) good quality T1-weightedMR images,from different acquisition systems and vendors, of individuals diag-nosed as either normal, MCI, or AD based on careful clinical assessment.AD diagnosis is estimated to have an accuracy rate of about 90% usingconsensus criteria for probable AD (definite AD requires autopsy confir-mation), and diagnostic accuracy is lower at pre-symptomatic stages. Afraction of subjects may therefore be misdiagnosed, for instance somepre-clinical AD subjects may be diagnosed normal or MCI, and someother subjects may be diagnosed ADwhile suffering from other demen-tias. It should therefore be kept in mind that the classification accuracymeasures reported in Section 5 are inherently lowered by diagnosis un-certainty, assuming that automatic classification errors and diagnosiserrors are weakly correlated, which is reasonable given that ADNI diag-nosis was not based on morphometry.
We used the screening scans from the 1.5 T dataset (818 image setscorresponding to distinct subjects: 229 controls, 401 MCI, 188 AD) andthe baseline scans from the 3 T dataset (151 image sets correspondingto distinct subjects: 47 healthy, 71 MCI, 33 AD). All subjects from the3 T dataset are also included in the 1.5 T dataset, having been scannedat 3 T less than 4 months after their 1.5 T scan. The analysis datasetwas constituted by taking the standardized ADNI 1.5 T dataset and re-placing every 1.5 T scan by the corresponding subject 3 T scan whenavailable, resulting in a set of images with mixed field strengths(about 80% 1.5 T and 20% 3 T) from all distinct subjects with the samesize and diagnosis repartition as the 1.5 T dataset.
For a fair comparison between morphometry methods, the imagesinput to the different morphometry methods were the images correctedfor gradient distortion, B1 inhomogeneity and bias field as provided byADNI. Hence image artifacts are expected to have a minimal effect onmorphometry results. Note that each of the tested methods (FreeSurfer,MorphoBox, SPM, see Section 3) performed a further bias field correction.
We also conducted experiments on the pure 1.5 T dataset thatyielded very similar results to those obtained from the combined1.5 T/3 T dataset, and are thus not reported. The 3 T dataset alone ap-peared too small to serve as a basis for meaningful statistical compari-sons between morphometry methods.
3. Brain morphometry methods
3.1. SPM
SPM (Statistical ParametricMapping,www.fil.ion.ucl.ac.uk/spm) is apopular neuroimaging analysis software that implements a VBM

Fig. 1. Linear regression plots for total GM volume estimation on the standardized ADNI dataset using FreeSurfer (left) and MorphoBox (right). Black and red dots represent healthy con-trols andADpatients, respectively. Dotted lines represent the 10 and 90 percentiles for the controls. (For interpretation of the references to color in this figure legend, the reader is referredto the web version of this article.)
9D. Schmitter et al. / NeuroImage: Clinical 7 (2015) 7–17
pipeline thoroughly described at the theoretical level in Ashburner andFriston (2000, 2005), Ashburner (2007), and Ashburner and Friston(2009) and at the practical level in Ashburner (2010). In this work, weused SPM version 8, abbreviated SPM8. In brief, the pipeline first con-verts an incomingMR scan into several tissue probability maps, includ-ing a GM probability map, using a Bayesian image segmentationalgorithm called New Segment. The GMprobabilitymap is then spatiallysmoothed and warped to a reference space to enable voxel-by-voxelcomparisons of different subjects. This normalization step involvesrescaling the smoothed GM probability values, considered as voxel-wise GM concentrations, by the Jacobian determinants of the deforma-tions in order to compensate for spurious volume variations introducedby the warping. In addition, the reference space itself is iteratively opti-mized from the GM and WM probability maps of different subjectsusing the DARTEL algorithm (Ashburner, 2007).
3.2. FreeSurfer
FreeSurfer (surfer.nmr.mgh.harvard.edu) is today probably themostwidely used software for VolBM. It implements a complex image pro-cessing pipeline described in Fischl et al. (2002), Fischl (2012) and thereferences therein, which segments an incoming scan in a large numberof anatomical structures and subsequently computes correspondingvolumes. In this work, we used FreeSurfer version 5.1.0 andweremain-ly interested in temporal GM, total GM, hippocampus and ventricularvolumes output by FreeSurfer as potential imaging biomarkers of AD-related brain atrophy.
Fig. 2. Linear regression plots for temporal GM volume estimation using FreeSurfer (left) and Mtively. Dotted lines represent the 10 and 90 percentiles for the controls. (For interpretation of tharticle.)
A current limitation of FreeSurfer is its computational complexitycompared to SPM, which may restrict its use in clinical routine. On anup-to-date single-processor PC, the FreeSurfer pipeline typically takesseveral hours to run for a single scan while SPM takes minutes. Otherhighly accurate volume extractionmethods such asmulti-template seg-mentationmethods (Klein et al., 2005) also require heavy computation-al load.
3.3. MorphoBox
We implemented a brain volumetry algorithm that combines simpleand fast image analysis methods in order to perform VolBM in compu-tation time comparable with SPM without hardware optimization.This algorithm calledMorphoBox is freely available as aweb application(http://brain-morpho.epfl.ch) and is detailed in Appendix A.
One key algorithmic differencewith FreeSurfer that enables reducedcomputation time is that MorphoBox splits the segmentation of ana-tomical structures into two sequential steps: 1) labeling of total intra-cranial volume (TIV) voxels in brain tissue (CSF, GM, CSF) similarly toSPM's New Segment except that no atlas-based prior is used at thisstage; and 2) brain structure segmentation by combining tissue mapsobtained in step 1 with anatomical masks derived from a single-subject template via nonrigid registration. In FreeSurfer, both steps arecollapsed into one step that directly infers structure-wise labels usinga local image intensity model (Fischl et al., 2002). Also note that, con-trary to FreeSurfer, both MorphoBox and SPM perform soft tissue label-ing, i.e., assign voxels to tissueweights as opposed to single tissue labels,
orphoBox (right). Black and red dots represent healthy controls and AD patients, respec-e references to color in this figure legend, the reader is referred to the web version of this

Fig. 3. Linear regression plots for hippocampus volume detection on the standardized ADNI dataset using FreeSurfer (left) and MorphoBox (right). Black and red dots represent healthycontrols and AD patients, respectively. Dotted lines represent the 10 and 90 percentiles for the controls. (For interpretation of the references to color in this figure legend, the reader isreferred to the web version of this article.)
10 D. Schmitter et al. / NeuroImage: Clinical 7 (2015) 7–17
hence accounting for partial volume effects to some extent. Table 1summarizes the main differences between the segmentation methodsunderlying SPM, FreeSurfer and MorphoBox, respectively.
4. Multivariate disease classification
Automatic classification techniques based on multiple biomarkerscan help the clinician to test a specific binary hypothesis regarding aparticular subject, e.g., is the subject MCI or AD? If the subject is MCI,will he/she or not convert to AD within a certain time? Consistentlywith previous work on classification in AD, we used support vector ma-chines (SVMs) (Cortes and Vapnik, 1995) as implemented in LIBSVM(Chang and Lin, 2011) to respectively perform automatic classificationof AD patients vs healthy controls, MCI patients vs healthy controls,AD vsMCI patients, and early vs late AD converters amongMCI patients.The previous study of Abdulkadir et al. (2011) indicates that diseaseclassifiers can safely be trained on ADNI images acquiredwith heteroge-neous hardware settings. In each classification scenario, we comparedclassification performances from three distinct feature sets: normalizedvoxelwise GM concentrations computed via SPM and a set of a priorichosen volumes extracted using either FreeSurfer or MorphoBox.
4.1. Voxel-based classification
For the sake of comparison of VolBM methods with conventionalVBM, we implemented an SPM8-based classification method similarto the one described in Klöppel et al. (2008) using a linear hard-margin SVM classifier. The GM tissue probability maps in native spacewere obtained from SPM8 New Segment (Ashburner and Friston,2005) and subsequently normalized to the population template
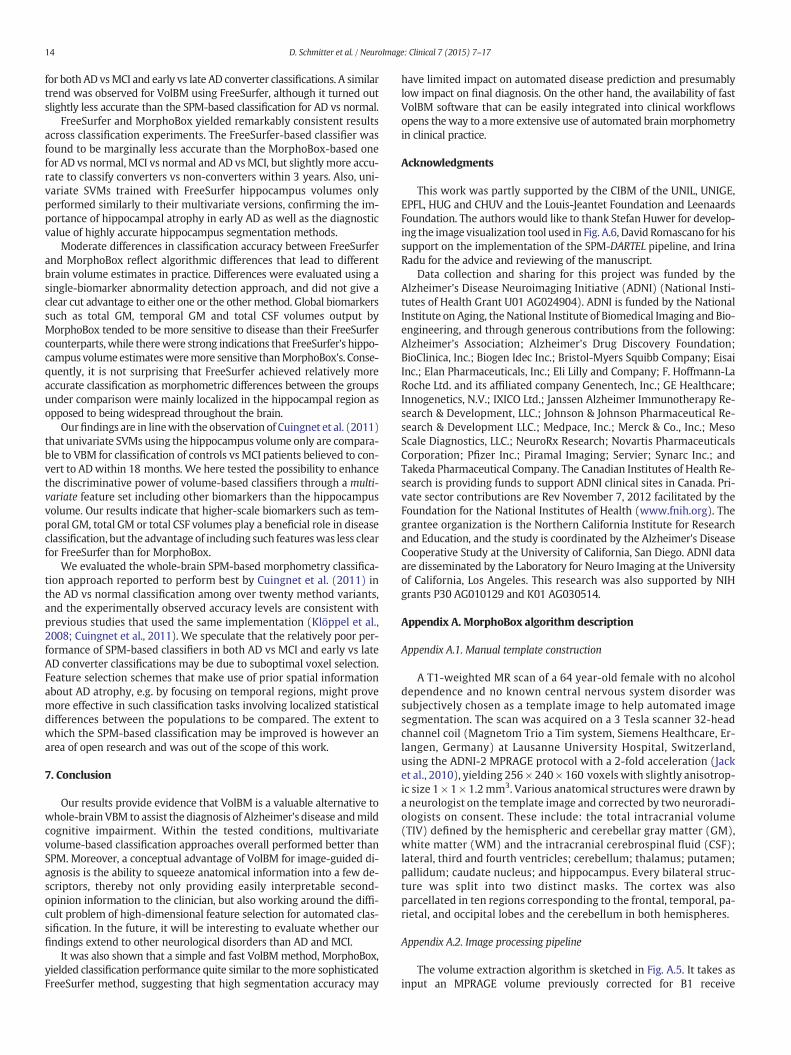
Fig. 4. ROC curves corresponding to Figs. 1–3 for AD detection on the standardized ADNI dataseestimated by FreeSurfer and MorphoBox, respectively.
generated from all images in the standardizedADNI dataset using the it-erative DARTEL approach (Ashburner, 2007), a procedure that tookabout three days on a standard PC. GM probability values in templatespace were modulated by the Jacobian determinant of the deformationfield in order to compensate for local volume changes induced by spatialnormalization (Ashburner and Friston, 2000). Voxels were then exclud-ed if their modulated GM probability was less than 0.2 or if short of sig-nificance (p N 0.05) according to a two-sample t-test (Chaves et al.,2009). The remaining voxels, of the order of 300,000 in our experi-ments, were detrended for age as recommended by (Dukart et al.,2011) and fed into the SVM classifier.
4.2. Volume-based disease classification
The rationale for selecting brain structures for volume-based classi-fication was their known involvement in AD-related brain atrophy atan early or moderately advanced stage of the disease (Frisoni et al.,2010).We chose a set of 10 features consisting of the following normal-ized brain or ventricular volumes: total GM, left and right temporal GM,left and right hippocampus, total CSF, and lateral, 3 and 4 ventricles. AllMorphoBox and FreeSurfer volumeswere normalized by FreeSurfer's orMorphoBox's TIV, respectively, and used to train multivariate SVM clas-sifiers. For consistencywith Cuingnet et al. (2011), and in order to inves-tigate the benefit of multivariate classification, we also evaluatedunivariate classifiers based on the hippocampus volume only for bothFreeSurfer and MorphoBox.
In the case of FreeSurfer, the TIV (called intracranial volume in theFreeSurfer 5.1.0 documentation), total GM, and hippocampus and ven-tricular volumes were read directly from the asegstats output file. Assuggested on the FreeSurfer wiki (surfer.nmr.mgh.harvard.edu/fswiki/
t using, from left to right: total GM, temporal GM, and hippocampus normalized volumes

Table 2Single-biomarker abnormality detection rates for FreeSurfer and MorphoBox.
Biomarker AD MCI
FreeSurfer MorphoBox FreeSurfer MorphoBox
Left hippocampus 82% 77% 70% 66%Right hippocampus 79% 76% 70% 67%Hippocampus 83% 78% 71% 69%Left temporal GM 77% 80% 65% 67%Right temporal GM 75% 79% 64% 65%Temporal GM 78% 81% 66% 67%Cortical GM 70% 73% 63% 64%Total GM 71% 72% 64% 64%Total CSF 64% 72% 56% 63%
11D. Schmitter et al. / NeuroImage: Clinical 7 (2015) 7–17
CorticalParcellation), left and right temporal GMvolumeswere comput-ed by summing up several ROI volumes found in the lh.aparc.stats andrh.aparc.stats files, respectively. These are the ROIs labeled as superiortemporal, middle temporal, inferior temporal, transverse temporal,banks of the superior temporal sulcus, fusiform, entorhinal, temporalpole and parahippocampal according to the Desikan–Killiany atlas(Desikan et al., 2006). Likewise, the total CSF was computed by sum-ming up all ventricular volumes and adding the remaining CSF volumecorresponding to voxels classified as extraventricular CSF. In order tocorrect relative volumes for aging effects, we applied the same lineardetrending method as for VBM (Dukart et al., 2011) to each volume.
A specificity of volume-based classification is that the number of vol-ume features is typically much smaller than the number of trainingscans, implying that the classification problem is not linearly separable.Therefore, the linear hard-margin SVM is not applicable and we insteadresorted to linear soft-margin SVM classifiers using an adjustable costparameter C.
4.3. Evaluation of classification performance
The discriminative power of the different SVM classifiers was es-timated by leave-one-out cross-validation, a classical procedure thatexcludes one subject, trains the classifier with the remaining sub-jects and then checks whether the left-out subject is well classifiedor not. Numbers of true positives (TP), false positives (FP), true neg-atives (TN) and false negatives (FN) were counted by repeating thisscheme for every subject. AD patients were considered to be posi-tives in the classification of AD patients vs healthy controls as wellas in the classification of AD patients vs MCI patients. MCI patientswere considered positives in the classification of MCI patients vshealthy controls. Likewise, AD converters were considered positivesin the classification of AD converters vs non-converters among MCIsubjects.
The following performance measures are reported in Section 5:
• Sensitivity (SEN), the proportion of correctly classified positives:SEN = TP ∕ (TP + FN).
• Specificity (SPE), the proportion of correctly classified negatives:SPE = TN ∕ (TN + FP).
Table 3Binary multivariate classification results for AD vs normal.
Method Performance
SEN SPEC BACC PPV NPV
FreeSurfer 82% 88% 85% 84% 86%MorphoBox 86% 91% 89% 88% 89%SPM 82% 94% 88% 92% 86%
• Balanced accuracy (BACC), the average of sensitivity and specificity:BACC = (SEN + SPE) ∕ 2.
• Positive predictive value (PPV), the proportion of true positives in de-tected positives: PPV = TP ∕ (TP + FP).
• Negative predictive value (NPV), similar to PPV for negatives: NPV=TN ∕ (TN + FN).
• Likelihood ratio positive, LR+ = SEN ∕ (1− SPE), the post-test posi-tive odds corresponding to even pre-test odds given a positive test.
• Likelihood ratio negative, LR− = (1− SEN) ∕ SPE, the post-test posi-tive odds corresponding to even pre-test odds given a negative test.
Also, following Cuingnet et al. (2011), McNemar's chi square testusing the Yates correction was applied to assess differences in accuracybetween classifiers as well as to test whether each classifier was equiv-alent to a random classifier.
5. Results
5.1. Processing
All images were processed by SPM8, FreeSurfer 5.1.0 andMorphoBox. Both SPM and MorphoBox SPM terminated successfullyin all cases while FreeSurfer failed to process 12 images for reasonsthat we did not further investigate. These cases, which are specified bytheir unique ADNI identifier in Appendix C, relate specifically to 2/229controls, 2/401 MCI patients, 1/188 AD patient in the 1.5 T dataset,and 1/47 control, 4/71 MCI patients, 2/33 AD patient in the 3 T dataset.The FreeSurfer performance measures reported below are restricted tothe standardized ADNI dataset excluding those cases. For the McNemartests in multivariate classification, the images that could not be proc-essed by FreeSurfer were counted as random classifications. The aver-age computation time per image on a single-threaded 3 GHzprocessor with 8 GB RAM was about 8 min for MorphoBox, 10 h forFreeSurfer, and 5 min 30 s for SPM.
5.2. FreeSurfer/MorphoBox biomarker comparison
This section presents an experimental comparison between the twoabove described VolBM methods, FreeSurfer and MorphoBox. Directevaluation of segmentation accuracy is impossible without knowledgeof a ground truth. However, given two cohorts, one of normal subjectsand one of patients (in this case, reliably diagnosedMCI or AD subjects),we may assess the ability of the respective methods to detect diseasedsubjects using a particular brain structure volume.
To that end, we defined for each structure of interest an age-matched normative range for volumes normalized by the TIV accord-ing to the method under consideration. This was done using linearregression against age on the healthy cohort, as depicted inFigs. 1–3. More specifically, normative ranges were defined as thelinear regression prediction intervals corresponding to a given per-centile under the simplifying assumption that normalized volumesare normally distributed at each age with constant variance. Notethat normative ranges obtained under more realistic regressionmodels, e.g. log-normal or nonlinear (Walhovd et al., 2011), turned
McNemar tests
LR+ LR− FreeSurfer MorphoBox SPM
6.83 0.20 – p b 0.0001 p = 0.07369.56 0.15 p b 0.0001 – p = 1.0
13.67 0.19 p = 0.0736 p = 1.0 –

Table 4Binary multivariate classification results for MCI vs normal.
Method Performance McNemar tests
SEN SPEC BACC PPV NPV LR+ LR− FreeSurfer MorphoBox SPM
FreeSurfer 66% 80% 73% 85% 57% 3.30 0.42 – p b 0.0001 p b 0.0001MorphoBox 69% 83% 76% 88% 61% 4.06 0.37 p b 0.0001 – p b 0.0001SPM 78% 68% 73% 81% 63% 2.44 0.32 p b 0.0001 p b 0.0001 –
12 D. Schmitter et al. / NeuroImage: Clinical 7 (2015) 7–17
out to have little impact on this analysis.We used one-sided intervalsof the form (c,+∞) to detect atrophied structures and (−∞,c) to de-tect hypertrophied structures. The higher the percentile, the widerthe range.
Receiver operating characteristic (ROC) curves shown in Fig. 4express the proportion of diseased subjects found outside the nor-mative range (sensitivity) as a function of the proportion of normalsubjects outside the normative range (1–specificity) for several vol-umetric biomarkers. Abnormality detection rates, defined for a bio-marker as the value on the corresponding ROC curve wheresensitivity equals specificity, were evaluated in both the AD andMCI cohorts for several imaging biomarkers relevant to Alzheimer'sdisease (Frisoni et al., 2010) and compared between FreeSurfer andMorphoBox, see Table 2. For consistency, FreeSurfer and MorphoBoxvolumes were normalized by their respective own total intra-cranialvolume (TIV) estimates.
Overall, abnormality detection rates obtained using MorphoBox andFreeSurfer turned out remarkably consistent on standardized ADNI datadespite the different degrees of sophistication and computation time ofthe respective methods. FreeSurfer achieved higher accuracy thanMorphoBoxwith its hippocampus volumemeasures but yielded slightlylower accuracy with GM measures. Both methods could detect about80% AD patients and close to 70% MCI patients with equal specificity(true negative rate)with temporal lobe and hippocampus volumemea-sures. Abnormality detection rates obtained with more global bio-markers were lower: about 70% AD patients and 65% MCI patients forcortical GM and total GM, and similarly for total CSF using MorphoBox(lower abnormality detection rates were found with total CSF usingFreeSurfer, most likely because the FreeSurfer measure excludes mostof the extraventricular CSF and may thus lack power in detecting CSFexpansion).
Differences in abnormality detection rates reflect algorithmic dif-ferences between MorphoBox and FreeSurfer that unavoidably leadto different volume estimates. The soft labeling approach used inMorphoBox (see Appendix A) might better account for partial vol-uming at the GM/CSF and GM/WM interfaces, leading to possiblymore discriminative global GM volume measures. On the otherhand, the FreeSurfer hippocampus segmentation method, whichuses local, as opposed to global, intensity distribution modeling(Fischl et al., 2002) could be better suited for the segmentation ofsmall mixed gray/white structures such as the hippocampus. Thesefindings are consistent with the observation from the plots in
Table 5Binary multivariate classification results for AD vs MCI.
Method Performance
SEN SPEC BACC PPV NPV
FreeSurfer 69% 64% 67% 47% 81%MorphoBox 69% 67% 68% 49% 82%SPM 45% 69% 57% 40% 73%
Figs. 1–3 that FreeSurfer hippocampus volumes appear strongly cor-related with age than their MorphoBox counterparts, while the con-verse can be seen for total and temporal GM volumes.
5.3. Multivariate classification results
Tables 3–7 report classification results from SVMs independentlytrained with volumetric features from MorphoBox and FreeSurferand whole-brain voxel-wise GM concentrations from SPM. Asdiscussed in Subsection 4.1, volume-based and voxel-based featuresets have very different dimensions, respectively 10 for MorphoBoxand FreeSurfer, and about 300,000 for SPM. As discussed inSection 4, a hard-margin SVM was used for SPM-based classifierswhereas soft-margin SVMs were used for both MorphoBox andFreeSurfer due to lack of linear separability. The reported VolBMclassification results correspond to the SVM margin cost parametersthat yielded the largest BACC among predefined values on an expo-nential grid C = 10−3,…,103.
All evaluated morphometry methods tended towards higher classi-fication performance, as measured for instance by the balanced accura-cy (BACC), for AD vs normal classification (BACC ≥ 85%), than MCI vsnormal (BACC ≅ 75%), AD vs MCI (BACC ≤ 70%) and early vs late ADconversion (BACC≤ 70%), reflecting the increasing inherent difficultiesof the respective classification problems. Nevertheless, all classifiersperformed significantly above chance in all cases with the McNemartests significant at p = 0.0001.
5.4. AD vs normal
In theADvs normal classification, theMorphoBox-based andwhole-brain SPM-based classifiers both reached almost 90% BACC, which is ofthe order of the AD diagnosis accuracy, and no classifier was found sig-nificantly more accurate than the other according to the McNemar test.As shown by the likelihood ratios LR+ and LR−, the SPM-based classifierturned out better at confirming AD suspicion, but poorer at confirmingnormality. FreeSurfer achieved a slightly smaller BACC of 85%, which isperhaps surprising but consistent with our previous experimental ob-servation that some MorphoBox volumetric biomarkers achievedindividually higher abnormality detection rate for AD subjects (seeSubsection 5.2).
McNemar tests
LR+ LR− FreeSurfer MorphoBox SPM
1.92 0.48 – p = 0.2482 p b 0.00012.09 0.46 p = 0.2482 – p b 0.00011.45 0.80 p b 0.0001 p b 0.0001 –

Table 6Binary multivariate classification results for AD converters vs non-converters within 3 years.
Method Performance McNemar tests
SEN SPEC BACC PPV NPV LR+ LR− FreeSurfer MorphoBox SPM
FreeSurfer 75% 66% 71% 75% 66% 2.21 0.38 – p = 0.0133 p b 0.0001MorphoBox 64% 71% 68% 75% 60% 2.21 0.51 p = 0.0133 – p = 0.0003SPM 66% 54% 60% 66% 54% 1.43 0.63 p b 0.0001 p = 0.0003 –
13D. Schmitter et al. / NeuroImage: Clinical 7 (2015) 7–17
5.5. MCI vs normal
As expected, allmethods proved less accurate for the classification ofMCI vs normal than for AD vs normal, with BACC in the range 73–76%.Again, differences between classifiers were small, although statisticallysignificant. The MorphoBox-based classifier turned out the most accu-rate to confirm MCI suspicion (LR+ = 4.06), but the SPM-based classi-fier was the most accurate to confirm normality (LR− = 0.32). TheFreeSurfer-based classifier achieved a larger LR+ than SPM.
5.6. AD vs MCI
Differences between volume-based and voxel-based classifierswerefound to be more significant for AD vs MCI than for AD vs normal andMCI vs normal. The drop in classification accuracy compared to AD vsnormal and MCI vs normal was remarkably more pronounced for theSPM-based classifier, resulting in a relatively poor 57% BACC comparedto 67–68% for FreeSurfer and MorphoBox, respectively. This suggeststhat distributions of voxel-wise GM concentrationsmight be too similarin AD and MCI populations for an optimal classification to be achievedusing the implemented feature selection strategy (see Subsection 4.2),which ignores prior spatial information about AD atrophy.
5.7. Early vs late AD conversion
Among the MCI subjects present in the analysis dataset, we knowfrom subsequent visits that some were later diagnosed AD in the courseof the ADNI study. Specifically, 36 out of 401 MCI subjects are known tohave converted to AD within one year while 157 did not; 111 convertedwithin 2 years and 130 did not; 137 converted within 3 years and 103did not. We may thus try to automatically classify AD converters vsnon-converters depending on a given conversion time window usingthe same techniques as described above. In the following, we report clas-sification experiments for time windows of 2 years and 3 years, giventhat a one-year timewindowdoes not provide a sufficient number of con-verters for statistically meaningful comparisons.
The results, reported in Tables 6 and 7, show classification accuracylevels quite similar to the AD vs MCI classification. Again, volume-based classification performed more accurately than whole-brainvoxel-based classification. For a 2-year conversion threshold, FreeSurferand MorphoBox provided similar results with 68% and 69% BACC, re-spectively, and similar likelihood ratios. For a 3-year conversion thresh-old, however, FreeSurfer turned out somewhat more accurate thanMorphoBox, as shown by 71% BACC against 68% with the same LR+
2.21 but lower LR− 0.38 against 0.51. The hippocampus volume mightbe the driving feature for classification when comparing two groups
Table 7Binary multivariate classification results for AD converters vs non-converters within 2 years.
Method Performance
SEN SPEC BACC PPV NPV
FreeSurfer 71% 65% 68% 63% 72%MorphoBox 67% 71% 69% 66% 71%SPM 57% 65% 61% 59% 63%
both affected by early-stage AD atrophy. Therefore, this outcome is inlinewith our previous observation (see Subsection 5.2) that FreeSurfer'shippocampus estimate tends to be more sensitive to disease thanMorphoBox's.
5.8. Comparison with univariate classification
In order to assess the actual benefit of multivariate classification inVolBM approaches, we report in the Appendix (see Tables B.8–B.12)classification results obtained using FreeSurfer-based and MorphoBox-based SVM classifiers trained with the hippocampus volume only(univariate classification), as opposed to the above described 10 volumefeatures (multivariate classification). As expected, univariate classifiersachieved smaller BACC values thanmultivariate classifiers in all classifi-cation scenarios, yet by smaller amounts for FreeSurfer (1–3%) than forMorphoBox (6–9%). FreeSurfer-based univariate classifiers actually per-formed very similarly tomultivariate classifiers for early vs late AD con-verters, hence confirming the hippocampus preponderance in suchclassification tasks. The fact that univariate classification was clearlyless accurate than multivariate classification for MorphoBox suggeststhat the relatively poorer hippocampus segmentation quality comparedto FreeSurfer was compensated for by temporal lobe GM aswell as pos-sibly other GM and CSF measures.
6. Discussion
The goal of this study was to investigate the potential of VolBM todetect AD-related brain atrophy compared with conventional whole-brain VBM as implemented using SPM. We used both FreeSurfer and asimpler/faster in-house method called MorphoBox to benchmarkVolBMmethods against automatic binary disease classification, follow-ing a number of previous VBM studies in AD (Liu et al., 2004; Klöppelet al., 2008; Duchesne et al., 2008; Cuingnet et al., 2011; Liu et al.,2012). We trained SVM classifiers from a set of ten a priori chosen vol-umetric biomarkers known to be affected by AD at an early stage(Frisoni et al., 2010): left and right hippocampi, left and right temporalGM, lateral, 3 and 4 ventricles, total GM, and total CSF. SVMs trained re-spectively from FreeSurfer and MorphoBox were compared with SVMstrained from SPM-based GM concentration maps. Classification accura-cy was evaluated on a standardized ADNI dataset comprising 818 1.5 Tand 3 T scans from different subjects (229 controls, 401 MCI, 188 AD)using leave-one-out cross-validation.
VolBM yielded classification performance comparable, or superior, towhole-brain VBM in all tested classification scenarios. Specifically,VolBM using MorphoBox proved roughly equivalent to VBM for bothADvsnormal andMCI vs normal classifications, and clearlymore accurate
McNemar tests
LR+ LR− FreeSurfer MorphoBox SPM
2.03 0.45 – p = 0.04123 p = 0.00052.31 0.47 p = 0.04123 – p b 0.00011.63 0.66 p = 0.0005 p b 0.0001 –
14 D. Schmitter et al. / NeuroImage: Clinical 7 (2015) 7–17
for both AD vsMCI and early vs late AD converter classifications. A similartrend was observed for VolBM using FreeSurfer, although it turned outslightly less accurate than the SPM-based classification for AD vs normal.
FreeSurfer and MorphoBox yielded remarkably consistent resultsacross classification experiments. The FreeSurfer-based classifier wasfound to be marginally less accurate than the MorphoBox-based onefor AD vs normal, MCI vs normal and AD vsMCI, but slightly more accu-rate to classify converters vs non-converters within 3 years. Also, uni-variate SVMs trained with FreeSurfer hippocampus volumes onlyperformed similarly to their multivariate versions, confirming the im-portance of hippocampal atrophy in early AD as well as the diagnosticvalue of highly accurate hippocampus segmentation methods.
Moderate differences in classification accuracy between FreeSurferand MorphoBox reflect algorithmic differences that lead to differentbrain volume estimates in practice. Differences were evaluated using asingle-biomarker abnormality detection approach, and did not give aclear cut advantage to either one or the other method. Global biomarkerssuch as total GM, temporal GM and total CSF volumes output byMorphoBox tended to be more sensitive to disease than their FreeSurfercounterparts,while therewere strong indications that FreeSurfer's hippo-campus volumeestimatesweremore sensitive thanMorphoBox's. Conse-quently, it is not surprising that FreeSurfer achieved relatively moreaccurate classification as morphometric differences between the groupsunder comparison were mainly localized in the hippocampal region asopposed to being widespread throughout the brain.
Ourfindings are in linewith the observation of Cuingnet et al. (2011)that univariate SVMs using the hippocampus volume only are compara-ble to VBM for classification of controls vs MCI patients believed to con-vert to ADwithin 18 months. We here tested the possibility to enhancethe discriminative power of volume-based classifiers through a multi-variate feature set including other biomarkers than the hippocampusvolume. Our results indicate that higher-scale biomarkers such as tem-poral GM, total GM or total CSF volumes play a beneficial role in diseaseclassification, but the advantage of including such featureswas less clearfor FreeSurfer than for MorphoBox.
We evaluated the whole-brain SPM-based morphometry classifica-tion approach reported to perform best by Cuingnet et al. (2011) inthe AD vs normal classification among over twenty method variants,and the experimentally observed accuracy levels are consistent withprevious studies that used the same implementation (Klöppel et al.,2008; Cuingnet et al., 2011). We speculate that the relatively poor per-formance of SPM-based classifiers in both AD vs MCI and early vs lateAD converter classifications may be due to suboptimal voxel selection.Feature selection schemes that make use of prior spatial informationabout AD atrophy, e.g. by focusing on temporal regions, might provemore effective in such classification tasks involving localized statisticaldifferences between the populations to be compared. The extent towhich the SPM-based classification may be improved is however anarea of open research and was out of the scope of this work.
7. Conclusion
Our results provide evidence that VolBM is a valuable alternative towhole-brain VBM to assist the diagnosis of Alzheimer's disease andmildcognitive impairment. Within the tested conditions, multivariatevolume-based classification approaches overall performed better thanSPM. Moreover, a conceptual advantage of VolBM for image-guided di-agnosis is the ability to squeeze anatomical information into a few de-scriptors, thereby not only providing easily interpretable second-opinion information to the clinician, but also working around the diffi-cult problem of high-dimensional feature selection for automated clas-sification. In the future, it will be interesting to evaluate whether ourfindings extend to other neurological disorders than AD and MCI.
It was also shown that a simple and fast VolBMmethod, MorphoBox,yielded classification performance quite similar to themore sophisticatedFreeSurfer method, suggesting that high segmentation accuracy may
have limited impact on automated disease prediction and presumablylow impact on final diagnosis. On the other hand, the availability of fastVolBM software that can be easily integrated into clinical workflowsopens theway to amore extensive use of automated brainmorphometryin clinical practice.
Acknowledgments
This work was partly supported by the CIBM of the UNIL, UNIGE,EPFL, HUG and CHUV and the Louis-Jeantet Foundation and LeenaardsFoundation. The authors would like to thank Stefan Huwer for develop-ing the image visualization tool used in Fig. A.6, David Romascano for hissupport on the implementation of the SPM-DARTEL pipeline, and IrinaRadu for the advice and reviewing of the manuscript.
Data collection and sharing for this project was funded by theAlzheimer's Disease Neuroimaging Initiative (ADNI) (National Insti-tutes of Health Grant U01 AG024904). ADNI is funded by the NationalInstitute on Aging, the National Institute of Biomedical Imaging and Bio-engineering, and through generous contributions from the following:Alzheimer's Association; Alzheimer's Drug Discovery Foundation;BioClinica, Inc.; Biogen Idec Inc.; Bristol-Myers Squibb Company; EisaiInc.; Elan Pharmaceuticals, Inc.; Eli Lilly and Company; F. Hoffmann-LaRoche Ltd. and its affiliated company Genentech, Inc.; GE Healthcare;Innogenetics, N.V.; IXICO Ltd.; Janssen Alzheimer Immunotherapy Re-search & Development, LLC.; Johnson & Johnson Pharmaceutical Re-search & Development LLC.; Medpace, Inc.; Merck & Co., Inc.; MesoScale Diagnostics, LLC.; NeuroRx Research; Novartis PharmaceuticalsCorporation; Pfizer Inc.; Piramal Imaging; Servier; Synarc Inc.; andTakeda Pharmaceutical Company. The Canadian Institutes of Health Re-search is providing funds to support ADNI clinical sites in Canada. Pri-vate sector contributions are Rev November 7, 2012 facilitated by theFoundation for the National Institutes of Health (www.fnih.org). Thegrantee organization is the Northern California Institute for Researchand Education, and the study is coordinated by the Alzheimer's DiseaseCooperative Study at the University of California, San Diego. ADNI dataare disseminated by the Laboratory for Neuro Imaging at the Universityof California, Los Angeles. This research was also supported by NIHgrants P30 AG010129 and K01 AG030514.
Appendix A. MorphoBox algorithm description
Appendix A.1. Manual template construction
A T1-weighted MR scan of a 64 year-old female with no alcoholdependence and no known central nervous system disorder wassubjectively chosen as a template image to help automated imagesegmentation. The scan was acquired on a 3 Tesla scanner 32-headchannel coil (Magnetom Trio a Tim system, Siemens Healthcare, Er-langen, Germany) at Lausanne University Hospital, Switzerland,using the ADNI-2 MPRAGE protocol with a 2-fold acceleration (Jacket al., 2010), yielding 256 × 240 × 160 voxels with slightly anisotrop-ic size 1 × 1 × 1.2mm3. Various anatomical structures were drawn bya neurologist on the template image and corrected by two neuroradi-ologists on consent. These include: the total intracranial volume(TIV) defined by the hemispheric and cerebellar gray matter (GM),white matter (WM) and the intracranial cerebrospinal fluid (CSF);lateral, third and fourth ventricles; cerebellum; thalamus; putamen;pallidum; caudate nucleus; and hippocampus. Every bilateral struc-ture was split into two distinct masks. The cortex was alsoparcellated in ten regions corresponding to the frontal, temporal, pa-rietal, and occipital lobes and the cerebellum in both hemispheres.
Appendix A.2. Image processing pipeline
The volume extraction algorithm is sketched in Fig. A.5. It takes asinput an MPRAGE volume previously corrected for B1 receive

15D. Schmitter et al. / NeuroImage: Clinical 7 (2015) 7–17
(Narayana et al., 1988) and gradient distortion (Schmitt, 1985). A relatedimportant aspect that we do not discuss here is the quality controland artifact correction. Whereas ADNI takes care of this aspect forthe standardized dataset, we employ in our clinical settings auto-mated image quality assessment (Mortamet et al., 2009), artifactcorrections and checkup for acquisition parameter compliance onthe scanner console.
Appendix A.2.1. Template-to-subject registration
The template image is non-rigidly registered onto the input MRimage via a spatial transformation from the input image space to thetemplate image space under the form:
T xð Þ ¼ A∘D xð Þ;
where A is a 9-parameter affine transformation (translation androtation followed by anisotropic scaling) and D is a free-formdiffeomorphic displacement field. Registration proceeds by firstestimating A by maximizing normalized mutual information(Studholme et al., 1998) using a gradient ascent algorithm, andresampling the template image accordingly. The displacement fieldD is then estimated using a fast iterative scheme that maximizesthe local correlation between the input image and the affine-transformed template image by successive compositions of smoothincremental displacements (Chefd'hotel et al., 2002).
Appendix A.2.2. Bias field correction
Following registration, the input image is corrected for bias fieldusing an expectation–maximization (EM) algorithm similar toAshburner and Friston (2005). This uses a simple 4-class Gaussianmix-ture intensity model representing GM, WM, CSF and non-brain tissue,and is constrained by template-based tissue prior probability maps
Fig. A.5. Sketch of the Morpho
Fig. A.6. Example segmentation using MorphoBox: coronal view of an input MPRAGE volumestructures (lateral ventricles, central nuclei, hippocampus).
resampled to the input image space from the transformation T estimat-ed in the registration step. Such priors were computed using theDARTEL tool of SPM8 (Ashburner and Friston, 2009) from a datasetof 136 MR scans of healthy subjects (41 ± 25 years) acquired atLausanne University Hospital, Switzerland, in the same conditionsas the template image. The correction field (inverse bias field) ismodeled as a 3-degree spatial polynomial. To speed up computa-tion, the M-step objective is approximated using a second-orderTaylor expansion, resulting in efficient linear updates for the cor-rection field coefficients.
Appendix A.2.3. Skull stripping
Next, the TIV template mask is resampled to the input image spaceaccording to the composed transformation T, which provides a reason-ably accurate skull stripping where errors (due to included meningesand cut brain tissues) usually represent up to 1% of the TIV as assessedby visual inspection.
Appendix A.2.4. Brain tissue classification
The TIV restricted image is then submitted to a completely template-free tissue classification algorithm in order to avoid bias in tissue label-ing towards the particular cohort involved in a probabilistic templateconstruction (Ribes et al., 2011). At this stage, the image appearancemodel is a 5-class Gaussianmixture, which better accounts for intensityvariations within CSF and GM (e.g., due to partial voluming) than a sim-ple 3-classmodel, as discussed for instance by Bach Cuadra et al. (2005).The classes roughly represent ventricular CSF, sulcal CSF, cortical GM,deep GMandWM. Tissue classification ismade robust to noise by incor-porating a stationary Markov–Potts prior model (Van Leemput et al.,1999; Bach Cuadra et al., 2005)with a 6-neighborhood system. Practicalmodel fitting is carried out using a variational expectation–maximiza-tion (VEM) algorithm, which is numerically more stable than otherschemes commonly used in brain image analysis (Roche et al., 2011).
The VEM algorithm requires accurate initial guesses of themean tis-sue intensities to work robustly. An initializationmethod that we found
Box processing pipeline.
and two distinct overlays of maximum probability tissue labels (CSF, GM, WM) and brain

Table B.12Binary univariate classification results for early vs late AD converter within 2 years.
Method Performance McNemar tests
SEN SPEC BACC PPV NPV LR+ LR− MorphoBox FreeSurfer
FreeSurfer 67% 66% 67% 63% 70% 1.97 0.50 – p b 0.0001MorphoBox 67% 61% 63% 59% 68% 1.72 0.54 p b 0.0001 –
16 D. Schmitter et al. / NeuroImage: Clinical 7 (2015) 7–17
effective is to detect the three zero-crossings of the smoothed histogramfirst derivative, and consider them as the initial mean intensities corre-sponding respectively to ventricular CSF, cortical GM and WM. The ad-ditional two classes (mainly representing sulcal CSF and deep GM butalso voxel intensities affected by partial voluming) are initialized by av-eraging adjacent values. We tested other initialization methods thatmake use of the 3-class mixture model fit performed in the bias fieldcorrection step, which however proved less effective for disease predic-tion. The VEM algorithm outputs five posterior probability maps, whichare converted into threemaps corresponding to CSF/GM/WMby simplyadding the ventricular and sulcal CSF maps, on the one hand, and thecortical and deep GM maps, on the other hand.
Appendix A.2.5. Volumetry
Finally, the tissue probability maps are combined with the masksresampled from the template via transformation T computed in thetemplate-to-subject registration step to produce regional volume esti-mates. Lobe-wise GM volumes are computed by summing up GMprob-abilities over the template-based parcels. The same approach is usedwith CSF probabilities to compute ventricular volumes. Hippocampus,central nuclei and cerebellum volumes are computed by summing upGM and WM probabilities over the relevant masks.
Appendix B. Classifiers using hippocampus volume only
Table B.8Binary univariate classification results for AD vs normal.
Method Performance McNemar tests
SEN SPEC BACC PPV NPV LR+ LR− MorphoBox FreeSurfer
FreeSurfer 84% 81% 82% 78% 86% 4.42 0.20 – p = 0.248213MorphoBox 74% 85% 80% 80% 80% 4.93 0.31 p = 0.248213 –
Table B.9Binary univariate classification results for MCI vs normal.
Method Performance McNemar tests
SEN SPEC BACC PPV NPV LR+ LR− MorphoBox FreeSurfer
FreeSurfer 68% 76% 71% 83% 57% 2.83 0.42 – p = 0.000177MorphoBox 62% 76% 67% 82% 53% 2.58 0.50 p = 0.000177 –
Table B.10Binary univariate classification results for AD vs MCI.
Method Performance
SEN SPEC BACC PPV NP
FreeSurfer 72% 60% 64% 46% 82MorphoBox 59% 62% 61% 42% 76
Table B.11Binary univariate classification results for early vs late AD converter within 3 years.
Method Performance
SEN SPEC BACC PPV N
FreeSurfer 74% 63% 70% 73% 6MorphoBox 61% 63% 62% 69% 5
Appendix C. Images not processed by FreeSurfer
Table C.13ADNI identifiers of images for which FreeSurfer terminated before completion.
V
%%
P
5%5%
Field strength
LR+
1.801.55
V LR+
2.001.65
PTID
McNema
LR− MorphoB
0.47 –
0.66 p = 0.00
McNem
LR− Morph
0.41 –
0.62 p = 0
Series ID
r tests
ox FreeS
p =4427 –
ar tests
oBox Fre
p =.00010 –
Image ID
1.5 T
137_S_0686 16048 46668 137_S_0973 22528 43060 031_S_0618 15271 67110 013_S_1120 22815 51494 137_S_1041 22310 430713 T
130_S_0505 20396 39197 023_S_1247 26861 52138 136_S_0299 14403 40323 116_S_0392 16454 53818 016_S_1149 28286 86336 130_S_0969 22655 39203 002_S_1268 27680 65268urfer
0.004427
eSurfer
0.00010
17D. Schmitter et al. / NeuroImage: Clinical 7 (2015) 7–17
References
Abdulkadir, A., Mortamet, B., Vemuri, P., Jack, C.R., Krueger, G., Klöppel, S., 2011. Effects ofhardware heterogeneity on the performance of SVM Alzheimer's disease classifier.NeuroImage 58 (3), 785–792.
Ashburner, J., 2007. A fast diffeomorphic image registration algorithm. NeuroImage 38(1), 95–113.
Ashburner, J., 2010. VBM tutorial. Tech. repWellcome Trust Centre for Neuroimaging,London, UK.
Ashburner, J., Friston, K., 2000. Voxel-based morphometry — the methods. NeuroImage11 (6), 805–821.
Ashburner, J., Friston, K., 2005. Unified segmentation. NeuroImage 26 (3), 839–851.Ashburner, J., Friston, K., 2009. Computing average shaped tissue probability templates.
NeuroImage 45 (2), 333–341.Bach Cuadra, M., Cammoun, L., Butz, T., Cuisenaire, O., Thiran, J.-P., 2005. Comparison and
validation of tissue modelization and statistical classification methods in T1-weighted MR brain images. IEEE Trans. Med. Imaging 24 (12), 1548–1565.
Brewer, J., Magda, S., Airriess, C., Smith, M., 2008. Fully-automated quantification of re-gional brain volumes for improved detection of focal atrophy in Alzheimer disease.Am. J. Neuroradiol. 30, 578–580.
Chang, C.-C., Lin, C.-J., 2011. LIBSVM: a library for support vector machines. ACM Trans.Intell. Syst. Technol. 2, 27:1–27:27 (URL http://www.csie.ntu.edu.tw/~cjlin/libsvm).
Chaves, R., Ramrez, J., Grriz, J.M., Lpez, M., Salas-Gonzalez, D., Alvarez, I., Segovia, F., 2009.SVM-based computer-aided diagnosis of the Alzheimer's disease using t-test NMSEfeature selection with feature correlation weighting. Neurosci. Lett. 461 (3), 293–297.
Chefd'hotel, C., Hermosillo, G., Faugeras, O., 2002. Flows of diffeomorphisms for multi-modal image registration. Proc. IEEE International Symposium on Biomedical Imag-ing, pp. 753–756.
Cortes, C., Vapnik, V., 1995. Support-vector networks. Machine Learning, pp. 273–297.Cuingnet, R., Gérardin, E., Tessieras, J., Auzias, G., Lehéricy, S., Habert, M.-O., Chupin, M.,
Benali, H., Colliot, O., the Alzheimer's Disease Neuroimaging Initiative, 2011. Auto-matic classification of patients with Alzheimer's disease from structural MRI: a com-parison of ten methods using the ADNI database. NeuroImage 56 (2), 766–781.
Davatzikos, C., Resnick, S.M., Wu, X., Parmpi, P., Clark, C.M., 2008. Individual patient diag-nosis of AD and FTD via high-dimensional pattern classification of MRI. NeuroImage41 (4), 1220–1227.
Desikan, R.S., Ségonne, F., Fischl, B., Quinn, B.T., Dickerson, B.C., Blacker, D., Buckner, R.L.,Dale, A.M., Maguire, R.P., Hyman, B.T., Albert, M.S., Killiany, R.J., 2006. An automatedlabeling system for subdividing the human cerebral cortex on MRI scans into gyralbased regions of interest. NeuroImage 31 (3), 968–980.
Duchesne, S., Caroli, A., Geroldi, C., Barillot, C., Frisoni, G., Collins, D., 2008. MRI-based au-tomated computer classification of probable AD versus normal controls. IEEE Trans.Med. Imaging 27 (4), 509–520.
Dukart, J., Schroeter, M.L., Mueller, K., 2011. Age correction in dementia matching to ahealthy brain. PLoS One 6 (7), 9.
Fischl, B., 2012. FreeSurfer. NeuroImage 62 (2), 774–781.Fischl, B., Dale, A., 2000. Measuring the thickness of the human cerebral cortex frommag-
netic resonance images. Proc. Natl. Acad. Sci. 20 (97), 11050–11055.Fischl, B., Salat, D., Busa, E., Albert, M., Dieterich, M., Haselgrove, C., van der Kouwe, A.,
Killiany, R., Kennedy, D., Klaveness, S., Montillo, A., Makris, N., Rosen, B., Dale, A.,2002. Whole brain segmentation: automated labeling of neuroanatomical structuresin the human brain. Neuron 33 (3), 341–355.
Freeborough, P., Fox, N., 1997. The boundary shift integral: an accurate and robust mea-sure of cerebral volume changes from registered repeat MRI. IEEE Trans. Med. Imag-ing 16 (5), 623–629.
Frisoni, G., Prestia, A., Zanetti, O., Galluzzi, S., Romano, M., Cotelli, M., Gennarelli, M.,Binetti, G., Bocchio, L., Paghera, B., Amicucci, G., Bonetti, M., Benussi, L., Ghidoni, R.,Geroldi, C., 2009. Markers of Alzheimer's disease in a population attending a memoryclinic. Alzheimers Dement. 5, 307–317.
Frisoni, G.B., Fox, N.C., Jack, C.R., Scheltens, P., Thompson, P.M., 2010. The clinical use ofstructural MRI in Alzheimer disease. Nature Reviews Neurology 6 (2), 67–77.
Gaonkar, B., Davatzikos, C., 2012. Deriving statistical significance maps for SVM basedimage classification and group comparisons. Medical Image Computing andComputer-Assisted Intervention (MICCAI)Vol. 7510 of LNCS. Springer, Nice, France,pp. 723–730 (Oct.).
Giorgio, A., De Stefano, N., 2013. Clinical use of brain volumetry. J. Magn. Reson. Imaging37, 1–14.
Huppertz, H.-J., Kröll-Seger, J., Klöppel, S., Ganz, R.E., Kassubek, J., 2010. Intra- andinterscanner variability of automated voxel-based volumetry based on a 3D probabi-listic atlas of human cerebral structures. NeuroImage 49 (3), 2216–2224.
Jack, C., Barkhof, F., Bernstein,M., Cantillon,M., Cole, P., Decarli, C., Dubois, B., Duchesne, S.,Fox, N., Frisoni, G., Hampel, H., Hill, D., Johnson, K., Mangin, J.-F., Scheltens, P.,Schwarz, A., Sperling, R., Suhy, J., Thompson, P., Weiner, M., Foster, N., 2011. Stepsto standardization and validation of hippocampal volumetry as a biomarker in clinicaltrials and diagnostic criterion for Alzheimer's disease. Alzheimers Dement. 7 (4),474–485.
Jack, C.R., Bernstein, M.A., Borowski, B.J., Gunter, J.L., Fox, N.C., Thompson, P.M., Schuff, N.,Krueger, G., Killiany, R.J., DeCarli, C.S., et al., 2010. Update on the MRI core of theAlzheimer's disease neuroimaging initiative. Alzheimers Dement. 6 (3), 212.
Jones, S., Buchbinder, B., Aharon, I., 2000. Three-dimensional mapping of cortical thick-ness using Laplace's equation. Hum. Brain Mapp. 11 (1), 12–32.
Klein, A., Mensh, B., Ghosh, S., Tourville, J., Hirsch, J., 2005. Mindboggle: automated brainlabeling with multiple atlases. BMC Med. Imaging 5 (1), 7.
Klöppel, S., Stonnington, C.M., Chu1, C., Draganski, B., Scahill, R.I., Rohrer, J.D., Fox, N.C.,Jack, C.R., Ashburner, J., Frackowiak, R.S.J., 2008. Automatic classification of MRscans in Alzheimer's disease. Brain 131 (3), 681–689.
Kovacevic, S., Rafii, M., Brewer, J., the Alzheimer's Disease Neuroimaging Initiative, 2009.High-throughput, fully automated volumetry for prediction of MMSE and CDR de-cline in mild cognitive impairment. Alzheimer Dis. Assoc. Disord. 23 (2), 139–145.
Liu, M., Zhang, D., Shen, D., the Alzheimer's Disease Neuroimaging Initiative, 2012. Ensem-ble sparse classification of Alzheimer's disease. NeuroImage 60 (2), 1106–1116.
Liu, Y., Teverovskiy, L., Carmichael, O., Kikinis, R., Shenton, M., Carter, C., Stenger, V., Davis,S., Aizenstein, H., Becker, J., Lopez, O., Meltzer, C., 2004. Discriminative MR image fea-ture analysis for automatic schizophrenia and Alzheimer's disease classification.Medical Image Computing and Computer-Assisted Intervention (MICCAI)Vol. 3216of LNCS. Springer, St Malo, France, pp. 393–401 (Sep.).
Mangin, J.-F., Rivière, D., Cachia, A., Duchesnay, E., Cointepas, Y., Papadopoulos-Orfanos, D.,Scifo, P., Ochiai, T., Brunelle, F., Régis, J., 2004. A framework to study the cortical foldingpatterns. NeuroImage 23, S129–S138.
Mietchen, D., Gaser, C., 2009. Computational morphometry for detecting changes in brainstructure due to development, aging, learning, disease and evolution. Front.Neuroinformatics 3 (25).
Mortamet, B., Bernstein, M.C., Jack, J., Gunter, J., Ward, C., Britson, P., Meuli, R., Thiran, J.-P.,Krueger, G., the Alzheimer's Disease Neuroimaging Initiative, 2009. Automatic qualityassessment in structural brain magnetic resonance imaging. Magn. Reson. Med. 62,365–372.
Narayana, P., Brey, W., Kulkarni, M., Sievenpiper, C., 1988. Compensation for surface coilsensitivity variation in magnetic resonance imaging. Magn. Reson. Imaging 6,271–274.
Ribes, D., Mortamet, B., Bach-Cuadra, M., Jack, C., Meuli, R., Krueger, G., Roche, A., 2011.Comparison of tissue classification models for automatic brain MR segmentation. In-ternational Society for Magnetic Resonance in Medicine (ISMRM'11). Montreal,Canada.
Roche, A., Ribes, D., Bach-Cuadra, M., Krueger, G., 2011. On the convergence of EM-like al-gorithms for image segmentation using Markov random fields. Med. Image Anal. 15(6), 830–839.
Schmitt, F., 1985. Correction of geometric distortion in MR Images. Proceedings of theComputer Assisted Radiology (CAR). Springer Verlag, pp. 15–25.
Studholme, C., Hill, D.L.G., Hawkes, D.J., 1998. An overlap invariant entropymeasure of 3Dmedical image alignment. Pattern Recogn. 1 (32), 71–86.
Van Leemput, K., Maes, F., Vandermeulen, D., Suetens, P., 1999. Automated model-basedbias field correction of MR images of the brain. IEEE Trans. Med. Imaging 18 (10),885–896.
Walhovd, K.B., Westlye, L.T., Amlien, I., Espeseth, T., Reinvang, I., Raz, N., Agartz, I., Salat,D.H., Greve, D.N., Fischl, B., et al., 2011. Consistent neuroanatomical age-related vol-ume differences across multiple samples. Neurobiol. Aging 32 (5), 916–932.
Wyman, B., Harvey, D., Crawford, K., Bernstein, M., Carmichael, O., Cole, P., Crane, P.,Decarli, C., Fox, N., Gunter, J., Hill, D., Killiany, R., Pachai, C., Schwarz, A., Schuff, N.,Senjem, M., Suhy, J., Thompson, P., Weiner, M., Jack, C., the Alzheimer's Disease Neu-roimaging Initiative, 2012. Standardization of analysis sets for reporting results fromADNI MRI data. Alzheimers Dement. 9 (3), 332–337.