Embed Size (px)
Citation preview

An evaluation of the responses to the 2016
Kaikōura earthquake
Vivienne Ivory, Opus Research, Opus
International Consultants Ltd

A collaboration to evaluate, learn, & monitor
Liam Wotherspoon, Seosamh Costello, Mohammad Aghababaei: University of AucklandJoanne Stevenson: Resilient OrganisationsVivienne Ivory, Maggie Trotter: Opus International ConsultantsThomas Wilson, Alistair Davies: University of CanterburyGarry McDonald: Market Economics
Shelley Tucker, Roger Fairclough, Nick Paterson, Geoff Parr, Aidan Smith, Tim Herbert: Ministry of Transport

Disruption to moving people & goods

Disruption decisions

Davies et al. (2017)Bulletin of the New Zealand Society for Earthquake Engineering, Vol. 50, No. 2, June 2017
Transport infrastructure performance and management in the South Island of New Zealand, during the first 100 days following the 2016 Mw 7.8 “Kaikōura” earthquake
PINCHPOINTS:
SH6 section of SH1 diversion
and the MNL have zero
redundancy (in the past 5
months, state highways and
railways have been closed by
earthquakes, landslides, rural
fires and flooding).
NETWORK LIMITATIONS:
Pre-disaster resilience works
could have decreased SH1
diversion disruption and
improved air travel into
Kaikōura.
RECOVERY PLANNING
Pre-established stakeholder
relationships could have
improved response and public
messaging.
COMMUNITY
PREPAREDNESS
Towns without road access
for 15 days.
Preventative mitigation
lessons
Response and recovery
lessons

Economic impact of the 2016 Kaikōura earthquake: Bringing it all together in MERIT. Dr Garry
McDonald, Dr Nicola Smith, Dr Emily Harvey, Dr Morag Ayers and John Kim
0-12
months
12-24
months
Total
(0-24
months)
Total
(0-24 months)
0-12
months
12-24
months
Total
(0-24
months)
Total
(0-24 months)
GDP impacts by componentShare of GDP
impacts (%)
Share of GDP
impacts (%)
Transport - all New Zealand -151 -58 -209 45% -167 -97 -263 51%
Canterbury -39 -11 -50 43% -45 -23 -68 49%
Rest of New Zealand -112 -47 -159 46% -121 -74 -196 52%
Business operability1 - all NZ -274 -3 -277 60% -279 1 -278 54%
Canterbury -52 1 -51 44% -57 1 -56 41%
Rest of New Zealand -222 -4 -226 65% -222 1 -222 59%
Tourism - all New Zealand 19 1 19 -4% 19 1 20 -4%
Canterbury -17 1 -16 14% -21 1 -20 14%
Rest of New Zealand 36 -1 35 -10% 40 -1 40 -11%
Notes: 1. This includes supply-side impacts on tourism businesses
Estimated GDP impacts
($2016m)
OPTIONS 1&2 OPTION 3
Time Period After Event Time Period After Event
Estimated GDP impacts ($2016m)
Estimated Contributions of Transport, Business Operability and Tourism to Total Impacts
Rapid assessment of the economic impacts as part of the wider information response to support decision-making

RESPONSE RECOVERYRESPONSE + RECOVERY
RESPONSE + PREPERATION
RESPONSE + RECOVERY + PREPERATION RECOVERY + PREPERATON
National Crisis Mgmt Centre
Ministry of Foreign Affairs and Trade
(international assistance)
National Security Committee of Cabinet (NSC)
NZ Search and Rescue
CDEM Group Emergency Mgmt
Office/EEC
Emergency services personnel
USAR staff
Ministry of Transport
Ministry of Civil Defence & Emergency
Mgmt
New Zealand
Transport Agency
KiwiRail Defence Force
Road freight/Trucking
companies
Port companies (Centreport,
Marl., Nelson)
Lifelines groups (power, water, roads, ports)
Local Govt politicians, councillors
Network contractors
NOCSeismologists, assessors,
engineers, planners designers, & other scientists
Ports
State highways
Local authority roads
Treasury
EQC Insurance
Professional bodies & unions
Industry reps and lobby
groups
Rail freight companies
Ferry and other shipping
companies
Local business community
Fonterra
Consultants
Contractors
Road Network Mgmt Alliance
Retailers
Producers/manufacturers
Farmers/growers
Hospitality and tourist operators
Tankers
Embassies (e.g. Chinese,
Brit, US)
Land care
Social and business recovery
managers
Synlait
Air freight companies
Central
Local
Identified by all
expertsIdentified by 3 + Identified by 2 + Identified by 1
ATRF: Tuesday Poster 69

Better information for better learning & planning• Inter-regional, multi-modal
• Users of information = investors, managers, transport network users
• Across the disaster risk reduction cycle
Response
Recovery
Reduction
Readiness

Research goals
Observe
• System disruption
•Adaptation
Learn
• Information flows & decisions
• Lessons
Monitor
• System performance
•Data requirements

Research Programme: key steps
Gather
•Workshop
•Wider engagement
• In-depth enquiry
Tool development
•Data gap identification
•Data gathering
•Monitoring
Report
• System performance
•Data requirements
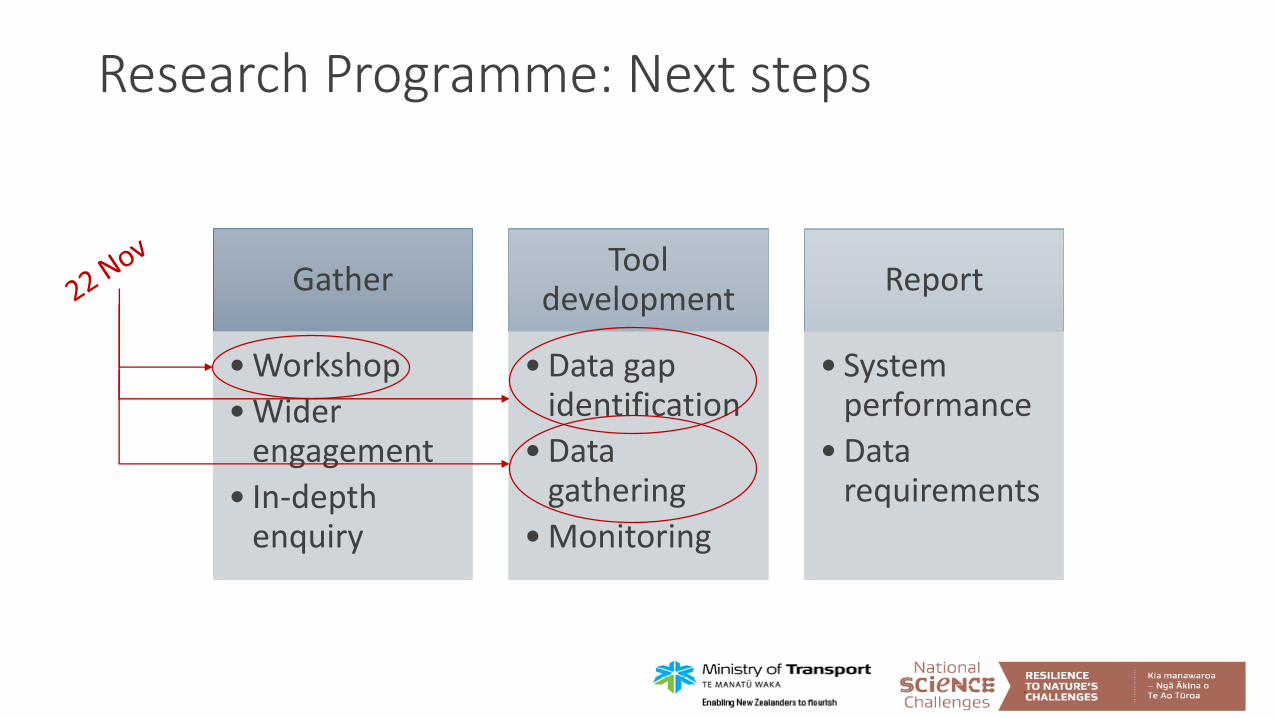
Research Programme: Next steps
Gather
•Workshop
•Wider engagement
• In-depth enquiry
Tool development
•Data gap identification
•Data gathering
•Monitoring
Report
• System performance
•Data requirements

Data, data everywhere (except where you need it) • Mapping consequences
• Timeline of decisions
• Timeline of information generation & use

Research Programme
• How you can help
• What information do you need in these circumstances?
• What data can you share?
Contact details: [email protected]@[email protected]
For Kaikoura case
For future cases