Embed Size (px)
Citation preview

Calhoun: The NPS Institutional Archive
Theses and Dissertations Thesis Collection
1984-03
An evaluation of the Navy Resale System's
operating and financial statements
Barnett, Michael Stephen
Monterey, California. Naval Postgraduate School
http://hdl.handle.net/10945/19313


DUDLEY KNC"
naval por/


AVALAnn
Monterey, Caiifornia
THESISAN EVALUATION OF THE NAVY RESALE SYSTEM' S
OPERATING AND FINANCIAI
by
, STATEMENTS
Mich ael Stephen Eiarnett
March 19 84
K. EuskeThesis Advisors : J. F. Mullane, Jr.
Approved for public release; distributionunlimited
T21 f f

Unclassif ied
SECURITY CLASSIFICATION OF THIS PAGE (When Data Entered)
REPORT DOCUMENTATION PAGE READ INSTRUCTIONSBEFORE COMPLETING FORM
I. REPORT NUMBER 2. GOVT ACCESSION NO 3. RECIPIENT'S CATALOG NUMBER
4. TITLE (and Subtitle))
An Evaluation of the Navy Resale System'sOperating and Financial Statements
5. TYPE OF REPORT & PERIOD COVEREDMaster ' s Thes isMarch 19846. PERFORMING ORG. REPORT NUMBER
7. AUTHORS.)
Michael Stephen Barnett8. CONTRACT OR GRANT NUMBERS.)
9. PERFORMING ORGANIZATION NAME ANO ADDRESS
Naval Postgraduate SchoolMonterey, California 93943
10. PROGRAM ELEMENT. PROJECT, TASKAREA 4 WORK UNIT NUMBERS
II. CONTROLLING OFFICE NAME ANO AOORESS
Naval Postgraduate SchoolMonterey, California 93943
12. REPORT DATE
March 198413. NUMBER OF PAGES167
I* MONITORING AGENCY NAME 4 ADORESSf/f different from Controlling Office) IS. SECURITY CLASS, (of this report)
Unc lassifiedIS*. DECLASSIFICATION DOWNGRADING
SCHEDULE
l«. DISTRIBUTION STATEMENT (of thla Rupert)
Approved for public release; distribution unlimited
'7. DISTRIBUTION STATEMENT (of the ebatraet entered In Block 30. If different from Report)
IB. SUPPLEMENTARY NOTES
19. KEY WORDS (Continue on reverie eide II neeeeemry end Identify by block number)
Operating Statements Navy Resale and Services Support OfficeFinancial StatementsAccounting StatementsNavy Resale System
20. ABSTRACT (Continue on reveree aide If neceeeary and Identity by block number)
This thesis contains an evaluation of the Navy Resale Systemfinancial and operating statements used to manage the salesactivities from the headquarters, region, main, and branchlevels. Navy Resale System (NRS) statements are comparedto the National Retail Merchants Association's (NRMA)statements presented in the Retail Ac coun ting Manua
1
andto statements provided by major retailers.
do ,:FORMAN 73 1473 COITION OF 1 NOV 6S IS OBSOLETE
S/N 0102- LF- 014-6601Unclassified
SECURITY CLASSIFICATION OF THIS PAGE (When Dale Enter;


ULU-icissii xeuSECURITY CLASSIFICATION OF THIS PAGE (When Dmtm Enfrmd)
From the results of the evaluation a number of conclusionsare drawn. To summarize the Navy Resale System statementsare essentially sound. However, change is needed in expensestatement and leased sales presentation to communicate a
better picture of how the Navy Resale System compares to
other major retailers.
S N 0102- LF- 014- 6601
UnclassifiedSECURITY CLASSIFICATION OF THIS PAGE(T»7»»n Data Enfrod)


Approved for public release; distribution unlimited
An Evaluation of the Navy Resale System
Operating and Financial Statements
by
Michael Stephen BarnettLieutenant Commander, Supply Corps, United States Navy
B.S., University of Kansas, 1973
Submitted in partial fulfillment of therequirements for the degree of
MASTER OF SCIENCE IN MANAGEMENT
from the
NAVAL POSTGRADUATE SCHOOLMarch 1984


ABSTRACT
This thesis contains an evaluation of the Navy Resale
System financial and operating statements used to manage the
sales activities from the headquarters, region, main, and
branch levels. Navy Resale System (NRS) statements are
compared to the National Retail Merchants Association's
(NRMA) statements presented in the Retail Accounting Manual
and to statements provided by major retailers.
From the results of the evaluation a number of conclu-
sions are drawn. To summarize the Navy Resale System state-
ments are essentially sound. However, change is needed in
expense statement and leased sales presentation to
communicate a better picture of how the Navy Resale System
compares to other major retailers.


u<JOLEY KNOX LIPRARY
TABLE OF CONTENTS
I. INTRODUCTION 10
A. GENERAL INFORMATION 10
B. NEED FOR A STUDY OF THE NAVY RESALE SYSTEMFINANCIAL OPERATING STATEMENTS 10
C. OBJECTIVE AND SCOPE OF THE THESIS 11
D. METHOD OF RESEARCH 12
E. THESIS ORGANIZATION 13
II. RETAIL ACCOUNTING AND REPORTING 14
A. INTRODUCTION 14
B. MERCHANDISE ACCOUNTING 14
1. Departments Within Retail Stores 14
a. Retail Inventory Departments 15
b. Cost or Non-Retail SellingDepartments 15
c
.
Contract Departments 16
d. Leased or Licensed Departments 16
e. Workrooms 17
f. Miscellaneous Revenue Operations -- 17
2. Computation of Gross Margin 18
C. EXPENSE ACCOUNTING 18
1. Expense Centers 19
2. Natural Divisions 21
3. Expense Comparisons 22
5


Ill
D. MANAGEMENT REPORTING 23
1. Merchandise Department PerformanceStatistics 23
a. Merchandise Department Statistics - 23
b. Merchandise Department PerformanceReports 25
2. Cost or Non-Retail Operations Reports - 29
3. Summaries of Expense Data 32
4 . Branch Store Reporting 4 5
5. Executive Level Reporting 47
a. Planning and Budgeting 47
b. Suggested Reporting Formats 48
(1) Total Company Balance Sheet -- 49
(2) Condensed Income Statement 49
(3) Total Company Income andExpense Statement 53
E. EFFECTIVE FINANCIAL MANAGEMENT REPORTS 53
1. Improving the Effectiveness ofManagement Reports 55
a. Report Content 55
b. Timing of Reports 56
c. Recipient of Report 56
d. Presentation 56
2. Common Weaknesses of ManagementReports 57
INFORMATION PROVIDED IN GENERAL PRACTICE 59
A. INTRODUCTION 59
B.' RETAIL MERCHANDISE REPORTS 59
6


C. COST OR NON-RETAIL MERCHANDISE REPORTS 65
D. EXPENSE REPORTS 67
E. BRANCH STORE REPORTS 76
F. EXECUTIVE LEVEL REPORTS 90
IV. NAVY EXCHANGE FINANCIAL OPERATING STATEMENTS -- 101
A. INTRODUCTION 101
B. RETAIL MERCHANDISE REPORTS 102
C. COST OR NON-RETAIL MERCHANDISE REPORTS 104
1. Service Departmental OperationsReport 104
2. Service Department Employee Benefits andOther Direct Expense Report 108
D. EXPENSE REPORTS 108
E. BRANCH STORE REPORTS 109
1. Retail Operations 109
2. Service Operations 111
3. General Expense Payroll 113
4. General Expense 113
5. Operating Statement (Excluding RetailClothing Stores and Navy Lodges) 119
6. Retail Clothing Stores 119
7. Navy Lodges 122
F. EXECUTIVE LEVEL REPORTS 122
1. Regional Reports 122
2. Headquarters Reports 124
V. COMPARISONS, CONCLUSIONS, AND RECOMMENDATIONS - 125
A. INTRODUCTION 125


COMPARISONS 125
1
.
Retail Merchandise Reports 125
2. Expense Reports 126
a. Comparative Statement of OperatingExpenses by Expense Center andSubcenter 126
b. Comparative Statement of OperatingExpenses by Natural Division 127
c. Other Expense Reports 127
3. Cost or Non-Retail MerchandiseReports 128
4. Branch Store Reports 129
5. Executive Level Reports 130
a. Total Company Balance Sheet 130
b. Condensed Income Statement 130
c. Total Company Income and ExpenseStatement 131
CONCLUSIONS, DISCUSSION, AND RECOMMENDATIONS 131
1
.
Retail Merchandise Reports 131
a. Department Total CompanyContribution Report 131
b. Department Contribution by SellingLocation Report 132
2. Expense Reports 134
a. General 134
b. Comparative Statement of OperatingExpenses by Expense Center andSubcenter 136
c
.
Comparative Statement of OperatingExpenses by Natural Division 136

d . Other Expense Reports 137
3. Cost or Non-Retail MerchandiseReports 138
a. Service Department OperationsReport 138
b. Service Department Expense CenterReport 140
4. Branch Store Reports 140
a. Retail Operations 142
b. Services Operations 142
c. General Expense Payroll andGeneral Expense 145
d. Operating Statement (ExcludingRetail Clothing Stores and NavyLodges) 145
e. Retail Clothing Stores andNavy Lodges 145
5. Executive Level Reports 147
a. Total Company Balance Sheet 147
b. Condensed Income Statement 147
c. Total Company Income and ExpenseStatement 148
D. CLOSING REMARKS 149
APPENDIX A GROSS MARGIN COMPUTATION 150
APPENDIX B EXPENSE CENTER ACCOUNTING 152
APPENDIX C WORKROOM AND COST DEPARTMENT OPERATINGSTATEMENT— LINE ITEM EXPLANATIONS 162
LIST OF REFERENCES 166
INITIAL DISTRIBUTION LIST 167


I . INTRODUCTION
A. GENERAL INFORMATION
The military exchange system consists of retail store
operations located on bases throughout the world. This
organization of stores had sales revenues which exceeded 6.3
billion dollars in Fiscal Year (FY) 1982. In comparison to
the countries leading retailers, in 1982 the military
exchange system's total sales ranked in fifth position
behind Sears, K mart, J. C. Penny, and Federated Department
Stores. [Ref. 1: p. R121]
The Navy Resale System FY 1982 total sales exceeded 1.5
billion which equates to approximately twenty-three percent
of the total military exchange sales. These sales would
place the Navy Resale System in twenty-third position in
relation to the countries retailers. [Ref.l: p. R 1 2 1 ]
Generation of such revenues places the Navy Resale
System in the category of "big business." As such an opera-
tion, it should follow the precepts of sound management and
proper accounting.
B. NEED FOR A STUDY OF THE NAVY RESALE SYSTEM FINANCIAL
OPERATING STATEMENTS
For management and fiscal control information, the exec-
utives of the Navy Resale System rely on operating and
10


financial reports provided by the Navy Resale and Services
Support Office. These operating and financial reports must
contain data which is accurate, clear, and concise.
The Commander of the Navy Resale and Service Support
Office has expressed concern that there may be a lack of
properly presented financial management information
available to the Navy Resale System and has requested that
this study be undertaken. [Ref. 2]
C. OBJECTIVE AND SCOPE OF THE THESIS
The objective of this thesis is to determine what opera-
ting and financial information should be made available to
headquarters, region, main, and branch levels of the Navy
Resale System to properly manage the local sales activities.
The scope of this thesis is limited to a review of Navy
Resale System reports and to provide recommendations for
their improvement. It is beyond the scope of this thesis to
provide an economic analysis of such recommendations or
implementation procedures.
This thesis introduces general retail accounting and
reporting standards as provided in the National Retail
Merchants Association, Retail Accounting Manual . Based on
an analysis of current literature common weaknesses and ways
of improving the effectiveness of management reports are
described. This information is provided to not only make
improvements in what information should be provided but also
11

to explain how the information should be provided to
encourage its use. The thesis reviews current retail opera-
ting and financial reports provided by major companies
within the retailing industry to determine to what extent
the retailing industry follows the Retail Accounting Manual .
D. METHOD OF RESEARCH
A review of the literature that was available from the
following data bases was completed:
1 . Defense Logistics Studies Information Exchange, U . S.
Army Logistics Management Center, Fort Lee, Virginia.
2 . Defense Technical Information Center and DefenseDocumentation Center, Defense Logistics Agency,Cameron Station, Alexandria, Virginia.
3. The Naval Postgraduate School Thesis, TechnicalReports, and General Collections, Monterey, California
4. DIALOG Information Retrieval Service, Lockheed Missleand Space Co., Inc., Palo Alto, California.
Letters were sent to the top twenty retailers, in sales
volume, as listed by Standard and Poors, November 1981
edition of Industry Surveys and to the Army and Air Force
Exchange Service in an attempt to obtain operating and
financial reports representative of the major retailers.
Responses were received from nine of the retailers including
the Army and Air Force Exchange Service. Of those nine, six
retailers supplied various operating and financial
accounting reports.
Interviews were conducted with twelve executive level
personnel at the Navy Resale and Services Support Office and
12


seven executive level personnel at the region and exchange
level
.
E. THESIS ORGANIZATION
The first chapter briefly introduced the magnitude of
the Navy Exchange System and presented the impetus for the
research. It also delineated the author's objectives and
research methodology.
Chapter Two provides the reader with an introduction to
retail accounting and the reports currently suggested by the
National Retail Merchants Association. It also provides
techniques to improve the effectiveness of management
reports as well as common weaknesses of management reports.
Chapter Three provides a description and discussion of
operating and financial reports used by the private and
public sector.
Chapter Four provides a description and discussion of
operating and financial reports used by the Navy Resale
System .
Finally, in Chapter Five, the author makes comparisons
between the National Retail Merchants Association, private,
public, and Navy Resale System reports. Conclusions and
recommendations are then drawn based on the comparisons and
the retail accounting standards provided in the Retail
Accounting Manual .
13

II . RETAIL ACCOUNTING AND REPORTING
A. INTRODUCTION
This chapter describes the various aspects of retail
accounting in accordance with today's generally accepted
procedures and norms. The topics covered are merchandise
accounting, expense accounting, management reporting, and
the improvement of management reports. The Merchandise
Accounting section defines the various types of departments
in retail stores and the computation of gross margin for
these departments. The Expense Accounting section describes
the recommended method of segregating expenses for expense
control. The Management Reporting section provides the
rationale for various management reports and suggested
formats for each type report. In the section on improving
management reports, techniques for improving reports are
described and some of the major weaknesses in current
reports are delineated.
B. MERCHANDISE ACCOUNTING
1 . Departments Within Retail Stores
As defined by the National Retail Merchants
Association (NRMA) in their Retail Accounting Manual (RAM)
departmentalized stores are organized in a series of
departments "for the purpose of maximizing efficiency and
14

control in either selling merchandise or rendering serv-
ices." Departments differ in the nature of an item or
service sold, the method of inventory valuation, and their
relation to other departments. The NRMA has defined six
principal types of departments as follows:
a. Retail Inventory Departments
Retail inventory departments "sell merchandise
to the public, using the retail inventory method of account-
ing to determine departmental inventories at retail and at
cost, and to compute [owned retail] gross margin." (Owned
retail gross margin refers to the gross margin of depart-
ments which are owned by the store versus the gross margin
of leased or licensed departments.) Basic merchandise such
as hardware, fashion goods, linens, stationery, jewelry,
notions, housewares, and luggage, as well as other typical
department store merchandise are usually sold in retail
inventory departments.
b. Cost or Non-Retail Selling Departments
Cost or non-retail selling departments, other-
wise known as service departments, carry inventory on hand
at cost only, versus cost and retail. Typical cost selling
departments are beauty salons, flower shops, custom order
departments, gift wrapping, repair departments, restaurants,
and engraving. Inventory in these departments consists of
15


supplies necessary to perform the service involved; not
finished goods for resale.
c
.
Contract Departments
Contract departments sell merchandise at whole-
sale prices to business and institutional purchasers such as
hotels, restaurants, hospitals, and churches. The orders
placed by these businesses are normally very large, there-
fore, prices charged are considerably lower than the normal
retail prices charged for the same items to a store's
regular customers. Items normally sold in this manner are
furniture, linens and domestics, and china and glassware.
d. Leased or Licensed Departments
Leased Departments are merchandise or service
departments operated by independent companies under contract
or lease. Usually these departments are highly specialized
in nature or require a heavy investment in equipment which
the store does not desire to make. Examples of these
departments might be shoe or shoe repair, auto repair,
vending, beauty salons, photo studios, pharmacies, and opti-
cal shops. In return for the permission to operate such a
department the independent firm pays a fixed percentage of
their sales to the lessor store. Normally, a leased depart-
ment follows the store policies and procedures and is
presented to the patron as if it were just another part of
the store.
16


e
.
Workrooms
Workrooms are departments that ordinarily deal
with alterations and repair of merchandise sold in retail
departments. However, workrooms also set-up, assemble, and
finish merchandise before it is put on sale. Because there
is a similarity between workrooms and cost selling depart-
ments, guides were established by the NRMA as an aid to
proper classification. The NRMA guide states that:
A department should be considered a merchandise
service workroom if:
1. its operations and income are substantially involvedwith services performed for the principal retaildepartment(s)
;
2. its revenue is used only as an offset against theworkroom's cost, and is not included in the principalretail department's sales;
3. the amount charged for services performed is suffi-cient to enable the workroom to operate at or near thebreak-even point; and
4. it neither manufactures an item nor, in effect, con-verts merchandise into a finished product.
The more common types of workrooms are drapery,
engraving-glassware and stationery, furniture, men's and
boy's clothing alterations, and monogramming workrooms.
f. Miscellaneous Revenue Operations
Miscellaneous revenue operations consist of
various services which stores furnish at a nominal charge to
patrons. Some of these services are delivery and layaway
17


charges, check cashing, money order sales, pay toilets, and
scales. [Ref. 3: pp. VI - V 4
]
2 . Computa t ion o f Gross Margin
The NRMA has suggested that the various departments'
gross margin be split into three major groups, Owned Retail
Departments, Owned Cost Departments (including Contract),
and Leased and Licensed Departments instead of grouping them
into one total amount.
In general, gross margin for owned departments is
derived by subtracting from net sales the net cost of mer-
chandise sold, workroom loss or gain, and other costs of
sales. The detailed method for computation of gross margin
for owned retail and cost departments, as provided by the
RAM, are described in Appendix A.
Leased or licensed departments differ from an owned
department in that its merchandise does not, per se, have a
merchandise cost or a gross margin. Instead, reported gross
margin for these departments is the net sales less the gross
commission. The RAM states,
For development of departmental operating statements,leased department commissions are considered as part ofgross margin. In the development of financial statements,leased department sales and commissions are shown sepa-rately from owned departments. [Ref. 3: pp. V13-V15]
C. EXPENSE ACCOUNTING
Expense accounting improves profitability through the
control of operating expenses. This is done by accumulating


operating expenses into expense centers and then holding the
center's management responsible for controlling expenses by
comparing actual to budgeted and prior years' figures.
The NRMA's Retail Accounting Manual (RAM) describes in
detail how expenses should be recorded and reported. This
section discusses the basic concepts of expense recording
and reporting. A detailed presentation of expense recording
is provided in APPENDIX B.
1 . Expense Centers
For the RAM to serve the needs of not only large
store chains but also small, one man operations, 10 expense
summaries were created, with 44 expense centers and 22
subexpense centers. The smaller operations need only use
the 10 expense summaries that follow:
010 Property and equipment
100 Company management
200 Accounting and management information
300 Credit and accounts receivable
400 Sales promotion
500 Services and operations
600 Personnel
700 Merchandise
800 Selling and supporting services
900 Merchandising
A company may use as many of the 44 expense centers
as they. desire to provide needed expense breakdown. Some of
19


the largest companies may even find it preferable to add
more expense centers. An example of the breakdown possible
is shown below using expense center 800, selling and sup-
porting services:
800 Selling and Supporting Services
810 Selling Supervision
820 Direct Selling
830 Customer Services
840 Selling Support Services
860 Central Wrapping and Packing
880 Delivery
If all the expense centers are not used, the NRMA
has suggested the management expense centers ending with
"10" be used to accumulate items of expense for unused
expense centers. Using the expense summary above, a firm
might want to use the expense center 820-Direct Selling and
then accumulate all other expenses in expense center 810-
Selling Supervision.
An even more detailed breakdown can be made using
subexpense centers. The 820-Direct Selling expense center
can be divided into the following subexpense centers:
820 Direct Selling
821 Retail Selling Departments Salespeople
823 Interior Decorators
824 Cost Selling Departments Salespeople
20


826 Floor Cashiers and Wrappers
828 Forward Stock Maintenance
2 . Natural Divisions
The RAM classifies 17 types of expenses which they
identify as natural divisions besides accumulating the
expenses by areas of activity. Some of the largest firms
may desire to add more natural divisions, however the 17
natural divisions that follow should be sufficient for most
firms:
01 Payroll
03 Media Costs
04 Taxes
06 Supplies
07 Services purchased
08 Unclassified
09 Travel
10 Communications
11 Pensions
12 Insurance
13 Depreciation
14 Professional services
16 Bad debts
17 Equipment rentals
18 Outside maintenance and equipment service contracts
20 Real property rentals
92 Credits and outside revenues
21

Additionally, three transfer accounts are identified
by the RAM as an aid to transferring expenses between
expense centers:
02 Allocated fringe benefits
90 Expense transfers-in
91 Expense transfers-out [Ref. 3: pp. II 1 — 1 1 1 5]
The allocated fringe benefits transfer account ( A c c t # 02)
is used to redistribute actual expenses accumulated in
Expense Center 660- Medical and Other Employee Services and
Expense Center 670- Supplementary Benefits to all other
expense centers having a natural payroll division. The
remaining transfer accounts (Acct # 90 and 91) are needed
to effect a transfer from one expense center to another in
order to properly reflect the actual operating costs of the
expense centers; the amount to be transferred out of an
expense center is the composite of several natural
divisions .
3 . Expense Comparisons
Why is there a need for expense centers if all
expenses are also tracked by natural division? The National
Retail Merchants Association states,
Because of the increasingly diversified manner in whichstores are performing identical activities, comparisons by
natural divisions are becoming more meaningful as thevalid basis for such comparison. This comes about princi-pally because with mechanization and the use of moresophisticated equipment, the number of people and the
resulting payroll expense are reduced, while the amount of
depreciation and equipment rental cost is increased. In
22

other instances, greater reliance on outside servicebureaus and service agencies are similarly replacing pay-roll and supply expense in the expense center concerned.Therefore, comparability by natural division diminishes,although comparability by expense center remains signifi-cant and valid. [Ref. 3: p. 11-10]
D. MANAGEMENT REPORTING
This section describes management reports that are sug-
gested as necessary by the National Retail Merchants
Association (NRMA). Included are the various retail mer-
chandise departments reports, cost or non-retail operation
departments reports, expense reports, branch store reports,
and top executive level reports.
1 . Merchandise Department Performance Statistics
a. Merchandise Department Statistics
Merchandise department statistics are developed
on owned retail inventoried merchandise as a means to
measure a department buyer's performance. Through the review
of a merchandise department's total company performance and
other direct expenses over which a buyer has control manage-
ment may evaluate a buyer's performance.
The NRMA has stated,
Departmental expense distribution is a matter in
which considerable latitude must be allowed. Hard and fastrules cannot be applied. The distribution of expenses to
selling departments poses problems on which many differingviews are held.
In general there are two approaches to depart-
mental expense accounting; the Net Profit Plan and the
Contribution Plan.
23


The Net Profit approach is a full cost approach
which requires the allocation of indirect expenses in addi-
tion to direct expenses. The supporters of this method
believe that it produces a profit figure that can be used to
judge the operations of the department and that it develops
some degree of responsibility by the buyer for the depart-
ments profit performance. The Net Profit approach has cer-
tain disadvantages. First, the buyer is not in a position
to have any affect on the expenses pro-rated to his or her
department. Second, it is difficult to develop a reasonable
or meaningful basis for proration which usually leads to the
use of sales as the proration base and the subsequent con-
cealment of the department's true performance picture.
Third, the allocation of expenses can be both costly and
time-consuming. Finally, most expense control is the
responsibility of operating and sales supporting activities,
not the selling department.
The Contribution approach, on the other hand,
accommodates both the measurement of department results and
evaluation of a buyer's performance without the disadvan-
tages above. The contribution approach is based on the
concept that each selling department generates a gross mar-
gin on its sales as well as related direct expenses. The
difference between these direct expenses and the gross mar-
gin produces the contribution. The RAM states, that
24


expenses used in figuring contribution are different
depending on whether you are computing a selling locations
contribution or a total company contribution. This
difference is caused by the expansion from single store to
multi-store organizations. In the single store operation the
department buyer is responsible for all departmental
expenses including those related to acquisition, distribu-
tion, promotion, and selling of merchandise. In the multi-
store organizations the sales manager is responsible for
selling location expenses while buyers are held responsible
for acquisition, distribution, and promotion of merchandise
as well as other expenses that are performed on a central
basis and cannot be associated with a single selling loca-
tion. Expenses which cannot be associated with a single
selling location cause the difference between the summation
of all selling location contributions and the total
company's contribution.
b. Merchandise Department Performance Reports
Merchandise department reporting differs for
multi-store operations as compared to single store compa-
nies, since both the selling location and central organiza-
tion expenses are accounted for separately. This results in
the need for two merchandise department reports, one for the
total company and another for the selling locations. The
NRMA suggested reports may be seen in Exhibits 2-1 and 2-2.
Though these are only suggested formats, the information
25


o£
in ra
-l>-
E<
UJH<9 c
(0
51
3n
o
EC<ID>
£<
5?
•" Is
C m
E<
zoI-
m
zoo>z<0.
soo_l
<I-
oHI-zUJ
h-cc
<aUJ
o
3?
in co
E<
a5?
oDCUJCl-
cCTJ
a.
F<
5?
• Is
E<
C3 -
03 .ora °^1/3 m« 5
§1
|S«oaj a> EQ
a ow
^ CD 0J O u
2c/)z - z ^
i° s ° °; o ^ o
Cost-
ito
Nge-%
count °i ros?
«tf> c
B », « W(J O
E «
8<3
wm in r oSCO ca
5»00!5c a ^ £"Jo u f <5
fj ro O 3 ofj c3
2I^a 50
zO en— cu
0> 03ro •-
to o
1 2in
*-
oj O j5«" J.
Z EJ. w5- <nn" 0) O O-—_Z"5-rS 2 w *? >< .0 O ojrf„« °^ 2 Q-_
ra- vp 2 -^
-52 i°- =1 z «3"J£ 2'5£QOl-ZO
oo
J Dl
L0 <ro ift
0)
co
EC crVa
0) W(Jto c 10 -
5i
n C >
a>< ?
o c(/>
ro oto
o 0) OP55 a
zoHH»PQHPi
HZou!h
Z<
soo
<HOHHZWsHPi
<Ph
wQ
I
1-1
wXw
26


UJ
>mzor-
amtrh-Zooh-ZUJ
2r-or<o.UJ
o
Gross Margin%lo
Sales
s5
1<
Workroom
and
Other
Cost
ol
Sales
%to
Sales
J?
E<
StockShortage
%to
Sales
5?
<
c
«5
*
E<
Merchandise Cost
Incl.
disc
%to
Sales
s?
E<
S 5
1 1
g?
E<
Returns %lo
Gross Sales
3?
E<
11OB)
j?
E<
>- -i >t— 1 M5 1-0. -J
> -J >h-B. -i 1— Q. _J t-Q._l
r*--J>f- 1
> -l>-H- 1
>- _1>(-0.-J
> —1>1— Q. _l
</>i-0 r lu
zoHH<Coor-J
ozHhJwCO
><pa
zoI—
I
HpaH
HZooHZW
Hoi
<!Oh
WPCN
I
CM
HHpa
H33
W
27


zof-<uo-J
oz
UJ</>
>-
CD
zo
3CO
zoor-zUJ
rx<aUJa
ai
Gross Margin Dollars Per
Sq
Foot
E<
tn u.
S rr
w"5
E<
13O
Sales
%of
Common Base35
0.
Dept. Contnb. %to
Sales
s
E<
Other
Direct
&
AssignedExpenses
%to
Sales
S*
E<
Sales Promotion %to
Sales
^p
E<
DeptSupplies
%to
Sales
j?
E<
Salespeople
Payroll
%to
Sales
s?
E<
Department Supervision
%to
Sales
5? V
E<
c
E> -i>I-Q--I
> _l>1— 1 i— a i
>- -i >1-0.-1
> -i>I-Q.-J
> -1 >h-a._i
> -i>h-CL-J 1— Q 1
9a int-CDCClu
53oH
<iUO
o53HhJkJ
w
PQ
53oH
5=>
PQ
HPS
HOCJ
HWSH<PmwQCN
I
pa
HX!W
28


provided is considered the minimum necessary for proper
evaluation of a departments gross margin performance.
In producing a total company contribution figure
the Depar tment Total Company Con tribution report, Exhibit 2-
1 , uses only direct expense items which are easily
obtainable and relatively meaningful on a total company
basis: merchandising and buying costs, and advertising media
costs. Other costs, such as merchandise distribution
expense, can be added to the report if a company feels the
added costs of computations are worthwhile and necessary in
measuring company and buyer performance. The more expenses
allocated to a department, the closer the report approaches
the net profit or full cost approach.
The Department Con tribution By Selling Location
report, Exhibit 2-2, uses direct selling expenses that are
related to a selling location such as selling payroll and
supplies. In addition there are other valuable departmental
statistics which can be used in evaluating a department's
performance by selling location. Two of these, sales per
square foot and gross margin dollars per square foot are
shown on Exhibit 2-2. [Ref. 3: pp. VII 1-3]
2 . Cost or Non-Retail Operation Reports
In the previous section the discussion covered
merchandise departments that are controlled by the retail
inventory method. Departments that are normally considered
29


cost or non-retail departments are not suited to the use of
the retail inventory method, since they do not have invento-
ries or purchases at retail and are not concerned with
markons (markon is the increase in price between cost and
retail used to cover direct expenses, overhead, and generate
a profit) as an element of recordkeeping. In addition these
departments usually do not have problems of markdowns
(markdown is the reduction of a retail price to enhance
movement of an item) and shortages as separate elements in
the determination of gross margin. Though the derivation of
cost of sales for the various cost departments is similar
in principle to retail departments, the elements of cost are
usually very different.
For the above reasons, and because it would not be
appropriate to allocate expenses such as buying and mer-
chandise management, separate operating statements should be
prepared for cost or non-retail operations which are inde-
pendent of any other department. [Ref. 3: p. VI-1] However,
the NRMA has stated that, sales of cost selling departments
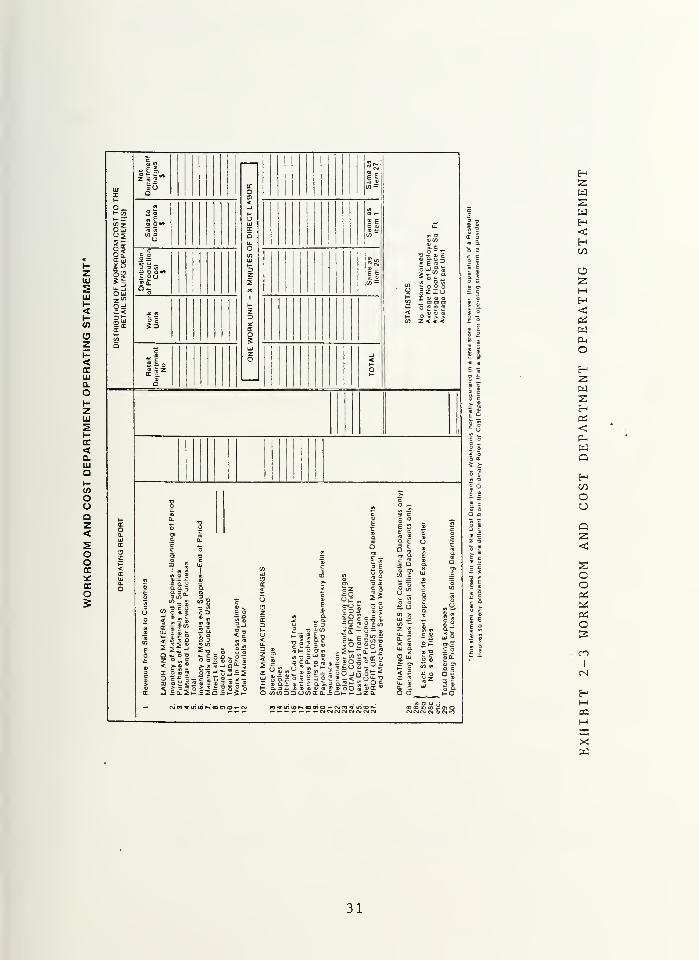
should be included in total store sales. The NRMA suggests
the use of Exhibit 2-3 for any of the cost departments or
workrooms normally operated in conjunction with retail
stores. A detailed explanation of the items in the operating
statement can be seen in Appendix C.
30

zUJ
<I-
oZr-<ccHIa.
OI-zUJ
5tr<Q.UJaI-C/5
ooaz<
oorx
en
O5
UJ
z
o_
S5
IS£°j
£ Q
|Ioui
g Bl
OdP <
isccr~
a
Net Department
ChargesS
I
CC
Om<-j
t-urx
ou.
o
UJ
DZ2X
zDXco5UJzO
53
§|OS—
STATISTICS
No
ot
Hours
Worked
Averaqe
No
of
Employees
Average
Floor
Space
in
Sq
Ft.
Average
Cost
per
Unit
Sales
to
Customers
01
IIto
Distribution
of
Production
CostS'itit/j —
II
c— B3|d
BD
<ot-
rx
Oa.
cc
az
<cc
a.
o
1
1
1 1
1.
Revenue
from
Sales
to
Customers
LABOR
AND
MATERIALS
2.
Inventory
of
Materials
and
Supplies—
Beginning
of
Period
3.
Purchases
of
Materials
and
Supplies
4.
Material
and
Labor
Services
Purchases
5
Total
6
Inventory
of
Malorlals
and
Supplies
—
End
ol
Period
7.
Materials
and
Supplies
Used
o
I
J —
>l
o o 10
Total
Labor
11
Work
In
Process
Ad|ustment
12
Total
Materials
and
Labor
OTHER
MANUFACTURING
CHARGES
13
Space
Charge
14
Supplies
IS.
Utilities
16
Use
ot
Cars
and
Trucks
17
Carfare
and
Travel
18
Services
Purchased
19
Repairs
lo
Equipment
20
Payroll
Taxes
and
Supplementary
Benefits
21
Insurance
22
Depreciation
23
Total
Other
Manufacturing
Charges
24.
TOTAL
COST
OF
PRODUCTION
25
Less
Credits
from
Transfers
26
Net
Cost
of
ProOuction
27.
PROFIT
OR
LOSS
(Indirect
Manufacturing
Departments
and
Merchandise
Service
Workroomsl
OPERATING
EXPENSES
(lor
Cost
Selling
Departments
only)
28
Operating
Expenses
(for
Cost
Selling
Departments
only)
26a
128b
I
Each
Store
to
Insert
appropriate
Expense
Cenler
28c
1
No
s
and
Titles
etc
)29
Total
Operating
Expenses
30
Operating
Profit
or
Loss
(Cost
Selling
Departments)
l s.
t o
T °
6 s
Is
5 Is t
I °E 5
I I
I 6
6 2
HBSWXwH<HCO
OHH<wPhoHWs
<P-WoHCO
OCJ
Qz<XooOS
PS
o
mi
CN
HMCQHBS
XW
31

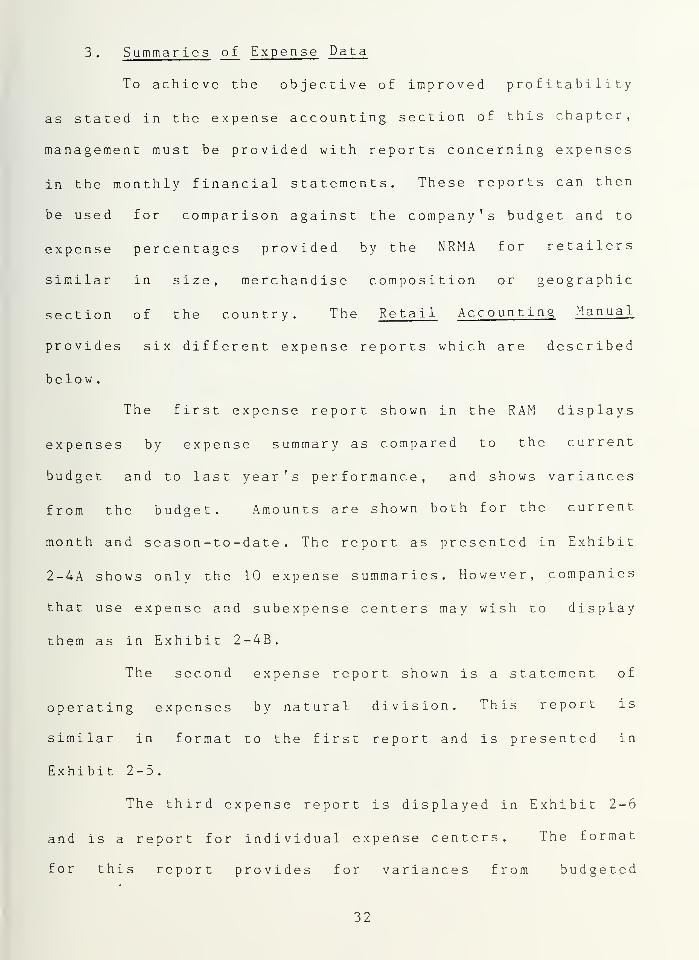
3 . Summar ies of Expense Data
To achieve the objective of improved profitability
as stated in the expense accounting section of this chapter,
management must be provided with reports concerning expenses
in the monthly financial statements. These reports can then
be used for comparison against the company's budget and to
expense percentages provided by the NRMA for retailers
similar in size, merchandise composition or geographic
section of the country. The Retail Accounting Manual
provides six different expense reports which are described
below.
The first expense report shown in the RAM displays
expenses by expense summary as compared to the current
budget and to last year's performance, and shows variances
from the budget. Amounts are shown both for the current
month and season-to-date. The report as presented in Exhibit
2-4A shows only the 10 expense summaries. However, companies
that use expense and subexpense centers may wish to display
them as in Exhibit 2-4B.
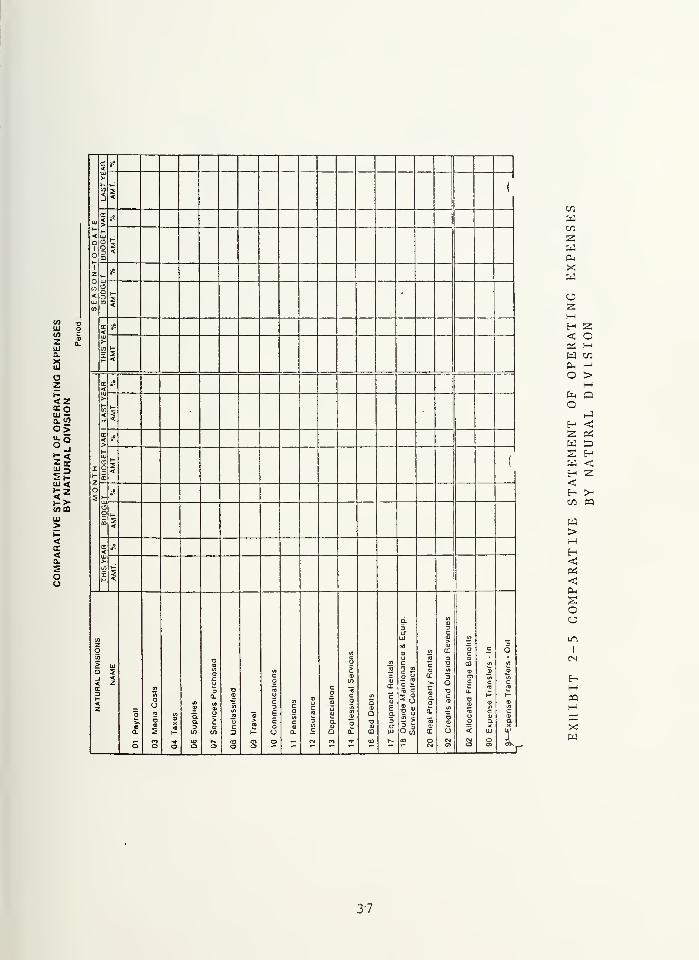
The second expense report shown is a statement of
operating expenses by natural division. This report is
similar in format to the first report and is presented in
Exhi bit 2-5 .
The third expense report is displayed in Exhibit 2-6
and is a report for individual expense centers. The format
for this report provides for variances from budgeted
32


05
z>->
'
CO111
co
zLUaxuj eg
LL
CEHI
OS"U.3 >qCO CD
. ui ai7« CO
Sis
was uj
UJ>i-<(X
<a5oo
coUJ
aaCO
IT<LU>
5
s8
<
UJ
<Q
O
a.
<>h-jj
aoCD
5°
2<
Zo
<UI
CO
cu3
Q
CO
,".
r—
<
DC<UJ>
Xl-
3*
5<
X
2o5
cr
<:jj
>
t/)
<J
*
<
<>
UJ
aa3CD
c»
i-
<
h-UJ
C3QCD
„»
i-
<
cr<LU
>(0
z
3!
<
zO uj
< z
CO UJ
3oo
LU
s<z
ca)
Ea
crLU
•ac<o
>.r»a.
at
cn>
S<u
O)CO
cCO
>.cCO
a.
E
O
dc
cCO
ECO
o>CO
cCO
5
cCO
o>c
c3
u<
C\J
OCO>
OCO
I(I)
c13
<0cCO
•5CD
6
c
E
li-
enCD
CO
CO
O
c
ra
CBa.
OocCO
CDU
z<a
CO
in
o>ccV)
CO
Q_
OOCO
. CO)
II= a° Tl.2 c"D a]
« ft•= S
1
O CO
oj
5 co
encCaQ.
CO
TJcCO t/»
°> 8c -L= ><jj CD
CO CO
ao
ctrt
0cCO
J=
5
s1
m
LUCOzLUQ-XLU
—1<h-O1-
on
Pd00
WPL,
XWoS3HHPS PS
wPm
opn
o
S3
WUj
2W W£ Ph
W XH W<OT PO
W>HH<CPS
<P-
£OO<i
CM
HHpa
Hsaxw
3 3


enUJenzUJ
£«UJUJ
OZZ uj
EC 3
Ozu.<Oct
£Suj Z5 uj
l-UJ< co
UJ Q.
> X
**£CC CD
<Q.
5OO
UJ
1-
<
O
o1-
z
o
<
UJ
trt
<UJ>t-
if"
<>
UJ
OQ3CD
2<
1-UJ
aaCO
i:
<
DC<>
r
°
<
I
i-
z
o
2
<
>
<
o'
5<
DC
<>1-UJ
<3aU
»°
2<
1-UJ
aQD
°°
1-
5<
OC
<UJ>•
to
I1-
i°
2
zO ai
< z(J UJ
y") uj
5oo
Ul
2<z
cCD
£a5CJUJ
DCo>•CCD
CLoCL
oo
a5CTUJ
m*3
CJ.
T3
CD
cd"
s
UJ
15
a:
orgO
dC7UJ
d»aCD
Co
71
D3
ii
a
c
5u.
ono
cIt
£0)
enac
S>c•n
a.EooQo
XI
u
5<t>
3u©u-
a
CD
EsCTa
a
Cuc
CD
a
3<
C
c
Q
-.1
>
<oc3CoOofl
<3aiQ-j
oa-)
co
E
ac
cai
ECD
O)ac
C>c
c
ou<aoCM
a»
ou<'cCD
O
E -
252 —
!«ooCM
63<
CO
aCMT\J
CD
aco
nj
a.
c3ouo<oCTCM
CD
Qo>caED
CDJC
E
a
DO
0.
o-T
atc
uU
u
aQOCDCM
5CO>s'J
D
c3Ou<*3
u
5o5en
c9ED0)nc<o
fi
aoc*i
c
u«oOooct
5oEEfl
^5
.aCO>s
CD
CE
C3Ou<oC-i
CDO
5JC
Ooilln
a
5
a
cunj
CO
o
cg3Eo
C/>
oo
c
ECD
o>(fl
c
co
oEoa.
a>
CO
E/3
o**
Olc
>•a
<oTJ
a.COaS
z
OJ
5cc
in
>KcOCM
u
d
CMT
a>c
1<
CD
oTJCMT
T3CD
C
COo
C/J
WC/j
WX!pa
CJ22HH<JOS
wHWa«
W cn
O QZ<c
Pi
WHW
w u< wH c/j
en Zw
W PU
> XH WHpi pa
<Ph
oCJ
P3<!
I
CN
Hi—
i
pqHaxw
34


LU
wzUJ
LU UJ
OzZUJ
<E°EC 3uj w
Ozu.<ObKUJ
Sz•>luUjOi-UJ< I/)HZ</>LULU CL>xpui
tr co
<a.
5oo
UJ
>-
<
o
o1-
z
o
<
UJ
in
<UJ>
'.1
5
°°
5
tr
<>
UJ
aari
m
X
_
5
~
UJ
aDCD
°°
-
<
rr<r
>-
c/)
I
°*
2
I
t-
z
o
2
tr
<LU>-
I-co
5
o*
s<
cr<>t-LU
co3a
°
s<
(
Oc3
*
2<
<Uj>
v-
*°
5<
zO UJ
P BI< zo uj
&SCO UJ<fl 11
5oo
2<z
5cUJ
ac
IfIT
JJ
u0.
'J)
4
cIf)
a
co
5Io
3Q_
1a
CO
(D
c-c
oa>
2
n
Dr:
UJ
acTj
CB>UJ
atfl -a
Q.
6oT
Co
5O5a
<a
a
6
aa
ccr
W«»
3
Co
a
"OcIS
s
s
coEaai
c
1co
BaOr>cAo
>
to
otf-j
5
•.o
oP3
CQ
E3E<E
o
qc-o
BCacau3
o5o
atc
aBa
DOXo
a.0)
ex
oc(0
«c
cB
c
2oX'
ucco
D
8
c
E9CTfl>
C
cco
CU
£o
c
E:>
a£UJ
oCM
=c
o'-O
>
CO
©a
EUJ
—
t:
'V
5•j
2a
cDCD
£
c
1Baa
O
so>
o07
cic>
* -9
il
s
S
©
o03
>o©cr
V
T3
o —
or*
o
C
2ac
C
iu
Btx
o
ac
QC
c
£OCM
c «
*!:
r0]
o
o
>C
c
aen
C
o5
a
>
OS
XoPI
go
c
Co'J
I
ct:
wwSSw.Oi
Xw &W
o H2 ZH uf- U< CQ
CKi 3w t/J
Pho Q2
u. <o
Ci
H W2 HPd z.
32 UJ
W uc^-
< wH Cfi
W z:
wW Pu> XM wH< PHCi =3
<p-
*c_.
OCJ>
pq<r
<>j
CO
M
35


(/>
LUIf)
ZUJ
OzZ LU
PSCC 3LU W
Ozu. <Ol(-UJ
UjZs wLu oi-iu< c/>
t-zwShi &>x
<a5OO
IU
1-
<
a
o
Z
oto
<
UJ
to
re
<>-
en<
."
H
<
<>HLU
'J
QDa
o?
<
oa3m
°°
5<
IT
<>(A
zt-
*
<
I
i-
z
o
2
<LU>
<_J
je
2<
<>
LU
ao3
*
2<
oQm
j5
<
DC
<LU>-
03
XH
o°
1
*
zO alc to<zo UJ
C/J UJ
o
UJ
S<z
E-p
Cfl
a>c
6aaa3en
ac
Kgo
co
>
a3(/]
C?C
i
o£1
c
S
6o
UCIaataB
(A
5aac
ai
CO
5X
CM
osa
9CC
gc
Bt
«aaex
up
a.aa01c
w
ou-r
oa
5
c
£
ucc
cfi
tc
oc
cuc
I
u.
CO
>
Eo
uoi
D
E
_n
aaa3
(/)
ac
a(0
o00
c
tti
a.
oc
ca,aca
5
c<o
Ua3
a
Qas
ncrBO
CL
x
303
ac
t
c
LL
PI
30.
CL
c
eu
a
UJ
gi
Lb
i£
CD
|6c
jZ
3J
oo9
cCD
ECD
ai
c
2oc
6c
jC
2
oen
ac53iD
aa
o
coU<X>
c
cen0>
UJCOzUJCLXUJ
<O
en
wC/3
WPhXmo5ZHEH<Pi
pet
WH5Swupa
W CO
p-l
o o
<Pi
wH
Cmo
Hz
S3
H< WH Wen 2W
W PU> XH W<PS
<Pi
Soo
i
CN
COMSBXIw
36

HI10za
z>-
<zceoUJ —
o>
*£
UJ <
toco
ui>t-<cc<a2oo
cr,0
1<
> 1
f~ H (05 > \
a <
BT<>
*
<
a C32
T;
<
zO
1-f.
u< DO 5
(1)
rr *<
>\-
i
rr.
>
tn s.j <
cr -«j
>
I c
m
2<
(
ZO ^S
QaCD 3<
c ,<
>
d ©3 3a- C
CO 111 >" —
z<yi « en CC O
CO
mat
c
u n> UJ
a 2_j << z
c£CD
to
10
nj
Caa:
cVEa
c
is5 c
is
ca>
cr
>•
5
3O
C3
CO
c3c
5C
0:
<Z
CD
X
3Q.
(A
a
•0©
to cp
uc3E
crt
cCD
Uc
cg
0)
"5
c (A
B
ca>a.
i
DC©IA
5
©
u
CD
C
CO(/J
cCO
T3 a ? > b 3 a 0 3 i2 > A a ac <u a ^ » CO X
0. & 1- to to 13 f- O Q_ — O £ CD UJ U co X O 1'
,_ en ^ <D r*. «_ cm en T X 1 r*. CO CM4.O O O O UJ
r
en
Wen
Zw
Xw
o
S3O<
CtC HW cn
P-, ho >
o
HW
Pi
H<2H
<lo pa
W>1-1
<OS
<P-.
ooun
I
CN
paH
x;w
37


»-cc
oaUJDC
CCUJr-zUJ
oUJto
zUJaXUJ
LUO *
oiri
Q Z<
~-~
Occ
Zcc 3UJa.
<> m to N >o en oO (D o CO CO <n r^ CO
O o ;**_,*-* ""^ ""* ^"" CO
5 C- c
LU
< <A wj
HQO
<Q
Ul
QCO
in CO o u-) m o ,_
6 in in CD en m O)
ccLU
in
CO
CO CM t r" r»co'
°- OCO o= o
CC<LU
<a w»
I - >t- •"
CO1-
z3 _l o CM ,_ CM T_ in N.
< CM CD CO f» CM
ID CO r- co * *~ CD o"1-O c»
t- s <— T3Z a3 5
£ 1co"CO
> <u LU tf~ CO
P E O ^< a.
z<cc 1-
< Z O oto
cd CD
j2CM m
CMo>CM> 3 COO
2 (A </»
Ol a <ca
oCC
NSE
CENTER
roll
&
Timekee
Department
LUD-
1- O CO o o o O tot- 111 in en o en tn Ul COH o CO CM *~ *™ CM *~
LUCCtr
QCO
cm"M co'
(A
3o
LU >•
£ o-
UJ_l o CO T CO CM CO in
<1-o
CO CO CO CO a> r-- COo CDCm"cy»
CM CM mco"
<
O cflto
v) a)
1 °CD
C C2 ~> CD aCL z CO CD to
o?x o
COUJ-11-
CD
o>c
CO
cu
£In
CO
<>Q
<
u.
aCD
COCD
50-
CO
oCD
to
CD
oXCD
CC
<
O><
^0
aQ.a.
CJ
>£3
ocCD
a.
o> CD to
0. <3CO
5CO
cCD
XLU
o CD
oO z
"co .^
cCO o
ob ,_ CM to h- co o
o z o O o o o en
HPSOOh
wOS
PiwHWUwen
S3wP*Xw
I
CM
4J
•H
•H,C
W
3"8

expenses and may be made for a single selling location or
aggregated for the firm as a whole.
The fourth expense report deals with expense center
productivity and is shown in Exhibit 2-7. This report
deals not only with expenses by natural division for an
expense center, but also with production measurement in the
form of productive hours consumed, average hourly production
pay rates, relative work loads, total dollars expended, and
other factors entering into the analysis of an expense
center. However, it must be understood that not all expense
centers can use productivity measurement techniques. For
example it would be difficult to establish a productivity
measurement for the Property and Equipment, the Company
Management , and the Sales Promotion expense centers, since
it would be difficult to define a transaction in relation to
these expense centers. However, it is easy to define trans-
actions in the Accounting and Management Information (bills
paid), Credit and Accounts Receivable (accounts collected),
and Personnel Expense Centers (personnel hired or trained).
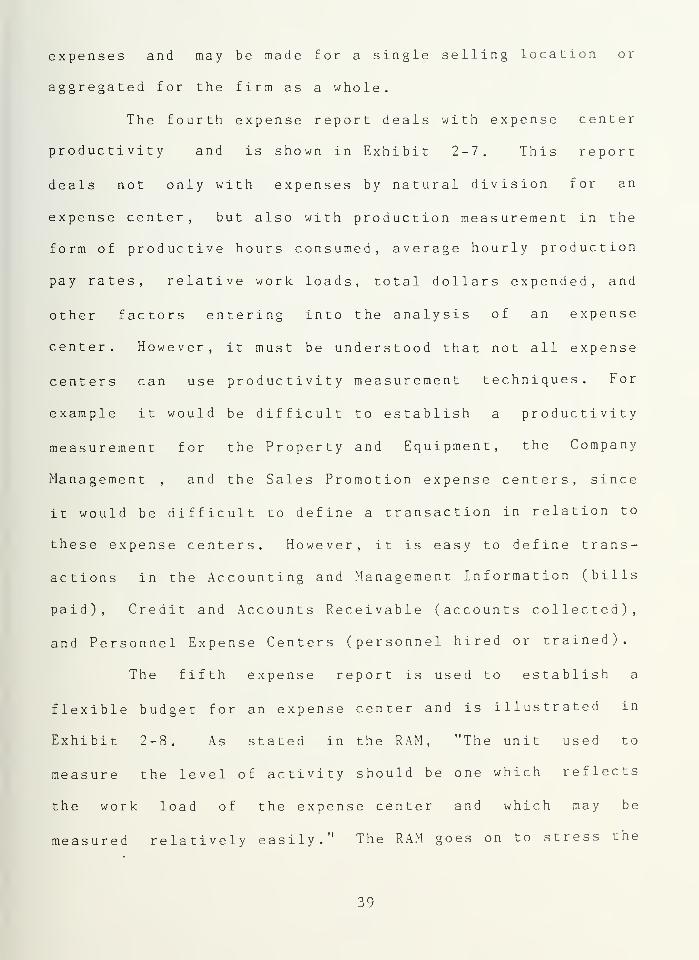
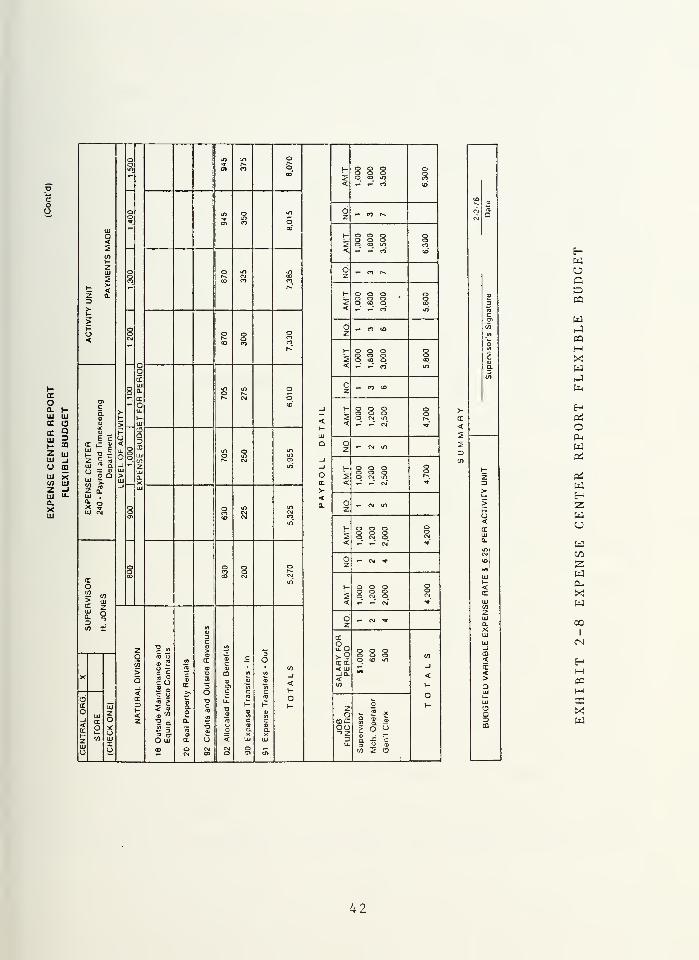
The fifth expense report is used to establish a
flexible budget for an expense center and is illustrated in
Exhibit 2-8. As stated in the RAM, "The unit used to
measure the level of activity should be one which reflects
the work load of the expense center and which may be
measured relatively easily." The RAM goes on to stress the
39


I-cc
oQ.UJ
cc
>
OZ>Qoa.a.
0CUlI-zLU
oUJV)zUJaxUJ
acCOuto
P<j-
co»-to
O(J
PER UNITTRANS.
(16-4) 01 JUJ
ZUloUl(0Z
/oO COO UJO -Jp- <r*» o>
E u.
o £i
—
33 _)I /
a.Xui 6
z <o *
0-rX^h» j J
1 (
aoa
a.
UlLL
:W
2U.
zI
AS38§i5 <... a:
PX >LU CD
-1<O
m
"1
\* _\* ~7 /Ipj
-A (—o 1 z
3s Ar
. totr> i Q- LU3 1 D j
- j Y_.- i > -.o 1 < o
a. tt
o j /_
g^txSi ~
.]a /_\ \
a)
) V>
U(E
Q OoxITa.
tt lu nmSo -1tv J /
/ /-1 ,
o< 2 UJ
to 2- CO
<£>
]A /_UJ-j
6LU CE
c
_\ v^
is
,8 Ss « \\>Ea.
n§538
^ <
- / )
\ C-He!
<o §i
«•> \ \~) /^
-
<
>-
V)
5
z2a.
z<a.
3<
•t
3J<
LU
Oz<
<>
E<>
CO
2
z<EL
Z
Q.
<
<
U<
UJ
Oz<E<> \
DC<
(0
5
z<
Q.
z<
a< *
UJoz<X<>
QO£UJa.
-i
o o3
I
2
X
2
CO
o u-i-
Hp£
OPL,
WPi
fH
H
UP3OOPrf
Pu
P6j
WHZiwu
w
zwPL.
Xw
CM
HMPQHPC
Xw
40


cc
oEL
1.1
CC oK QUJ 3l- CD2UJ
HI1U m
111
COXin
ZL _j111 u.aXin
o o o iOCMr o CMm to
" to
o © o O oa o ^
CM^*
-UJa
-' (O
z <3 s> to
1-z>
OUJ
>oo oo
CD
oCO
1/1
(O
< <a "~ m"
o o o oo o CM CO ocj CO
u*>
oa o
oo o lO
atc
_• o ^"*~ *~
£X
a0) I
UJQ.
ILI
D > CC
z E c Y-o
UJ P| oO < Hinz Si
U_
Oooo Q
3
s oo o o
ijj
a.o a jj Jj
><UJ a.
> - UJCO2
o UJ
CM oo9)
a.X 8
CM 3 2m
aQa 8
CMo o
CMo
CO CO VUJ>
cc111
0-
ZO
D I<n
zoCO
X >5 CD
cs
E©CO
"co
co
ffl
UJ
z
<tr
<Z
CO
OU5
U
aCD
co
o
5VI
co
CDOc
Co
3<D
cCD
CI
c<D
E
dtr
O UJ-j cc c o s
CDXas1-
aa.DCO
U <a CD E «J CD CD D a<cc
z
oto
a:
O ma. 5 CO
c>(0
Eo c
CD
a.
3C
aOO a
3
UJ
UJ CO ^ 'O f- CD o> o CM n CO h-'J O o o o o o O o
HWoQPQ
WhJpa
HXWhJ
Pn
HpiOPhwPi
pi
wHzwcj
wCO
wX!wCO
I
CN
M«HPC
Xw
41

HCC
oEL l-UJ UJrx arr QIII 3r- 03
2 UJUJ -I
O CO
UJ XCO UJ7 _lUJ Li.
a.XUJ
o m IS) oo t
en co © i- og
Oo oo ooS o ai m CO< *~ *" CO *o"
oo in o in oz , P3 N.
-J<T> o
UJ«- co
Q i- o o O o<2
o a o o2 o so m CO< CO CO
CO
zUJ o o m in O n r*.
2 CJ OJ CO zCO (X> co co
t $z a3
r-*
1- o o o o5 o o o o5 so o CO
> < ri m*
>1- o d »_ CO COO o o o o z< d
COoen
coco
N." i-
2<
QO oo
Oo ooQ
o CO o CD
COO(X
dzoc
LUa ino m
CM
oo
•" en CO
Ccc
*" Ou,
ID-1 h- o o o o
Q. >2<
o o o o
B> LU
aD
<1-
UJ
o tN
cm"
E c Ouj _ E
<ogo
in O ma o
z - CM m
NSE
CENT
Payroll
ana
Depart
C llj
UJo
CMinen _j
UJ>LU—1
ZLU0.XUJ
in -i
orx
>-
2<
oooOoCM_
oocm"
oor*-
UJ i <X *r o o m in a. d
z»- CM Ml
UJ CM oen s CM
CMCMen
*n1-
2oo O
aOo
ooo o CM_
< *• " CM t"
o ._ CM *o o O o zoCO CO
OCM C\i
rx inO H o O o o(/> g o o oa u> 2 5 CM a CM
<0 I
< ^ -'cm' V
a>
Oz
- CM *r
3 cc
ZoGO
' atc —
o 3 «
CO>
"3
cC
3o
2qcxrx
o5o
Oo•D
ooin
u — <0 CD a> go < UJ ^X >
Q<rx
1-<Z
c cEB Oc O2 o
c
cc
ao
a
oocCO
CD
c c
Hi
<-JO.<CO
<
Kc-1
UJIT
zo
c y
- 9-— 33 CT
<D»C
CO
toJi
c
O1- z
Ocop o
5Q)
Q.o
CD
O
< O1- U 15
Uo a.
aa. oo > O
z co UJ O uj tx o < UJ UJ 3 a JZ "c
UI u. 3 u CO
u OD o • cm oCO GO 2 O
HWOQ&pa
wi-j
pai—
i
xw
HPi
OPi
wPi
Pi
wH2WCJ
WC/J
awPiXw
COI
pa
HS3Xw
42


importance of agreement on the budgeted level of productiv-
ity at each activity level between the individual setting
the budgeted amounts and the supervisor who must work within
those budgets.
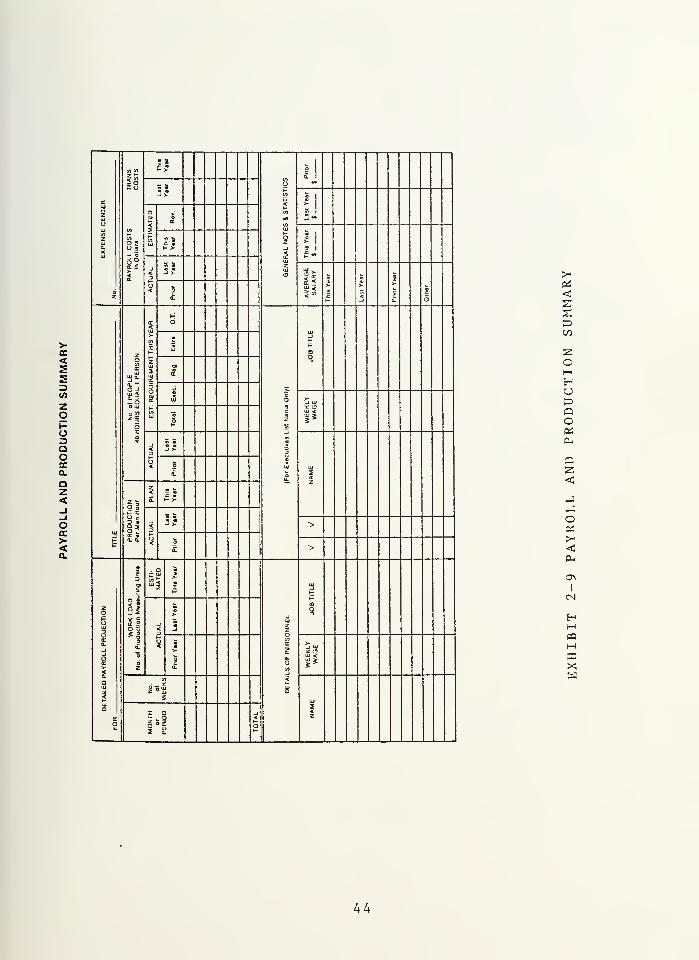
The final expense report provided by the RAM, a
payroll and production summary, is depicted in Exhibit 2-9.
Payroll is normally the largest natural division expense in
every expense center and, therefore, deserves the extra
control. This report delves further into the area of pay-
roll than the expense center productivity report by dividing
the payroll into smaller periods of time, by delineating
planned requirements for executive, regular, and overtime
payroll and by giving statistics in the area of average wage
rates .
Besides the reports discussed above the RAM contends
that it is feasible to develop a supplemental system of
exception reports which will direct top management's atten-
tion directly to problem areas. As an example, a report
could be produced that lists those expense accounts that
have budget variances exceeding a certain percentage. [Ref.
3: pp. VIII 1-13] This could be problematic if the reports
are used as a means for evaluating a managers performance
[Ref. 4: pp. 109-113], If a manager's evaluation is based
strictly on his department's performance in regard to the
short term budget, he will tend to make sure his figures
look good in relation to the short term budget regardless of
43

>•
<
5(/>
Zo
OQoccQ.
QZ<-JJocc
<
. wr S
y] yi h- >-
sis o£ 1
.
t- O s s-J > y? 5 1
EE <« 1
>UJ
zu
aUJi-
<
>•CC
4 I"V) 5
z en
o eCO Is
Oz
"
a. o « t- >2 -i 5
a: S
5 H*Z
* *<0.
<3
u
J * o&5 f | >
6z
< o
a.IS c
! 5
,_
cc 6<> Uj
X UJCO
zo o
zcc s «
ccUJ Q.
CL""
2<
i3a
co
jj
ii cc UJ_j UJ
O UJ * o
z 5enUJ
o zUJ <
s 5OX9
3
•1 «€) «-1 > 3
<£
14.
2<z
Z3 Is
Z ^1- >
Q 3
§?a. x
< SI >
fc
3
U< o
£ >
, Q|*~ ,_
a S| c UJ
§*~
fc
O -< 2 Cfl
|o
3CCa.
23* cS SO 3
-I
<
3>
5UJzz
s
Sl O
<
oCC >
a. _l UJ-j
Oe
> Q. * Oo6
s U.
OUJ <
s5
><
Z £3
Ck<rt <a iu
.j z^tti Qg sUJa
UJ
2<zz a _,
ao I s
!s o!
<
-
02«:
aap
SBoHHaPpo05PL,
PSB<
-J
oOS
<u
o>I
og
HH«HPXw
44


the affect on long term profitability of the company. The
manager could do this either by manipulation of the records
or by making less cost effective decisions, such as putting
off needed repairs until money is available in the budget.
[Ref. 4: pp. 109-113]
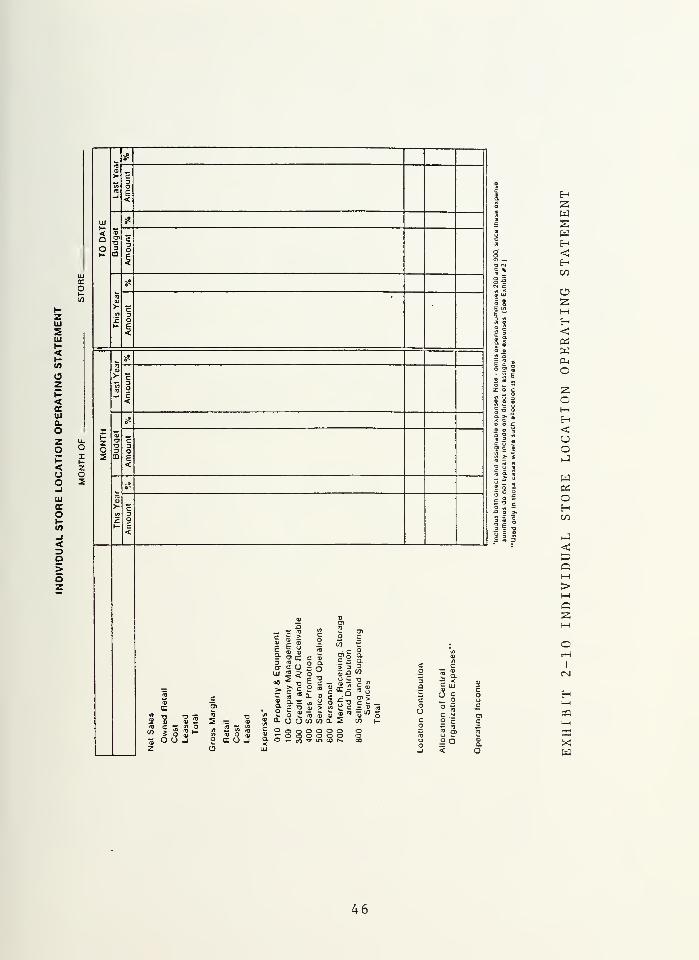
4 . Branch Store Reporting
With the advent of multi-store operations many new
problems in retail accounting have become apparent when
attempting to evaluate the profitability of each store. The
proper charging of expenses is of major concern. In this
area it has become common to charge expenses directly incur-
red by a location to that location while all other expenses
are recorded initially as a central organization expense.
The central organization expenses are then assigned or allo-
cated to profit centers.
A sample branch store report can be seen in Exhibit
2-10. This report may be changed or altered slightly depend-
ing on management's information needs. However, it should
show the store's operating results for each month and year-
to-date. Besides those columns shown, many companies add a
column to show variances from the budget and last year.
Though comparisons to budget are usually considered realis-
tic and essential to the measurement of current performance
the same cannot be said for comparisons to last year. Allen
H. Seed III, in his article "Improving the Effectiveness of
45

HWSwH<HCO
Oss
5u
azt-<UJQ.
ozo
<oo-I
UJcr
oI-0)
_l<O>QZ
2 aE 2 a5 X a
' c o- c
<WP*o
oH
<CJ
o
wPi
oHCO
<!=
QH>Ho2
19 a>
a 5 c - a) 8
«i I 3a o o
2 - 3 8 0-
j. 2 * | Con o O n ^ i-o ioj a o
o oo o— IT)
en a.
o oo o
2*<" oto i-
= — 9
I
CM
H«H35
XW
46


Management Reports" [Ref. 5: p. 63], and Louis C.
Moscarello, in his book Retail Ac counting and Financial
Control [Ref. 6: p. 323], object to comparisons made to last
year. Each state that a comparison to previous years is
looking backward at times that may have been either excep-
tionally good or bad and is not consistent with the philoso-
phy of management by objectives.
5 . Executive Level Reporting
In the previous sections the discussion has been
concerned mainly with reports received by operating
managers. This section discusses senior executive level
reporting. As background to this discussion, the need for
planning on a seasonal, annual, and long-term basis is
emphasized .
a. Planning and Budgeting
Long-term goals, looking ahead three to five
years or more, should reflect where the firm is, where it
wants to go (its objectives), and what resources, including
funds, are needed to achieve the objectives. Seasonal and
annual plans must, in-turn, reflect the intent of the firm's
long-range objectives.
A prime objective for each firm is the profit
objective. Depending on the organization, this objective may
be simply to cover their cost of operation, such as for
nonprofit organizations similar to Goodwill Industries, or
to make. a profit which can be shared by the stockholders of
47


the company. To obtain this objective company- wide profit
plans must be established reflecting management's expecta-
tions for sales, gross margin, operating expenses, and other
income. From this company-wide profit plan detailed opera-
ting budgets must be prepared for each responsible location
whether it be a profit or expense center. Once the detailed
plans are established and agreement reached between senior
management and the levels of operating management (i.e.,
buyers, merchandise managers, and store managers), each
member of the management team then has a financial plan
which he or she is expected to follow. With the concept of
management by objectives and the above planning functions
installed as an integral part of a firm's method of opera-
tion, reports can be developed to provide top management
with the feedback necessary to perform their management
responsibilities. [Ref. 3: pp. X 1 - 2
]
b. Suggested Reporting Formats
The NRMA has suggested three reports for senior
executive level management though they stress that these
reports represent only one of several alternatives and that
the specific reports used will depend on management's speci-
fic needs and desires. The reports consist of a total
company balance sheet, a condensed income statement, and a
total company income and expense statement. The following
assumptions apply to each of the suggested reports:
48

1 . The firm has several selling locations.
2. The firm accounts for inventory investment by depart-ments so that gross merchandise margin can be deter-mined by department and by location.
3. The firm develops a written profit plan for eachfiscal period.
4. The firm is organized so that individual store mana-gers have responsibility for the direct and assignableoperating expenses of the store.
5. The firm uses the expense center summaries, expensecenters, and sub-expense centers as outlined in thismanual, providing sufficient expense center breakdownsto reflect executive responsibilities.
6. The firm uses flexible expense budgets.
(1) Total Company Balance Sheet . This report, as
shown in Exhibit 2-11, presents a summary of data with only
significant pieces of information or key figures that the
NRMA has considered to be necessary to management needs.
The information is compared with a plan and is shown in
trend format so that management can more easily spot prob-
lems. Finally all dollar amounts are rounded to the nearest
thousand dollars for easier reading with no degradation of
report quality.
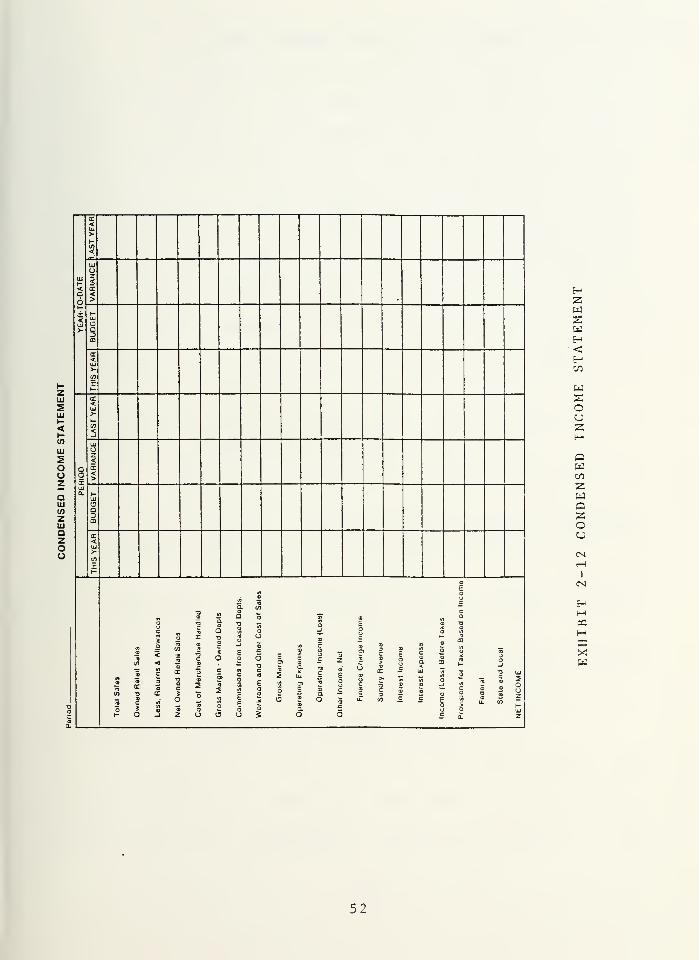
(2) Condensed Income S tat emen t . The report
shown in Exhibit 2-12 presents a conventional company- wide
operating report prepared for management. It is an accumu-
lation of individual-selling- location income statements for
the current month and for the vear-to-date.
49


m <r i2 3
I-Ul111
Xto
111
o2<-I<CD
>z<a a5uO zU iii
J s< 2I- oc
O w
is
3
5
CO CN O CD
s ; s
3a.
o m to
» 5 ?momo o en•H- CO
<3 to
CO
03(0g cj> »-
0)
Qt.
<
U<
<s
5O 3
01 — COto to in
o o om (33 C33to m to
-l co co co CO CO CO
z
U<
Ifl-T <J3 —n a N
t- z°sa(J
z
5a.
O tn oi/3 lO CO
co in inin in m
<3
r-.
(09 03 K«i n nCM » *r
jj'j v m in m
Iaz
'/i
>z ?
at
g g m3 o cmCO CM in
O O U3co m cmO T to
in m m in in in
vi
z 3CO
— co egr-- *T CO•- V CM
c3'J
(J
X
uo<
o<
O O O —
5
«/3 m oS Ol OlO V oo m inCO CO COCO O) r-
a. O O — O O O
<3
01 N Oin »- -i-
CM CM CO
<— *" — —
X
5
5•n o oCM CM CO
to o O
E .2
5 o
c!a2C 3o 2
_ o- cc *3 »
HWWseCO
wa
<-J
<pa
<SoCJ
J<HOH
I
pai—
i
S3Xw
uj <u. 2
C3 Q. K £ u3 LU O O iu
< to O Z Q
50


E 2 < 2^> J1 -i
a a. i-3 <u o< (O O
coo
LUatxto
lil
(Jz<-J<
>2<a.
5Ou-I<I-
o
- O *- v m*"t T °>
1. 5en o ri pj
5°
isu
5 o» *- o> o to *-o w o> en cm en
a. C5 CM en en en
,
to m m cmto F<* »
uJ zQ ui
tO O* CM
J to" to' to' to'
3 s <o £2E2u > o m m O O in
o z O i- f- o f*- «r •
*°. °* *~- cm en mto. i to" to' N-* r-~ r--." n."
<3
ui m m m5<2 a|§5
|SSK w £
J <n"
K f«* f*t*> <*> <*>
m ci m m in mI
CO CO COu5 r*. — r*. h* r- h*Q a. ri *• en n rt rt
crt < o in <o(O N CO
_t — en CM 1— C3
< < •- *- *-" **
>-<a.
|
o cn m o in om en cm ^- r^ mO cm *-_ <n CD 91 O
X F- — »- "
j<
enin
cm in oto n co
X m r» coCO < <
H 2O
i ?a.
o o o in o mcm a> to en en cm
CD to r- co (O N CO
<
< to o> o inZ tf) 3 »- m w
Z U<
—
-
•- — en
E £CE
X
au3CC z o m in o m oU CM en CM m t cmO *- *- CM ^- m ^<
* i/> co r* oi>
to *f_ ^ m'i ri cj en en
a,
z
8 |q m oO r^ o O ^n mO CM o
J T *". *°. CM *- O< a en" en en
a B
a2
HWW3=en
Wu
<
<Ph
OCJ
<O
HI
«H
Xw
a 5 suj < a.u. 5 <
2 o
51

t-zIAJ
5UJt-<Hcfl
UJ
5OozQUJCOzLUQZoo
UJ
<Oo
X<>-
<_>1-
5111
OZ<K<>
C3Z>
'X<LU>r>
X
o3
UJQ.
X<
>
1LU
u<X<>
aa3X)
X<
:n
r
Total
Sales
Owned
Retail
Sales
Less,
Returns
&
Allowances
Net
Owned
Retail
Sales
Cost
of
Merchandise
Handled
Gross
Margin
•
Owned
Depts
Commissions
from
Leased
Depts.
Workroom
and
Other
Cost
of
Sales
Gross
Margin
Operating
Expenses
Operating
Income
(Loss)
Other
Income.
Net
Finance
Charge
Income
Sundry
Revenue
Interest
Income
Interest
Expense
Income
(Loss)
Belore
Taxes
Provisions
for
Taxes
Based
on
Income
Federal
Slate
and
Local
NET
INCOME
HZww
<Hen
w
oz
ow
zwGzoo
I
HHPQHSG
XW
52


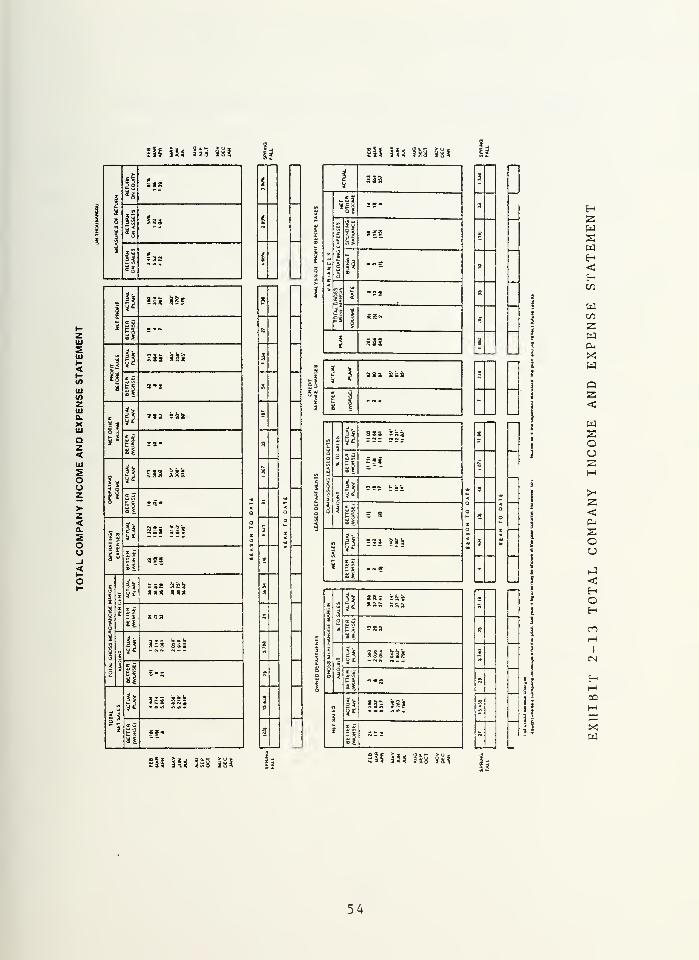
(3) Total Compan y Income and Expense Stat ement .
Exhibit 2-13 illustrates several concepts of sound manage-
ment reporting. First, only significant elements of informa-
tion are presented to management for a quick, overall
picture of the operating results. Second, all amounts are
presented in trend format, as well as showing season-to-date
and year-to-date. Third, all amounts are compared to the
profit plan with variations to plan being highlighted.
Fourth, Return on Sales, Assets, and Equity are highlighted.
Finally, the five reasons for planned profits differing from
actual profits are highlighted. The reasons for differences
ar e :
1 . Volume Variance ((Actual Net Sales - Planned NetSales) X Planned Gross Margin Rate)
2. Rate Variance ((Actual G.M. - Planned G.M. Rate) X
Actual Net Sales)
3. Operating Expense Budget Adjustment (Total operatingexpense per profit plan minus total budgeted operatingexpense based on activity levels.)
4. Operating Expense Spending Variance (Total budgetedoperating expense based on actual activity levelsminus total actual operating expense.)
5. Net Other Income Variance (Variation between actualnet other income and planned net other income.) [Ref.3: pp. X6-7]
E. EFFECTIVE FINANCIAL MANAGEMENT REPORTS
As discussed in the introduction of this thesis the
following section will describe techniques for improving the
effectiveness of management accounting reports and
53

sis in ? 3*5 m h m iu m m
UJ
2UJt-<
UJ<f>
ZUJQ.XUJ
Qz<Ul
5OoZ>z<Q.
5Oo-I<I-o
i
ifa
S«!
1
1
2
s 5as
< 31 i3 i>
5^
*i
El
I?
??! fcfec
sis in
3SS jfc*
:ss a! =
315 SI!
?<« XXX
iJi 5**
K
5
J!
a
5
3
xX
8
3
s
§Sis
-5»
!'fell
Ifj
z • »si *
i<
1Hi
£
h • ••-
o!
IE <a
I^
ifi
-99
T. u
2S 1
1
Efi«
i 53i
aaa sis
I 3--.
<
a
i
I
5o
5*33; is;
C £= I§
Xo3
la99S kii
E| E 9
|li
"32 IIS
i
i!« €
f
3
3o
I!
>a; :~s
= Ra
I
3
i? 112 ssi?
Ssj
H "«S
lI!
S36 iii
iC
|« ss
5
9
s
s
5
I
i
j
If
!
HWswH<HWwwzwCMXwQZ<wgouzM
z<P-.
soo
<HOHenH
i
CN
E-H«H»XW
III 15* 3a§ is? |iilS iJS I5S Sal 1,
54


weaknesses which should be avoided in management accounting
reports:
1 . Improving the Effectiveness of Management Reports
Allen H. Seed III, in his article "Improving the
Effectiveness of Management Reports", presented the follow-
ing categories and techniques to improve the effectiveness
of management reports:
a. Report Content
Attention should be focused on key control-
lable items on which the concerned executive can affect
change .
"" Actual results should be compared with plan,
budget or standard to evaluate information in relation to
objectives .
":;" Significant ratios and unit costs should be
included on reports so that quantitative results may be
related to activity levels.
* Trends should be emphasized for planning
purposes in order that unfavorable trends may be controlled
and so that benefit may be gained from favorable trends.
•;;- Non-accounting information should be shown
on accounting reports so that the reports will contain the
whole picture.
55


b. Timing of Reports
The frequency of reports should be related
to the frequency of action that can be taken based on those
reports.
The reports should be distributed imme-
diately after the close of the period reported in order that
action may be taken to correct problems encountered.
c. Recipient of Report
"Limit the distribution of reports to
persons who actually act on the information contained in the
reports, not only to reduce cost of preparation, but, most
importantly, to use more effectively the time of the recip-
ients." [Ref. 5: p. 67]
Higher levels of management should receive
only summarized or interpreted results so that attention
will be focused on results obtained.
d. Presentation
Reports must be kept simple in order that
key information is not buried by excess information.
Uniform formats should be established for
all reports so that it is easy for an executive to follow
from one report to another.
Columns of numerical data should be broken
up by placing captions in the middle of the report.
"-" "Identify each report with the name of the
individual responsible and accountable for the results
56


shown, thereby personalizing the report and causing it to
receive more attention." [Ref. 5: p. 67]
* Report significant figures only. [Kef. 5:
pp . 66-67]
2 . Common Weaknesses of Management Reports
In his article, "Dynamic Accounting for Effective
Management" [Ref. 7: pp. 11-12], Hugh G. Luke presents five
common weaknesses that should be avoided when preparing
management accounting reports.
The first and most common weakness is the presenta-
tion of too much information -- not only too many conflict-
ing, overlapping or unnecessary reports, but also a large
amount of useless information in valuable reports, such as
too many columns or too fine a breakdown. The personnel
responsible for preparing the report are not always to
blame, since all too often it is the executive receiving the
report that requests such detail. The executive then has a
tendency to either become enslaved by the mass of informa-
tion or he ignores it altogether.
The second weakness is the omission of important
information, which is caused primarily by the short sighted
belief that only information provided by the accounting
system belongs on a management report. There are areas of
performance, such as in distribution and personnel, where
results may be better measured using a medium other than
dollars »
57

The third weakness is a lack of integration in the
reporting system. As businesses expand more, and more infor-
mation is requested by various departments and is subse-
quently provided without a reasoned determination that the
information is really needed by the department or company as
a whole. Another way of introducing a lack of integration is
through the institution of reports aimed at correcting a
temporary problem and then continuing the reports once the
problem is solved.
The fourth weakness in reports is a lack of clarity.
This weakness may be reflected in content or form or both.
The report must satisfy the real interests and needs of
management while maintaining the use of proper accounting
principles and methods.
The fifth weakness is failure to distinguish between
the kinds of information for planning and the kinds needed
for control. For example, the sales information needed for
planning departmental purchases does not have to be broken
down by each location, however, for inventory control
purposes, sales by location is normally considered
necessarv .


III. INFORMATION PROVIDED IN GENERAL PRACTICE
A. INTRODUCTION
This chapter is intended to examine retail financial
statements used by major companies in the private sector and
the Army and Air Force Exchange Service (AAFES) in the
public sector. This chapter is divided into five sections:
retail merchandise reports, non-retail merchandise reports,
expense reports, branch store reports, and executive level
reports. Exhibit 3-1. provides a synopsis of what type
reports were provide by each of the major companies and
AAFES.
B. RETAIL MERCHANDISE REPORTS
The May Department Stores Company, J. C. Penny Company,
and the Army and Air Force Exchange Service provided the
retail merchandise reports shown in Exhibits 3-2, 3-3, and
3-4. Though each report is different, there are some simi-
larities among the reports. Each report provides an initial
markon percentage, a month-to-date dollar sales amount, a
markdown dollar amount, and a month-to-date dollar gross
profit amount for each department. Two of the three reports
provide a sales percentage to total sales, a gross profit
percentage to sales, a dollar inventory shortage provision,
a weeks of stock figure, an inventory turnover figure, and a
59


nQo rapanies
Type \Report n.
JCPenny Wool worth May CarterHawle
v
Hale
AAFES NameWithheld
RetailMerchand ise
X X X
Non-retailMerchandise
X
Expense X X X X
Branch X X X
Executive X X X X X
EXHIBIT 3-1 REPORTS RECEIVED FROM RETAILERS
60


Ik
a-
*$* ua*2 UJ
O UJ> *:
u O53
UJ
a =
JC
I
-8
it
. _
E
5
a:
=
3
=
s
| |
a
a
u
2
"
a
3
|
8
i
S?
5 „
* 1 ; « *
iii lili !
SSS siSS 1
3
1 1 1 I I I ,1 ;
3 l I 5 1 1 = : 1 { {: si? _.
> ! f ? J-i s ! i :i . "" :
s's * 4 > sag * s Es i **3 .
i: 5 3 ! I
iI
I IS I
SSSIil j
CO
uHHCD(—
I
H<HCO
EdCOHa
<33uOSw
wu
o
w
>wOS
CM
I
m
PQM
XEd
61

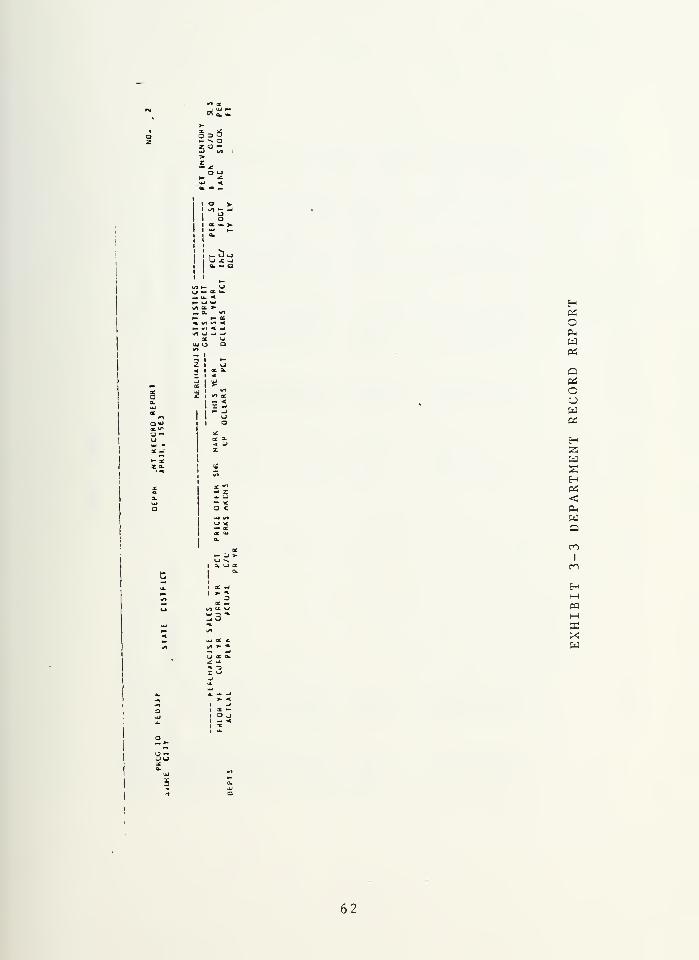
*1 oc
H a.
>
c 3 8N a
3 Cl ,
>z
JC
a o*- -:*J <BL "* *
1
1 a >t
1
VI ~i
i ex >-
i
1 I
o.
i i
i i
i i
I 1 G5 u
—
1 I
.-
^
u
»/» »- uVJ M *.
*W _- _i^ « >>
M =» ^1
cc4 W" «
I1
1 u« 1 CC A
t *1*
21 wi1 " ac
1x3
rs
lz
a *
HOS
OPUwPS
oPSoowPS
H55WsHPS
<PuWO
•- 3 >r. - - -
COI
m
23"
-I 3 i-
E-t
H«i—
i
S3Xw
62


1
a —
inir* SO
— * t*t\o IT
CEIOs CN —u^a avcs rviafVia OKI LT*D
J-1 "
aa
X—-en
otd
17car- j-ij-
1
ir*^ —O mm fvimm »• r-f~i ^opo r-*\i<r#*i r-*o osr- **rn—IP cdmn
mip\arvj
r
— rr. <\*--
so oka 0(0 c
! I {
:
v-»-» r-ir* wu"1 **
i> (CfU
— IMfO
££— IP
j-. —
sorvj
sot
— cc
CNtrs m
irlo —
f\j — pn4tTs
r-fM
sc^ c r-
- »• —
OHH<PSWPu
o
H52W
HPi<CP-<
wo
<HWPS
o
HWswH<HCO
<r1
rn
HH«HS3XW
63


M3P J (* .
on o^rvi ir* r-f\j q\q * r\j o> p-
r^*r^k VT*P * SO f\Jr\J ITfBr\i f\j r\j Mrn — — ivjry aj
r- ru oslr* sc —iros evr*
HO SOI/* a?sop rv*-» oso
(Mrs oo o o
M« v«o <\i WB os«* om
*v SC^
uJo
so Ts ru —: fi
Si
cm a os * rn
*3 "
k i
M 3
C
rnm mm <\j rv«
IT M
G S
it trs os :* r» or-LT» soim rnta
£g
G E
OD 7s (Dt-T (D 3
m «a ir n •* js
s stc
2 i
ii -
ss
a
P $
5b
C/3
53OM
<WCMo
HZWaHOd
<d—wQhJH<CHWpri
OHWSwH<d
<ri
en
EhI—i
PQHffi
Xw
64


current inventory dollar amount for each department. The
following items were unique to one report and were provided
for each department:
1
.
Dollar receipts season-to-date
2. Dollar markdowns last year
3. Percentage change in markdowns this year versuslast year
4. Markdown usage ranking this year and last year
5. Shortage provision to sales percentage
6. Average dollar inventory year-to-date
7. Gross margin return on investment percentage
8. Prior years sales actual
9. Current year plan sales
10. Percentage over or under prior years sales
11. Last years dollar gross profit and percentage to
sales
12. Percentage increase or decrease in gross profit
13. Gross profit per square foot this year and last year
14. Dollar inventory over or under plan
15. Sales per square foot
Each report provides a total of all departments for each of
the above items.
C. COST OR NON-RETAIL MERCHANDISE REPORTS
The Army and Air Force Exchange Service provided the
comparative cost or non-retail merchandise report shown in
Exhibit 3-5. The report is segmented into sales, cost of
65


1
WWH<HwOzMH<OSWft,
O
oS3
<OSPQ
1/1
I
en
HHPQ
X
66


sales, gross profit, direct personnel costs, direct other
expense, direct operating results, and statistical data.
For each of these segments, except the statistical data
segment, a dollar amount and a percentage to sales are
given for the current month and year-to-date. The direct
personnel cost segment is divided into personnel dollars
paid and personnel dollars transferred to other departments.
The direct other expense segment is also further divided
into each of the various expense accounts used by the local
AAFES exchange. The statistical data given includes the
average number of employees, productivity, and average wage
cost for the current month and year-to-date as well as the
end-of-month inventory.
D. EXPENSE REPORTS
Expense reports from the May Department Stores Company,
the J. C. Penny Company, and the Army and Air Force Exchange
Service will be described in detail in the following sec-
tions. Besides the reports described below, two expense
reports were received from a company with sales listed in
the top twenty general merchandisers, desiring that their
reports remain confidential. However it should be noted
that one report listed expenses by expense center and the
other listed expenses by natural division within expense
center s
.
67


1 . May Department Stores Company
The May Department Stores Company report, Exhibit 3-
6 , is a comparative statement of operating expenses by
expense center and subcenter and is provided on a single 8
1/2 X 11 inch page. Figures are provided for actual dollar
expenses, actual expenses as a percentage of sales, and a
ranking between other May Department Stores Company
branches. Figures are also provided for the difference,
better or worse, than plan and last year in dollars and as a
percentage to sales. Finally, a column gives the percentage
change in expense dollars, actual versus last year. The
above listed figures are provided for the current month and
year- to-da te
.
2 . J . C . Penny Company
The J. C. Penny Company report, Exhibit 3-7, does
not exactly fit a type of report listed in Chapter II,
however it can be loosely described as a comparative state-
ment of operating expenses by natural division within
expense centers. A current month and year-to-date dollar
amount is provided for this year, last year, and the differ-
ence between this year and last year for each account used
by the activity. Separate reports, which are several pages
in length, are provided for each department.
3 . Army and Air Force Exchange Service
The Army and Air Force Exchange Service report,
Exhibit'3-8, is interpreted to be a statement of operating
68


i> 1j^tl ICCSuat
( * °- MM
aoaiH 1-1-0
ICTUUiitiii ifoaii 1 mm » Ml
.<....antra Htlsf) i»*a « cm
ma LIU Tfll PUN mi ma in.
1 * ti i y 1 * 1 % II 1 * 1 1l.T.
J . ,r,,lU SSB |
iIhJOIkc * InMTiM
•l'.;: mi in. coin
1 iiuIfum. 1 mi.1 iqo3| rfliit in. iutJ
1118 COaUMa ICCTI
luolaau tafisiaati
•jr-.MM 1 r
nooliccti Mfim.'Jl'U II Ufli 1
llOOjIlf fffCCIItiM
iiooifia. riuwm
ncalmm ceaiiai
c m* Mf-llUlM: ::* iccti acetif.
t l»oj DLL IOIUII
4 j caioir okil.
C mi a U20fi l.llltl
q moi in atiri
"1-00
Jliot CaLLlC'lOM
4 llideuiiu'i 3f?
3 1 .:a 'OIK. CKOH
1
1.:oofna. *T»aucii?
ij'Jioiugii HHir.l*')0|0)t(Ct amt'-'- 'iLirin. 4|t
aj «:»aioTNCt mum,'< I0|l« 11 I IIHII,
J 14 J M« 1' PHI.
iUhq'i.ui i*o»
1.J„3< (3111 NIllCHI
I
t
i
:; ,14.1.1 1 IMI.
[i:oo'j ua»Li njfcu.
93H P1IM l-or
3*J0a Ul. i(Lft>f««f
lHOOIjllLlItd
STOalcillRIH
stiBiumr. or »aa»
s tooojroiti itfiariM
i
1
aiOQisiooua a ril
iioo » 1 raid-01
*::.'. .j»» urn 11
'olejjii 131*1 '(iio«cl
'i| iinjiiaivrH icall
t rant timwei mul.3I (Bflflj TO t. lOIi M1H0L
]ol m«i iiuixi su'fii
[titIOO| SIR. ItU "in a(n
1 1 110:1 mat. or i'oci
;TJ 111JI CUIIOMI Kit
|'|14)01 ricr CU1I 'HI.
|f] 1*03* »«t cult MM.
I>l10:1 etiNiu im»
it] r:a etui nci.iii
llj IISSJ 'II 1 £11. II*
It «ggoJ urn HLLIM
joliicajafici. Ml,M Ilia HTiMi« ma mtiM jfiict
;t| noof iim, coaiaoi
fo| io;ffl ram uic«1 i 1 1 !
i
. 1 ,., II 1
1Mi ! !I I
roni IftUI *• -*
llll • tlLfl I'll
EXHIBIT 3-6 STOR-E COMPANY EXPENSE ANALYSIS
69


a <Z uj
n >
cc inuj <> _i
on>_i<2<
CO
ZUJaxu
9§
o <Z VI
o M2 _J >— -i a:_l UJ UJ-J 1/1 1/1
OJV) 1/)
I ar— z
1 Z iyi <UJ 36
UJ i uj oco N- u. ZZ VI V) —LU -J Z _l1 -> < _lX u -j; UJ
in UJ < *- COuj— > > J- t-or QC CC c* a< < < < i-
Z UlUJ UJX i-UJ w ot
O X << 3 _iZ X << VIa: I
ICO Z3C UJ
UJ UJ XVI LL LUZ^OUJZ <X < zX3L<UJ - X
of
o0. VIQ_ UJ3 —
h- V) or.
OC •<on _/0. UJ <a. _i co3 <</l CO h-
(/i i atu a._J CO 0.<X 3</l UJ vl
LL| CO t/1
Z UJQ. < -IX CC <UJ " (/I
> v >-
a. x a< < h-
VI l/l
a: XUJ UJa. h-
v> <t _j
uj t— O
_ 3 vl <u. uj a
_i x_i o < >—
a - aar. < h-> o —< — -0
CL '— VI
UJ UJ1/1 l/l
z zUJ cua a.X XUJ UJ
O 'J ozzz
ar, a: car.
UJ uj UJ> > =»
< < <
i UJ VII -J o' < oVI
UJ ZCO —• oZ CO zUJ »- —Q. t- V)X at —UJ -J I—
> ar.
O Q UJ
z < >— QCO _J <— <l-ZheOOUJ — t—-> t-3 <« z
3 t-
a. ar.
LL_i
u. < u)u. oo a I
_j o*- CCz *r. -1
UJ < a.
u s UJ- -j KX <. <a r o _1
ae >— u UJu. a _l
1
or.
CO-j _i V) UJ cu< <t ui UJ V) _J*H — UJ —« >- Q QOS i _l _l < X <UJ LU a. 0. _j QV- K- i a a. 0. Z< < •d 2 VI X UJX z v> VI
ouj a.X
>- > > > > _J UJ< < < < < t- <-i -J _J _ _j O a: *a. a a. 0. 1 •- UJ oCO l/l V) /! VI Z 3MM M M « — uj orO Q a Q a O t-
o o oV. ,- --
C/j
HCO
<<wCO
zw(X
Xw
I
CO
pa
MPS
Xw
70


z o
AC 1
c 3z .1D HX -
a 1
Ul
< Ka <o >*
^.in<
UJ ^
c<>01
I
*
cQ <Z uj
Z> >
CE <S>
UJ <
O
K<
QOcr na <
c<>
X
1 Z 1-
ooo
;
i
)
)
<
>
ou
aaco
VIUJ-J<
0.XUJ
Z
VI
a a'UJ
I/I
LU
ViLU
_laa.
XV)
LU
O<
ct
Q V! a u t- M4 LU VI <-LI a ~- < -1 O U LU <_>
^ LU o >- u _J a. & UJ — «< h- < 'JJ a. 0- a h- 'X X •J
_1 < VI H- v) X a. X XI LU rf U. XUJ -1 JJ X *; X i/l LU Li ^~ _ a VI 1—
Ct UJ •—
•
X u UJ Q > LU LI < LU <J VI Xcc -1 a. UJ X UJ h" UJ z LJ —I cc L3 'UJ O
Q UJ 0. i/i X o h- at > o _J UJ Z LJ —Z Vt V) to a. z u u < UJ a z Q. -> ct z — u UJX> — UJ UJ -^ < z _i 0. at o < X X — i— < ctu. a -1 — VI ac X LU — UJ o LU z z UJ UJ > i z u.UJ z < -I — vi -J cc cc L- 3 -u VI I— a —
.
LU3L < vi a. UJ < B3 V) a <t <t *— -1 oc <i ct <w> *^l
X a. _J t/i o M 3 v) I _/ z «l o 'UJ a. •— Xu-o a. 3 < a - a LU a. — > z CL CL • U. Xa x X v» vi a t- u LU -J X >- uJ < a —
1
a X > u. UJ
XI UJ a ac LU z < UJ < r r 0- X UJ ct -J za: x O U. o a -J < VI _l l/l UJ LU a. 'UJ <UJ -1 z a x .J _i -J x I LU X. UJ _J Z LJ _lU. — «J — z v> a -i ^ < — CC X. L- -X a —
1
i/i a x a W cc -. o L_l a CC >- 3 x X UJ c cc —
.
'UJ _z - a) 0. Z 3 ct 1 o - 'JJ X u. I— (/I V K- LU >— Ct o
l/l
UJ LU(J OCt Ct< <I Xo o3 r
LU LULI -<Z l-
z oa »-
z < —JX GO -E CL
LU >oc X
a —Z X.
z oLU —O _l
< XCt Xi- r
z < a
ct <LUVI LUZ i
'jj aa x— CLVI LU
UJV) VIz uiUJ UJa. u.
< Z-i OLU —Ct >-
<-J zuj az oz3 Ovi aZC VILU VI
'Jct<
LU IVI O QZ LULUUJKCL O <X — _JUJ > UJ
ct ctVI UJX VI Za —UJ 'JJ T.z a< — <-I JE
—I z >-
•-u o aL_> — —VI N-
C/j
MCO>-
<<Wl0
wPiX!W
I
CO
Hpa
a: o >- >- h- a. < x z
-r t> co ^i x —
*
O N h*i m^iv -i -i -r ~.- o
•4 ^- 0> ^ COm >r cf o oM N rj m ifl
-j -— — — ~ — ro^j—
•
71


z<>— > -1 v>
1/1 z UJ _ LUUJ a. — at O o UJOS >c <J X ul LLD LU UJ uJ > 10 l- > Ma
VI 1- -J < LU 1/1 X Jat x - zz ul at a. uo UJ
|—. *- Z _l — UJ u M O VI a:< a. •JJ _l O X O z > eca. u X a z -1 < < < 0£ 1/) <J UJUJ UJ 0. at < < — X UJ UJ UJ Kat 3£ J- 1- 1- X >— 1/) !_) ae3 => «t UJ — JJ < h* o;•J H 3 a. 1
1 Q. ar t— a: _l > a *—** UJ X O < CJ UJ < at ISI z
UJ Z Z <* X o '_) o >• X Z UJ < uj aU X O «t k— < z 1 z I— - (/l a </> <-> '_Z -0 Z X *— ^~ vn •— ot x o UJ — -T< u. <I h- 1/) 1 UJ UJ < 1/1 o o o > zZ 1 UJ a. X X _j Q. t- • z UJ UJ as ouj Z t- x l/l a < < < O 1/1 Ul at at oc UJ z>- a Z JJ LT as *- V- o X UJ UJ Q. H- ul uz "* < X UJ a. a Q. 1/1 X X U) bj 1/1 «J— k— _J — o UJ JJ —i 3 < UJ — UJ <<t < a. a — -1 l/l '^1 -J — t— t— a — ^1*: — -1 < — — «j < U h- O O < z!u *- » Z X ~ z — at ^. at 'JJl^ UJ D -/i _) c> o o UJ J l/l Z2 a at at o 3 O<_) t h- UJ ^ A 7* .» — 1/1 LU .— Q. w >-
i
—
a.3 a. X .; z£ t < < a: _i a. i/i i/i a; a"» UJ <t 3 u "
'
; — _ < -J — M| O u.u- c* *— -< /l .-"_ ui 1/1 a ^ -) j:
** r^i •n
1
_ij iT* O 3 u*•o -i -* r» * " ,
£ -r"
-O
>^
<<
CO
Wxw
I
m
Hpqi—
i
PSXw
72


2 Or, o
5az3E>
3UJ ii<
iOO )
:
cr
a'
>
1
|
aip
sUJ co .
z 1
D >
- VUJ <> _O
«<'QO > 1
£V) '
X 5
i
<ui>V)
I
i
a.-I X fc
.
_l UJ<SI O. O UJ<J> X X a. wZ UJ >• MM or— .1 1/1 < -J aa a H uj a. 0._i — z _l X i: < i/i o.
ai ~ « UJ -l< Z or UJ UJ 3i/i a. 3 a. s: a t- <r iu i/i o <S1
s a x m uj a.UJ QC —
i
a: X>• H- t- "5 5 a
a a. UJ 1 3 < z a: a. a: zu UJ X t- m jo a. uj or t- X UJ <
£I— at o z at uj uj i: uj 1/1 Z UJ 1/1
_ < z i/l UJ — 2 UJ Z > I UJ o t- >z
o_i _i —
•
UJ 3C «t 3 o a < o t- t/> O O VI I/) UJ hUJ < 1- i/) a. a. (- z z X _) o UJ - 1 4 O I- M-
u ae or < z — iux<i< K 3. l/> > Z — <J < _ju UJ at UJ 3 a — z X - z ia < or —i* Z 2 UJ a. O u- uj t- C£UJ VI UJ uj z u. -j a o— UJ a. x UJ UJ H- z UJ UJ a. </> u a. *— -J 0- <
I o a UJ O O Z < X -1 X X j<^iOi LLa a z i- — -J H < < UJ uj <t a a: o< -J _j > z !J «i < a. a o k- i- i- or o > o _l
< < » •* Z Z i/l I o — <tzm < <V- t- H M — UJ 3C h- •Jh X or uj s: i— c i— l—
a a a _J i- h i- — * a i-i i a a 3 3 3 uj 3 a»- h- h-
uZ Z Z < O 1-<l — — Q. 3
UJ o 1-X i/l
3.
aa. yi z rr *-
Tt 3 Z Z <h"
< _J < «* UJ at < -i 3 '2 JJ 3 LJ —iu. a. Q. x a H h- r ."> o — i_i a. - _
u 00 -* rg ^»'i
QO 0" O O 35 .-* u"i o j- c
lrg (*) —» r^ in '-) ->l >"-l -
•^ ^ ^ ^ r- r-
CO
HCO>^
<<w.CO
ZwCmXw
on
HHPQH3=
XW
73


E3
j
.1 j
i , i- I .1 1 1
uj aa < i ,
Z uj 1
D >( ; I
ia <n i
• i. 1
> _i *j
O 1 J *
j
1 ! t"! - -
1
j !'•
1
',
j
; ;
< X i ,
|o < *:
o > i i
'. >* i
~-
'j
-! . •!
t. j
CI i ";
<>
5 ' z*
>! '
i
. \
:
ij
J .'.I
'
;
*:
;
i
i
'. i -1
Xj -l •' ' ! •
i , \
. * '
'.? J ! 1
•''
I • :<
(0
i '-A1
.1 1 • i '
'
'
;
'-'i i t| :\A.
i n
:
J . .
'1
:\",
I'•J \ i
:
i
1.1 '
i . i
'
i iH i
:•'
j: 5
i:
II
'
1. t
S '
!
I
1'•! 1 8 -
jj
*.1 .'7
j
Z uj
3 > n n ^ '1 "1 H - i \ '.
i.
'
CC WUJ < -
i ' i. $ -j . 'i i"
,
;
t'-,
'
O ^ i <
i
'
- - .
:
i iCSJ
"'.J
.J '•
; ,'
•)
; j i
c T,
<\ \
1;
'. '
oj '.i
a.(/I .
*i . i ; i<
CC
•
^
J
< '
> \
• g f .-
yi i J "* '.«
; 1 ;i
X i I '
. '('.., 1
-!
i 1
^ i"
"
';:i . \
LU • i t i• i
j
a Hi 3 • i
i • !
j H !
(- < ,i \
'•}
</>' i
j
i i
aj
H- "•
l/l UJ ,
13 wl
I Z Q-o uj x
O. IV
UJ > X_l _ o UJ (J
^_ — o z z '
z3 H- WO < *-
a < — a: <o j >— uj a:
lAJVEltTI
SING
jCATALUG
AOV-
TDT
ADVER
TOTAL
GEN
TOTAL
OPE
1
P*Q Nl
toH
PHJ<<c
wC/j
!ZwPi
Xw
I
rn
HMPQHPCXw
74

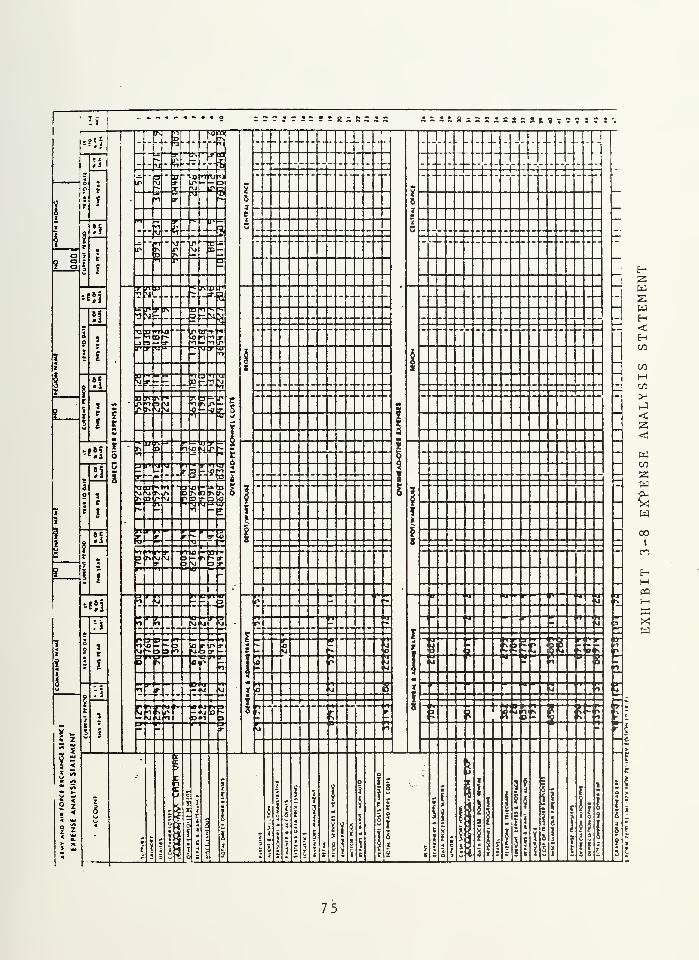
li — —_-_ — ———— ?% t*t r* r* r+ t+ r*"**s ** A »»Mfn.*«^ #*A*»V«*«4«4 '.
1
1
E?5l
?«rM
5C
I
- 1I—
§
r
CS
r
ii
i
3
... _... - ... ... -
I5ifi
C
• - - j
--i
"1
1
t
«
- f,-fi fi — -- - - ... - -j1«
IPr-D
rr
ir>t-VI
...
»!tj"
ii
z
\ \r
!3
E
|
mft
— ^" _lp(—
.- . . — ... — -.
LPE
r" vtp— r
\i Er_ -- _. « ~ • ™ . ._ - *
o — ?r r
•
!i
|
£5!
Tnn r r
i -ft
i'
I
SI
J
\
3"jr
' *~b~
<ofcD -
l"»
*i -otrnth
—
tr
3
T-1
n_
2
I
F-
i-
o
i
3
5
s
X» r t:I"" "*«irw
\r
s
i
5
SS
3r
!
s r.rl-rr nki
_, ._ _. .— . ._.
.
_ ,
s.p
IT 7S V
r-Tr
-ob-?
-n^
I
5X
I
" s
a "Jrl—
U
TWA
5
- -1
5»
8
3
t
51
t
!
rrrx -(
t.g r • OP -— .. -1!
—IT »vitr-ei r
n —,J _J
3--D—D JSC k
- P -
1
1 2
5
|
51
j
gr —-tr — trC
2
—r^r —VI
tto—3(V) 3p
i»•
1
«;i*
1mr njo
I
!-
I
p—
'
ni i*r
i
im
' u
2
9
2
t -. 1
3e
I
iJ£ fjikif pj r>
Ti:
II
l\ 3 1
^-rD t P&-'
:
1— ra i
!| 1 ? F<p
iC
'
5j u is 01 s3D "r °f
rrrtr-o r II
I
j
i
lh i i i
K
r
i
11 —
u
i Ki a >.I II ii n
lis
if
. <
c p-•II
D*-i pi.
I
1
i: P 1<! n
^- r>
— r^ '
'i -
8u<
-
f
>
cinEJ
I 1I £
r i
J
g c
r
T
s I
\ I- 3
5 §
i
31
* -
\
i
-
r
T
I
3
g
i
_3
i
!
II
!l
i
\
i
\l
5Si i
a
I
1
S
r
1
s
i
4
i! S
!
:
<
[
3
1
t i
3
|s
I
tji
i
i
is
I i
1 ii
5 9
HSi
75


expenses by natural division within a department. In com-
parison to the J. C. Penny Company report, which gives a de-
tailed breakdown of expenses, the AAFES report aggregates
various expenses under a few natural division or account
headings which allows the presentation of all departments on
one 11 X 8 1/2 inch page. Columns containing dollars and a
percentage to sales for the current period and year-to-date
are provided for each department as well as a column for a
last year year-to-date percentage of sales.
E. BRANCH STORE REPORTS
The J. C. Penny Company, F. W. Woolworth Company, and
the Army and Air Force Exchange Service provided the Branch
Store reports shown in Exhibits 3-9, 3-10, 3-11, 3-12, and
3-13. Besides these reports the expense reports in the
previous section are provided to the branch stores by J. C.
Penny Company and AAFES.
1 . J . C . Penny Company
The J. C. Penny Company report, Exhibit 3-9, con-
sists of two 11 X 8 1/2 inch pages. The first page is an
operating statement and the second page is an analysis of
operating profit and an operating summary by periods.
The Operat ing Statement is divided into segments for
sales, credit sales, gross profit, operating expenses, and
other expenses. Actual dollar amounts, actual percentage
this year, plan percentage, and actual percentage last year
76

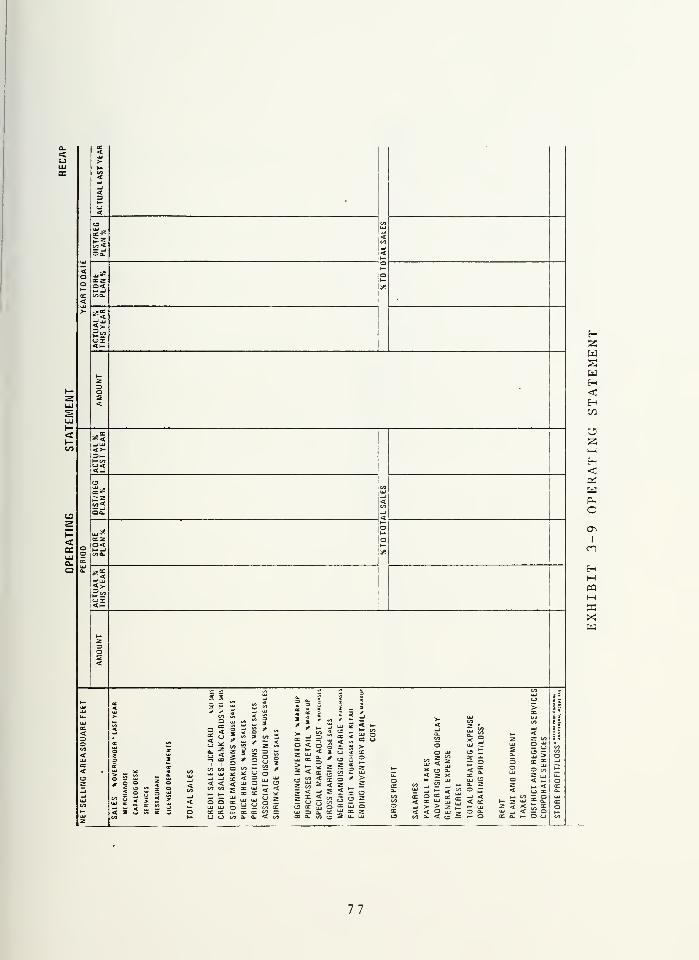
as
"X,lcnz° o<
HIZHswH<Hw
ozH
<aswPioo>
I
mHMpaH«Xw
* t— d*- £
5 S7 T o ' 5c/i co Q 55 ^
5=5?w> ^ ** a 3« fc .^7. < 3< S U <t QC
a. uj —* — -- —Uf -J -J cc <o i < < < UJ a £| o
< -< s < t2 * 2 OT
lu uj 3 —cc cc >— crU o 00 a.
00
aa lu^ tow 5 Z
uj < j]
5 U a.
2 - x
- -1 E < "01 ° .^ « £< 1 ^ u ;_i > > 2 £< < 5 Hi Zc/> a- < cj —
— O
o p-I << cr
< -— <C_3 CC
(O - O
X a_ I— O o
77


a
UJ Z ogguj
ac uj tra. OB Ol.
a
u
z<EC
<
tn
>EC
t/>
ACUJ
so
xu
rx
Xa
<
azn.
>
osot—x<
1
1
•JZi—
<
o<<
<
<1
u.O
to>-
zo
—1
>u)<
1
5z<XuDC
2
1
<
=1o<
<ooEC<UJ>
SALESCOST
OF
SALES
GROSS
PROFIT
SELLING
&SERV
SALARIES
DEPARTMENT
PROFIT/LOSS'
MANAGEMENT
SALARIES
SALES
SUPPORT
SALARIES
MOSE
HANDLING
SALARIES
TOTAL
SALARIES
PAYROLL
TAXES
ADVERTISING
DISPLAY
GENERAL
EXPENSE
MERCHANDISE
BELAUD
SALES
RELATED
PHOPEHIY
RELATED
AOMIhlSTHAIIVE
INTEREST
TOTAL
OPERATING
EXPENSE
InjV3
3
E°<r 1
»
1<
to
cO
Z V
^a^ >
S2|—
'
%>CCuj
%*i(JZo
TL z s2= s -X) a. »-
x x a_ a a"- UJ <
iRAGE SHON AND
> < I< "
_)
> ^~"
EC Or-Z
Z*:
oo j_
z3
< Ot— r-
UJ <ac
1 3en | O vi
2|*5paac I—C_ Z
Xas oa s
<VI
ac
<I
**Cw
io! z
<1 oc X
-!5 <-j| *
_,
<
r^ Z3O<
ac u.
a. ato
ooacUJa.
E-i
ZwswH<HCO
O
wPL,
o
I
mHHP3HWXw
(Ot9| .uionogi (6i/lL «•«> »C89da
78


o< • oto >rMZUV7, HIt-DI
O H
HOW
kj 4 -» a w « zozu u-i-l yi i. a«i ntf M a.>wOu/ rJ ai
^j cc 00 -# -.
xx aa _._. _, tt
ujvi iuuj 00 o O
wH<Hc
C/3
I
HHPQH
XW
79


HPiowPi
wH<oMo>-CO
NO[U2
I
HMH
XW
!I
,J J
,A. MIL M I i .- Mau >MkZH 4QH Zl a iz *
ountMrmiKiriMir, zou - En 'no
(3(i3C _ _OtUUOO.1 M^l-HL _• u. a. * > »-. s. u. t
•Z2 OM b. O
t^Ot-j M«,u LOJ3U an
80


i 2
3»tii
J *
3siIP
ifOf uCXJQ.
— if
oo
LPfVJooirn.jco enLP — J-
r\icD —
— ar j-
r*-CDf\j
— ojip^o —rviso
*5ZlUiO
'-.not
X fr-r-f*
03 CD
firvi
oca
cccr
— CDO OS
— n» as
3*-
xoe
Kit
flOCW OOOOOOOODOOOOO
LT»0S-rvjroi.— cue
P||opooOplPco o mm tr u*> IP
iLovjrn^oos
£*i
SOSO
M Kl IMMKj *VI «\J
2 Ep CD Qj ED CD CD
opoobooo Daopooouoob oo
ill
4;^£5S"
!*£
AJQt OJn— in
jjaxXujJ*iu
5 In j
cZu-tnac
p ip ip p ip ip
» QD m**i — ofcr r* j*
io**o jt\ap — r*-npnjr^osr-t^r— j-
oooSOO
TsOIVWNOS *OSO^OCD
o*«\jf\jr-
CDAifn —
C\MM \j—
—
1-— u I
iP3 inifipa paa
TOE t — in
ninuj^-SCSB "" T'_*uuji-iiu—ryui IX r
^3tles^ails5aor*«* too —Kjy— »i*ir
££££318
n nfifi *i rtM rr*Pripfifn^fifnf|^^^^H *^m#^
sjfvirviKifM<\jKj(VifvjKjfvi*MrJAJ^*^i^iAi uajaj \iimcj£j*vhm
nu.uj j <— Q,
JJiS -IS
Q CQ CD 93 CD dj UJ ^5 QJ8B88B8Soopoogoopoopoopoopoopooopoopoopoopoopo
^t* oi\jp r-f*i#ir«D j-osJ—oiPiptor-
sOfsjON
300DOO300
Tfn^s — Ai
3O VOf3 OOp O O300DOO
CD SOn — ooOlP^-o —
»J f»J *Vj f>^ AJ C4
88BS8B88888B38B88aoopoo30 o toooSOOPOO
I I I
' ISJSOtUQDC
I I I
rmrr-n\r, rr
30C
300pOO3 a o o oosoopoo
lit— fCDCm —
l l l— <\_
od a-
IMrt IMP**
u vjAjrvi
;S2B28aooo3oo
HwwH<Hon
oSZHH<c
wpi
o
Pi33
on
HHPQl—
(
SC
Xw
81


US
acu
i
EOf wDa.
gz
in
UJa. 2Ui
ac a¥a *|m ,_w «-J
g a
H2=Ww
<en
OzMH<OS
w
opa
z<OS
HI—
i
pa
Haa
xw
82


O O U) 1*1 1\
— •—(7.- "C"I . . .
~
_U,r\|<\l — <v
JM- i -It
' 'i-Cflir<~»-!<r w;
in) qiDrjrgivl —a
I
I ifi ^ in> u
arum ! u*
\OU* — 'U —inui o« -«
3
UlOUifKI I-> . i i . -1 • t -1 • -1
i . » , i , ! I.. -< 1 • i! it il il t t •?
jUTkig-mturirnrritn ti , ,r-«nii4aj
—
h ,nJ .
ci in »i -•q »o i lu-ivoriingi «»,<*: ril
, , i-i") ! *
— — v
83


84


- MJ.JiUlni Oi
« - — ivirvirv) f\j -&I5} afcl.1
E-ZWwH<to
en
uH
MH<W
oZ<
HrJ2
>*
<z<
i-H
I
CO
HHmMPC


are given for the current period and year-to-date. The sales
segment is further divided into merchandise, catalog desk,
services, restaurant, and licensed department sales. The
credit sales segment consists of memo entries for J. C.
Penny credit card sales and bank credit card sales. The
gross profit segment gives breakdowns on various types of
markdowns, shrinkage, beginning inventory, purchases at
retail, special markup adjustments, gross margin, merchan-
dising charge, freight, and ending inventory at retail and
cost. The operating expense segment is subdivided into
salaries, payroll taxes, advertising and display, general
expense, and interest. The other expense segment is divided
into rent, plant and equipment, taxes, district and regional
services, and corporate services.
The Anal y si s o f Operating Profit gives a summary of
sales, gross profit, salaries, operating expenses, and
operating profit or loss for each of the following areas:
1. Merchandise departments
2 . Ca ta log desk
3. Customer services departments
4. Restaurant
5. Licensed departments
6. Pre-opening / regional projects
The Operating S umma r y b y Periods gives a summary of
sales, store profit or loss, retail book inventory, average
86


cash on hand, fixture and equipment additions, and gross
return on merchandise investment for each period of the year
that is completed.
2 . F^ W_;_ Woolworth Company
The F. W. Woolworth Company's operating state-
ment, Exhibit 3-10, is made up of two 11 X 8 1/2 inch pages.
The operating statement is divided into the following
se gmen ts :
Total Sales Including License
Total Salary
Net Rent
Total Prorate
5. Total Advertising
6. Credit Expense
7 . Total Electric
8. Wrap Supplies
9 . To ta 1 Repairs
10. Total Maintenance
11. Total Community
12. Security
13. Total Display Material
14. Total Supplies
15. Total Services Purchased
16. Total Miscellaneous
17. Total Opening Expense
18. Total Other
87


19. Total Sundry
20. Total Store Expense
21. Estimate Store Profit
Most of these segments are further subdivided giving even
more detail. For example sales is divided into merchandise
sales, department 1340 sales (food service department), and
licensee sales. Besides regular entries several memo
entries concerning hours worked, salary, and department 1340
expenses are provided. Actual dollar amounts and
percentages to sales for this year (abbreviated on F. W.
Woolworth statements as C/S), percentage increase between
this year and last year (abbreviated on statements as C/S
incr.), and this year's actual dollar increase over last
year's are given for the current period and year-to-date.
Memo amounts are also given for various types of supply
inventories and inventory increases.
3 . Army and Air Force Exchange Service
The Army and Air Force Exchange Service has four
main branch store operating reports. The Branch Operating
Statement Exhibit 3-11, the Income and Expense Operating
Statement Exhibit 3-12, and the Analysis and Statistics
Statement Exhibit 3-13. The Branch Operating Statement is
provided for the retail, food, services, and vending depart-
ments. The food service version of the Branch Operating
Statement was discussed in the cost or non-retail department


section of this chapter. Because of its similarity to the
retail and other branch statements further discussion is not
necessary .
The Income and Expense Operating Statement is a one
page comparative report prepared on 11 X 8 1/2 inch paper.
It is split into five sections. The first four sections
detail the retail, food, services, and vending department's
sales per capita, net sales, gross profit, direct personnel
costs, direct other expenses, depreciation, and direct ope-
rating profit. The final section summarizes the four sec-
tions above and details the general and administrative,
depot and warehouse, exchange region, and headquarters per-
sonnel costs and other expenses, concession income, other
income, and average military strength. Dollar amounts and
percentages to sales are provided for actual this year, last
year, and plan as well as a percentage variance from plan
and last year for the current period and year-to-date.
The Analysis and Statistics Statement is a two page,
two part report prepared on 11 X 8 1/2 inch paper. Each
part is split into five sections as delineated below:
a. Part one, section one gives the following employeestatistics :
1. Computed average number of employees
2. Sales per employee (productivity)
3. Average wage cost per employee
b. Part one, section two is an analysis of grossprofit .
89


c. Part one, section three is an analysis of otherincome .
d. Part one, section four is a personnel cost variationreport .
e. Part one, section five is a recapitulation ofexpenses .
f. Part two, section one is a direct versus concessionsales breakdown.
g. Part two, section two gives operating results as a
percentage of sales.
h. Part two, section three gives the number of overtimehours and the related percentage to regular hours.
i. Part two, section four gives the number of sickleave hours and the related percentage to regularhours .
j. Part two, section five gives inventory statistics.
F. EXECUTIVE LEVEL REPORTS
Executive level reports vary in style. In this area
reports were received from J. C. Penny Company, F. W.
Woolworth Company, May Department Stores Company, Carter
Hawley Hale Stores, Inc., and Army and Air Force Exchange
Service .
1 . J . C . Penny Company
The J. C. Penny Company furnished two reports, the
J . C . Penny Stores , Exhibit 3-14, and the J_^_ C_;_ Penny Stores
Operating Statistics , Exhibit 3-15, which it provides to
executive level management.
The J_J_ C^ Penny Stores report is a condensed income
statement similar to that shown in chapter II. The only
90


JCPENNEY STORES(AMOUNTS IN MlUIOMS)
0CT3ER1952.
ACTUAL HUUGcTT35I
YEAR TO DATE
actual Budget Actual
SALES""Merchandise
Catalog desksServices. Restaurants. Licensed Depts.
Total sales (1.660 vs. 1,678)
X Better (worse) last yearCCW'RATIVE STORES X
TOSS PROFITMERCHANDISE
X TO MERCHANDISE SALESTOTAL
X TO TOTAL SALES
OPERATING EXPENSEX TO TOTAL SALES
OPERATING PROFIT
% TO TOTAL SALES
FACILITY AND SUPPORT EXFENSEX TO TOTAL SALES
% PROFIT
X TO TOTAL SALES
ACCRUALS
ADJUSTED STORE PROFIT
X TO TOTAL SALESX Setter (worse) last year
INVENTORY AT RETAIL
Beginning of period - adjustedEnd of period - preliminary earned
. X
X
X
THIS YEAROVER (UNDER) AlLOhA^CE
a:. X
. X
! x
. !~x
!~x
tx
!~x
Txx . x
. X
'. X
TX
T%
fx
. x. X
LAST YEWOVER ujnder; ALLOWANCE—IE— —*
. X
EXHIBIT 3-14 JCPENNY STORES
91


JCPENfEY STORES OPERATING STATISTICS
tERQjflNDlSE RELATED
fw the mm—Purchases at rftailMarkup X on purchasesFreight x - purchases at retail
wrktownsstore m4rkdownsPrice breaksPrice reductionsAssociates discountSpecial M/U Adjustments
Total markdowns
(Amounts in Millions)
OCTOBER
i*T — - 1981 •
Actual Budget Actual
! x '.x
. X .X'. %
X to Mdse, Sales
XXXX
YEAR TO PATEPurchases at retailMapkup X on purchasesAdditional MarkupEffect on Markup XFreight X - Purchases at retail
HWTCWNSStore markdownsPrice breaksPrice reductions'teSOCIATES DISCOUNTSpecial M/U Adjustments
Total markdowns
. X. X
X to mdse, Sales
OCTOER
ACTUAL BjDGFT Actual
YE^R TO DATET3S7~
actual Budget Actual
Salariesx to total sales
Payroll taxesx to total sales
Advert i singx to total sales
Di splayGenepal expenseInterest
Total operating expensex to total sales
FAC ILITY AND SIPPORT E>^NSEoccupancyPlant and equipmentTaxesDistrict and Regional ServicesCorporate Services
Total facility and support expensex to total sales
EXHIBIT 3-15 JCPENNEY STORES OPERATING STATISTICS
92

major differences are the lack of a variance column and the
addition of memo inventory figures, though, there are some
minor changes in title names and presentation.
The J_;_ C^ Penny Stores Opera ti ng Statistics
summarizes merchandise and expense statistics. The report
provides merchandise related purchases, markups, markdowns,
and freight as well as operating, facility, and support
expenses for the current period and year-to-date. Figures
are provided for this year, budget, and last year.
2
.
F . W . Wool worth Company
The F. W. Woolworth Company provides a Retail
Operat ions Summary , Exhibit 3-16, in addition to an aggre-
gated operating statement identical in format to Exhibit 3-
10. The Retail Operations Summary , a yearly report, is a
five year comparison of sales, gross profit, merchandising,
expense, and square footage statistics. Dollar amounts and
percentages to sales or percentage gain per square foot are
given. This report also lists the name of the manager
responsible for the store during the most current period.
3
.
May Department Stores Company
The May Department Stores Company furnished a
combined earnings report Exhibit 3-17 which is similar to
the condensed income statement in chapter II, but in a
different format. This report provides, in separate
sections, net sales, earnings after interest and before
93

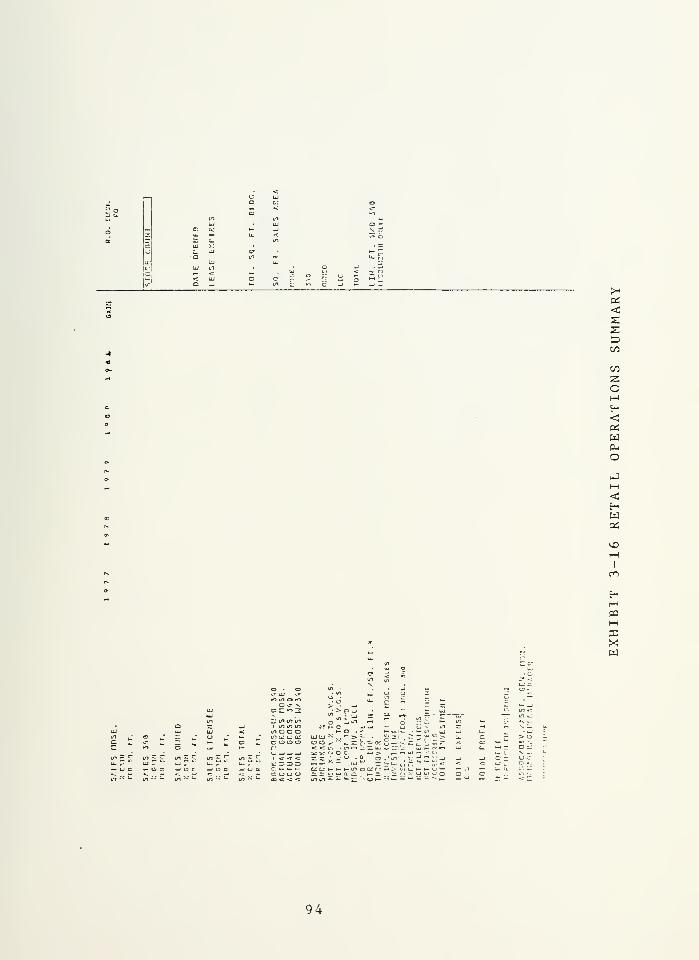
1
PS
<sa00
00
OH
<!PSWP^
o
t- u h- """
' c -j o e:
QO- \ ;. . —j £O C >-» 3 > P -j a ao.
2<si«ntn otfl
L- m ^ o ;:c * u U
v> o o o o .
lh u: £_- a: UJ LU N •" >l" _" c=l. S
1c o o o o c Off
'
< <1 — _J a c >
1 ^ *f < X VJ . Lt o -•ml . S; t^.'3D3c^ t; o or
C O <_) om «t <s *t tn to ~* *- ** c ; (j *•* : * ~-' — " —
a. -
<HWPS
vOiH
I
en
HHpaM
X!W
94


at;
1 <-
U O »** =Ja. »-*
t/1 Q i-J
UJwJUUJ
r: < uj«-i
Cj <_> (/»
Z>CJ
(-] m in
uj r.
O (_> om or51. U- -j m
PS
CO
CO
oHH<PiWPiO
<HWPi
>x>
HI
CO
HHCQH
XH
CL <5
•— — UJ i/l
DS— »-«:'-.-'
•— tjr l: m
' z: " r: ^ <j " io '
95


> 00z Ul
Jz5 <Si18_ cc
5 Os *"
; oo
I
00
3 O> z15uj cr
5 <
e
§2
* t'
s i|
z
I iv
II-
Zl
!2 i 1—* 2 ,-j
z
u
r-
1!
5|cjl
i n- 1
'
1! ' I
!!
; |
> 1
HI
1
11
MM
9
s -
—
111£ fj-| !
I
J"!= j ]
M| |' 1 |
x
i 1
x
5- —
on
WH
<
Souwptf
oHC/D
I
I
WO"ZH
OS
<
Hpai—
i
><w
96


taxes, flow through, return on net assets, gross margin,
operating expense interest expense and other income for each
of its department store companies.
The net sales section provides actual dollars this
year, the difference in dollars between this year and last
year, the percentage of change to this years sales, the
percentage of change to this years sales on a store for
store basis i.e. excludes new store openings, and a dollar
amount and percentage to sales better or worse than plan.
The earnings after interest and before taxes section
provides the actual dollars this year, the difference in
dollars and as a percentage between this year and last year,
a dollar amount and percentage to sales better or worse than
plan, and a percentage of sales for this year and last year.
The gross margin and operating expense sections give
actual this year, better or worse than last year and better
or worse than plan in dollars and as a percentage. In addi-
tion the operating expense section has a column for the
change in operating expenses versus last year.
The interest expense and other income sections give
actual this year in dollars and as a percentage to sales as
well as dollars better or worse than last year and plan.
"Flow through," the increase in profit due to
increased sales has columns for last year and plan, while
return on net assets has columns for this year, last year,
and plan
.
97

4 . Carter Hawley Hale Stores , Inc..
Carter Hawley Hale Stores, Inc. provided an
Operating Results , and a Balance Sheet report.
The Operating Results report, Exhibit 3-18, is again
similar to the condensed income statement in chapter II.
However, like the J. C. Penny Company report, there is no
column for variances. Additionally, there are two statis-
tics added: average assets employed and return on assets
for the year-to-date.
The Balance Sheet Exhibit 3-19 is a detailed
accounting of the company position in its various asset,
liability and capital accounts. Dollar amounts, rounded to
the nearest thousand, are given for this year, plan, and
last year
.
5 . Army and Air Force Exchange Service
Army and Air Force Exchange Service reports for
executive level personnel are identical in format to those
received at each of their branch stores, and therefore, need
no further review. Each store's operating statement is
available to all levels of management. However, each higher
level of management receives reports which aggregate all
branch stores within the purview of that level of manage-
ment. At the headquarters level aggregate reports are
available for Europe, Pacific, overseas combined, continen-
tal United States, and total AAFES.
98


SALES1 Retail
2 Cost
3 Leased
TOTAL
5 Finance Charges
GROSS MARGIN7 Heta.l
8 Cost
9 Leased
TOTAL
EXPENSE11 Payroll
12 Non Payroll
13 TOTAL
14 Other Income
OPERATING15 PROFIT
CARTER HAWLEY HALE STORES, INC.
OPERATING RESULTS
($0001
SCHEDULE CHH 14
MONTHTh.. Var Plan lib Vaar
S 1 % 1 S %
1|
Z3 RETURN ON ASSETS
YEAR TO DATEThia V«r
1 XPUn
$ XLaa Vaar
$ X
1
i"
l
1
16 Pre Opening E*pense1
1
1? Real Estate Cost
lnr»ve:t, Benefits &18 Co'O Admin i
! i
Phi- TAX19 EA.iNINGS
1
|
! 1
Ff 'ERALSTATE20 INCUE TAX
21 Nl ' EARNINGS
22 . ge Assets CTioiovcd jno .'».,set Turnover
Gate .
Date.
EXHIBIT 3-18 OPERATING RESULTS
99

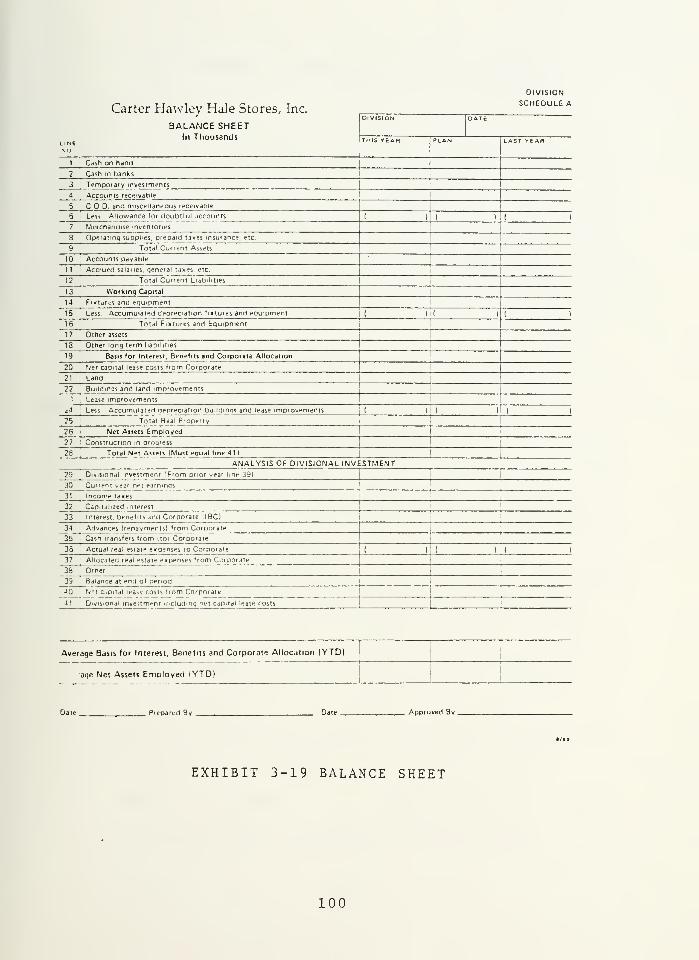
Carter Hawlev Hale Stores, Inc.
DIVISION
SCHEDULE A
BALANCE SHEETIn Thousands .AST V E Afl
Cash on hand
Cash m hanks
_Temporary investmen ts
Accounts receivahle
C O 0. and misce llaneous t eceiv a ble
Les» Allowance for doubtful accounts
Merchandise inventories
) (
Operating supplies, prepaid taxes insurance, etc.
Total Current Assets
10 Accounts payable
1 1IAccrued salaries, general taxes, etc.
Total Current LiaoiMn
13
14
15
Working Capital
Fixtures and equipment
Less Accumulated depreciation fixtures and equipment
Total Fixtures and Equipment16
1 7,
Other asse ts
13 !Other long term liabilities
~19
20 ' Net capital lease costs from Corporate
21 Lang
22 ' Buiidmas and land improvements
Basil tor Interest, Benefits and Corporate Allocation
Lease improvements
ANALYSIS OF DIVISIONAL INVESTMENT29 Divisional investment (From prior year Imp 391
30 Curr ent year net earnings
31 ' Income taxes
32 Capitalized .merest
JLJO41~
Balance at end of ppriod
N<M capital lease costs from Corporate
Divisional investment including net capital lease costs
ii Less Accumulated depreciation Puildinqs and lease improvementsi
'»
1|l
I i
25 Total Real Property|
26 Met Assets Employed1
27 Construction in progressi
1
28 Total Net Assets IMust equal line 41
)
1
33 Interest benefits and Corporate HBCI
3-4j Advances (repayments! from Corporate
i
i
35|Cash transfers from (tol Corporate
I!
36 Actual real estatp expenses to Corporate! ( ) i i h i
37 Allocated real estate expenses from Corporate
38 Other
Average Basis for interest, Benefits and Corporate Allocation (YTDI
aqe Net Assets Employed (YTD)
Prepared By Approved By .
EXHIBIT 3-19 BALANCE SHEET
100

IV. NAVY EXCHANGE FINANCIAL OPERATING STATEMENTS
A. INTRODUCTION
This chapter discusses the financial operating state-
ments used by the various levels of management of the Navy
Resale System to properly manage the local sales activities.
This chapter is divided into five main sections, retail
merchandise reports, cost or non-retail merchandise reports,
expense reports, branch store reports, and executive level
reports.
The reports discussed below, which are provided to all
levels of management throughout the Navy Resale System are
identical in format. The only difference in the reports
received by successively higher levels of management is the
level of aggregation. The following is a list of aggregation
levels from highest to lowest:
Worldwide - Aggregation of all exchanges worldwide
and is provided to headquarters level executives
";:" CONUS - Aggregation of all continental United
States exchanges and is provided to headquarters
level executives
""" Overseas - Aggregation of all overseas exchanges and
is provided to headquarters level executives
* Region - Aggregation of exchanges within a region
'and is provided to regional level executives
101

-X-
Exchange Complex - Aggregation of the main exchange
and each branch exchange under an individual
exchange and is provided to executives at each main
Exchange with branches
Exchange - A single exchange report provided to
executives at each main Exchange
Branch - A single branch exchange report and is
provided to executives at each main and branch
exchange
B. RETAIL MERCHANDISE REPORTS
The Navy Resale System provides one major merchandise
report titled Retail Depar tmen tal Operations , which is shown
in Exhibit 4-1. This report gives details of each department
used by a particular activity or its subactivities. For
each department three major groupings of figures are pro-
vided on this report retail inventory, sales, and gross
profit. Figures are provided for the budget, actual, and
actual last year. All figures are rounded to the nearest
dollar. The retail inventory group includes the dollar
amount at the beginning of month and end of month (EOM)
for the retail inventory as well as computed percentages for
the months actual EOM inventory as a percentage of budget
and last year.
102

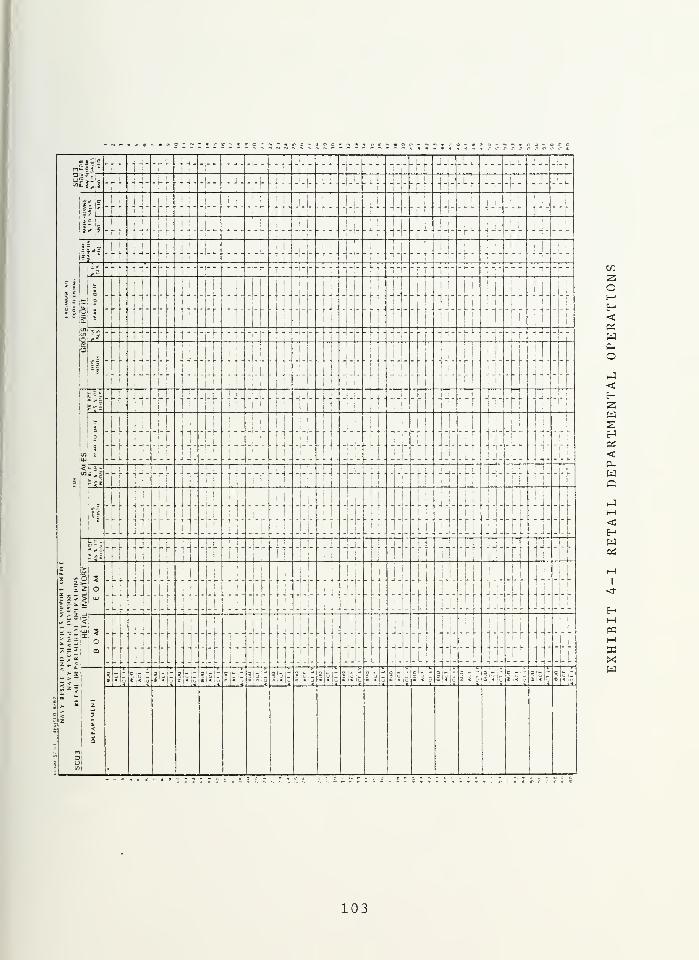
n:*^c
----r: ]f -;-- ---... .,_—
..ti. Jl.Ll . J.,. 1 ., M L . -|J--;4
-•>fesLur ] i
1
, ; 11
!li!
-r: ltlF--N-
1
1
!i
TT| L.Ll.T.Tr.li Tiri .
i
|
.
ii
1
1
3* ii -(- 1-1 ! i 1 1
i TT 1 IT Jj | ..[). J.I.41. \.\..[ 1
i
11
1 jj M
jH-U I1.U.JI ...-i±.!
_
"rriT"!"t'"""" r l.Jl-j-l lL.ll
:---pr ~---|-r • - - - --j. j. --,--
r |-,-- --
1
ll Is ... '! 1 II 'I TTT! ii "4 t::t" [.It-Mil[ ij [ ] [
1 ?
u> -j--
i
1 Ml\\-\n fl If
t ... J-
1
Ii 1 "i 1 M !
n 1 * * iI
:;
i 1 r 1 I
I
°T 1
!| 1
i1
(
- 4 -i|
i Tf:~rt"-LL . ... . .J- . L. ...
' T T "ItI
I
--f-
liiii- ; 1 : 1I Mil , M tj_ i
. J...L ^....
fP4! {tjf n- .k.ll "fl"|T"'T'[T""1
1, '1 ,1 1 M Jl_ii__i_
s.Ll
t/i t 1;
Uj. - U t
-l-i- --r ii-
4-U .1 .!-
I
"" 1
1 n i1 n
::::::::i-i-i-it.i.i
1 Mill
t:ii:ttji;l[
%I4 TITR-[ '; Tf
'1-1'Li. .J.J.I [j
.1* !"] j.i1 ]
ii 1
'
M""i "M
if 41
^7 i
i
II L .. J.
.L. Mill i
XL. ----- ....
.i.L.. ....... -It
- 1i TTT
i|r :: :::
L J JI
]]...[..]'.I
J __ MM. 4.1- . ... _ .
J
. -]---[-
|||-b-|1 i
il |H| |'..j ' .'
J| ,j !
— ..:... nrrt 1 i j.
i 1
•i Mw
3 z_ C
5 °J L J
-4II | 'iii
.L ...... . ..i it j tnnt: ::::::: : 1:|.±....JXlu
^ - |-4
-": <!
a*--° i P
1I
i
--H--r -Il-
III II r.Tt.i. ft:"j.~:t...QL ^ Z
- i .....l-ii
it— 4,4.-11-
• I"- f-at
Jj
*- *
<Z
cu
i < lu •!« u « u ls : |i:i:- 0'. - a'~ * c - 1- 0!- - - i
< U B|< | u e;<!C • 1 « ! U 1 < 1
Z
I
i i
C/3
oM
<OS
W
o1-3
<HZMs
<PUWp
HWfid
fH
I
PQMPCXw
103


The sales group lists the month and year-to-date sales
and percentages similar to those above only with the substi-
tution of monthly and year-to-date sales for EOM inventory.
The gross profit group records the month and year-to-
date dollar gross profit along with corresponding percent-
ages to sales, the initial markon percentage year-to-date,
mark downs as a percentage to sales for the month and year-
to-date, and provision for inventory shrinkage as a percent-
age to sales for the month and year-to-date.
C. COST OR NON-RETAIL MERCHANDISE REPORTS
There are two main reports produced by the Navy Resale
System which provide financial management information in
regards to cost or non-retail merchandising activities.
These reports are titled Service Departmental Operations and
Service Department Employee Benefits and Other Direct
Expense. Examples of these reports are provided in Exhibits
4-2 and 4-3.
1 . Service Departmental Oper a t ions Report
This report gives details of each cost or non- retail
department used by a particular activity or its subactivi-
ties. The report gives dollar amounts for beginning-of-
month (BOM) and end-of-month (EOM) inventory at cost, sales,
gross profit, payroll, employee benefits, other direct
expense, equipment depreciation, net departmental contribu-
tion, number of employee equivalent man months, and average
104


503
II Mill
i 11111-44-!I||lj
1. 4U-444 1
il'M MlM |
r ', -. i ,. 1 - - t .: ,. .
i Ml ! 1 ii
!
:
i M i Ml
| 1
44 i| III1
1 II 11
1
1
•
M i M= 5 ;
1
;> 5l !
Ttml': hi!
trrjiTifli"!T[f! tf
.. ..:r
....
Ilill lllll!
1 Mil!
£ i *" \* '
-j-p H | -j ttrti'iTtM" m r -iTrrr-irrrt lifri jirr-
fh II 1 MM Mill Mil! iliijj
1 _I.J-LLII.JJ.LLIJJILL i'JIi
i
n! 1
11 !
I Ml M : :
I -
fr H-trr liirMtrliltd Lll
||||l
1 M8 |SS. --\\\ o 15,'" . riii 1 1 1 1
- -j-;r t -i
- -i-i- -{•
-r
--i
—
1 1 M M i
•,
-
tr ! t
-rt n -\ nT;
-
r
"jll'::: -tHi- jll
!
1
;
i II M::ff:4f::!::t
.|..J.L| J...LI J-l JJ-Ll
...4 - • - -
IslisTtl TTF-jr trrtrtrrfrft...... ...
r
.......
£ ! i
j? !
''
'
1 1 i
.J.I J.
I
I1 11II - - 1-
r r I
,
1 |L 11 LL 1
!
;
.)..} r -|-j-
r f r-|--
11 Ml 1 i u 1
:::: n:::i::t 1 : 1ttM 1 M '.j..U.
tr-
-|--hl"lTl"frtT .....j.J.|.L...j-J.
^-,-U.1
,.(
...r
. 1
:
i
: ' M
Is -41 :J::j4:
1
44--[{{}
... ill. 4 .44II Ml 'Mi
1 1 1 I
1
. ..ii J--4 -, - 1 - 1 -'-^ 44-4
11 1 1 11:4
i iliin -4 hi •tit'-rmntr f-rrrr -]-"!""( r r""r
ifil-ilil
! 1
T'T
! MM M
...Lu . 14.Mil L Jfl] j-4...I.J. 1-44 J-.... ...4
1 Mi
i 1 4 1 4 r1 [
1
-!» a1
!
|
.i
-r UJJ. "Mill 'T!"MrTrrfi"i""f 44114 ""iTMi liT't 4"4
ll Mi- Ni 4: i
sh 44 :i:|lt||:
1 ; ,
1! :rmr.j±.ii.::::... 1
1
L..J...L... .4 ...... Ill......... ....... J..L1 '
:
:
' rM! n
iv -'i 4m
«5_ ij
!| ||l
' fir ff:
!
i'
! 1 i 1
...Itf.MTJE L !||L Jl 1 J!1 1
j: 4 i Ll J ML
i«*Li > 445zs|«l
4 ml4f-4 ifM I
!
I
r~i 1
i
- - - r1
1
--'-Hi1 11 i 1
I . MM! 1
..I 1 M j. I.I.M
: 1
II M 1
i "H hi- 1 11
1
•• -44--44-^- f-i-rIflt ' -jt-r-rf
* _|l|
'- 'il' 42• 4
4-1. 413.1. :Miii 1
1 l
44M11
. M M i
[41 !
[
m 1
\1
!
' MM '
f'L.li 4 ..4 jM.J-4}-
M mm if 1 1 rt "j iTr
SI - l\i\* Slili Sills Sis!! iliiililsl liimil; ; Imslslill Sl»l*ls
bil S•
zoHH<JPiwp-
o
<Hzw
HPi
<Cd
Q
Wul-l
>pdwen
CN
I
<r
03M
X__
105


_" ~ «->»~»«_: _._.*_.:._:_._.£"££;; E*£*£s;:££2."S£i.?? .;:;..
III i
1LUJ |i!!|
f+fnHHtj.J-LUJ-JlLti-JJ
1 I
;
! !
' '' ' II
:.:;:_:::_:_-;.:_
i-r- -r- -"!"!j
r ]jT|« £ z[Mi [11
* 7_
a riTii-rh-
L_i.fn3.j_Li.iJ\.jj [-1. Ifil]
II II !ili| !l
Ht tritr.i" 11
ii.l|
ji 1 |Mi ji
.:... ..,,L. ..L..:
)!...[
. ?
i If c
^ _ z
u5j.[i
! |]-ri-
'{lv"m .... ..|. . ...
i i
|
M i i : i
::.::]:
m JIM i i
. X
~t\ il i-f
u » 5
I
i]4- J it |l !
,
:::: t : ::ti :::
1
14 J-L-L .J_._L
.. . J L
-
i til: 1 1 iV ! mi hMI
.!_* = _ if:
• 'ji-"-
:|J:::t[l|
... J.J1LI...J.1
TrrrfTr r
1 I
- -• ij—1 --I--4iii i
hill i Mi=!? !
1 1
II--
nrrHII ' ill
1 it; !
7
-|.|-lj-|-!-Ut
.-l
i-rKH+.f-^
- III III 1
ill..L J...L _.;.j.l. . V .U..t -|-|-hj |.|-|-u
--1J4
Is
1
: j::1 M—
" J— - Tji ["Iti [!'
V
"TTl I"ITT
' Ti ifflPWfl.LMJ-i-U ..'.!.[. J...L
"ISI
l
H--H
ii rn!
::t:: ::::::> if
i
!
Mil il
trrrrrr ri"
MLl 1|!!l '
1
i" :::::;;:'
:::
q4Hi 6-
_! *
r at
* <
4-- L
J
1
'
1 ! !..... 1 ..JJ Li J.-- 1- -J ...LI.......
_L _ 1_ JJ_LLL J.iLl J-..... I.JJlLL. J..I- i2z*
i i rl 1 ill 1
^ > T.- __ £~
__ -
- m5
t :::::|M|j
.ILL _
1
' L ::!!:]:1
ii
-iT \\—
'iii+h ni: r~~ r
U_ > -
g_g * ? *
i 1
Ml: --|—l!| 1
ft' !!l
|
::|:!:i::i|J[rj
1
1
..L. ......
> >
z5cc<
8,
i|f jislsis 1! Iiil?
.
J|5 1j 5 » 2 5|5 j £!H|i|ilii!|!!|i|i!s!S| i ijillSilili iiijl|l|l|i iji liilij. .jslflji.i: jjj«|{|s|i|. .|i|f|:ji|.
__
ou
w__
zwXw
CJ
wPiHoPi
w
HO
M
wP3
WW!H
OPi
Sw
HwsEHPi
<CPhwc
woH>PSwCO
ro
I
sj"
HMPQ
_-
XW
106

dollar sales per man month. For each of these items, except
the inventory figures, dollar amounts are given for budget,
actual, last year, budget year-to-date, actual year-to-date,
and last year year-to-date. Only budget, actual, and last
year dollar amounts are provided for the BOM and EOM inven-
tory figures. In addition gross profit, payroll, employee
benefits, other direct expenses, equipment depreciation, and
net departmental contribution are computed as a percentage
of sales. All dollar amounts are rounded to the nearest
dollar and all percentages to the nearest tenth.
Most of the terms listed above are commonly used.
However, number of employee equivalent man months and
average dollar sales per man month need further explanation.
a. Number of Employee Equivalent Man Months
The number of employee equivalent man months is
used by management to determine the average dollar sales per
man month at the completion of a month. It is computed by
dividing total hours worked by 173.3.
b. Average Dollar Sales per Man Month
At the completion of a month, average dollar
sales per man month is computed by dividing sales by the
number of employee equivalent man months. This statistic is
the key element used in budgeting direct selling payroll for
the next year.
Budgeted direct selling payroll is computed in
the following manner:
107


1
.
Budgeted dollar sales is divided by the budgeteddollar sales per man month to give the budgeted equi-valent man months. The budgeted dollar sales per manmonth is last years average dollar sales per man monthadjusted based on management's forecast of the futuresales and inflation.
2. Budgeted equivalent man months multiplied by budgetedaverage wage rate gives budgeted dollar directselling payroll. The budgeted average wage rate isthe median wage rate of the department during the lastthree months for which actual results are available,increased by a factor for inflationary wage increasesand merit increases. [Ref. 8: pp. 7-10]
2 . Service Department Employee Benefits and OtherDirect Expense Report
This report gives a more detailed breakdown of the
employee benefits and other direct expense information than
the Service Departmental Operations Report. The following
eleven items of information are provided by department:
Provision for annual leave, employee benefits-local
national, taxes-FICA, retirement annuity contribution, total
employees benefits, area support allocation (allocation of
regional expenses to the department), stationery and sup-
plies, repairs and minor replacements, utility expense,
miscellaneous expense, and total other direct expense.
D. EXPENSE REPORTS
The Navy Resale System has no separate expense reports
as discussed in the second chapter of this thesis. All
reports concerned with expenses are included in the branch
store reports, and are examined in the following section.
108


E. BRANCH STORE REPORTS
All Navy Exchange store financial operating reports are
similar in format. The reports are provided on 11 by 8 1/2
inch paper with current month figures on the left-hand side
and year-to-date figures on the right-hand side separated by
a column with a description of the item and its correspond-
ing account number. Under both the current and the year-to-
date headings, columns are provided for budgeted dollars,
actual this year dollars, and actual last year dollars, as
well as adjacent columns for percent to sales. In addi-
tion, columns are provided for percent variance to budget
and percent variance to last year. All dollar amounts are
rounded to the nearest dollar and all percentages to the
nearest tenth. The branch reports are normally received one
to two months after completion of an accounting month.
Each main and branch exchange receives the following
financial operating reports from the Navy Resale and
Services Support Office on a monthly basis:
1 . Retail Operations
The Retail Operations report, Exhibit 4-4, is
divided into five sections. The first section provides a
summary of sales, provision for inventory shortage, cost of
sales, total cost of sales, and gross profit which are
extracted from the Retail Departmental Operations report .
The second section of the Retail Operations report provides
a breakdown of receiving and shipping, direct selling, and
109


.'' I ri 11 i!
>i i ii
i ii
1
o
1
I.IU
trt 1tt!1t
klL -LLL.JJJ_l_LliJJ-ULi4J-LLLlJJj.LL
-If !---tf{j 4Lflj-|lfl|---!-: t[
I-5 T l" littrmitrHirr'-rtiil -:;-— --m
1
- «i rr r-I1
1
J
itr-riifi-Kiii-|4fj]li-rHHHrlHtNH. :
£ 1
1
1
.|:si-r h -j-l-j-ft«-.-
-rrtl— j- Mil j-j-M-j j- "!"!-|T;" r[
-j- h-r'
'
i :'
:
'.
'
.
|Hi. ..j..... n
ll j| j
!!
........ J. .1.1. 1. j.l.i
' 1 : r
|| !j MM
-l-MrMn-M4l„s i ,
;
i
i
h<
i l<
f1
ft.M 1L 1 .... IJ1. .Lj.. . Ill ... .
P--4 ).-|- [j-l ]
1 i !i Mi HI
1
1
1 j i i li J i!
r
i-rrhi-Tl-; rliy"rrj-]-|--H
i !I
1" M |"Mj|T[ lljl'M
I
i
] [1 |j
z2
5 |!
o
1 1
i ,|<i ; isl z Li I !
s " 1 £ s= 5 lis s 2 i L SI
5 sis L S'l s 5 u s 5 - Sir
«sw i^bilsi lid? i
II illllii! ilstiSsilS I lillilii!
V III 1 Ml S 1. i\
I | ,1;|||
]§ ij|| ill
i :
;
'
:'
! i
i
i
1 hC 1
Is ijil ^
;|f!!illi!!l j ^:Hi£Sai;i I
\
\fj_ j
u
3
2v;l-L ...
-J-i-M rhH-htii -,
JlLLljJll .1 1. IJ
J.|. 1.....L ....... ..
.1f
[]]km\]
Trainman.......... .........L
riJjiiiMU
MM III
tfl!l: t
1r-r-H"-|-|-r
H'li-t-tft frfh iHj'Tlll 1 1 II III !
7 ~ _ ill-ol'*j
1
— 1— ill— J"
'j1"r,
"rT "'I
: '.-^H t----- i L J
'
1rrl" Ml" i
i
— —_ <
-i
•* "1
rl'jl H |"T " "j'Tff 11 ;
---|--
r T1
' '""1 fi-r-ir--i
°x _:
zl
111 LI , . .1. J!
ii !' I d Li ^ !
i:p:::J:::::: i:.:::::::[I
IJ. L- __•< ~ i
_ *" *
^ <
at
J<z
U
= l S ..... J
! r r
»*! [•
U M i L . ...L....J... Mr i
1 T 1
1"-j---[ ---j--fj-;
j
rr 1j
at 1 | \1
\
t-. -;-
j
-r + -ii- --r
5--UI" "T|"M ;"T" r
i
' v ":
" r u' 1" .j.|.|.p^.|-j. . -H-j-i--r - r H-H-M- -4
1 4 111-....^ ............. ....
M Ni
ffi::# ::!
|r t ii—
r
en
OHE-
<W
o
<HWPi
<rI
H5C
X
110


procurement payroll and related benefits, as well as, an
aggregation of total personnel costs. The third section
provides other direct expense broken down into the follow-
ing accounts:
310 Area Support Allocations -- are the directly re-lated merchandise expenses pro-rated to each exchangeby the exchanges regional office.
* 313 Stationery and Supplies
*" 315 Repairs and Minor Replacements
* 317 Utility Expense
* 319 Miscellaneous Expense
";;" 305 Equipment Depreciation
Besides the above breakdown of expense, a subtotal of other
direct expense before equipment depreciation and a total of
other direct expense after equipment depreciation is pro-
vided. The fourth section provides the total retail net
contribution. The final section provides employee equiva-
lent man months and average dollar sales per equivalent man
month for the receiving and shipping, and the direct selling
departments, as well as the employee equivalent man months
and the procurement payroll dollars before allocation for
the procurement department.
2 . Service Operations
The Service Operations report, Exhibit 4-5, provides
a summation of all service department operations from the
Service Departmental Operations report. It includes sales,
111


i;si"rh hi— |ii"i"rrt"! iiiTh", "i"iTi"*ii" : "i" i't''"f i*hL
i"m r— "
O'u:
1
l
i
1
1
i
i i !
i 1
1
I 2 1
i
I
i
i
i
i
|i !JJ!LL1 J!
!!J! 1ill
1 1Ml ji iiJl M|llll]l|l
1 : l :: :::: i :: : i ]i;[ r: i:i: i ];t
;^-r—-r:Hri--—:
,.,. ,-,-a. ,.--...-,-,. ,-:-,..
hi!! M { 1 ! 1 I
ii
i 1 1|
1 1 1 ! !
is«|-j- • j -j -j-|-i- (- j-4 -j- --(- (- 1 j J-i-i-Ll 4 h J.|-u . J J ---hi- t *-i H---h t-
-t-i -j— h r f -H-l-r r
!» 1 1 II ' ' ; '
I
: 'Mil ' '
I
'' II '
l
!'
i i
1 ' !
.1 III i! ! II Mill! 1 ill I II
,.... ... .. . .....: - j-- -|
k[:::|th::::: :::::::|:::::::::::b:::if :±:[|:±:t]t4|Sjj.LL
i
...|
..,iJJ..L .. J...4..,J....|.t
J.,.|.r
i.,..j.,.U1
..,.|.j. (-i^-i-a
fftt- ifi""fflfflte-pi"- .— . J.u L.|. I.L IJ-J....J]. |[
i r T |l
ri i
ii
ri
r 7 T '! j i i
c
|
Is Is Is 1 a L|
8 i
I J L| flijll | If
1 Sh hi -r -r nltnH—hrf---r-t H-i-- r rril+r h.-.~-
- -
1 1 11 1 1! 1 1lil
i ::::::: :::::::[: ::::::::::::::::::::::::::: :l:::
i t i i i
'•
!
:
i
i m '
iJ.Ul J..LLl J...L....J.I.LL L..U 1 1 1 -
- - Z| - il j. L . .. j j1 I j J li. . i i i ..
. j . - . 4 l \ i j - -i- - .t
4 - - Li-
i 4 4 -!- - - 1. - J - -L
.
i\'4\\ ; : i i i
Ti Ml '!
'i!
'i
r
£ 2 i|'ta4H JT-ri
J
-h-r -h-r 1- -----!- -h if'-|-r( --|--h- -f--rH--2 iu > i
d <
K
=U J 11 i L t L JI 'IU J 11 J i <
»& LI
J | is fl-if r-r— 1-h -i-H- 4- ... j.-|.|-.
<z
oin
'
1 i I i ili : M! I 'I i
i J iI
' J
ii:::]:: b:::::::::::::: :::::::::::::;:[:: :±: ::::::{]::::
1
.L.|||.^^.|.|.^j4).[I
jj..4i..4.[.|I 4|.^||4i|. 1
jf4i|j44
CO
zOME->
<OS
wPuo
CJH>OS
wCO
lOI
<r
PQt-i
PCXw
112


cost of sales, gross profit, payroll and benefits, other
direct expenses broken-down in the same manner as the Retail
Operations report, total direct expense, and service net
contribution .
3
.
Gene r a 1 Expense Payroll
The General Expense Payroll report, Exhibit 4-6 is a
breakdown of all general expense departments payroll and
benefits, as well as, the related employee equivalent man
months and pa y roll dollars before allocation. The following
is a list of those departments broken out:
* 321-11 General staff
* 321-21 Accounting
-' 321-31 Data processing
""" 321-41 Visual merchandise
* 321-52 Security
* 321-57 Cleaning
»- 321-58 Maintenance
"* 321-61 Personnel
* 321-70/77 Warehouse
4
.
General Expense
The General Expense report, Exhibit 4-7, is a
breakdown of all general expense and other income. The
report is broken down into sections for various general
expenses, miscellaneous general expense, central office
expense, centrally funded exchange expense, and other
income .
113

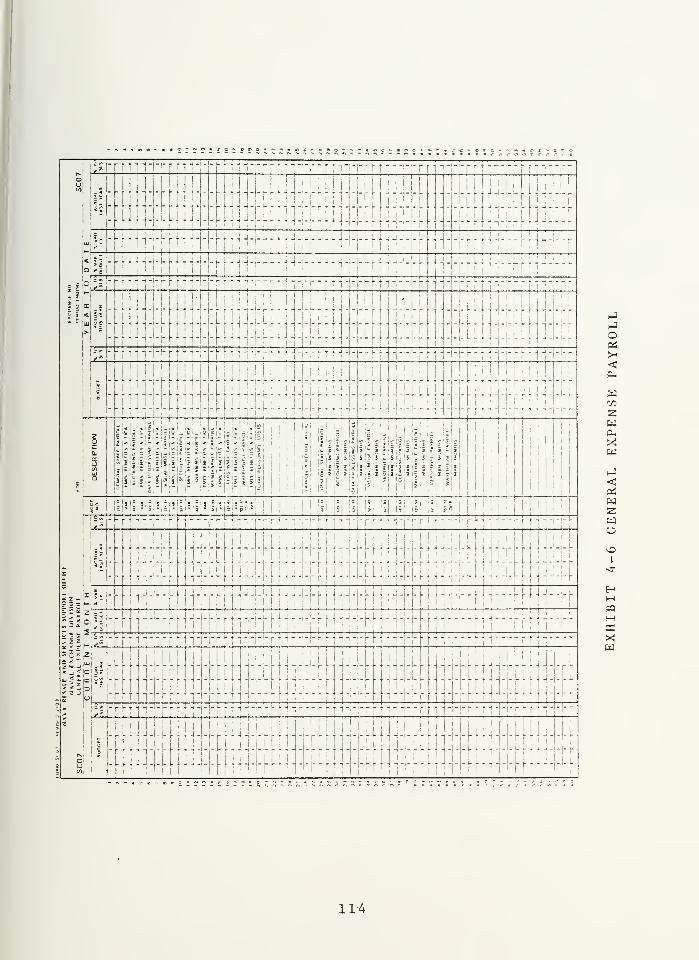
1 |;3i-r-tiitrrf11--j--rrr-r[-|v-;-iTfJi--|-rr ^ir-rf— rp-nTi-h
Si
1
Mill 1ii
1' i
hirh'tt
H
ij- (rrrrt u"
<—N"h in "1"
h
i
i
i
I
^MiTM]j-t-i11--HHJ
-n hh-1---H-4MH-mHitn-r|3?jl4t4l- -H-tKM r 4 Kiii-^fii-!--^i-i---|^---KH;Trriit!-
it =|:S-'fl'it-f'1---|--f1 r-f r l-'^-Ml-rilr--;!;:-;-1
5 '
l{S t\
-L.L ... - i
- j- 1. ...J-'-t - 4 \\\- 4 - --
aft- ... -1... - — . ... i-I-.
1 4
S3- f Ii- (1 ( rt1-4h--!--r4-f-4 i 4---r[lrlt-i|-J -i-r
1ii
1 11 I 1Ji
i 1 I
1
!
,
I
!1
i" ::it :"":::::|:J:: ::::::::]±:::::::::::iff ::.::
1
g-LUiaU-J . --I- «UA |i«l -- i Li Mil- 1 II III§ I
Sjj !S!|||I|j|j| g 1 g I |l||l!ii5il \|!f I f | f.f If I;i=|-i-!l 1 1
f;1
-|
l i| Ijiiis Illiiii 1 \ 1 iilii|ii?'|.| ' * Ii ? I ?!s ?!§|? s'f's ?|i f ii? i ?
s
FfPNWrfl'fPffR#l 1! II »
* "
"1 h
:
!
ii |i|l|i|!{!|!j:|!|l !|i|i|ijj|iJ!p! j
| ||| it:
l ||| [ \\ \\\ ||| ^
c
5
* z -
i:s-- li--|-rh- -""r 1"T'n'Tif"1: "
r !" 1"" H-M-m
II II I I
ii
i
il-\\-^-\^ i-;-r-r-r'H--H-i- -.:-m|m4c ^ at
i|?i-f 4t4i |f4[M--tm----hHi---4----l
iij|hif-h[~ z S
s = 53 < ~
?:<
2 2 JM
><Z
OuIfl
4 1 i I hill!
ff-l— - •4-M -.--4H- —
f
|;s|-Hl-H4rn-4hlHTl4m1l4mrrr 1itrr lirl-h tirrrrti'
I l ii U LI]:
' l|ij ' L1
l i
•t::::i::::]:::::::::::: ::::::.::: :::::::::::::::::::::::::f
r
oOS
<!p->
w
zwCm
w
<W
Wo
I
<f
Ht—
i
«
X
114


i
COOo
i ill 1 j
Njll:::::::
L ... I.j-IL Uiiulj ...I... JlL-jJl- li-i... ...
|..t
, 4 j
....... 1 j....
1.
r "Til— *--
H— j-i-i-rHfl--h--Htrr fin-- 1-1--!-
fW r- i--M--| Hlt-f"1thlmF-Ht-F(4
It":llrt
—
|--rr 1
1
—
rtM-rL
HJ--r-— :rHMi-ftWH^MW
jsifi^rtT' r |i"t i
"iiiiTrr t 'ii r-'----- "<*---
1*
1 i it
3 ( M
3
-1 1
.j.,irr.i.LiT..
1 t" n'riif"'
............ i|.![ j..... 4m.|j.|.14
;S-h-t-1--|--M--j- r U---H--hi-l- H -]-~r\y.\--\-\J
---r
!i:-[|JEt|:|{:{
r t •-M-l
mil a LLh.J IN 1
1:::::}::: 11 :::::;:::::::;::::::: ::::::
1r
1i i
<
; 1
r
1
B iiJijjjjii£ | - !§!S H*i - 1 sis 1 !';
If ||s|. | |j|\l :&\i 1 1 sjijijc s|| * !j
^° j 5 is|c JBi3!=|«J£i«jsi:isj!
!
li|i|iiS|iiiil £|i|l|I i \\ i|lil|gj| |«|
h\-\\ 1
1— r r 1"" ^ L 1 J -|. . - L 1 .1 J . . L u L i J -j-|- u L 1 j J- - . L I .1 J L ....J... ,(j J
I
1 : _L J._.|.. L... i iMii r t-i
rrj
i
+
! :I" 1
1
C 5 J.-l-i- -li _L. .. --(-. i-4 1 .4 4 i--'"
! 1 U ___ |! r 4 JT i
i
r1
r Mt2„|
go ffifflflm-i-mr \\-\-\- II-- ••}•:i"ii
* g«._ -L. J J..LLI i J.L .
-!' ;F 1
1 Fill\— r hliTti'i1TPr"T"T'"rr[-'it--
4'1'rr
< -,5 = *b « 1
Z u. 2< ml
35°|5 z
;
eg*
!
1 4-T )- r r 1
J "-
I
I i
I ! I!
Il
....--..-J .1. ....... ...L [
i
i
i• ---4 ----- — j-|-|--I-J--I-F— 1— -----
»<z
ocOluI0|
i~ t-— |
—
11"~!~4' rrtritri II'
—
r i- -j- -r
i 1 1 1 ! 1
........... J.44.....L I. .... . ...... ...4. ......
..................... ...... .................. LI...... ]. ....[.. ..,..].. .... .
wzwXw1-3
Pi
W
Wc
I
<*
«H
XW
115


1:srh
°li/li
K-
LUJjI. .! Li.J JJJ_LL...JJ_.LLlJj._LL.-i-J-L...JJ-LL....-J-L[I I! L I L J JJ L Jl L 1U ! L 11 t I [
^l]4f4l----:tq""1ff 1l "W1 :-ttW:::HJffl:::::i:=
L !>!-rMHtl-HiH--fr-i1--Kt1M"1ttKiHll-rH1-ht1-HHtt|-|-i<
^Sh L'J J.L-i iiJ.LLL.
tl-.LU J J J. LL L . .4' JJ.j.,.L UJ.I.LL .1Jj..lL..J Ij.Ll
iO r.-T n i r|ii i
i ni r
r
t 1 ! i
rti
i
11 f jl Ml i
c j o rrtiit'H r tii"T f '
""l"HV" |
"
|"i 1lT "h > IT^Iitn
f r ICC
! !
<
l>
!
i
1
< I
JjJ... h Li] Li.,. 1; Jil.l.i.iliL I U 1 ]1 ] 1 ] [I J
::: it:::::::: :::::::::::: :±::::::::t:::::::1: ::::::|
1 | 1 11 1 !
!, |
! ! 1]
1 1|
1 1 , :
r1
j 1 !r :
;I
I*1" hftii-i-|--ti---|-t-riii-T tl
Jt-frliri-rrTii-|--riiT7liitr r
i
"T j
"
r
s-
J L !L J! MJ| L J 1 |J I j I J
i'1
::::::::::::::::::::::: n ::::::::::::.:::: :::::n:. jj. .... J ].. 1 i.J,
j fH
.
DESCRIPTION
| :j » i Ul 'g , S'Sl i
! '
'
1'
i i
Slilil ! J !(;: 1 i III II
!
jl a|g!i|ii- Si * 5 ? si* ilXjij|i§l*i° - 1
!
ss1 1
|iii|i|i|iiii;|;| »|*|i|ili!ilii»!»l1 lij
!
I ;s|-t-riijtri---i---t-r'ii--^tiit-r--i-i-!— i--rt-i---i--tn--i- h tii-
Lij]j..Li..j...H..jj.iU|..L.L., .jnri.ini.4r j....
[i ] rt jj:
,
r 11
1 1 1 1 l 11 ] [
111 !tii'""ff
,1
"""ftiT"j
1""T! i"[i"1
1111""
8
HH^-rHr-hi-l-hjMI-rtti-^'H+ltM-H nn-4K isio2 = 3!2
' ** i 4---|j----HJ
i--44--t--r!]t-t""rt-t]i ^ I - -h 1---
1 \---h Hit \\r--\\-\—[\ in- \\-y-Jrr 1 r ft"
7 = : ;z
"$2itr
3SSp" -1°
U|-
ir f:::
:::::ffl:::|::T::::|T::;;::|t
: ::::::|:
-(Hi—
1-
—
l-h'-f- i— [
H- 1-I-!— i— rft— *-t
<z |
! oil
Ol• Ul
U)l
M .
r|^.|.j.|.|
1^.
i
..^ rl1.|..,. j...u .. i
--(-tn-i-i- -fi-i— r \\t\~-\
m
14j ffi:::ii::~j.±TT4j.:4 tip-r r t i"l— 1*1"—
f~i—H— 1"|—-f" —
1
—
tii—1
— 11T— hrin—
r
wwzw
XwJ<Pi
w
wo
I
<r
H«1—
1
S3Xw
116

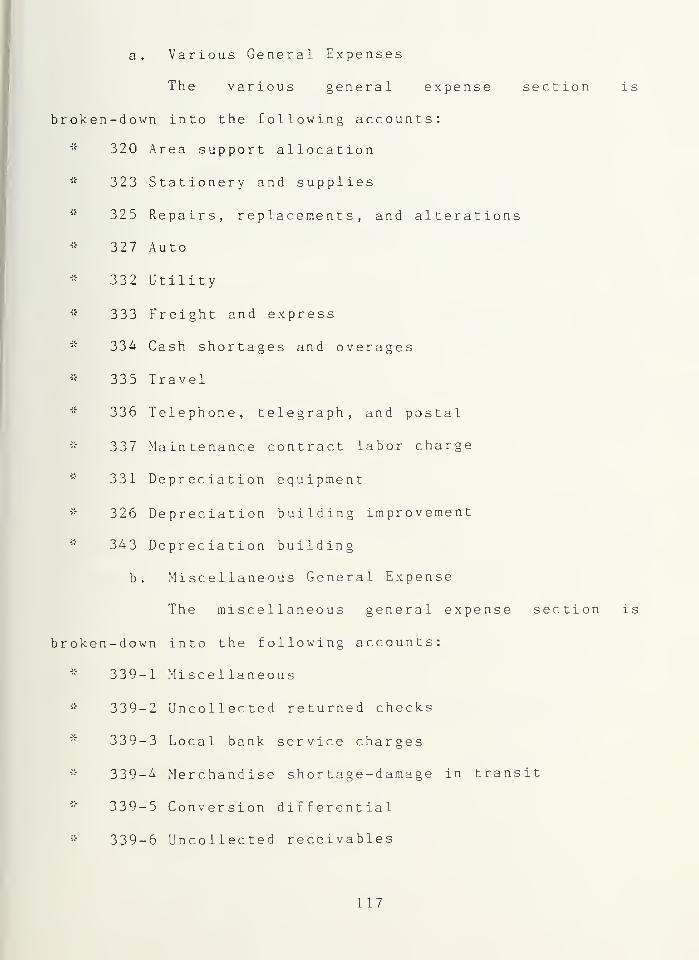
a. Various General Expenses
The various general expense section is
broken-down into the following accounts:
•;:" 320 Area support allocation
* 323 Stationery and supplies
"* 325 Repairs, replacements, and alterations
* 327 Auto
* 332 Utility
-::- 333 Freight and express
"' 334 Cash shortages and overages
* 335 Travel
-;:- 335 Telephone, telegraph, and postal
* 337 Maintenance contract labor charge
* 331 Depreciation equipment
""" 326 Depreciation building improvement
* 343 Depreciation building
b. Miscellaneous General Expense
The miscellaneous general expense section is
broken-down into the following accounts:
339-1 Miscellaneous
-::- 339-2 Uncollected returned checks
339-3 Local bank service charges
'" 339-4 Merchandise shortage-damage in transit
* 339-5 Conversion differential
* 339-6 Uncollected receivables
117


* 339-7 Equipment rentals
'"" 339-8 Overaged merchandise intransit
* 339-9 Maintenance labor charge
";:" 339-10 Training and development
* 339-11 Custodial labor Navy Exchange crew
339-12 Retail clothing store expense credit
* 339-15 Field Support Office reimbursable expenseclearance account
* 339-16 Provision for bad debts
* 339-18 Exchange distribution expenses transferred
-::- 339-19 Consolidated procurement office surcharge
* 339-20 Relocation
339-21 Miscellaneous expense data processing
* 339-22 Equipment rental data processing
c
.
Central Office Expense
The central office expense section consists of a
single entry and is an allocation of central office expenses
to each exchange based on a percentage of sales.
d. Centrally Funded Exchange Expense
The centrally funded exchange expense section is
broken-down into the following accounts:
342-1 Workers compensation and public liability
-;;- 342-2 Self insurance
"" 342-3 Group insurance medical
* 342-4 Group insurance life
""" 342-5 Stationery and supplies
118


";:" 342-9 Management trainee program
-:;- 342-11 Executive management program
""' 342-10 Miscellaneous
d. Other Income
The other income section is broken-down into the
following accounts:
* 344 Purchase discounts taken
";;" 346-1 Miscellaneous income
346-2 Service charge on sales to other activities
* 346-3 Service charge distribution centers
":;" 346-4 Income from bad check charges
*"" 346-5 Layaway service charges
";;" 346-7 Income from mail orders
"' 347 Income from concessions
348 Income from money orders and travelers checks
5. Operating Statement (Excluding Retail ClothingStores and Navy Lodges )
The Operating Statement , Exhibit 4-8, provides a
summary of information provided on the Retail Operations,
Service Operations, General Expense Payroll, and General
Expense reports. The operating statement is used by manage-
ment for a quick overall picture of an exchanges operations.
6 . Retail Clothing Stores
The Retail Clothing Store report, Exhibit 4-9, is
provided to those exchanges which sell military uniforms
that have been procured by the Defense Personnel Support
119


_,|Sji-r
p- -5 ; -
r ' n":"T *"
i 1
1'r.^... rrn _.,...
:, r,..^ rt . ....... .......
C
1 I1'
L|-L iifl-U JU- .i.i.iij !
«m t M+- I
—
\\\U\i L^! ........ j.. i.j-i-j.., 4-1.
-!-r
hi hi I
'
1 1 I h I M i
<
.-U.LUn-.41] 1.L.L.JJ4L IJ.ILli.-i-Lu 4 ill— -[ J1U J.-LM Ml
![i ll ll;
| i
i MP|
IHmiMMIttHWrHW iLjipMHfi Hifh
laMiitMilHflp|ii--K 1-h-Klli-l-trHiiTmi-k'r-
l
;si h tii I
' rhl h m~ h !
;
:
r..,.,._......:.,. j^..,. _,........ ........
S i\.« c !•
!•I! II:::: i:...JJ....1J iu..L... L4.Li.ji4
j' [j] [ 1 j 1 ]
;
i
:'
1 r 1 1 1 1 m 1
1?
II
IE
1"
=c
"»1
r f
rrrt ii't "n"""":r" T ri i"""rsr it H -tH- (
.....p-j-H-H J r! -!4
J. L j J] i[L-4
-\M- 4!-m—M4tflI-
1 III , ! 1! 1 '11
.....j
Mi... . i.U
M::|:f[h:|:tr:l:: :[[ ]]:|:[MLil
! y »j*!| ?|?n| y «i» M::MI l!
i Mr ills;"i
p
1
11 § i f
5* g
' k Lk!i . p 1
1 S s s|= i K L 1 1
* * - - * > 1 MM '
l|i!i iji 'Ml 1!i
!
l*3|— r-ii-s-rr Tt-tji4rM-i--it
1
5 Jj
I I1
1 I II ;
1 1 1 mi'
i
L . __|—
1
L .. ]....L...._ . 4-L
- a52;sl - Z H- [ f-l [-+ h ..,.|..,
|li..hr1 ..-4
j
4.|4L|.i.i-
r
» 5 rilpi Mr! •M]tiitH""l1M.-1..! jj..i...^...L.jji-1-M j.i-L
MM Ml1 ! ! 1 T •hi 1 I'M
E*!!l,;..-..-,. ,,-.,;..,, ....^ rjr--!-"---:TrrM M-r MrU--f
Ho1 2.
ill :::::: i::.:::::::::::i:::: :::•
r |i...|.4^..4t..J.||uH-t
i1
1 II ii [J
<> * i;srMMi1tltM-M~~-M11itMLtit \-\- -1-H jt-- 1-4 H-r
-
< tZ O
51
L iJJ Ill a! I II
i::::::::::::::i: :::::::::
h-CUf-i-[H-4|tn-f^-:-[ H-4 ::::::tt
:
l
:4FR ::t:Hff
:
f
HWSwH<Hto
MH<PiW
oCO
I
<r
E-Mpa
Hsc
Xw
120


!
2u'
j
Jl II Ml|
1 Mill Mi I III lilJIMI JllillMMIti\-[]--[
[\\r-\--[ |tHli"TiT[ 1+ 11 "TMrHif-r
%t::::n I ::i:i jiuii]::: l::il
m
:::£:: it iiMi i]ii;[r 1] i
:
i
Hi •
11 ;
r. 1 M rf j 'r
i
i
,rti
1
li#|-mif!iM rHHitj- l-rhH-tMWfHi+rHi+ltfi'
,1
g H\\t
i.
1
i
j
1
I
_
!
c(
C
S ;| Ml l] i !i
1 1:[i
;
i 11 !! F ! i
. M l L M 1
:
1 lM f 1 J 1 M
:«i Mr litr jt"r1"" l "rt"T"tt'1ltt htrI"" mm r tt' t1T' r m it"' "'"'
i mtmm i
r
- S T" 11'TfHi' 1
" rl-t y-rr H4 Mr44jmr mltr M~ii
!
1 i
: ;
!
1 ! ! II 1 1 ' 'I
, M 1 !
i
•
i tM"\ I t-t!i-||i ]\- |ft
--!
|:}j:::::[|:::|:|:::j::::: f ,;i:i4J::::: |j ::::::t:[i#totf[
cc 1
""" «' Si |u« _i lw ,i«' " is ' ° *
1 tl i= f°
1
2 $ 1 | ill f i|J 1 IpillW r \ iff!"!
°i I 1 IfiM itffl li! pi
!'!!
i i || II
I
jjl 1 |l| Si
! |=|l| 1 =;:;:;;!|
li|. |
!
;
„,.rf
., ........ ,.:...,.,,,.,. ,.,..,.,. ^.......f, J ..r
. ....... ...... ....... V ...
get :::::::::::::: I ::::::.: :::t::::::::::::t:ri::i:: :::::[4 ......... .....i].....|J4.t l|.......j....jj......l.|..........
M#tttl tFfr-t^ttf-tf-ittl- ffiS-"!is
t-jfH 1+^ t !4[t-f---i'tMi"M----|r
- 3 1'^ 2 =
— X "2 -i -*>;I- > — I
sj
z
i
co
a Ul JJ 1 J
;
'
1 J HL i
' Nil|
'1
J Ml
=M l|l 1i - 1- M - -] -H- - M -j - - - - f
|
J- - -
h-
T M: -r r r ^ ^ r- J— f 1
1 —rhr-ji--r
;* rf in li 11 M Tl '
:
'; Ml i
!
ri Mil' 1 11 '
J-r I \\ 4 H--M-1- 1—Trf--J4l- -i-M-r
rtBlflttfll--4fll1-4tl]
---F|l]---^1]---tH4ftlll4H
CO
wOS
oHoo
zH5C
HOhJ
cj
iJM<HWPi
a-*
I
X
121


Center. These uniforms are sold at cost resulting in either
a zero or negative gross profit. The total cost to each
Exchange for this operation is reimbursed with appropriated
funds leading to a break-even situation for the exchange.
The report provides the sales, cost of sales, gross
profit, payroll and benefits, other direct expense, net
retail clothing store reimbursable cost, and inventory at
cost figures for the beginning and ending of the month.
7 . Navy Lodges
The Navy Lodge report, Exhibit 4-10, is provided to
those exchanges with Navy Lodges. The report provides
sales, cost of sales, gross profit, payroll and benefits,
other direct expenses, and net contribution. In addition,
since, the Navy Lodge system has been set up as a separate
entity from the Navy Resale System the Navy Lodge report
includes building and equipment depreciation, and project
amortization, as well as, a charge for services rendered by
the Navy Resale and Services Support Office. A total Navy
Lodge net profit or loss is presented.
F. EXECUTIVE LEVEL REPORTS
Executive level reports are identical in format to those
reports received by Exchanges.
1 . Regional Reports
To supervise the management of the regional
exchanges the region receives a consolidation report for the
122


-~«»»*'-»»s::s*Es:;2g;s5;5g5;i»gssssssss;s:5;;;;;;;gBSs;s?ssi§
u11)
1
i
1
i=srr 1 1 1 i1T r til"'""~
r rrt " li'r "i ji~h" |~ r 1 1 ~| ~i
-j~ rMTM— ~~"—
;
""r
' :E!::illtlJ:::Sfii]:!:[ii|Ji|!3:I | ttipttlli;!r4 l i1
.,.Nil
J..,. ......... ..
r!.. t[ ; Jv! .
rh„.
;
. :. ......_.... ......
;
liUL lj..L'.UJ4..^ 1J..(.. i.-Ill ijj.. iiJ.li J.l:r |
N!|J|i 1 : ! .
i
! 1 F| !1
I;
iI
1' !i i
I ! M :
i i'
;
i
;
!i
-. c jc
' si
J e -: c- i " iM ]--[ \v— -
444 1—k J-(- 44-—
•
!s - h H i v - r• r1i H~ -K 1 1 1
-!- M^ 1 1 11- - -
f-
1- - - r H 1 1 -r r r r t i - -r h r i 1
- - - r r t i1
' "I
-
f-
Mii I l< i II ' Ml ' Ml 1 1 i !
MjMjJmi^ M.-MjM-M-! m-4.i
j
I
1
li ! i gj !=! '
|=|s|=|sj!
ii >i
i M m !i '
' 1 1- 1 Mm lii
-| i LI J. .... . . t i j J_ _l . j J...L . A\ L.Lt M ' ! M M rr pi tf
h[ff--f-—-If-l-v-i.r-f ^--i-ii-i \
n Is
2 S |*itrri"T"--"1— irTr 1 it itt i— r """i iltt""i""ry S :
fsfjif- T
—
[—h "
"
it "
1 1
1
"
_!_
r "
t
"
it "
n
1 r r !
1
1"
"
r r r "hr r
7>l.
— < 1:
Z za
<Z
'
I
l
I
|! !M II-L...J JJ_L_L J._ L . j I ......
:
::::::: :::::::::. 4: ::::+:::: :i :::::::::::::::::::::: ::::!1 1 M M 1 ' ]
i ' ' ' M :
1I
"
nEEilfeTMESflluV5
(
' Ml hri. 1 ' M
CO
wOQOJ>i
<
HHP3MBXw
123


region as well as copies of each exchanges operating re-
ports. The regional consolidation report is an aggregation
of all regional exchange's reports along with the regional
office reports. The regional office reports are not within
the scope of this thesis. However, they are consistent with
the reports received by each exchange.
2 . Headquarters Reports
To oversee the management of all exchanges, head-
quarters level executives receive a worldwide consolidation
report, a continental United States consolidation report,
and a overseas consolidation report. In addition, if neces-
sary, headquarters executives have access to both regional
reports and individual exchange reports.
Besides the operating statements the headquarters
level executives receive a comparative balance sheet, this
year to last year, at the end of each year.
124


V. COMPARISONS, CONCLUSIONS, AND RECOMMENDATIONS
A. INTRODUCTION
In this chapter, a comparison of the Navy financial
operating reports is made with those prepared by the private
and public sector as well as with the National Retail
Merchants Association (NRMA). The final section of this
chapter presents conclusions and recommendations based on
the comparison.
B. COMPARISONS
1 . Retail Merchandise Reports
A report similar to the De pa r tmen t To t a 1 Company
Contribution report, as described in Chapter II, is not
prepared by NAVRESSO nor was it provided by any of the
private or public sector retailers thus eliminating any
compar isons .
The Department Contribution b y Selling Location
report, described in Chapter II, the NAVRESSO Retail
Departmental Operations report and similar reports provided
by the private and public sector are compared here. Those
items such as, a month-to-date dollar sales amount which are
common to the NRMA, and the private and public sector
reports are also found in the NAVRESSO report, except mark-
down dollars. Of those items that are common to at least two
125


of the three private and public retailers and the NRMA, only
an inventory turnover figure is not provided by NAVRESSO.
There are four items which were common to at least one
private or public sector retailer and the NRMA which are not
provided by NAVRESSO: markdowns dollars last year, sales per
square foot, and gross profit per square foot for this year
and gross profit per square foot for last year.
2 . Expense Reports
In Chapter IV it was stated that there are no
expense reports provided by the Navy Resale and Services
Support Office other than the limited expense breakdowns
provided in the branch store reports. Therefore,
comparisons provided in the following section are between
the National Retail Merchants Association and the public and
private sector companies.
a. Comparative Statement of Operating Expenses by
Expense Center and Subcenter
The May Department Stores Company and the
company desiring to keep their reports confidential provided
reports similar to the Comparative Statement o f Operating
Expenses by Expense Center and Subcenter . The May
Department Stores Company report is similar to the statement
suggested by the NRMA, however there are some changes and
additions. First there is a column for ranking of expenses
within the companies other branch stores. Second, instead
of giving the plan and last year dollar amount and
126

percentage to sales, the May Company report provides the
difference, better or worse, than plan and last year in
dollars and as a percentage to sales. Finally a column
gives the percentage change in expense dollars, actual
versus last year.
b. Comparative Statement of Operating Expenses byNatural Division
The Army and Air Force Exchange Service Expense
Analysis Statement is similar to the NRMA Compara t i ve
Statement o f Operating Expenses by Natural Division in that
the AAFES report provides current period and year-to-date
expense dollars and expenses as a percentage of sales by
natural division and a last year year-to-date percentage of
sales. Besides the figures provided by the AAFES report the
NRMA report provides budget and budget variance in dollars
and as a percentage of sales as well as a last year dollar
amount
.
the AAFES report does not allow evaluation of information in
relation to objectives as stated in Chapter II under
improving the effectiveness of management reports.
c. Other Expense Reports
The Expense Cen t er Report , Expense Center
Productivity Report , Expense Center Report Flexible Budget ,
and Payroll and Production Summary have no private or public
sector reports with which to be compared. The J. C. Penny
Company report and a report from the company requesting
The lack of either a budget or budget variance on
127


confidentiality were both expense reports by natural
division within an expense center. Though these type
reports were not suggested by the National Retail Merchants
Association the Retail Accounting Manual stated that some
firms would want to make changes in the form of
presentation .
3 . Cost or Non-Retail Merchandise Reports
In this area only the NRMA and the public sector
retailer, AAFES,
provide reports to compare to NAVRESSO
reports.
The NRMA Workroom and Cos t Department Operating
S tatemen t is heavily oriented towards workrooms which are
rarely seen, or may even be non-existent within Navy
Exchanges. The major point of interest in the NRMA report
is that after direct gross profit is computed, operating
expenses by expense center are subtracted to determine
operating profit or loss for cost selling departments.
In comparing the AAFES cost department operating
statement with the NAVRESSO Service Departmental Operations
and Service Department Benefits and Other Direct Expense
reports there are several differences. First, AAFES pro-
vides a separate report for each of its cost operations,
(Food, Services, and Vending), whereas NAVRESSO places all
cost departments in separate sections on the same sheet.
Second, NAVRESSO has further segregated its Services depart-
ments into Barber Shops, Beauty Shops, Gasoline Operations,
128


Auto Repair, Optical Shops, Flower Shops, Food Operations,
Personalized Services, and Vending Operations versus the
three listed above for AAFES . Third, AAFES has more direct
expense categories than NRMA's natural divisions while
NAVRESSO has fewer categories than NRMA's natural divisions.
Finally, the NAVRESSO reports provide figures for budget,
actual, and last year for the current month and year to date
while the AAFES reports only provide actual for the current
month and year-to-date.
^ • Branch Store Reports
In comparing NRMA's Individual Store Location
Operating Statement , the branch operating statements
provided by J. C. Penny Stores Company, F. W. Wool worth
Company, and Army and Air Force Exchange Service as well as
the Navy Resale and Services Support Office statement it
should be noted that each private sector retailer, AAFES and
the NRMA segment leased sales. This segmentation is done on
the individual operating statements; except for AAFES where
it is done on the Analysis and Statistics Statement .
NAVRESSO does net segment leased sales. Gross profit is
shown as sales minus cost of sales giving gross profit on
the J.C. Penny Stores, AAFES, and NAVRESSO statements. On
the F.W. Woolworth Company and NRMA statements gross profit
is shown without cost of sales. The retailers use dif-
ferent methods of reporting expenses. J. C. Penny Stores
129


summarizes expenses in natural divisions. F. W. Wool worth
Company and AAFES list expenses in natural divisions and
subdivisions. The National Retail Merchants Association
lists expenses by expense center. The Navy Resale System
lists expenses by natural division and subdivision.
5 . Executive Level Reports
a. Total Company Balance Sheet
A total company balance sheet as presented by
the NRMA was not received from any of the public or private
sector retailers. A typical balance sheet was received from
the Carter Hawley Hale Stores, Inc. which compares this year
to last year and plan. A similar balance sheet is also
provided by NAVRESSO, however, it only compares this year to
last y ear
.
b. Condensed Income Statement
When comparing the condensed income statements
provided by the J. C. Penny Stores Company, the May
Departments Stores Company, and Carter Hawley Hale Stores,
Inc. with the National Retail Merchants Association
Condensed Income Statement little difference is found in
the information provided. The information provided on the
Army and Air Force Exchange Service and Navy Resale and
Service Support Office condensed income statement is pre-
sented in a different format. Instead of summarizing all
departments data AAFES segments retail, food, services, and
vending department data while NAVRESSO segments retail and
130


services data. Besides this segmentation each public sector
retailer then reports general expenses leaving exchange net
earnings. AAFES and NAVRESSO reports provide the same type
comparisons as the private sector and NRMA reports, ie. this
year, last year, plan, and variance to plan.
c. Total Company Income and Expense Statement
There were no reports similar to the NRMA Total
Company Income and Expense Stat emen t .
C. CONCLUSIONS, DISCUSSION, AND RECOMMENDATIONS
1 . Retail Merchandise Reports
a. Department Total Company Contribution Report
Recommendation :
A department total company contribution report pre-sented in Chapter II, Exhibit 2-1 should be adopted at
this time. The reports distribution would be limited to
those activities that perform "significant" purchasingfunctions such as regions and independent main Exchangesnot under a region.
This report computes a gross profit margin for
each department and then subtracts that department's direct
merchandising payroll and promotional expenses to determine
a departmencal contribution. Such a report would be mean-
ingful in the Navy Resale System.
As stated in Chapter II a buyer's performance
must be measured. This measurement is possible, to a
limited extent, with the current Retail Departmental
Operations report. However, it does not include any direct
131

merchandising payroll or promotional expenses. The recent
conversion to a more regionalized system of purchasing by
the Navy Exchange System, facilitates a reasonable alloca-
tion of a buyer's and related staff members payroll to a
given department.
As for promotional expenses the Navy Resale
System has traditionally spent little in advertising, using
point of sale display almost exclusively to reach its
market. In the past few years more and more dollars have
been spent on the direct mailing of advertisements to
patrons. Though direct mail advertising is not as costly as
radio and television advertising, direct mail is becoming a
more significant item and is in need of more control.
Tracking of the direct merchandising payroll and promotional
expense will provide management with the information to
control direct merchandising payroll and promotional expense
as necessary.
b. Department Contribution by Selling LocationReport
Recommendation :
Inventory turnover, sales per square foot, grossprofit per square foot for this year, and gross profit persquare foot for last year be added to the RetailDepartmental Operations report.
The Retail Depar tmental Operations report, the
equivalent of the NRMA's Depar tment Contribution by Selling
Location report, does not provide six items of statistical
information, listed above in the comparison section as being
132


provided by the NRMA and public and private sector
retailers .
Based upon this research the author concludes
that of the six items listed, the two markdown dollar
figures can be eliminated from consideration for inclusion
on the Retail Depar tmental Operations report. A markdown
percentage to sales figure is provided and is the more
useful figure when reviewing or budgeting markdowns since
markdowns are budgeted as a percentage of sales.
The other four items, inventory turnover, sales
per square foot, gross profit per square foot for this year,
and gross profit per square foot for last year, can be
added to the report by removing the beginning-of-month
inventory figure (which is already available under the
heading End-of- Month Inventory on the previous months
report) and reducing the size of the department title
column. The inventory turnover figure is needed, it is an
indicator of departments with dead stock that needs manage-
ment action. The sales per square foot and gross profit per
square foot figures are needed to ensure management properly
allocates floor and shelf space to the items that are sel-
ling as well as generating profit for the store.
Besides the lack of statistical figures, the
NRMA Department Contribution by Selling Location report
subtracts various direct selling expenses from each depart-
133


merit before coming to a departmental contribution for each
department. A comparison of the NAVRESSO Retail
Departmental Opera t ions report shows that direct selling
expense is not subtracted from each department. This is
appropriate because of the size of each Navy Exchange
department. At all but the very largest exchanges one
person may handle several different departments. At some of
the smaller exchanges one person may be responsible for
every department in the store. However, total retail depart-
ment gross margin minus direct selling expenses giving a
total retail department contribution is presented on the
Retail Operations report and is discussed later in this
chapter .
2 . Expense Reports
a. General
Recommendation :
A system using expense centers and natural divisionsbe implemented.
The Navy Resale and Services Support Office does
not provide comparative expense reports. From this lack of
comparative expense reports indicates that expense analysis
is an area in need of revision by the Navy Resale System.
As stated in Chapter II expense accounting
improves profitability through the control of operating
expenses. This is done by accumulating operating expenses
into expense centers and then holding the center's manage-
13.


ment responsible for controlling expenses by comparing
actual to budgeted and prior years' figures. It was also
pointed out in Chapter II that there is only limited useful-
ness of comparisons among stores when using natural divi-
sions because of the diversified manner in which stores
perform identical activities.
The Navy Resale System branch store reports use
quasi-natural divisions in the expense section of the
report, instead of expense centers, to hold its managers
accountable. The use of natural divisions could be argued
for when each Exchange was considered a separate entity and
pro-rations would have been extremely difficult, but now
that most Exchanges have been formed into regions and the
pro-ration problem has been significantly reduced the argu-
ment is more difficult to justify.
Though implementation of this system is not
within the scope of this thesis it is realized that there
will in all likelihood be major resistance to a change of
this magnitude. However, if the Navy Resale System is to
remain competitive with other major retailers the change
must be made so that adequate comparisons can be made with
private and public sector retailers.
135

b. Comparative Statement of Operating Expenses byExpense Center and Sub center
Recommendation :
A modified version of the Comparative Statement ofOperating Expenses by Expense Center and Sub centerpresented in Chapter II, Exhibit 2-4B be adopted.
The Navy Resale and Services Support Office does
not provide a comparative statement of operating expenses by
expense center and sub center.
To maintain the current level of support to the
Navy Welfare and Recreation funds the Navy Resale System
must be competitive with other retailers in the private and
public sector. To be competitive the Navy Resale System
must be able to compare its operating and financial
statistics with that of other major retailers. To make
these necessary comparisons a report similar to the
Compar a t i ve Statement o f Operating Expenses by Expense
Center and Sub center is needed. The specific sub centers
used in the report would be modified to better correspond
with the Navy Resale System. For example the use of sub-
centers 425 (Radio) and 426 (TV) would be eliminated. The
rest of the statement's format is suitable.
c. Comparative Statement of Operating Expenses byNatural Division
Reco mm endation :
It is recommended that a modified version of theComparative Statement o f Operating Expenses by NaturalDivision presented in Chapter II, Exhibit 2-5 be adopted.
136


The Navy Resale and Services Support Office does
not provide a comparative statement of operating expenses by
natural division.
Though comparisons by natural division are not
as beneficial as comparisons by expense center they are
still of use when analyzing expenses. Therefore a report
such as the Comparative Statement o f Ope rating Expenses b y
Natural Pi vl sion is needed. The report should be modified
by adding at least one natural division for utilities
because of the major emphasis now placed on utilities
expense. For ease of comparison with other major retailers
the elimination of natural divisions provided in the Retail
Accounting Manual is not recommended. The rest of the state-
ment's format is suitable to the Navy Resale System,
d. Other Expense Reports
Recommendation :
The other expense center reports be phased into thesystem as soon as management considers it feasible but nolater than one year from initial implementation of theproposed system.
The Navy Resale and Service Support Office does
not provide an Expense Center Report , Expense Center
Productivity Report , Expense Center Report Flexible Budget,
or a Payroll and Production Summar y .
As suggested in Chapter II each of the above
reports is necessary to the proper management of a retail
organization. The Expense Center Report is necessary to
137


report expenses within an expense center and to give feed-
back on management of the expense center. The Expense
Center Productivity Report provides feedback with specific-
productivity measurements for those areas where production
goals can be set. The Expense Center Report Flexible Budget
establishes the budget used on the Expense Center Report .
The Payroll and Production Summary provides a breakdown of
payroll expenses — normally the largest expense in every
expense center. Given the magnitude of change required by
this new expense accounting system it would be better to
phase these remaining expense reports in over time.
3 . Cost or Non-Retail Merchandise Reports
The cost or non-retail merchandise reports require
modification to be compatible with the recommended change to
the expense accounting system and the treatment of leased
sales and commissions in Chapter II.
a. Service Department Operations Report
Recommendation :
A report similar to the Service Department Operationsreport shown in Exhibit 5-1 be adopted.
The Service De par tmental Operations report
presently aggregates all sales, cost and leased. It also
aggregates cost departments gross profit and leased depart-
ments commissions. To show a more accurate picture of owned
versus leased sales and related gross profits the sales and
commissions of leased operations should be separated from
138

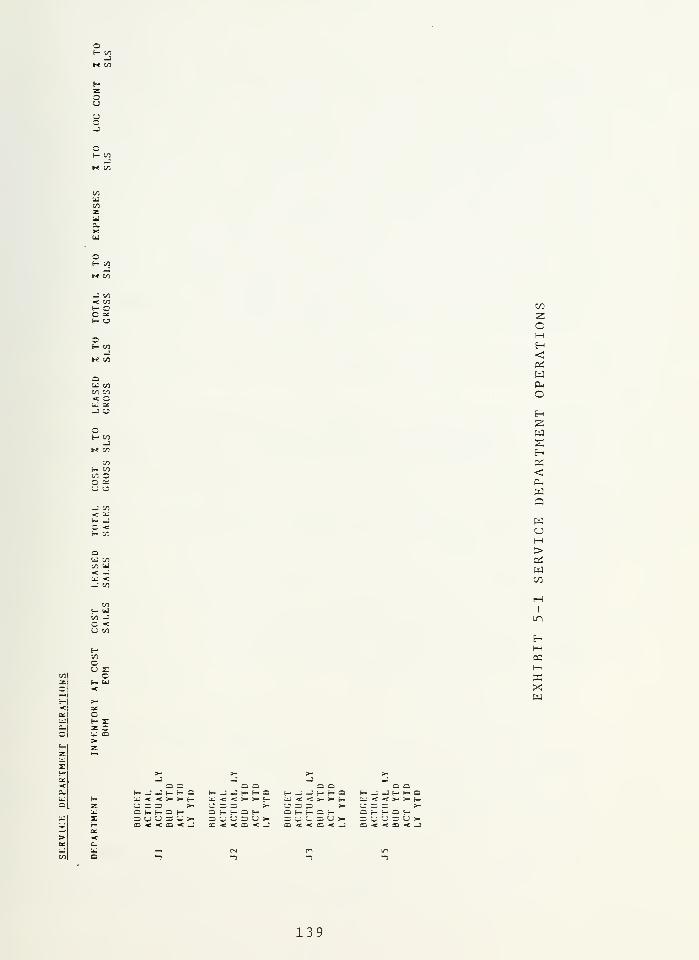
oH VI
O
OH vi
J in«e viE- OC x.
o
V) VI«: ou ri
j u
oH V3
H VJo~, 3C ^u o
CO
OMH<Pi
WP-OHW
OS
<0-
wa
(- -Jc <H V3
QV)
V) tu^ _v <
wCJH>pi
a
VI -3
o <
ou 2:o
I
mHHPQH3=XW
U3 ta
HJJHH3 (- — -JHS-OU *•<>->- f— S*J «C «C >- >- t-
U S 3 >- O 3 3 >-
3 U U S U >- 3 U CJ 3 «J S»— -«r < o < _' — *r. < a -t _J
2Q Q £S"c- — — c-c-Q (--; JHHBu <: <: > s- f— il: <: <c >. >- £—
a H H a H 9^"j^E.Hso ^r -e ca < — ca «c < 33 « _J
139


owned operations. The current report does give a breakdown
of services payroll, employee benefits, other direct
expense, and depreciation before computing the net depart-
mental contribution. These four divisions of expense are
not necessary when holding management responsible by expense
center instead of by natural division, therefore a single
column titled expenses is all that is required. The new
Service Department Expense Center Report will give a break-
down of expenses by expense summary.
b. Service Department Expense Center Report
Recommendation :
A report similar to the Service Department ExpenseCenter Report shown in Exhibit 5-2 be adopted.
The natural division expense breakdown on the
current Service Department Benefits and Other Direct Expense
report is not necessary when managing by expense centers.
The natural division breakdowns should be replaced with
expense summary breakdowns and a column should be added for
average wage rate until the Payroll and Production Summary
report is produced.
4 . Branch Store Reports
Chapter II recommended change to the expense
accounting system and the separation of leased sales and
commissions from owned sales and gross profit. Current
branch store reports requires modification to make them
compatible with the recommended changes.
140


uJ >CO =>
HOH
HOS
OP-.
wOS
B - -CJ > o: Hauow
; — —E a. 10 Q
U30.
WHZwCJ
ww
W
xw
H2
to ocu s:-J O
OS
<Jp-i
wQUJ
CJ
co
s u >U < uoc UJ
>OS
WCO
CN
I
ma. h2: eo uo r
HI—
i
P3
ua. iO =ce crQu u-
33
Xw
o a 2 a a a a a(- -J _J H r- ^ f- J JU r- a s~ ^ -J i- '— a j— J .J H H OH LU < < >m » H u <:<>- S~ H U •< < >- >» _ _LJ •*: -n >- >- s-z CO SJ =3 » CJ a =: > CJ p s >- CJ 3 ^ >•
UJ a f- 1- Q 8- a t- H Q H o s— 1— Q f- .z. g-i — Q H3: ^ U '-> => U s- =3 UU 3 cj > 3 CJ CJ Z3 CJ >. ~
CJ CJ =: CJ >-H CO < <a < J aa -e < ea < _ so < •< CO < J EC -« *c _. -c _
141

a. Retail Operations
Recommendation :
A report similar to the Retail Operations reportshown in Exhibit 5-3 be adopted.
The Retail Operations report, the equivalent of
the NRMA Individual Store Location Operating Statement , does
not show leased sales or commissions separately from owned
departments. As is indicated in Chapter II, to show a true
picture of sales and related gross profits the sales and
commissions of leased operations should be separated. In
addition the Retail Operations report currently lists
expenses by natural division versus expense summary. Again
when managing by expense centers, instead of natural divi-
sions, a breakdown by expense summary is more beneficial.
Until a Payroll and Production Summary report is put into
use: man month equivalents, average wage rate, and dollar
sales per equivalent man month should be reported on the
Retail Operations report.
b. Services Operations
Recommendation :
A report similar to the Service Operations reportshown in Exhibit 5-4 be adopted.
The changes necessary on the Service Operations
report are almost identical to those on the Retail
Operations report. The only exception is that man month
equivalents, average wage rate, and dollar sales per equiva-
142


oH co
m co
l/J<-3
S-£C lO
O<- COJ
M CO
o
»« co
coua
O atz «e
O us
H Oen a.
H on_ J CO 0£•—
*
t—
l
CO •<
a; -« _3 a Lj £ a _3U H c a u < a io -5:
on cu ' CO LO H- CO f— CO co r- CO u_
CO as Z CO <c o co z CO < Oo F- 3 2 u £-* ~ 3 ~ CO F-CO O U _; at O O _5z o
oL-
W CO
a. z co o as_, _ t_ _ CO
=3 f- U H a- - =cr:^-uso >cou -j z < r uE U O <-B -5 CO •«)
>- a. CO z '_- —> z«h U z -z<t- «= — CO - O = « H
a:C;ja;-<uJcOLOLJC.U<UU1I/10.E!/1
CO c/o
O Zu. oCO
E 3: CO 1—
1
X £ 'u HCO co v> O <\ -» _]
CO a: CO u: as co CO DC Oi -J PSWZ 3 £ 3 £ 3 "s. <
2: «c v> z: <: v» £ -I c
o
1—
<
wOS
ro
I
m
COl-i
w
o(- co
OH CO
'"ILUl
CO
143


oE- to
10<-3
H
oE- CO
OC/3
ZO
«c a Ld -<to to S- io E-
E- 3 O LU HCJ C U .J
cjOS
to Ul HCO 2 tOC 3 OOS O UCJ
O zto •fl > o
> z to t—
1
u O - E—u os E— =)
C OS r— C os COfa. Z <C r- O (—1
0. 2 to O OS to 0. OSi-i — f- *-4 til D. H3S- CJ - cu - =i zOSHO o O => to OCsJ CJ E < s CJ CJ
< oW E-
E CJ o «s -J ta «300 2: *3 os UJ as
CO >- lilz CJ Jto >.zuh uz - z <to E— <: " t/l - O = " E-z a.-uQu>t/it;JOtic c^'JUjaaiaJHC- OSOC_>OS<tiJtUtiJUJx co<cjtotoc.3:toEd
<3OS
wPL,
o
WUH>OS
wen
o-I
mHHCQ
33
pz
to oz xlo— E-H z•< toos OSbJ OSc_ 3O U
touCJ
f- to-J
M CO
to
XS~
O!- to
M CO
144


lent man month listed on the Retail Operations report are
reported on the new Service Department Expense Center report
and are not needed on the Service Operations report.
c
.
General Expense Payroll and General Expense
Recommendation :
The General E x p e n s e Payroll and General Expensereports be eliminated.
The General Expense Payroll and General Expense
reports are no longer necessary: The information would be
available on the new expense reports.
d. Operating Statement (Excluding Retail ClothingStores and Navy Lodges)
Recommendation :
A report similar to the Operating St a t emen t shown in
Exhibit 5-5 be adopted.
The changes necessary on the Operating Statement
are almost identical to those on the Retail Operations
report. The only exception is that allocation of regional
and headquarters expenses as well as centrally funded
exchange expenses would be subtracted and other income would
be added to the location contribution to give a total
exchange net profit or loss.
e. Retail Clothing Stores and Navy Lodges
Recommenda t i on
:
The Retail Clothing Stores and Navy Lodges report be
changed to separate owned sales and gross profit fromleased sales and commissions as well as reflect expensesummaries versus expense natural divisions.
145


of- oo
OS- 00
H
of- oo
_JM 00
00 ctUJ <_] C3 _J X CI.J<: Q Ed <: o UJ «*
00 UJ H 00 H 00 UJ t_ 00 f—2!/l<0 oo z oo <: oS-3O0JH C 3 c UJ HaO'J J eo U J
Z O
o a - H OJ UJUJ >—
<
ac H =3 00 a. OJo C£ t« C as oa z X Q £u. z < t- O HH UJ UJ z 3
a. z 00 o :x oo a. 0d Qm => cj*—
<
I—
1
H k-4 UJ a. H U. X U. U. zr> H o c-i Cu - =3 z O UJ. _L- h-
1
o- X — o 3 O > 00 O o >-UJ CJ] s < X CJ o z _J -J a:E _r o =>= J UJ »3 o < _I _j UJ
OS £ «s DC ui IX z — :r «c «c ~>- a. UJ z U _3 o s- O DC ac H
>- Z oa r- o z • z •c h-
'
< — £-~ H OH < —
i
00 H-i S — •—
'
H E- a o z za- a. — O Ed => 00 CJ -J O <: a UJ UJ UJ so z; o u. _j ex ^ ce _J f- CJ j OS CJ cj CJas c o a: < Ul uj UJ OJ O -j Xa. U < u 00 00 c £ 00 _I < UJ
o(- 00
_J* 00
H!Z
wswH<dHw
o2!HH<PSWeuom
i
m
Hoo
HOi UJ
> a•4 aa
HH«M
.Xw
oS- 00
of- 00
146

Like the retail stores, retail clothing stores
and Navy Lodge's could be operated as leased operations or
owned operations. Therefore for uniformity owned sales and
gross profit should be separated from leased sales and
commissions. As before expenses should be changed to
reflect expense summaries.
5 . Executive Level Reports
a. Total Company Balance Sheet
Recommendation :
A report similar to the Total Company Balance Sheetpresented in Chapter II should be developed for use at theheadquarters level of the Navy Resale System.
The Navy Resale and Services Support Office does
not prepare a total company balance sheet.
As stated in Chapter II the total company
balance sheet is considered necessary for management. The
trend format of the balance sheet allows management to more
easily spot problems. The Total Company Balance Sheet
presented in Chapter II would need some changes such as the
removal of income taxes and deferred income taxes since they
are not applicable to the Navy Resale System. Other
changes might include revisions to column names and the
possible addition of other financial ratios.
b. Condensed Income Statements
Recommendation :
A condensed income statement be prepared by aggre-gating at the worldwide level the Operating Statementproposed in this chapter.
147

Changes to the current Navy Resale System
operating statement necessitate changes to the current
NRS condensed income statement.
The Navy Resale System condensed operating
statement is a worldwide aggregation of operating
statement's. This method of aggregating at different
levels, but using the same format, is consistent with
Chapter II. To improve the effectiveness of reports,
uniform formats should be established for all reports so
that it is easy for an executive to follow one report to
another. Based on the analysis in Chapters II through V
recommendations were made for changes to the Operating
Statement . It follows that these changes will be reflected
in the condensed operating statement.
c. Total Company Income and Expense Statement
Recommendation :
A Total Company Income and Expense Stat emen t similarto that presented in Chapter II Exhibit 2-13 be preparedfor executives at the headquarters level.
The Navy Resale and Services Support Office does
not prepare a total company income and expense statement.
Though no reports similar to the Total Company
Income and Expense Statement were provided by either the
public or private sector retailers; this author agrees, with
the National Retail Merchants Association, that there is a
need for such a statement. As was stated in Chapter II the
report provides a quick overall picture of the operating
1

results in a trend format. This tends to highlight poten-
tial problems and allows the executive to take faster action
to correct a problem.
D. CLOSING REMARKS
The author does not recommend that changes to the Navy-
Resale and Services Support Office financial reporting
system be made entirely on the basis of this thesis without
extensive cost benefit analysis into the areas discussed in
the above recommendations. Though the emphasis of this
thesis was in the area of what financial information should
be available, and not how it would be implemented, thought
was given to the area of implementation before each recom-
mendation. Though there may be resistance to changing the
old financial reporting system by staff that currently use
it, with strong support from the Commander of the Navy
Resale and Service Support Office the implementation of the
changes would be successful and as demonstrated in this
thesis useful.
149


APPENDIX A
GROSS MARGIN COMPUTATION
This manual suggests several specific departmentally-grouped gross margin resultsrather than condensing all of these group figures into a single total. To the extent that thegroupings apply to each individual selling location, they are set forth separately, as follows:
1. Gross Margin—Owned Retail Departments2. Gross Margin—Owned Cost Departments (including Contract)3. Gross Margin—Leased/Licensed Departments
As a general rule, gross margin for owned departments is derived by subtracting from netsales the following: a) total net cost of merchandise sold, b) workroom loss or gain and c)other cost of sales.
1. Owned Retail Departments
The net cost of merchandise sold for owned retail departments is obtained as follows:
a. Merchandise inventory at gross cost (before cash discount) at thebeginning of the period $
b. Net merchandise purchases at gross invoice cost for the period
c. Inward transportation cost on merchandise purchases for theperiod
d. Total—Sum of a, b, and c
e. Merchandise inventory at gross cost, at the end of the period
f. Amount (d) less amount (e), such difference being the gross costof merchandise sold for the period
g. Cash discounts earned
h. Net cost of merchandise (f-g)
The net cost of merchandise sold for owned retail departments is obtained by subtracting
the cash discounts earned on merchandise purchases from the gross cost of merchandisesold.
The calculation of the amount of cash discounts earned on purchases is to be deter-
mined as follows:
—Merchandise of retail inventory departments should be carried in inventory on a gross
cost basis— that :s, before cash discounts.
—As a corollary of a), discounts may be taken into income only as earned. Consequently,
it is necessary to ma'ntam a reserve for unearned discounts to apply against the
inventory account carried on a gross cost basis. To do otherwise would be to overstate' gross margin in some years and understate it in others. The computation of the
unearned discount should be based on the average rate of discount on purchases by
departments during the period, considering also discounts applicable to the opening
inventory.
To determine the total merchandise costs for retail inventory departments, it is neces-
sary to add net workroom loss cr gain and other cost of sales, if any, to the previously-
established gross cost of merchandise sold.
150

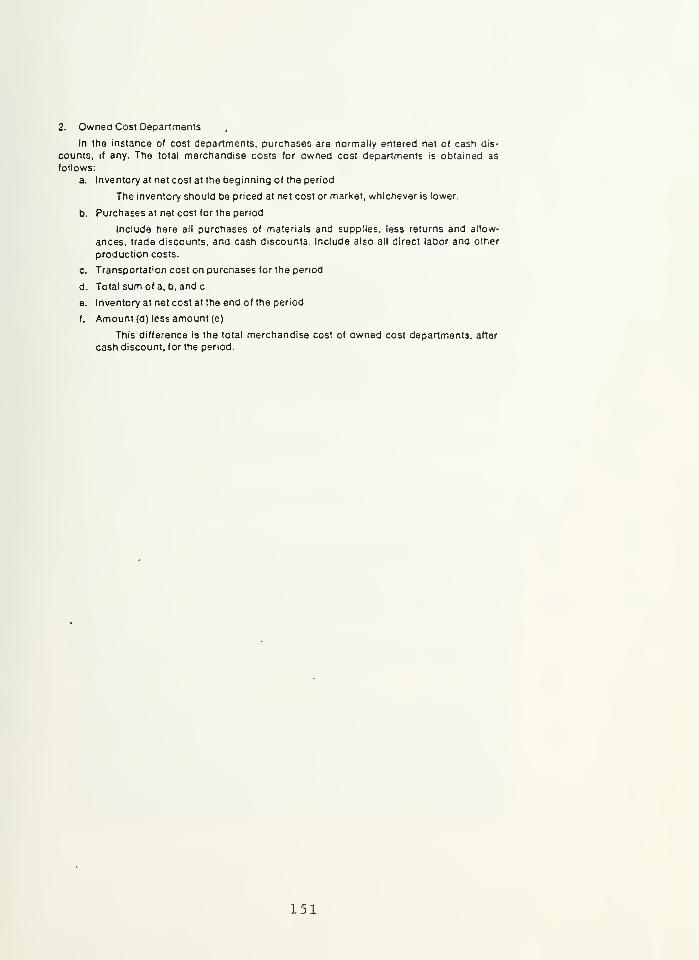
2. Owned Cost Departments(
In the instance of cost departments, purchases are normally entered net of cash dis-
counts, if any. The total merchandise costs for owned cost departments is obtained as
follows:
a. Inventory at net cost at the beginning of the period
The inventory should be priced at net cost or market, whichever is lower.
b. Purchases at net cost for the period
Include here all purchases of materials and supplies, less returns and allow-
ances, trade discounts, and cash discounts Include also all direct labor and other
production costs.
c. Transportation cost on purchases for the period
d. Total sum of a, b, and c
e. Inventory at net cost at the end of the period
f. Amount (d) less amount (e)
This difference is the total merchandise cost of owned cost departments, after
cash discount, for the period.
151


APPENDIX B
EXPENSE CENTER ACCOUNTING
A. Introduction to Expanse Accounting
The primary objective of expense accounting is control through the accumulation of
operating expenses by maior areas of responsibility. This accumulation is necessary becausea prerequisite for controlling expenses isthe identification of responsibility forthe incurrence
of the expenses. After expenses are accumulated by major areas of responsibility and iden-
tified with the individual executives responsible for each operation, performance can bemeasured by comparing actual expenses incurred with planned and prior years' results.
The basic framework of the chart of accounts consists of a breandown of total operating
expenses first into expense summaries and then into expense centers and sub-expensecenters which conform to the areas of responsibility within a retail store.
The chart of accounts provides for ten major categories (expense summaries) for the
accumulation of expenses, as follows:
010 Property and Equipment100 Company Management200 Accounting and Management Information
300 Credit and Accounts Receivable
400 Sales Promotion
500 Service and Operations
600 Personnel
700 Merchandise Receiving, Storage, and Distribution
800 Selling and Supporting Services
900 Merchandising
As shown in Exhibit 1 at the end of Chapter I, for companies that want a further breakdownof expenses by responsibility, 44 expense centers and 22 sub-expense centers are proviaed
within the ten expense summaries. This expense breakdown provides companies with a
degree of flexibility in the recording and reporting of expenses.
The total expenses within each exoense summary or expense center are classified by
"natural divisions of expense." The chart of accounts specifies 1 7 natural divisions of expense(described more fully in Section D).
Not all of the 17 natural divisions are included in every expense center. Some natural
divisions—media costs, bad debts, pensions, and real property rentals— are restricted to only
one expense center, while other natural divisions— payroll, supplies, unclassified, and travel
—are included in most expense centers.
In addition to the 17 basic natural divisions, three additional natural divisions are provided
for the redistribution of expenses between expense centers. Costs are accumulated in each
expense center by the various natural divisions of expense. Whenever practicable, it is
advisable to make charges directly to the various expense centers. Occasionally it is necessary
to effect a transfer of expense from one expense center to another in order to reflect properly
the actual operating costs of the expense center. When such a transfer involves an expense of
a single natural division, the debit and the offsetting credit to the expense centers involved
should be made through the particular natural division involved. However, whan the amountto be transferred out of an expense center is the composite of several natural divisions, then
the credit to the expense center should be made in Natural Division 91 - Expense Transfers
Out, and the debit or charge to the other expense center should appear in Natural Division 90-
152

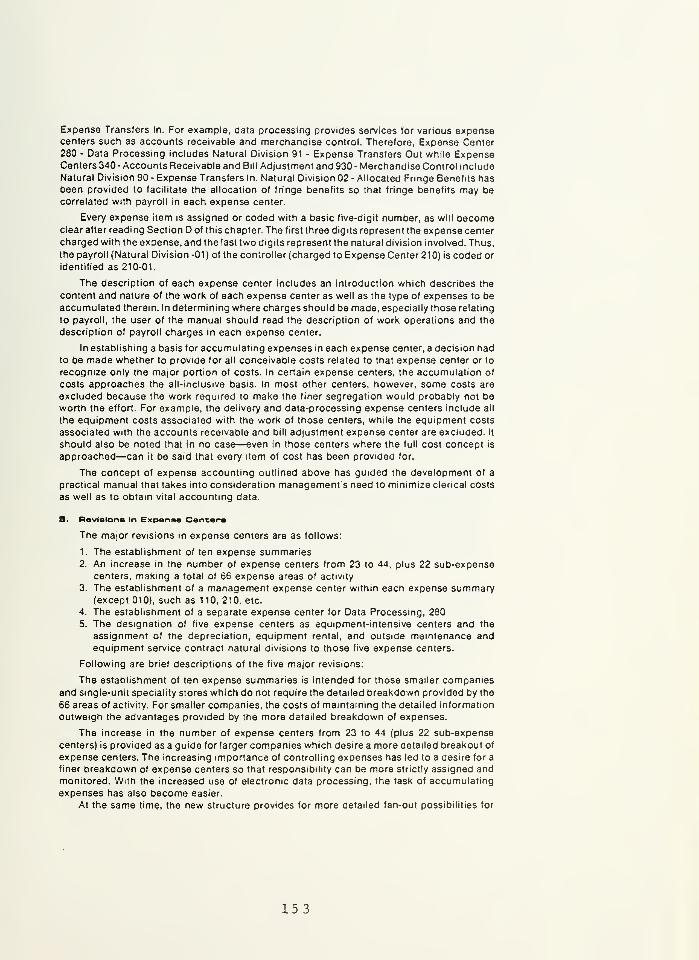
Expense Transfers In. For example, data processing provides services for various expensecenters such as accounts receivable and merchandise control. Therefore, Expense Center280 - Data Processing includes Natural Division 91 - Expense Transfers Out while ExpenseCenters 340- Accounts Receivable and Bill Adjustment and 930 - Merchandise Control include
Natural Division 90 - Expense Transfers In. Natural Division 02 - Allocated Fringe Benefits hasbeen provided to facilitate the allocation of fringe benefits so that fringe benefits may be
correlated with payroll in each expense center.
Every expense item is assigned or coded with a basic five-digit number, as will becomeclear after reading Section D of this chapter. The first three digits represent the expense center
charged with the expense, and the last two digits represent the natural division involved. Thus,
the payroll (Natural Division -01 ) of the controller (charged to Expense Center 210) is coded or
identified as 210-01.
The description of each expense center includes an Introduction which describes the
content and nature of the work of each expense center as well as the type of expenses to be
accumulated therein. In determining where charges should be made, especially those relating
to payroll, the user of the manual should read the description of work operations and the
description of payroll charges in each expense center.
In establishing a basis for accumulating expenses in each expense center, a decision hadto be made whether to provide for all conceivable costs related to that expense center or to
recognize only the major portion of costs. In certain expense centers, the accumulation of
costs approaches the all-inclusive basis. In most other centers, however, some costs are
excluded because the work required to make the finer segregation would probably not beworth the effort. For example, the delivery and data-processing expense centers include all
the equipment costs associated with the work of those centers, while the equipment costs
associated with the accounts receivable and bill adjustment expense center are excluded. It
should also be noted that in no case—even in those centers where the full cost concept is
approached—can it be said that every item of cost has been provided for.
The concept of expense accounting outlined above has guided the development of a
practical manual that takes into consideration management's need to minimize clerical costs
as well as to obtain vital accounting data.
3. Revisions In Expense Centsn
The major revisions in expense centers are as follows:
1. The establishment of ten expense summaries2. An increase in the number of expense centers from 23 to 44, plus 22 sub-expense
centers, making a total of 66 expense areas of activity
3. The establishment of a management expense center within each expense summary(except 010), such as 110, 210, etc.
4. The establishment of a separate expense center for Data Processing, 280
5. The designation of five expense centers as equipment-intensive centers and the
assignment of the depreciation, equipment rental, and outside maintenance andequipment service contract natural divisions to those five expense centers.
Following are brief descriptions of the five major revisions:
The establishment of ten expense summaries is intended for those smaller companies
and single-unit speciality stores which do not require the detailed breakdown provided by the
66 areas of activity. For smaller companies, the costs of maintaining the detailed information
outweigh the advantages provided by the more detailed breakdown of expenses.
The increase in the number of expense centers from 23 to 44 (plus 22 sub-expense
centers) is provided as a guide for larger companies which desire a more aetailed breakout of
expense centers. The increasing importance of controlling expenses has led to a desire for a
finer breakdown of expense centers so that responsibility can be more strictly assigned andmonitored. With the increased use of electronic data processing, the task of accumulating
expenses has also become easier.
At the same time, the new structure provides for more detailed fan-out possibilities for
15 3


those larger stores which need a breakdown of more than 66 expense centers for their internal
reporting purposes. For example, within Expense Center 210 (Control Management, GeneralAccounting, and Statistical), a store may provide expense centers for Control Management(21 1), General Accounting (212), and Statistical (213). For external reporting purposes, 211,
212, and 213 would be summarized in 210. The Accounts Payable expense center (230) may bebroken out into an Order Office (231) and an Invoice and Payment Office (235), which wouldthen be summarized in 230 for external reporting purposes.
A "management" expense center whose last two digits are 10 is included in each expensesummary (except 010) to accumulate the supervision and other management costs of opera-
tions, such as fees paid for hiring executives, and dues, and subscriptions, etc.
In providing for the allocation of payroll costs to the management expense centers of the
respective expense summaries, it was determined that those executives who report directly to
the chief executive officer and who represent the policy making level of the company should
be charged to payroll in Expense Account 110-01 instead of in their respective expensecenters. For example, in larger stores where vice presidents-merchandising for fashion mer-
chandise and hard goods oversee the merchandising function of the various departments anddetermine the merchandising philosophy of the store, their payroll would be charged to
110-01 instead of 910-01.
Forthe purpose of reporting statistics to outside financial services and trade publications,
the "10" expense summaries serves as an accumulation of all other expense centers within a
particular expense summary. If a company uses an expense center within an expense sum-
mary and chooses not to use all of the expense centers within that expense summary, then it
should use the 10 expense center to accumulate all of the expenses identified with the specific
centers that it chose not to use. For example, if a company chooses to break out only Branch
Management (130) within the Company Management expense summary, then Internal Audit
(140) and Legal and Consumer Activities (150) should be accumulated in Expense Center 110
along with Executive Office.
A separate expense center for data processing has been included in the revised chart of
accounts. Accounting and data processing were previously combined in Expense Center 210
and no provision existed for transferring data processing costs to other expense centers. In
recent years, the data processing function has assumed the performance of many functions
outside the accounting expense center, such as billing and credit authorization in Expense
Summary 300 - Credit and Accounts Receivable, and Merchandise Control in Expense Sum-mary 900 - Merchandising. Therefore, a separate expense center for data processing has been
added in the revised edition, including a provision for the transfer of expenses to the expense
center served by data processing.
Most data processing costs (including program maintenance, but excepting research
and development, the costs of reruns caused by data processing department errors, and the
net underutilized capacity of the data processing center) should be allocated to other expense
centers. Therefore, the only costs remaining in the data processing expense center will be the
residual costs — that is, underutilized capacity, research and development, etc.
This manual does not recommend any particular basis for the allocation of data proces-
sing expenses. The use of elapsed time for each EDP aDplication performed for other expense
centers would seem to be the most appropriate method. Where a specific EDP application
benefits more than one expense center, another relevant allocation should be made.
Five expense centers are identified as equipment-intensive expense centers—that is,
expense centers where equipment represents a significant investment and where a major
portion of the work operations of the center has been mechanized. These expense centers are
as follows:
280 Data Processing
550 Telephones and Communications720 Receiving and Marking750 Shuttle Services
880 Delivery
154

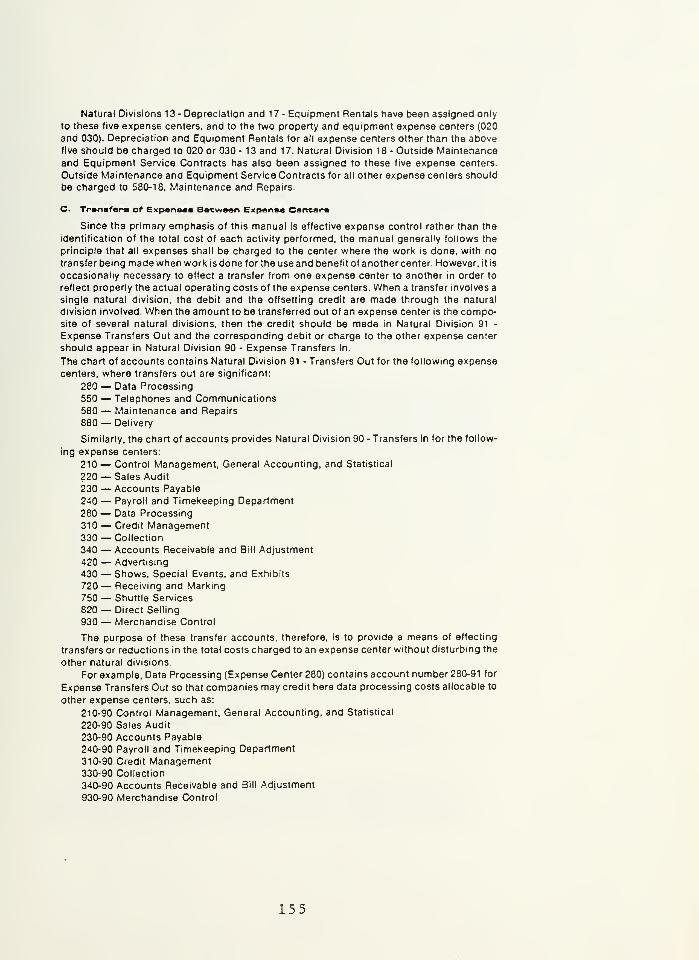
Natural Divisions 13- Depreciation and 17- Equipment Rentals have been assigned only
to these five expense centers, and to the two property and equipment expense centers (020
and 030). Depreciation and Equipment Rentals for all expense centers other than the above
five should be charged to 020 or 030 - 13 and 17. Natural Division 18 - Outside Maintenance
and Equipment Service Contracts has also been assigned to these five expense centers.
Outside Maintenance and Equipment Service Contracts for all other expense centers should
be charged to 580-18, Maintenance and Repairs.
C. Transfers at Expense! Between Expense Centers
Since the primary emphasis of this manual is effective expense control rather than the
identification of the total cost of each activity performed, the manual generally follows the
principle that all expenses shall be charged to the center where the work is done, with no
transfer being made when work is done for the use and benefit of another center. However, it is
occasionally necessary to effect a transfer from one expense center to another in order to
reflect properly the actual operating costs of the expense centers. When a transfer involves a
single natural division, the debit and the offsetting credit are made through the natural
division involved. When the amount to be transferred out of an expense center is the compo-site of several natural divisions, then the credit should be made in Natural Division 91 -
Expense Transfers Out and the corresponding debit or charge to the other expense center
should appear in Natural Division 90 - Expense Transfers In.
The chart of accounts contains Natural Division 91 - Transfers Out for the following expense
centers, where transfers out are significant:
280 — Data Processing
550 — Telephones and Communications580 — Maintenance and Repairs
880 — Delivery
Similarly, the chart of accounts provides Natural Division 90 - Transfers In for the follow-
ing expense centers:
210 — Control Management, General Accounting, and Statistical
220 — Sales Audit
230 — Accounts Payable
240 — Payroll and Timekeeping Department
280 — Data Processing
310 — Credit Management330 — Collection
340 — Accounts Receivable and Bill Adjustment
420 — Advertising
430 — Shows, Special Events, and Exhibits
720 — Receiving and Marking
750 — Shuttle Services
820— Direct Selling
930 — Merchandise Control
The purpose of these transfer accounts, therefore, is to provide a means of effecting
transfers or reductions in the total costs charged to an expense center without disturbing the
other natural divisions.
For example, Data Processing (Expense Center 280) contains account number 280-91 for
Expense Transfers Out so that companies may credit here data processing costs allocable to
other expense centers, such as:
210-90 Control Management, General Accounting, and Statistical
220-90 Sales Audit
230-90 Accounts Payable
240-90 Payroll and Timekeeping Department
310-90 Credit Management330-90 Collection
340-90 Accounts Receivable and Bill Adjustment
930-90 Merchandise Control
155


Allocated Fringa Benefits (Natural Division — 02)
In recent years, supplementary payroll benefits have increased. Since the magnitude of
this expense per employee is substantial, a greater effort should be made to exercise control
over the total of payroll plus supplementary benefits. To accomplish this and to focus super-
visory attention on this problem, a separate natural division (02) has been created for allocated
fringe benefits. Its position in the chart of accounts, immediately after payroll, will focus
attention on the total of payroll and supplementary benefits; thus expense control efforts can
be exerted accordingly.
All of the actual expenses which comprise total fringe benefits are initially accumulated in
their proper natural division in Expense Center 660 - Medical and Other Employee Services
and Expense Center 670 - Supplementary Benefits. The 02 classification has been provided to
permit the redistribution of fringe benefit expenses from Expense Centers 660 and 670 to all
other expense centers having a payroll natural division. The offsetting credit to these charges
should be to Expense Account 660-02 or 670-02.
This allocation of total expense of Expense Centers 660 and 670 to each expense center
should be based on the total payroll costs of each of the expense centers.
O. Natural Divisions of Expense
All expenses of operating a retail firm, whether an individual unit or part of a multi-store
group, and all expenses of the centralized functions that are related to the operation of a group
of retail selling locations, are classified into one of the 17 basic natural divisions of expense.
All of these, except 08— Unclassified, are descriptive of a maior category of expense, referred
to hereafter as natural divisions. A separate basic natural division, 92 — Credits and Outside
Revenues, has been established to provide for such credits to expense as may result from the
receipt of outside revenue or from a charge to accounts outside the framework of the expense
centers.
The natural divisions of expense are as follows:
Basic Natural Divisions
01 — Payroll
03 — Media Costs
04 — Taxes
06 — Supplies
07 — Services Purchased
08 — Unclassified
09 — Travel
10 — Communications11 — Pensions
12 — Insurance
13 — Depreciation
14 — Professional Services
16 — Bad Debts
17 — Equipment Rentals
18 — Outside Maintenance and Equipment Service Contracts
20 — Real Property Rentals
92 — Credits and Outside Revenues
Additional Natural Divisions (Transfer Accounts - See Chapter II, Section C)
02 — Allocated Fringe Benefits
90 — Expense Transfers In
91 — Expense Transfers Out
The 1 7 basic natural divisions of expense together with three additional natural divisions -
02 - Allocated Fringe Benefits, 90 - Expense Transfers In and 91 - Expense Transfers Out —provided for redistribution and offset purposes constitute the backbone of the system of
expense classification presented in this manual.
156


Brief definitions of the natural divisions of expense are given in this chapter. The integra-
tion of natural divisions into the complete scheme of expense summaries and expense centersis outlined in Chapter III, Structure of Expense Centers.
Revisions in Natural Division*
The major revisions in the natural divisions are as follows:
Natural Division 17 - Equipment Costs has been changed to Equipment Rentals.
Natural Division 18 - Outside Maintenance and Equipment Service Contracts has beenadded.
Natural Division 15 - Donations has been eliminated and included in 08 - Unclassified.
Natural Division 03 - Advertising has been changed to Media Costs.
1. Natural Division 17 - Equipment Costs was provided in the former edition of the Retail
Accounting Manual for the accumulation of all costs of major labor-saving equipment pur-chased for the purpose of substituting equipment for personnel. This natural division includedthe depreciation, rentals, and repairs applicable to major labor-saving equipment. That
natural division has been changed from "Equipment Costs" to "Equipment Rentals" in order
to identify specifically by proper natural division all costs of rental equipment in those expensecenters where equipment represents a significant investment
Natural Divisions 13- Depreciation and 18- Outside Maintenance and Equipment Service
Contracts have also been provided in those expense centers where equipment represents a
significant investment so that all costs of owning or leasing and operating equipment are
accumulated in those expense centers.
Where equipment is a significant investment, it Is assumed that the maintenance of this
equipment will also be significant, whether it is performed by the company's own personnel,
through outside service contracts, or included under the terms of a lease for the rental of the
equipment.
2. Natural Division 18 - Outside Maintenance and Equipment Service Contracts has been
created specifically for those expense centers where repair or maintenance work is performed
by an outside company whether under separate contract or on a per-job billing basis. Suchcontracts tend to have an ongoing basis by contrast, instead of the incidental purchase of a
service on an occasional basis which should be charged to 07 - Services Purchased. The need
for a separate natural division for outside maintenance and equipment service contracts
resulted from the advent of sophisticated equipment, such as data processing equipment,
point-of-sale devices, and mechanized receiving and distribution systems, the repair and
maintenance of which requires a degree of expertise normally available only from outside
sources.
Description of Natural Divisions
A summary of the expense items to be charged to each of the natural divisions follows:
Natural Division 01 - Payroll
The natural division Payroll includes, in general, all items of compensation for services
actually rendered by employees of a company, such as salaries, wages, commissions, promo-
tion money, and bonuses and prizes for contests and similar events It also includes payments
or provisions for vacations, sick leave or absence, separation, holiday and military leave, etc.
This account should not be charged with items of payroll which are to be capitalized;
charged to the cost of merchandise in manufacturing, alteration, or service departments; or
billed by outside agencies on a contractual or similar basis.
Natural Division 02 - Allocated Fringe Benefits
A transfer account has been provided to allocate fringe benefits out of their appropriate
expense centers to all other expense centers with a payroll natural division (see Section C of
this chapter).
Natural Division 03 - Media Costs
The natural division Media Costs (which is restricted to only one expense center, 420 -
157

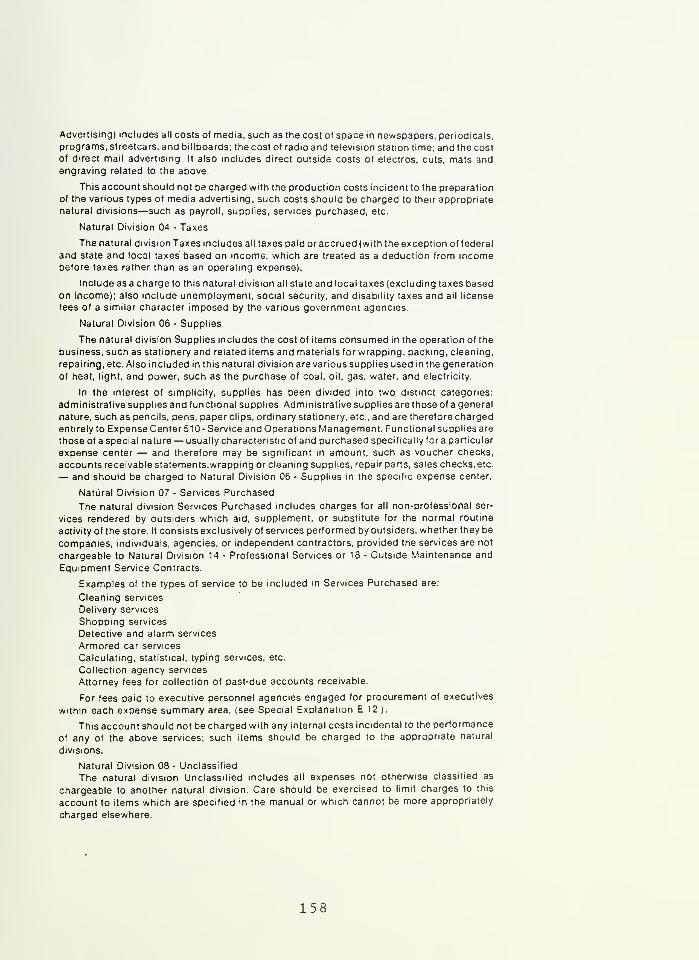
Advertising) includes all costs of media, such as the cost of space in newspapers, periodicals,
programs, streetcars, and billboards; the cost of radio and television station time; and the cost
of direct mail advertising. It also includes direct outside costs of electros, cuts, mats andengraving related to the above.
This account should not be charged with the production costs incident to the preparation
of the various types of media advertising; such costs should be charged to their appropriate
natural divisions—such as payroll, supplies, services purchased, etc.
Natural Division 04 - Taxes
The natural division Taxes includes all taxes paid or accrued (with the exception of federal
and state and local taxes based on income, which are treated as a deduction from incomebefore taxes rather than as an operating expense).
Include as a charge to this natural division all state and local taxes (excluding taxes basedon income); also include unemployment, social security, and disability taxes and all license
fees of a similar character imposed by the various government agencies.
Natural Division 06 - Supplies
The natural division Supplies includes the cost of items consumed in the operation of the
business, such as stationery and related items and materials for wrapping, packing, cleaning,
repairing, etc. Also included in this natural division are various supplies used in the generation
of heat, light, and power, such as the purchase of coal, oil, gas, water, and electricity.
In the interest of simplicity, supplies has been divided into two distinct categories:
administrative supplies and functional supplies. Administrative supplies are those of a general
nature, such as pencils, pens, paper clips, ordinary stationery, etc., and are therefore charged
entirely to Expense Center 510- Service and Operations Management. Functional supplies are
those of a special nature— usually characteristic of and purchased specifically for a particular
expense center — and therefore may be significant in amount, such as voucher checks,
accounts receivable statements,wrapping or cleaning supplies, repair parts, sales checks, etc.
— and should be charged to Natural Division 06 - Supplies in the specific expense center.
Natural Division 07 - Services Purchased
The natural division Services Purchased includes charges for all non-professional ser-
vices rendered by outsiders which aid, supplement, or substitute for the normal routine
activity of the store. It consists exclusively of services performed by outsiders, whether they be
companies, individuals, agencies, or independent contractors, provided the services are not
chargeable to Natural Division 14 - Professional Services or 18 - Outside Maintenance and
Equipment Service Contracts.
Examples of the types of service to be included in Services Purchased are:
Cleaning services
Delivery services
Shopping services
Detective and alarm services
Armored car services
Calculating, statistical, typing services, etc.
Collection agency services
Attorney fees for collection of past-due accounts receivable.
For fees paid to executive personnel agencies engaged for procurement of executives
within each expense summary area, (see Special Explanation E 12 )
.
This account should not be charged with any internal costs incidental to the performance
of any of the above services; such items should be charged to the appropriate natural
divisions.
Natural Division 08 - Unclassified
The natural division Unclassified includes all expenses not otherwise classified as
chargeable to another natural division. Care should be exercised to limit charges to this
account to items which are specified in the manual or which cannot be more appropriately
charged elsewhere.
158


Examples of the type of charges to be included in this natural divison are:
Net cash shortages and bank service chargesSupper moneyPolicy adjustments
Cost of certain lost or damaged merchandise (see Special Explanation M 4 )
Traffic fines
Want ads
Dues and subscriptions
Donations to qualified charities and institutions
Expense of interviewing and hiring executives including all interview travel expensespaid to applicants and moving allowances paid to executives hired (see Special
Explanation E 12 a and b )
Loss on comparison and test purchases
Natural Division 09 - Travel
The natural division Travel includes all expenses arising as a result of domestic (whether
local or out of town) and foreign travel of all employees of the company for business purposes.
Such expenses include transportation, hotel bills, meals, tips, and incidentals.
Also include as a charge to this natural division local transportation expenses, such as
transportation costs for travel between selling locations, warehouses, and/or the central
organization, automobile hire for collectors, messengers, nurses, and items of a similar
character. However, traveling expenses of applicants for positions should be charged to
Natural Division 08 - Unclassified.
Also charge allowances to employees for use of their cars on company business (see
Special Explanation E 6, Chapter IV).
Natural Division 10 - Communications
The natural division Communications includes all expenses relative to the cost of store
and central organization communications, including local and long distance telephone ser-
vices-, all postage (except postage on parcel post delivery and postage on merchandise
returned to vendors, which costs are to be charged back to the vendor and consequently
credited to departmental purchases). Where rental charges are included with the normal
utility billings, the rental should be included in this natural division. However, when a total
communication system is leased or rented from outside sources, the charges incurred in
connection with the rental should be included in Natural Division 17 - Equipment Rentals.
Natural Division 11 - Pensions
The natural division Pensions (which is restricted to only one expense center, 670 -
Supplementary Benefits), includes all expenses relating to pensions, retirement allowances,
and contributions to pension funds, insured and trusteed plans, direct payments to retired
employees.
This natural division should not include internal administrative, clerical, or other costs
incidental to the administration of pension and retirement programs, which should be
charged to the applicable natural division.
Natural Division 12 - Insurance
The natural division Insurance includes the cost of all insurance, including employer
group medical and health insurance. The cost of term insurance should be distributed ever the
term for which the protection is furnished.
Dividends and earnings on mutual and reciprocal insurance contracts should be credited
to this natural division.
Natural Division 13 - Depreciation
The natural division Depreciation includes depreciation of the original cost of the capital
assets employed in the operation of the business, such as:
Buildings
Leasehold improvements
159


EquipmentFurniture and fixtures
Depreciation is limited to those expense centers where equipment represents a signifi-
cant investment in the operations of the expense centers.
Natural Division 14 - Professional Services
The natural division Professional Services includes, in general, the cost of any service of a
highly specialized and professional character furnished by outside professional organiza-
tions, such as:
Legal fees
Accounting fees
Appraisal fees
Management services fees
Architectural fees (if not chargeable to a capital account)
Special surveys and studies
Professional services are distinguished from services purchased in that they are limited to
those services which, by their very nature, are normally secured from outside specialists andexperts qualified by training, and often licensed by governmental bodies or divisions.
Do not include financial or economic services which are regularly issued as publications,
nor attorney fees for the collection of past due accounts receivable which should be charged
to Natural Division 07 - Services Purchased.
Natural Division 16 - Bad Debts
The natural division Bad Debts (which is restricted to only one expense center, 330 -
Collection) includes either actual bad debts written off or the provision relating to an allow-
ance for doubtful accounts. It also includes losses due to bad checks and fraudulent pur-
chases, less recoveries.
Natural Division 17 - Equipment Rentals
The natural division Equipment Rentals includes the costs of all equipment rented or
leased and is restricted to those expense centers where equipment represents a significant
investment in the operation of that expense center.
The infrequent, incidental rental of equipment, such as chairs for fashion shows, is
considered a miscellaneous expense item and should be charged to Natural Division 08 —Unclassified of the expense center using the equipment. It is not to be considered as equip-
ment rental in the same sense that major items of equipment are rented or leased for the
performance of the regular, repetitive work of an expense center.
Natural Division 18 - Outside Maintenance and Equipment Service Contracts
A new natural division has been established because of the increase in recent years in
outside contractual arrangements for servicing and maintaining equipment. Natural Division
18 has been restricted to those expense centers where equipment represents a substantial
investment in the operations of the expense center If this equipment is being leased, the
maintenance may be provided for under the terms of the lease. If the maintenance is stated
separately in the lease, it should be charged to Natural Division 18; if not stated separately, it
should be included in Natural Division 17.
Natural Division 20 - Real Property Rentals
The natural division Real Property Rentals (which is restricted to only one expense center,
020- Real Estate, Buildings, and Building Equipment) includes expenses incurred or rent paid
for real estate used in the operation of the business. Income received for the subletting of
rented space (other tnan the licensing or leasing of a department) should be a credit against
the charges to this natural division.
Do not include in this natural division expenses such as taxes, interest, supplies, repairs,
insurance, and depreciation when paid directly by the store. These items should be charged to
the applicable natural divisions. This natural division applies to real estate only.
160


Natural Division 90 - Expense Transfers In
Natural Division 91 - Expense Transfers Out
For further discussion of transfer accounts, see Section C in this chapter.
Natural Division 92 - Credits and Outside Revenues
This natural division consists of two categories:
1. Credits. There are occasions when an expense center should be credited with amountswhich are either debited to accounts outside of the operating expense ledger or to operations
not directly associated with carrying on the business . In such cases the expense center will be
credited through this natural division regardless of whether the credit applies to one or moreof the basic natural divisions. For exampie, the following are among the types of transactions
which require the utilization of Natural Division 92:
a. Cost of merchandise (as in the case of workroom departments and indirect manu-facturing departments)
b. Capital accounts (for improvements made by the company's regular employees)
c. Tenants and lessees (for services rendered).
2. Outside Revenues. Several items of revenues received by the company which are not
classified as revenues or other income are to be included as a credit to operating expense in
the particular expense center via this natural division. Examples of these types of transactions
are:
a. Income from work performed as a service bureau
b. Check cashing and utility bill service fees
c. Layaway handling charges and charges for CODsd. Sales of used display supplies, wastepaper, and other salvage, and sales of shopping
bags, gift wrap, etc. (when not operated as a costselling department)
e. income from vending machines, locker rentals, pay toilets, etc.
f. Delivery charges to customers
g. Money order and traveler's check fees.
• Note that credit handling and service charge income is not included in this natural
division (see Special Explanations E 14 and E 19e, Chapter IV).
161


APPENDIX C
WORKROOM AND COST DEPARTMENT OPERATINGSTATEMENT -- LINE ITEM EXPLANATIONS
Expienacion of Itami (Uncal In Che Operating Eeatemenc (See Exhibit: 1>
1. Revenue
Only actual amounts received from customers should be considered as revenue for the
cost and workroom departments.
a. In cost selling departments, customer sales revenue should be treated the same as in
any retail department.
b. In indirect manufacturing departments, there should be no sales directly to custom-ers. The work processed should be transferred to a regular retail department or to a
cost selling department for sale to customers.
c. In merchandise service workrooms, the income received from customers is generally
recorded on a sales check in the retail selling department. At the end of the account-
ing, these sales should be accumulated ana credited at this line (or "item") on the
merchandise service workroom statement.
All bookKeeping transfers for work done for other departments in the store should be
treated as reductions of the cost of operating in the cost department.
2. Inventory of Materials and Supplies
Physical inventory valued at cost or market, whichever is lower, at the beginning of the
accounting period.
3. Purchases of Materials and Supplies
This account should include all materials and supplies plus inward transportation
charges, less purchase disccunt.
4. Material and Labor Services Purchased
Include any invoices covering services purchased from outside contractors for work that
is normally performed in a store workroom, and constitutes the principal activity of the
workroom. For example, draperies and slip covers.
5. Total
This is the total of Lines 2, 3, and 4.
6. Inventor/ of Materials and Supplies
Physical inventory at the end of the period valued as in Item 2.
162

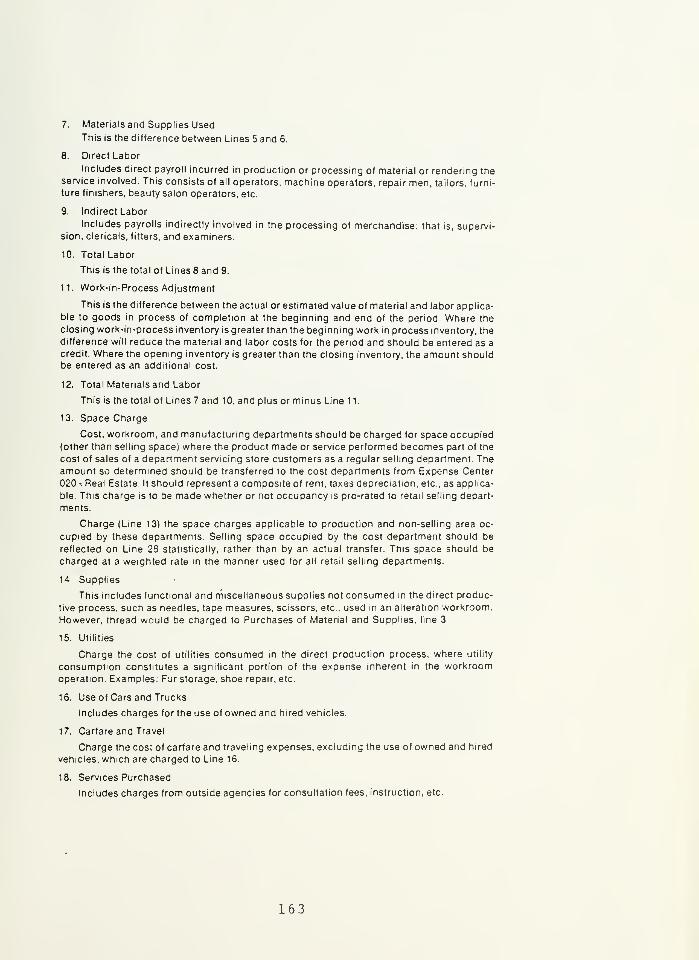
7. Materials and Supplies Used
This is the difference between Lines 5 and 6.
8. Direct Labor
Includes direct payroll incurred In production or processing of material or rendering theservice involved. This consists of all operators, machine operators, repair men, tailors, furni-
ture finishers, beauty salon operators, etc.
9. Indirect Labor
Includes payrolls indirectly involved in the processing of merchandise: that is, supervi-sion, clericals, fitters, and examiners.
10. Total Labor
This is the total of Lines 8 and 9.
11. Work-in-Process Adjustment
This is the difference between the actual or estimated value of material and labor applica-
ble to goods in process of completion at the beginning and end of the period Where the
closing work-in-process inventory is greater than the beginning work in process inventory, the
difference will reduce the material and labor costs for the period and should be entered as a
credit. Where the opening inventory is greater than the closing inventory, the amount shouldbe entered as an additional cost.
12. Total Materials and Labor
This is the total of Lines 7 and 10, and plus or minus Line 11.
13. Space Charge
Cost, workroom, and manufacturing departments should be charged for space occupied
(other than selling space) where the product made or service performed becomes part of the
cost of sales of a department servicing store customers as a regular selling department. Theamount so determined should be transferred to the cost departments from Expense Center
020 -. Real Estate. It should represent a composite of rent, taxes depreciation, etc., as applica-
ble This charge is to be made whether or not occupancy is pro-rated to retail selling depart-
ments.
Charge (Line 13) the space charges applicable to production and non-selling area oc-
cupied by these departments. Selling space occupied by the cost department should be
reflected on Line 28 statistically, rather than by an actual transfer. This space should be
charged at a weighted rate in the manner used for all retail selling departments.
14 Supplies
This includes functional and miscellaneous supplies not consumed in the direct produc-
tive process, such as needles, tape measures, scissors, etc , used in an alteration workroom.
However, thread would be charged to Purchases of Material and Supplies, line 3
15. Utilities
Charge the cost of utilities consumed in the direct production process, where utility
consumption constitutes a significant portion of the expense inherent in the workroomoperation. Examples; Fur storage, shoe repair, etc.
1 6. Use of Cars and Trucks
Includes charges for the use of owned and hired vehicles.
1 7. Carfare and Travel
Charge the cost of carfare and traveling expenses, excluding the use of owned and hired
vehicles, which are charged to Line 16.
18. Services Purchased
Includes charges from outside agencies for consultation fees, instruction, etc.
163


19. Repairs to Equipment
Charge the cost of repairs of equipment and machinery used in the manufacturing
process of the workroom.
20. Payroll Taxes and Supplementary Benefits
Charge the cost of unemployment and workmen's compensation insurance and FICA on
direct and indirect labor, plus such supplementary benefits as are applicable to production
costs.
21. Insurance
This account includes fire and theti insurance, particularly in the case of fur storage
departments.
22. Depreciation
Charge the depreciation on operating equipment and equipment of a specialized nature
which is specifically related to the workroom operation.
NOTE: In the case of all the direct manufacturing charges, lines 13 through 22. whichrepresent debits to the cost of production of sales of the cost department, credit Natural
Division - 92 of the Expense Center(s) from which these charges are transferred.
With respect to indirect manufacturing departments and merchandise service work-
rooms, some stores have been in the practice of charging taxes other than payroll taxes andindirect administrative expenses, such as office costs and executive salaries, to workroomcosts. The altogether sensible theory for doing so is: If workroom cost data are used to
determine, among other things, whether or not the workroom should be run by the store or
leased to an outside contractor, these overhead costs must be considered Certainly an
outsKle contractor would include similar costs in the charge for doing this work for the store.
However, there are so many ways to prorate such overhead costs, and so much detail is
involved in preparing many monthly journal entries to credit various overhead expense
accounts and charge workroom costs, that the problem of standardization would probably
be solved better by eliminating most overhead charges from workroom costs. This will not
and should not deter stores from noting on their internal workroom statements that if the
workroom had been charged with all overhead, the workroom loss would have been so muchgreater.
23. Total Other Manufacturing Charges
This is the total of Lines 13 through 22.
24. Total Cost of Production
This is the total of Lines 12 and 23.
25. Credits from Transfers
Those transfers which represent work done for departments of the store other than the
parent departments are shown as reductions of the cost of production of the cost department.
Also include credit for items manufactured for selling departments, whether they are principal
retail departments of the workroom or not. The estimated cost should be charged to the selling
departments' cost purchases. Work done for expense centers—such as display, porters'
uniforms, etc.—will be credited also to Line 25. All transfers should represent only the actual
cost of the work done. In most cases, it is necessary to use estimated costs, but wherever
estimated costs are used, they should be reviewed regularly for accuracy. In no case should a
theoretical profit be placed on top of the cost.
26. Net Cost of Production
This is the difference between Lines 24 and 25.
164


27. Profit or Loss-Indirect Manufacturing Departments and Merchandise Service Work-rooms
Indirect Manufacturing Departments
The profit or loss is the same as net cost of production, Line 26. The profit or loss of a
manufacturing department should be charged to the cost purchases of the selling depart-
ments buying its products, in proportion to the transfers to those departments during the
period. The operating profit or loss reflects errors in estimating the cost of the original
transfers.
Merchandising Service Workrooms
This is the difference between Lines 1 and 26.
The profit or loss of a merchandise service workroom is to be distributed as workroomcost to the parent selling departments using the service in proportion to the amount of workdone for each parent department. Wherever possible, the factor to be used in measuring the
proportion of work done should be a work unit of time Standard units of time for each
element in every workroom operation should be established. For example: Enlarging the
armholes in a woman's coat might have a standard time of forty minutes, and, assuming ten
minutes represents one work unit, would represent four work units The net cost of produc-
tion, Line 26, should be distributed to the parent departments on the basis of the work units.
Then, each parent department should receive credit for the amount of revenue it has ob-
tained, and the difference between its portion of the net cost of production and such revenue
represents the amount of workroom cost to the individual selling department.
The following example will illustrate the distribution of workroom costs:
Assume net cost of production (Line 26) is $2,000 and income from sales to customers
(Line 1) is S500, out of which $50 is applicable to Department 30 and $450 to Department
35. The loss (Line 27) is $1,500. Out of a total of 1,000 work units produced during the
period, Departments 30 and 35 accounted for 200 and 800 work units, respectively. The
S2.000 (net cost of production) should be distributed to Departments 30 and 35 in the
same ratio as the work units of the departments are to the total work units—that is, $400
should be allocated to Department 30 and $1 ,600 to Department 35. These amounts are
then reduced by the income from sales to customers, $50 and S450, respectively. The net
charges to Department 30 are $350 and to Department 35, $1,150. These total depart-
ment charges of $1,500 are equal to the amount of the profit or loss (Line 27).
28. Operating Expenses (Cost Selling Departments Only)
The charging of total store expenses to the cost departments snould be done only in the
case of cost selling departments and in the same manner used for all retail selling depart-
ments. This section of the statement will not be used in the case of manufacturing depart-
ments or merchandise service workrooms.It is recommended that such allocations of expense center costs as may be directly
associated with specific expense centers in this manual be identified on the cost selling
department operating statement by individual headings under 28a-28b, etc. The charges to
operating expenses of cost selling departments which cannot be specifically related to
individual expense centers are to be combined and shown under a general caption.
All cost selling departments selling payroll included here shall also be included in cost
department statements statistically rather than by a transfer entry.
29. Total Operating Expenses
This is the total of Lines 28a, b, c, etc.
30 Operating Profit or Loss-Cost Selling Departments
This is the difference between Line 1 and the total of Lines 26 and 29.
The profit or loss of a cost selling department, Line 30, is not to be distributed to any other
department, but is treated the same as the profit or loss in any retail-selling department.
165


LIST OF REFERENCES
Standard and Poors. Industry Surveys . New York:Standard and Poors, 1984
D. Wilson, Rear Admiral, SC, USN, Commander,Navy Resale and Services Support Office, interview heldduring visit to Naval Postgraduate School, Monterey,California, June, 1982
National Retail Merchants Association. RetailAccounting Manual . New York: National RetailMerchants Association, 1976
Hopwood, Anthony G.,Accounting and Huma n Behavior ,
Prentice-Hall, 1976.
Seed, Allen H. Ill, "Improving the Effectiveness ofManagement Reports," Financial Executive ,
Sep tember 1969
.
Moscarello, Louis C., Retail Accounting andFinancial Control , 4th ed., Ronald Press, 1976.
Luke, Hugh D., "Dynamic Accounting for EffectiveManagement," Management Accounting ,
May 19 70.
Navy Resale System Office Information BulletinOG#79-17, Guide to Preparing Navy Exchange OperatingBudgets , 29 October 1979.
166


INITIAL DISTRIBUTIOi 1ST
No . Copies
Defense Technical Information CenterCameron StationAlexandria, Virginia 22314
Defense Logistics Studies Information ExchangeU.S. Army Logistics Management CenterFort Lee, Virginia 23801
Library, Code 0142Naval Postgraduate SchoolMonterey, California 93943
RADM Donald E. Wilson, SC , USNNavy Resale and Services Support OfficeFort Wadswor thStaten Island, New York 10305
Mr. Mark E. HoodDirector of Corporate AccountingThe May Department Stores Company611 Olive StreetSaint Louis, Missouri 63101
Professor Kenneth Euske, Code 54 EeDepartment of Administrative ScienceNaval Postgraduate SchoolMonterey, California 93943
LtCol Joseph F. Mullane, Code 0309Naval Postgraduate SchoolMonterey, California 93943
Navy Exchange Officer, Code 48Naval Postgraduate SchoolMonterey, California 93943
LCDR Michael S. Barnett, SC, USNSupply & Fiscal Officer (W50)Naval Communication Area Master StationEASTPAC HonoluluWahiawa, Hawaii 96786
167


21 APR 91 38665
205354
Thd Thesis
B2JB2321c.'c.l
BarnettAn evaluation of the
Navy Resale System^
s
operating and financialstatements.
21 KAY 87
it APR 91 nil?
20535«»
ThesisB2321c. 1
BarnettAn evaluation of the
Wavy Resale System^
s
operating and financialstatements
.
S7**>