Embed Size (px)
Citation preview
Western University Western University
Scholarship@Western Scholarship@Western
Electronic Thesis and Dissertation Repository
11-20-2013 12:00 AM
An Evaluation of the Frankfort Mandibular Plane Angle Bisector An Evaluation of the Frankfort Mandibular Plane Angle Bisector
(FMAB) Wits Appraisal in the Assessment of Anteroposterior Jaw (FMAB) Wits Appraisal in the Assessment of Anteroposterior Jaw
Relationships Relationships
Natalie Swoboda, The University of Western Ontario
Supervisor: Dr. Antonios Mamandras, The University of Western Ontario
A thesis submitted in partial fulfillment of the requirements for the Master of Clinical Science
degree in Orthodontics
© Natalie Swoboda 2013
Follow this and additional works at: https://ir.lib.uwo.ca/etd
Part of the Diagnosis Commons, and the Orthodontics and Orthodontology Commons
Recommended Citation Recommended Citation Swoboda, Natalie, "An Evaluation of the Frankfort Mandibular Plane Angle Bisector (FMAB) Wits Appraisal in the Assessment of Anteroposterior Jaw Relationships" (2013). Electronic Thesis and Dissertation Repository. 1870. https://ir.lib.uwo.ca/etd/1870
This Dissertation/Thesis is brought to you for free and open access by Scholarship@Western. It has been accepted for inclusion in Electronic Thesis and Dissertation Repository by an authorized administrator of Scholarship@Western. For more information, please contact [email protected].

AN EVALUATION OF THE FRANKFORT MANDIBULAR PLANE ANGLE BISECTOR (FMAB) WITS APPRAISAL IN THE ASSESSMENT OF
ANTEROPOSTERIOR JAW RELATIONSHIPS
(Thesis format: Monograph)
by
Natalie Andrea Swoboda
Graduate Program in Orthodontics
A thesis submitted in partial fulfillment of the requirements for the degree of
Master of Clinical Dentistry
The School of Graduate and Postdoctoral Studies The University of Western Ontario
London, Ontario, Canada
© Natalie Swoboda 2014

ii
Abstract
An accurate anteroposterior measurement of jaw relationships is essential in orthodontic
diagnosis and treatment planning. The purpose of this longitudinal study was to establish a
new cephalometric Wits appraisal using a bisector of the mandibular plane angle, named the
Frankfort Mandibular Plane Angle Bisector (FMAB). The FMAB was used to assess the
sagittal jaw relationship in a sample of Class I individuals, and compare this measurement to
the ANB angle and the Wits appraisal using the Maxillomandibular Bisector (MMB).
The data were collected from pre-treatment (T0), immediate post-treatment (T1) and two
year post-retention (T2) lateral cephalograms of 61 male and 60 female Class I subjects.
Non-extraction, fixed orthodontic appliance treatment in the permanent dentition was carried
out for these patients. Cephalometric data were compared to 19 male and 19 female Class I
subjects who had no orthodontic treatment and served as controls.
The FMAB was determined to be a reproducible reference plane which undergoes change in
response to growth and treatment, consistent with the changes seen in the ANB angle. A
good correlation (r>0.86) was found between the MMB and FMAB Wits appraisal
measurements in both the control and treatment groups for all time periods, indicating that
the use of either of these measures may be indicated in cephalometric analysis.
Key Words: Wits Appraisal, Frankfort Mandibular Plane Bisector, Anteroposterior Skeletal
Discrepancy
iii
Acknowledgments
I would like to start by thanking my thesis supervisor, Dr. Antonios Mamandras. I am
grateful for the support and guidance you have provided – not only in the completion of this
thesis – but as a mentor throughout my orthodontic residency over the past three years.
Thank you also to Dr. Richard Bohay, for your constructive input and keeping me focused on
the task at hand. Your patience and statistical expertise are greatly appreciated.
To the members of my thesis examination committee, Drs. Gross, Inocencio and Tassi –
thank you for your time, effort and helpful suggestions.
Thank you to all of my fellow residents for your camaraderie, and for creating a great
environment to learn in every day.
To my mom, thank you for your unwavering belief in me, and giving me the confidence to
reach for the stars.
Above all I would like to thank my husband Mike: Thank you for your constant support and
encouragement throughout the challenges of graduate school and life. I am truly blessed and
so thankful to have you in my life. I love you.

iv
Table of Contents
Abstract ............................................................................................................................... ii
Acknowledgements ............................................................................................................ iii
Table of Contents .............................................................................................................. iiv
List of Tables ...................................................................................................................... v
List of Figures .................................................................................................................... vi
List of Appendices ............................................................................................................ vii
Introduction ......................................................................................................................... 1
Materials and Methods ........................................................................................................ 8
Results ............................................................................................................................... 13
Discussion ......................................................................................................................... 20
Conclusion ........................................................................................................................ 26
References ......................................................................................................................... 27
Appendices ........................................................................................................................ 32
Curriculum Vitae .............................................................................................................. 39
v
List of Tables
Table 1: Standard Error in the Preliminary Sample ................................................................ 13
Table 2: Standard Error and Reproducibility in the Study Sample ........................................ 13
Table 3: Ages at T0, T1 and T2 for the Control and Treatment Groups and the t-Values for
the Difference in Each Time Period ........................................................................................ 14
Table 4: Means and Standard Deviations at Each Time Period in the Control and Treatment
Groups ..................................................................................................................................... 14
Table 5: Means and Standard Deviations at Each Time Period in the Control Group for Males
and Females ............................................................................................................................ 14
Table 6: Means and Standard Deviations at Each Time Period in the Treatment Group for
Males and Females .................................................................................................................. 15
Table 7: Differences Between Control and Treatment Groups and Their t-Values in Each
Time Period (Subtraction of Means: Treatment-Control) ...................................................... 15
Table 8: Mean Change Between Each Time Period in the Control and Treatment Groups for
Both Males and Females ......................................................................................................... 17
Table 9: Mean Change Between Each Time Period in the Control and Treatment Groups for
Males ....................................................................................................................................... 17
Table 10: Mean Change Between Each Time Period in the Control and Treatment Groups for
Females ................................................................................................................................... 17
Table 11: Pearson Correlation Cofficients Within the Time Periods for the Control and
Treatment Groups ................................................................................................................... 19
vi
List of Figures
Figure 1: The Frankfort Mandibular Plane Angle Bisector (FMAB) Anteroposterior Wits
Measurement ............................................................................................................................. 6
Figure 2: Cephalometric Measurements Performed ............................................................... 12
Figure 3: Outliers Detected in the Palatal Plane Inclination (PP-FH) for the Female
Treatment Group ..................................................................................................................... 16
Figure 4: Outliers Detected in the Mandibular Plane Inclination (MP-FH, a.k.a FMA) for the
Female Treatment Group ........................................................................................................ 16

vii
List of Appendices
Appendix I: FABA Angle, as proposed by Yang and Suhr (1995) ........................................ 32
Appendix II: AF-BF, as proposed by Chang (1987)............................................................... 32
Appendix III: Pi analysis, as proposed by Kumar (2012) ....................................................... 33
Appendix IV: Yen Angle, as proposed by Neeta et al. (2009) ............................................... 34
Appendix V: W Angle, as proposed by Bhad et al. (2013) .................................................... 34
Appendix VI: Definition of Cephalometric Landmarks ......................................................... 35
Appendix VII: Definition of Cephalometric Planes and Angles ............................................ 35
Appendix VIII: Constructed Cephalometric Points ................................................................ 35
Appendix IX: Control Subjects from the Burlington Orthodontic Research Centre .............. 36
Appendix X: Treated Subjects from the Western University Graduate Orthodontic Clinic .. 37
1
Introduction
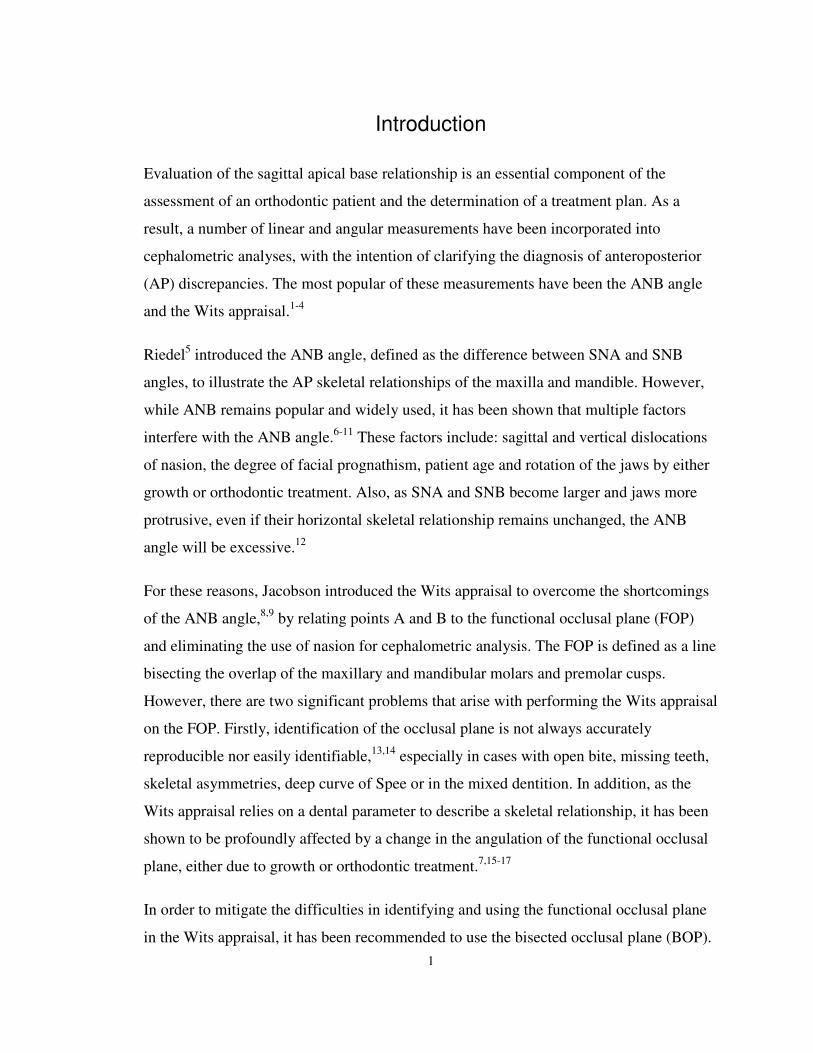
Evaluation of the sagittal apical base relationship is an essential component of the
assessment of an orthodontic patient and the determination of a treatment plan. As a
result, a number of linear and angular measurements have been incorporated into
cephalometric analyses, with the intention of clarifying the diagnosis of anteroposterior
(AP) discrepancies. The most popular of these measurements have been the ANB angle
and the Wits appraisal.1-4
Riedel5 introduced the ANB angle, defined as the difference between SNA and SNB
angles, to illustrate the AP skeletal relationships of the maxilla and mandible. However,
while ANB remains popular and widely used, it has been shown that multiple factors
interfere with the ANB angle.6-11
These factors include: sagittal and vertical dislocations
of nasion, the degree of facial prognathism, patient age and rotation of the jaws by either
growth or orthodontic treatment. Also, as SNA and SNB become larger and jaws more
protrusive, even if their horizontal skeletal relationship remains unchanged, the ANB
angle will be excessive.12
For these reasons, Jacobson introduced the Wits appraisal to overcome the shortcomings
of the ANB angle,8,9
by relating points A and B to the functional occlusal plane (FOP)
and eliminating the use of nasion for cephalometric analysis. The FOP is defined as a line
bisecting the overlap of the maxillary and mandibular molars and premolar cusps.
However, there are two significant problems that arise with performing the Wits appraisal
on the FOP. Firstly, identification of the occlusal plane is not always accurately
reproducible nor easily identifiable,13,14
especially in cases with open bite, missing teeth,
skeletal asymmetries, deep curve of Spee or in the mixed dentition. In addition, as the
Wits appraisal relies on a dental parameter to describe a skeletal relationship, it has been
shown to be profoundly affected by a change in the angulation of the functional occlusal
plane, either due to growth or orthodontic treatment.7,15-17
In order to mitigate the difficulties in identifying and using the functional occlusal plane
in the Wits appraisal, it has been recommended to use the bisected occlusal plane (BOP).

2
4,6,18 The BOP is defined as a plane bisecting the overlap of the distobuccal cusps of the
first permanent molars and incisor overlap, as described by Downs19
. In fact, the
functional occlusal plane tends to present negative Wits appraisal values, compared to
measurements to the bisected occlusal plane or mandibular incisor occlusal plane since
FOP rotates more clockwise with respect to a traditional occlusal plane, resulting in less
correlation with ANB.20
Additionally, Thayer21
compared measurements to the FOP and
BOP, and found that either occlusal plane can be used as an adjunct in the assessment of
anteroposterior jaw relationships. He found that BOP Wits measurements were related to
dental measures, whereas FOP Wits measurements were more related to skeletal
measures. However, Palleck et al.16
showed that the Wits measurement to the BOP was
more reproducible than to the FOP, attributed largely to the marked change of FOP
inclination with growth in Class I and Class III subjects. Del Santo3 investigated the
effect of occlusal plane inclination on ANB and Wits appraisal to the bisected occlusal
plane. His study showed that there was a lack of consistency between ANB and BOP
Wits in high occlusal plane angle patients, however in low occlusal plane angle patients,
both assessments were found to be consistent.
To overcome these limitations, several new reference planes, linear distances and angles
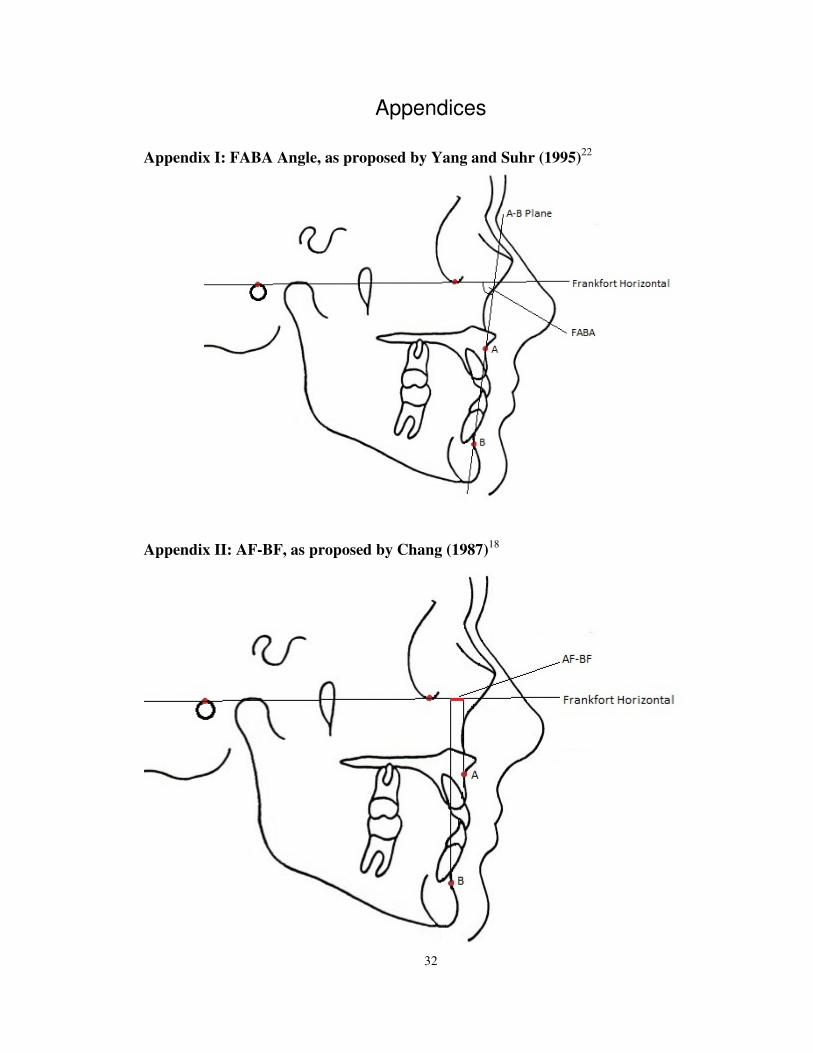
have been proposed. Yang and Suhr22
measured the FABA angle, defined as the angle
between the plane A-B and the Frankfort horizontal plane (shown in Appendix I). While
Chang18
projected the points A and B onto the Frankfort horizontal plane and measured
the linear distance between them, which he called AF-BF, which is shown in Appendix
II. Neither of these approaches considered the rotational effects of the jaws with growth.
In contrast, Hall-Scott23
projected the points A and B onto the bisector of the angle
between the palatal and mandibular plane, which she called the maxillo-mandibular
bisector (MMB). Studies have shown that the MMB Wits measurements are more
reproducible than Wits measurements to either the FOP or BOP, and that growth and
treatment changes in the MMB Wits values reflect changes described by the ANB
angle.16,17
Correlation coefficients between MMB Wits and ANB have been shown to be,
on average, 0.66 in Class I subjects, 0.71 in Class II/1 subjects and 0.77 in Class III
subjects.16,17
3
However, a concern exists in the utilization of the palatal plane as a reference plane in the
MMB Wits appraisal. While the palatal plane has been shown to be stable with age, its
inclination is highly variable, requiring additional cephalometric data to ensure a more
accurate diagnosis.24
In addition, while the MMB may present a possible solution for
occlusal plane rotation, it does not account for the possible influence of facial type where,
the rotation of the palatal plane and mandibular plane will be vary in dolichofacial and
brachyfacial subjects.20
Therefore, a stable cranial reference line to the mandibular plane
such as the Frankfort horizontal, may be better at identifying the rotational effects of the
jaws. It has been shown that the inclination of the Frankfort horizontal plane remains
fairly stable with growth,25
as a result of the cephalocaudal gradient of growth.
Tanaka et al.20
assessed the influence of the facial pattern on cephalometric sagittal
relationships and classified the facial patterns based on the facial height ratio (FHR) and
the mandibular plane angle (FMA). The sagittal relationships investigated were the ANB
angle, Wits appraisal and AF-BF. It was found that the ANB angle and AF-BF values
varied with the facial pattern, being lower in brachyfacial subjects and higher in
dolichofacial subjects. While Tanaka et al. showed that ANB values vary with facial
patterns, Nanda26
showed that there is no statistically significant correlation between
ANB and mandibular plane angles. Tanaka et al20
also found that the correlation for the
Wits appraisal and ANB angle in all facial groups was r2=0.62, indicating that facial type
does not influence the correlation between ANB and Wits. Thus, a reference plane
utilizing the mandibular plane, an indicator of facial type, is not expected to adversely
alter the relationship between the ANB angle and Wits appraisal.
More recently, various analyses have been developed to account for the rotational effects
of the jaws, which include the Pi analysis,27
the Yen angle28
and the W angle.29
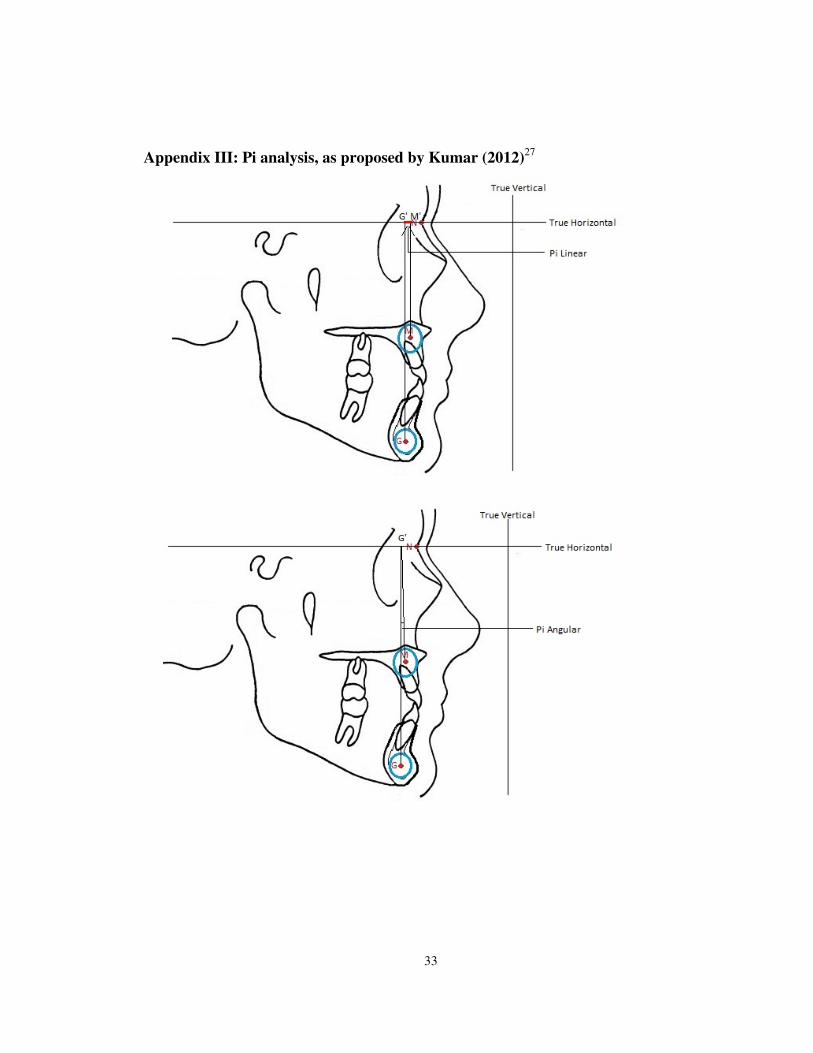
The Pi
analysis is comprised of a Pi linear and a Pi angle measurement, and shown in Appendix
III. It uses the true vertical line, which is obtained in natural head position (NHP), and the
true horizontal as reference planes. The true horizontal is a line perpendicular to the true
vertical line through nasion. Points defined at the midpoint of the premaxilla (point M)
and the center of the largest circle tangent to the internal inferior, anterior and posterior
surfaces of the mandibular symphysis (called point G) are then projected onto the true

4
horizontal line. Then, the distance between these projected points (called M` and G`,
respectively) on the true horizontal is defined as Pi linear. The Pi angle measures the
angle between points M and G at the point G’, which is projection of G point onto the
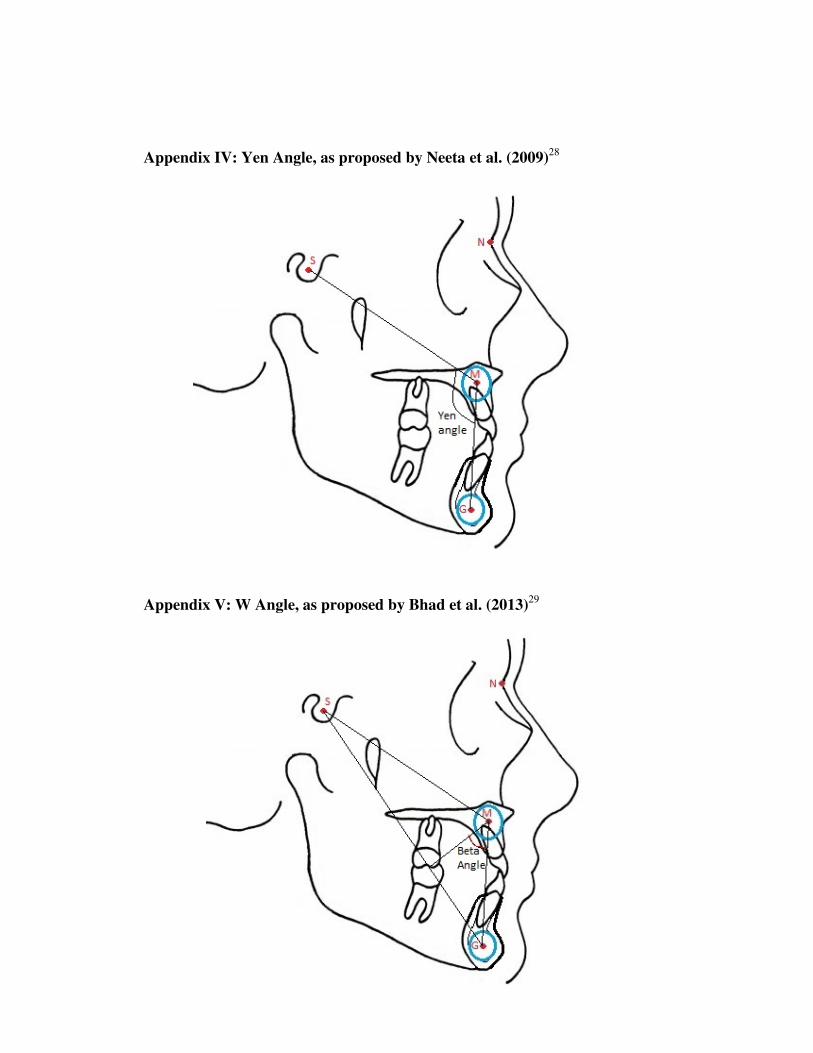
true horizontal line. Alternatively, the Yen angle (shown in Appendix IV) measures the
inferior posterior angle created by the midpoint of the sella turcica (sella, point S), point
M and point G (as previously defined in the Pi analysis). Finally, the W angle (shown in
Appendix V) bisects the Yen angle at point M and measures the inferior anterior angle.
None of these new analyses measurements have been studied with respect to how they
change with growth. Kumar et al.27
showed that the Pi analysis had no statistically
significant correlations with ANB or Wits; while no correlation studies were performed
for the Yen or W angles. However, the effects of growth on the ANB angle and MMB
Wits appraisal have been investigated. In subjects not receiving orthodontic treatment,
Palleck et al.16
and Foley et al.17
showed that the MMB Wits measurement tended to
decrease from ages 12 to 16 years, on average 1.05mm in Class I subjects, 0.83mm in
Class II subjects and 1.22mm in Class III subjects. These same investigators showed that
the ANB angle decreased to a lesser extent with growth from ages 12 years to 16 years,
on average 0.52° in Class I subjects, 0.53° in Class II subjects and 0.71° in Class III
subjects. These values are consistent with Bishara,1 who found that the ANB angle
decreases on average 0.60° with growth from age 12 to 16 years. In untreated subjects
with good occlusions, Lux et al30
showed that between age seven and 15 years, the ANB
angle decreased from 4.44° to 2.79° (1.65° decrease) in males, and from 3.41° to 2.11°
(1.3° decrease) in females. Both of these changes were found to be statistically
significant.
Thus, a need still remains for an anteroposterior jaw measurement to be made close to the
dental bases that does not rely on dental measurements. This measurement should be
based on a plane for which the cant does not change with growth or treatment, and is not
highly variable in its inclination.23
It is proposed that the bisector of the Frankfort
Mandibular Plane Angle be used for this purpose, the FMA Bisector (FMAB). The plane
is geometrically derived from the Frankfort horizontal and mandibular plane, to which a

5
Wits appraisal is performed by extending points A and B to the bisector and measuring
the distance between them.
The Frankfort Mandibular Plane Angle Bisector (FMAB) Wits Measurement
The FMAB Wits appraisal assesses the skeletal relationship between the maxilla and the
mandible in the sagittal plane. It uses the angle between two skeletal reference planes —
The Frankfort Horizontal and Mandibular Plane — to create a bisecting reference plane,
to which points A and B are projected onto in a perpendicular fashion. The distance
between these projected points is a measure that indicates the severity and the type of
skeletal dysplasia in the sagittal dimension (Figure 1).

6
FMAB Wits = distance between A1 and B1 in mm
A1 anterior to B1 = +
A1 posterior to B1 = -
Figure 1: The Frankfort Mandibular Plane Bisector (FMAB) Anteroposterior Wits
Measurement

7
Study Objectives
The purpose of this study is threefold:
1. Evaluate age-related changes in sagittal jaw relationship over a sufficiently
large time interval from pre-pubertal through pubertal development (at ages
12, 14, 16 years) using the FMAB, the ANB angle and the MMB in both
males and females with Class I malocclusions;
2. Evaluate changes between Class I treated and control groups to determine any
changes in the anteroposterior measurements due to treatment;
3. Determine how the measure FMAB correlates with the well-established
angular measure ANB and with an anteroposterior linear measure, the MMB.
8
Materials and Methods
Prior to performing this cephalometric study investigating a new anteroposterior
discrepancy measurement, a preliminary study was performed on 15 subjects, to ensure
that the validity of the Frankfort Mandibular Plane Angle Bisector (FMAB) Wits
measurement was satisfactory. Initial measurement of the ANB angle, MMB Wits and
FMAB Wits was completed then repeated two weeks later. The results of this preliminary
investigation are shown in Table 1.
This longitudinal study was composed of both a control and a treatment sample. Records
for the control subjects were derived from the Burlington Growth Centre (BGC), located
at the Faculty of Dentistry, University of Toronto in Toronto, Canada. The radiographic
enlargement of the cephalometric data from BGC is 9.84%. The age groups utilized in
this study were age 12 years (T0), age 14 years (T1) and age 16 years (T2). The data for
the treatment subjects were obtained from the archives of the Western University
Graduate Orthodontic Clinic. Full records consisted of serial lateral cephalograms taken
at approximately 12 (pre-treatment [T0]), 14 (post-treatment [T1]) and 16 (post-retention
[T2]) years of age. The radiographic enlargement of the cephalometric data from Western
University is 8.0% for any cephalograms taken prior to 2007, and 9.5% after and
including 2007, due to a change in imaging system. The total study sample consisted of
38 control subjects (19 male, 19 female) and 121 treated subjects (61 male, 60 female).
Patient identification numbers are listed in Appendix IX for the control group, and
Appendix X for the treatment group.
The criteria for inclusion in this study were:
• Class I molar relationship at T0 as determined from dental casts
• ANB angle less than 4.5° at T0
• Overjet less than 5 mm at T0
• Full permanent dentition (excluding third molars)

9
The treatment subjects met the following additional inclusion requirements:
• Non-extraction orthodontic treatment with full fixed appliances
• No extraoral appliances
• Passive retention, including either Hawley, fixed or Essix retainers
Subjects who did not meet these criteria were excluded.
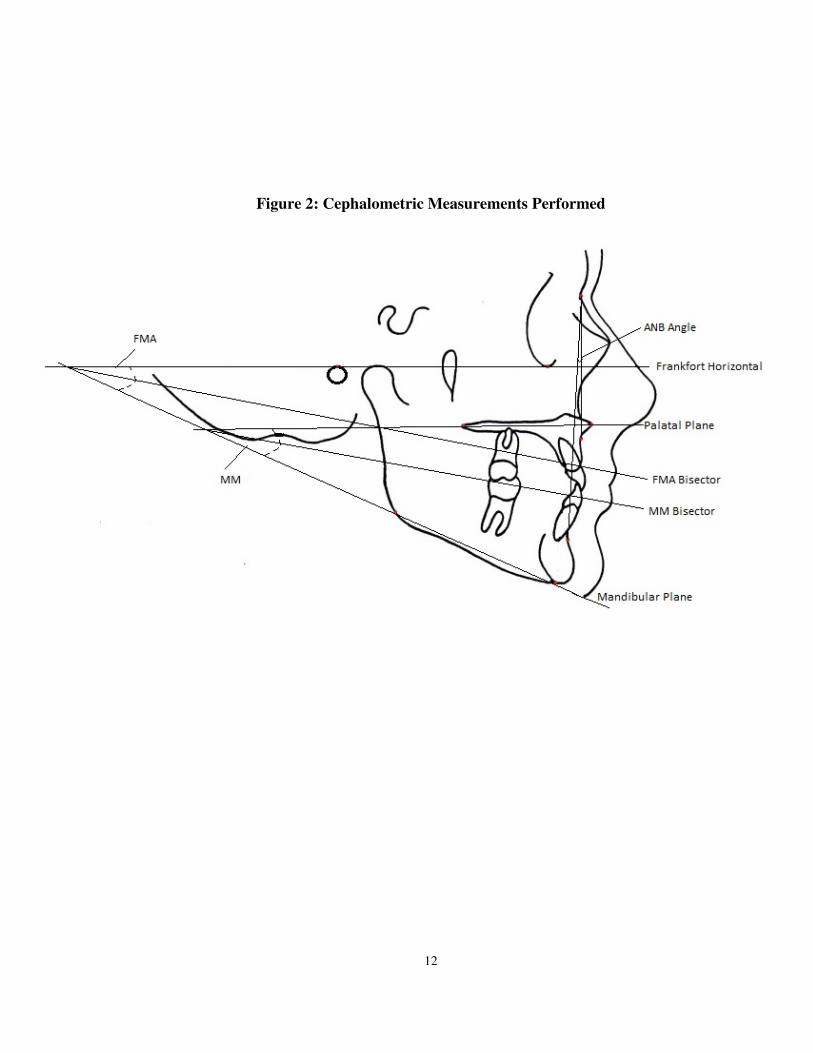
Each lateral cephalogram was traced by the same investigator (NAS). Three
cephalometric angles and two linear measures were drawn and measured on each tracing
using the Dolphin Imaging Software* Version 11. Differences in radiographic
magnification were calibrated for using the Dolphin Imaging Software. The
measurements performed were:
1. the ANB angle (ANB)
2. the Frankfort Mandibular Plane Angle (FMA)
3. the Maxillomandibular angle (MM)
4. the Maxillomandibular Bisector (MMB) Wits appraisal
5. the Frankfort Mandibular Plane Angle Bisector (FMAB) Wits appraisal.
Descriptions of the landmarks, angles, linear measures and constructed points are listed in
Appendix VI, VII and VIII. A cephalometric tracing is outlined in Figure 2, depicting all
of the measurements of interest.
Sample Size
Calculations using mean values and standard deviations of the MMB Wits measurements
in a treated Class I sample, as reported by Palleck et al.16
were used to determine the
desired sample size for this study. Using GPower Software Version 331
for sample size
calculation, using an alpha value of 0.05 and with 80% power, revealed a minimum
sample size of 47 subjects per group was required. Due to limited availability of subjects
* Dolphin Imaging, Chatsworth, CA, USA

10
from the Burlington Growth Centre that fulfilled the inclusion criteria, only the treatment
subjects satisfied the sample size requirements.
Error Study
Three weeks after the final cephalometric radiograph included in the study sample was
traced, an error study was performed. Repeated measurements were performed on
cephalograms of 20 randomly selected subjects at each time point (i.e. at T0, T1 and T2),
resulting in 60 repeated measurements. Random selection was performed by assigning
each subject a number from 1 to 159, then generating a string of random numbers via
online software (http://www.randomizer.org/), which dictated the chosen subjects based
on their assigned number. A Standard Deviation of Measurement Error (SE) was then
calculated for each sample according to Dahlberg’s formula: √(Σd2/2n), where d is the
difference between the pairs, and n is the number of pairs.
To quantify the reliability of the measures in the study sample, the reproducibility of
measurement (called R) was calculated using the formula: R=((S2x-(S
2e/2))/S
2x, where
S2x is the variance of the first set of measurements, and S
2e is the variance of the
difference between the initial and repeated measurements.
Statistical Analysis
The data were input into Microsoft Excel® spreadsheet format and uploaded into IBM
SPSS® Version 20.0† statistical software package.
The data were assessed for normality and the presence of outliers prior to analysis with
parametric tests. A Shapiro-Wilk W-Test was applied to determine the distribution of
data, and boxplots were plotted in order to determine the presence and location of any
outliers. For every outlier detected it was found that the outlier had no significant impact
† IBM Corp. Released 2011. IBM SPSS Statistics for Windows, Version 20.0. Armonk, NY: IBM Corp.
11
on the data given the sample size and the difference with and without the outlier. Thus,
all outliers were included in the sample data. To determine the presence of statistically
significant differences between males and females, independent sample t-tests (p<.05)
were performed.
A Repeated Measures ANOVA was used to compare the mean values in the treatment
and control groups, and to compare the mean values between males and females within
these groups. In the case in which the data were found not to be normally distributed,
then a non-parametric test for repeated measures, the Friedman test, was performed. A
post hoc Bonferroni correction (n=3) was applied to determine differences between the
time points as growth proceeded (p<.017). Pearson product-moment correlation
coefficients were calculated to relate the changes in the ANB angle to the linear
anteroposterior Wits appraisal measurements to the maxillomandibular bisector (MMB)
and the Frankfort mandibular plane angle bisector (FMAB) between each of the time
periods in the control and treatment groups.
In all evaluations, a 20% difference was considered clinically significant.
12
Figure 2: Cephalometric Measurements Performed
13
Results
The standard error for the cephalometric measures in the preliminary investigation is
shown in Table 1. It was deemed that the error of measurement for the ANB angle, the
MMB Wits, and the new cephalometric measurement, the FMAB Wits, were acceptable.
Table 1: Standard Error in the Preliminary Sample (n=15) Measure Standard Error (SE)
ANB angle 0.31°
MMB Wits 0.81 mm
FMAB Wits 0.77 mm
The standard error and the reproducibility of the measurements (R) for the cephalometric
measures for the sample investigated in this study is shown in Table 2. All of the errors
fell within acceptable limits and R>0.91 for all measurements, indicating a good
reproducibility.
Table 2: Standard Error and Reproducibility in the Study Sample (n=60) Measure Standard Error (SE) Reproducibility (R)
ANB Angle 0.39° 0.91
MM Angle 1.14° 0.95
FMA Angle 1.09° 0.93
MMB Wits 0.58 mm 0.91
FMAB Wits 0.46 mm 0.96
A significant difference in the ages of the subjects at all time periods was found between
the control and treatment groups, as shown in Table 3. Similarly, when considering males
and females separately, a significant difference between their ages in both the control and
treatment groups, at all time periods was present. These differences are attributed to the
large standard deviation of the ages in the treatment group, which is expected as the ages
at which radiographs were taken were dependent on orthodontic diagnosis and time of
completion of orthodontic treatment, which can be highly variable in an orthodontic
residency program. On the other hand, timing of the radiographs performed on the
control group subjects were determined solely by their ages.
14
Table 3: Ages at T0, T1, T2 for the Control and Treatment Groups and the t-values
for their Difference in Each Time Period Age at T0 (months) Age at T1 (months) Age at T2 (months)
Mean t Mean t Mean t
Control 144±2.21 4.99*
169±1.65 9.18*
192±1.03 10.27*
Treatment 150±13.0 180±13.16 205±13.66 * p< .05
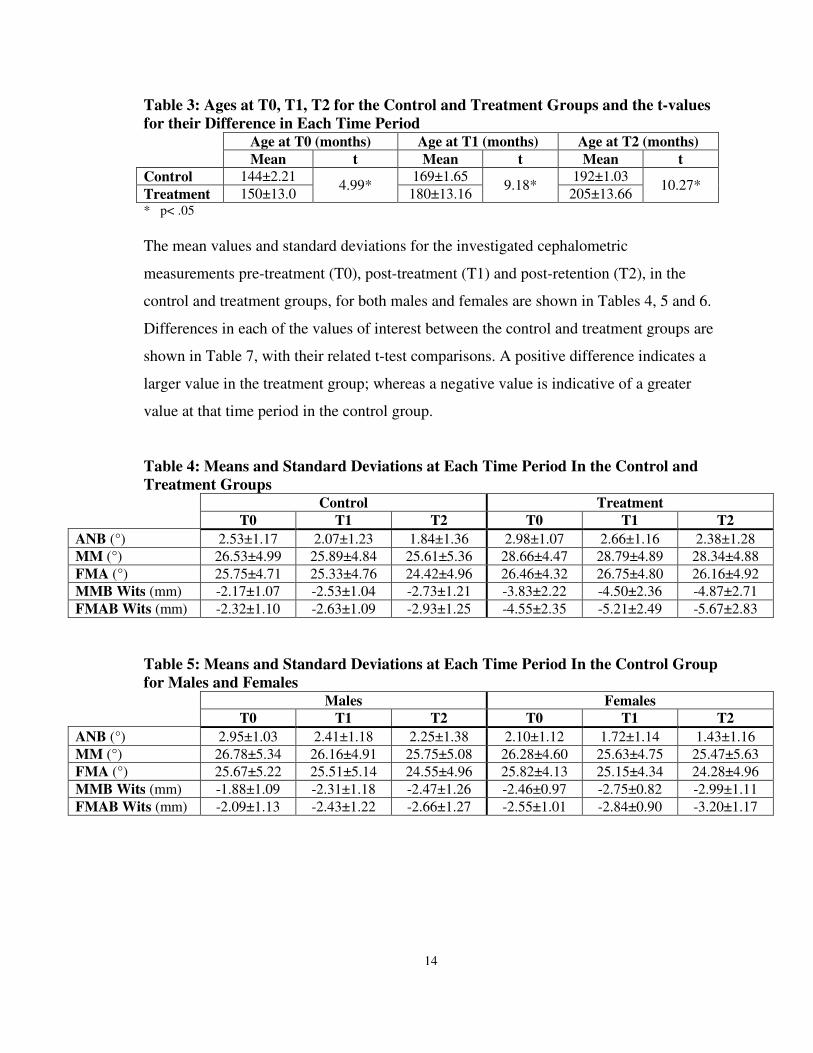
The mean values and standard deviations for the investigated cephalometric
measurements pre-treatment (T0), post-treatment (T1) and post-retention (T2), in the
control and treatment groups, for both males and females are shown in Tables 4, 5 and 6.
Differences in each of the values of interest between the control and treatment groups are
shown in Table 7, with their related t-test comparisons. A positive difference indicates a
larger value in the treatment group; whereas a negative value is indicative of a greater
value at that time period in the control group.
Table 4: Means and Standard Deviations at Each Time Period In the Control and
Treatment Groups Control Treatment
T0 T1 T2 T0 T1 T2
ANB (°) 2.53±1.17 2.07±1.23 1.84±1.36 2.98±1.07 2.66±1.16 2.38±1.28
MM (°) 26.53±4.99 25.89±4.84 25.61±5.36 28.66±4.47 28.79±4.89 28.34±4.88
FMA (°) 25.75±4.71 25.33±4.76 24.42±4.96 26.46±4.32 26.75±4.80 26.16±4.92
MMB Wits (mm) -2.17±1.07 -2.53±1.04 -2.73±1.21 -3.83±2.22 -4.50±2.36 -4.87±2.71
FMAB Wits (mm) -2.32±1.10 -2.63±1.09 -2.93±1.25 -4.55±2.35 -5.21±2.49 -5.67±2.83
Table 5: Means and Standard Deviations at Each Time Period In the Control Group
for Males and Females Males Females
T0 T1 T2 T0 T1 T2
ANB (°) 2.95±1.03 2.41±1.18 2.25±1.38 2.10±1.12 1.72±1.14 1.43±1.16
MM (°) 26.78±5.34 26.16±4.91 25.75±5.08 26.28±4.60 25.63±4.75 25.47±5.63
FMA (°) 25.67±5.22 25.51±5.14 24.55±4.96 25.82±4.13 25.15±4.34 24.28±4.96
MMB Wits (mm) -1.88±1.09 -2.31±1.18 -2.47±1.26 -2.46±0.97 -2.75±0.82 -2.99±1.11
FMAB Wits (mm) -2.09±1.13 -2.43±1.22 -2.66±1.27 -2.55±1.01 -2.84±0.90 -3.20±1.17

15
Table 6: Means and Standard Deviations at Each Time Period Treatment Group for
Males and Females Males Females
T0 T1 T2 T0 T1 T2
ANB (°) 2.94±1.10 2.59±1.19 2.17±1.34 3.02±1.02 2.74±1.10 2.60±1.16
MM (°) 28.75±4.40 28.55±5.30 27.96±5.35 28.57±4.54 29.03±4.42 28.74±4.32
FMA (°) 25.59±3.56 25.65±4.32 24.71±4.47 27.35±4.82 27.87±5.00 27.63±4.93
MMB Wits (mm) -3.83±2.36 -4.56±2.62 -5.12±2.96 -3.84±2.06 -4.44±2.05 -4.61±2.40
FMAB Wits (mm) -4.87±2.57 -5.51±2.79 -6.31±3.11 -4.24±2.04 -4.89±2.09 -5.02±2.33
Table 7: Differences Between Control and Treatment Groups and Their t-Values in
Each Time Period (Subtraction of Means: Treatment – Control)
Treatment-
Control:
T0 T1 T2
Difference t Difference t Difference t
ANB Angle (°) 0.45±0.10 2.23* 0.60±0.06 2.74* 0.54±0.06 2.24*
MM Angle (°) 2.13±0.52 2.47* 2.89±0.05 3.17* 2.73±0.48 2.92*
FMA (°) 0.71±0.38 0.86 1.42±0.04 1.59 1.74±0.04 1.89
MMB Wits (mm) -1.66±1.15 -6.19* -1.98±1.32 -7.18* -2.13±1.47 -6.73*
FMAB Wits
(mm) -2.23±1.25 -7.96* -2.57±1.39 -8.88* -2.74±1.57 -8.31*
The results in Table 7 show that significant differences were found for all measurements,
between the control and treatment groups, except for the Frankfort mandibular plane
angle (FMA) for all time periods. The ANB angle was significantly larger in the
treatment group subjects, ranging from 0.45°±0.10° at T0 (p<.05), to 0.60°±0.06° at T1
(p<.01), to a difference of 0.54°±0.06° (p<.05) at T2. Similarly, the maxillomandibular
(MM) angle was significantly greater in subjects of the treatment group for all time
periods, demonstrating the largest discrepancy post-treatment (T1), with a value of
2.89mm±0.5mm (p<.05). In addition, both the Wits appraisal measurements to MMB and
FMAB demonstrated a significant difference at T0, T1 and T2, at significance level of
p<0.001. While a statistical significant difference was detected for most of the values,
they are not deemed clinically significant.
Prior to assessing the differences between each time period with a repeated measures
ANOVA test, the data were assessed for the presence of outliers via boxplots. While the
presence of outliers in the majority of the data was minimal (between none and two
outliers), the palatal plane inclination (PP-FH) for the female treatment group was
* p< .05
16
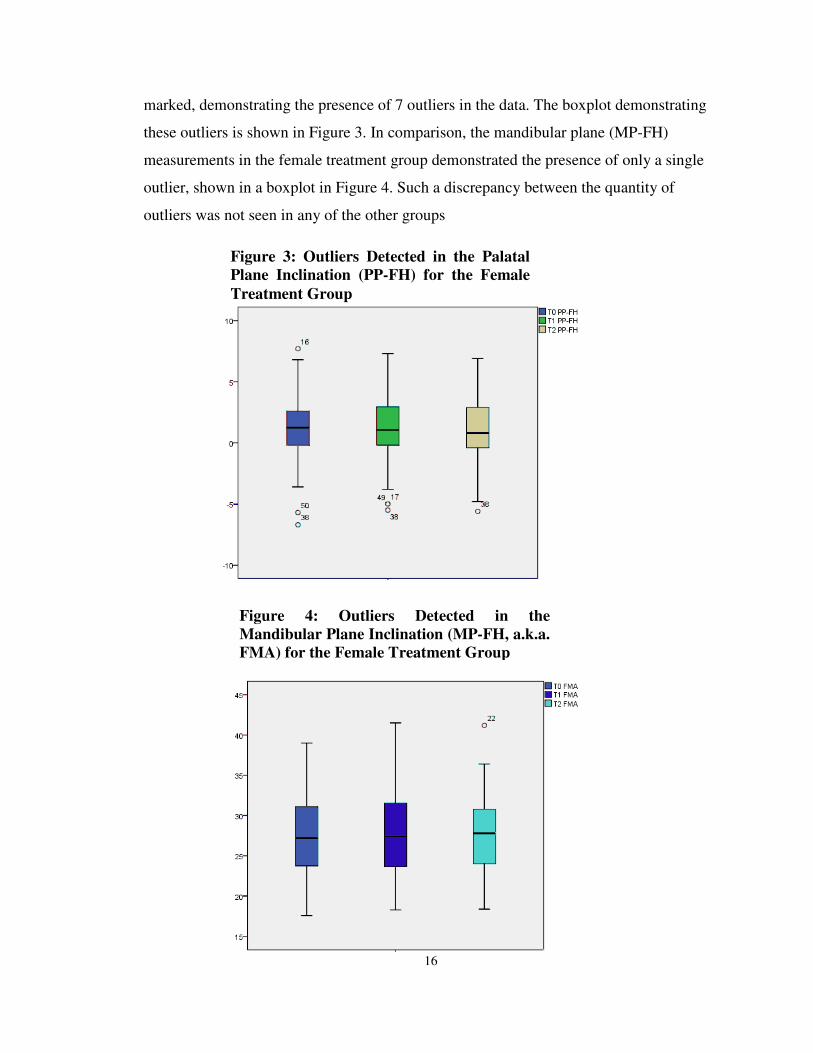
Figure 3: Outliers Detected in the Palatal
Plane Inclination (PP-FH) for the Female
Treatment Group
Figure 4: Outliers Detected in the
Mandibular Plane Inclination (MP-FH, a.k.a.
FMA) for the Female Treatment Group
marked, demonstrating the presence of 7 outliers in the data. The boxplot demonstrating
these outliers is shown in Figure 3. In comparison, the mandibular plane (MP-FH)
measurements in the female treatment group demonstrated the presence of only a single
outlier, shown in a boxplot in Figure 4. Such a discrepancy between the quantity of
outliers was not seen in any of the other groups
17
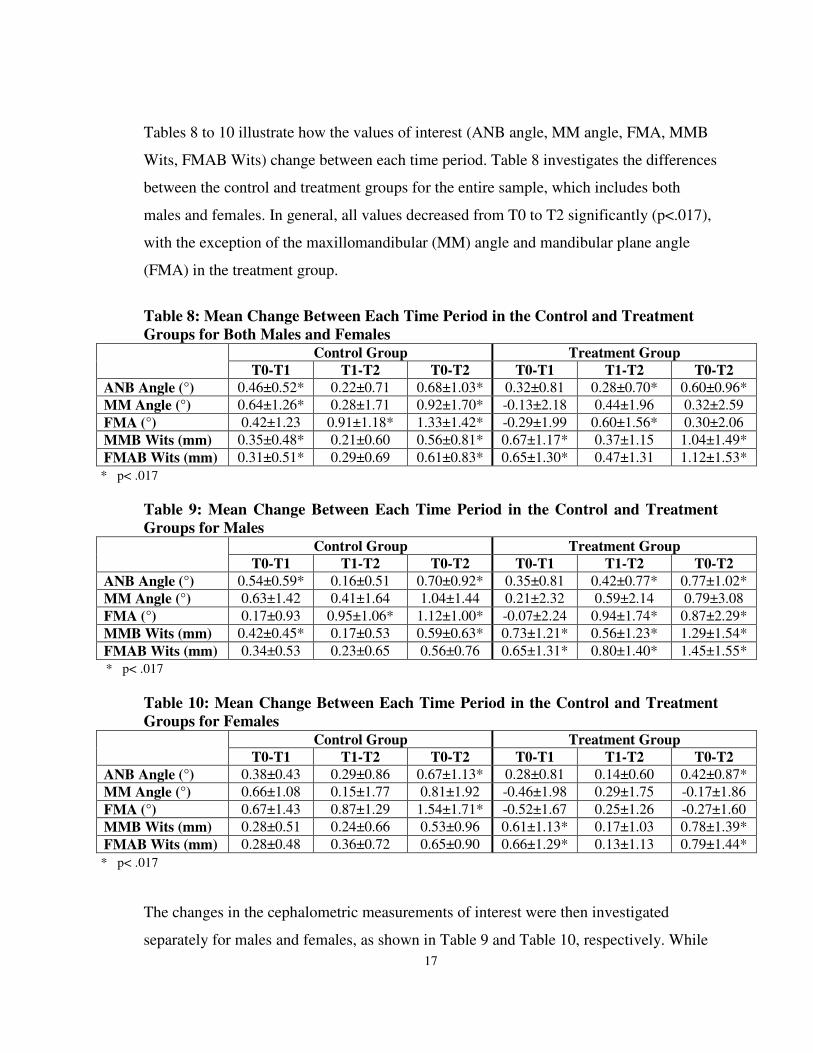
Tables 8 to 10 illustrate how the values of interest (ANB angle, MM angle, FMA, MMB
Wits, FMAB Wits) change between each time period. Table 8 investigates the differences
between the control and treatment groups for the entire sample, which includes both
males and females. In general, all values decreased from T0 to T2 significantly (p<.017),
with the exception of the maxillomandibular (MM) angle and mandibular plane angle
(FMA) in the treatment group.
Table 8: Mean Change Between Each Time Period in the Control and Treatment
Groups for Both Males and Females Control Group Treatment Group
T0-T1 T1-T2 T0-T2 T0-T1 T1-T2 T0-T2
ANB Angle (°) 0.46±0.52* 0.22±0.71 0.68±1.03* 0.32±0.81 0.28±0.70* 0.60±0.96*
MM Angle (°) 0.64±1.26* 0.28±1.71 0.92±1.70* -0.13±2.18 0.44±1.96 0.32±2.59
FMA (°) 0.42±1.23 0.91±1.18* 1.33±1.42* -0.29±1.99 0.60±1.56* 0.30±2.06
MMB Wits (mm) 0.35±0.48* 0.21±0.60 0.56±0.81* 0.67±1.17* 0.37±1.15 1.04±1.49*
FMAB Wits (mm) 0.31±0.51* 0.29±0.69 0.61±0.83* 0.65±1.30* 0.47±1.31 1.12±1.53*
Table 9: Mean Change Between Each Time Period in the Control and Treatment
Groups for Males Control Group Treatment Group
T0-T1 T1-T2 T0-T2 T0-T1 T1-T2 T0-T2
ANB Angle (°) 0.54±0.59* 0.16±0.51 0.70±0.92* 0.35±0.81 0.42±0.77* 0.77±1.02*
MM Angle (°) 0.63±1.42 0.41±1.64 1.04±1.44 0.21±2.32 0.59±2.14 0.79±3.08
FMA (°) 0.17±0.93 0.95±1.06* 1.12±1.00* -0.07±2.24 0.94±1.74* 0.87±2.29*
MMB Wits (mm) 0.42±0.45* 0.17±0.53 0.59±0.63* 0.73±1.21* 0.56±1.23* 1.29±1.54*
FMAB Wits (mm) 0.34±0.53 0.23±0.65 0.56±0.76 0.65±1.31* 0.80±1.40* 1.45±1.55*
Table 10: Mean Change Between Each Time Period in the Control and Treatment
Groups for Females Control Group Treatment Group
T0-T1 T1-T2 T0-T2 T0-T1 T1-T2 T0-T2
ANB Angle (°) 0.38±0.43 0.29±0.86 0.67±1.13* 0.28±0.81 0.14±0.60 0.42±0.87*
MM Angle (°) 0.66±1.08 0.15±1.77 0.81±1.92 -0.46±1.98 0.29±1.75 -0.17±1.86
FMA (°) 0.67±1.43 0.87±1.29 1.54±1.71* -0.52±1.67 0.25±1.26 -0.27±1.60
MMB Wits (mm) 0.28±0.51 0.24±0.66 0.53±0.96 0.61±1.13* 0.17±1.03 0.78±1.39*
FMAB Wits (mm) 0.28±0.48 0.36±0.72 0.65±0.90 0.66±1.29* 0.13±1.13 0.79±1.44*
The changes in the cephalometric measurements of interest were then investigated
separately for males and females, as shown in Table 9 and Table 10, respectively. While
* p< .017
* p< .017
* p< .017
18
no significant trend was noted in the male control group subjects (likely due to lack of
power and small sample size), it was found that, with the exception of the MM angle, a
significant overall change occurred from pre-treatment to post-retention for males in the
treatment group. In these males, the change was significantly greater between T1 and T2
time periods, coinciding with an age range of 15.2 years to 17.3 years. The female
subjects in the control group also did not show a definable trend, while the females in the
treatment group demonstrated an overall significant increase (with the exception of the
MM angle and FMA) from T0 to T2. In contrast to the male subjects, any significant
change that occurred was seen in the T0 to T1 time interval, corresponding to an age
range of 12.4 years to 14.75 years. The Maxillomandibular and the Frankfort mandibular
plane angles in the female treatment group were the only values that were shown to
decrease from T0 to T2.
The presence of differences in the amount of change of the cephalometric parameters for
males compared to females was investigated. Statistically significant changes (p<.05)
were present in the treatment group only. For all of the significant changes present, the
male subjects demonstrated a greater change than the females. Specifically, a statistically
larger decrease in the ANB angle, the MM angle, the FMA, and FMAB Wits was seen
from pre-treatment to post-retention. In addition, a statistically significant decrease in
only ANB, FMA and FMAB Wits was seen in the time period from post-treatment to
post-retention in males.
The correlations of the two (MMB and FMAB) Wits appraisals to the three skeletal
measurements (ANB, MM and FMA) were generally low. The correlation values are
depicted in Table 11. Overall, the strongest correlations were found between MMB Wits
and FMAB Wits for all time periods (r>0.86).

19
Table 11: Pearson Correlation Coefficients Within the Time Periods for the Control
and Treatment Groups Control Group Treatment Group
T0 T1 T2 T0 T1 T2
ANB-MMB Wits 0.60 0.52 0.32 0.39 0.30 0.19
ANB-FMAB Wits 0.57 0.46 0.26 0.42 0.30 0.25
MMB Wits-FMAB Wits 0.93 0.91 0.96 0.86 0.86 0.91
FMA-ANB 0.10 0.13 0.16 0.17 0.10 0.21
FMA-MMB Wits -0.45 -0.38 -0.42 -0.34 -0.32 -0.38
FMA-FMAB Wits -0.41 -0.38 -0.43 -0.17 -0.20 -0.22
MM-ANB 0.10 0.09 0.16 0.11 0.43 0.15
MM-MMB Wits -0.40 -0.37 -0.35 -0.19 -0.23 -0.28
MM-FMAB Wits -0.52 -0.52 -0.45 -0.36 -0.38 -0.40
20
Discussion
Among the criteria that the orthodontist requires for diagnosis and treatment planning, the
sagittal relationship between maxilla and mandible is critical to specifically address
whether a skeletal malocclusion exists, and if so, to what degree. Many parameters to
evaluate the intermaxillary relationship have been described in the literature, but the
ANB angle suggested by Reidel5 is the most popular and, therefore, the most used.
32
As a complement to the ANB angle, the Wits appraisal was introduced by Jacobson in
1975.9 Jacobson explained that a high ANB angle in a person with an excellent occlusion
could be caused by forward position of the maxilla in relation to nasion and/or by
clockwise rotation of the maxilla with regard to the anterior cranial base. In these cases,
he reports differences in the ANB angle and Wits appraisal may result. Furthermore,
Jacobson asserts that the ANB angle is only reliable if the mandibular plane angle is
normal. An increased mandibular plane angle would indicate a divergent pattern, and in
many of these cases, an anterior cranial base with a higher inclination reduces the SNA
angle and provides less reliable information. Zamora et al.33
investigated the relationship
between the ANB angle and Wits appraisal (to the bisected occlusal plane) utilizing
CBCT imaging. They found that in the 45 patients in whom the ANB angle and BOP
Wits appraisal did not coincide, 49% of these individuals had a mandibular plane angle
that was considered to be within the range of normal (i.e. a mesofacial pattern). This
same study did not find a correlation between the mandibular plane angle and the ANB
angle (r=.04), similar to findings from Hussels7 and Nanda,
34 nor did they find a
significant correlation between the Wits appraisal and the mandibular plane angle
(r=0.24). Similarly, in this study, the correlation found between the ANB angle and the
Frankfort mandibular plane angle (FMA) was very small (r=0.10 to 0.21), while the
MMB Wits appraisal correlation to FMA was somewhat larger (r=-0.45 to -0.32).
In this study, the correlation between the FMAB Wits appraisal and FMA had a large
range over the investigated time periods, but was generally better than the correlation to
the ANB angle, and ranged from r=-0.43 to -0.17. The highest correlations with the ANB

21
angle were between the ANB angle and MMB Wits appraisal at time T0 in the control
group (r=0.60), but this correlation gradually decreased to r=0.32 at time T2. This differs
from the findings of Palleck et al.16
, in which the correlation between the ANB angle and
MMB Wits appraisal was more consistent in the Class I sample, ranging from r=0.54 to
r=0.69 in the control group. However, in this investigation, the overall strongest
correlations were found between MMB Wits and FMAB Wits appraisals ranging from
r=0.91 to r=0.96 in the control group, and from r=0.86 to r=0.91 in the treatment group.
Horowitz and Hixon35
stated that a correlation coefficient better than 0.8 may be used in
clinical predictions, such that these pairs may be considered highly interchangeable in the
assessment of anteroposterior jaw relationships. While the correlations between the ANB
angle and the Wits appraisal measurements tended to gradually decrease, those between
the MMB Wits and FMAB Wits appraisals were generally strong for all time points.
Aside from the correlations between FMAB Wits and MMB Wits, the results show low
correlation coefficients of less than r=0.8, indicating a lack of interchangeability in their
use in clinical assessment. In theory, as the ANB angle and Wits appraisal evaluate the
same skeletal discrepancy, they must have a high correlation. A weak correlation between
the ANB angle and Wits appraisal has been shown in several studies,1,6,18,21,36,37
suggesting that differing assessments of jaw discrepancies frequently occur with these
pairs, likely attributed to a weakness in at least one of the measures. Because of the high
correlation between the Wits appraisal measurements, which are independent of nasion, it
is postulated that the poor correlations seen with the ANB angle may at least be attributed
to the location of nasion, which tends to change throughout growth adopting a more
forward and upward position.38
To assess the validity of the Wits appraisal measurements in diagnosing anteroposterior
jaw relationships and their ability to reflect growth and treatment changes, the ANB angle
was used as a standard to which to compare these values. Despite its shortcomings, the
ANB angle acts as a useful reference point, and has been shown not to be any less
reliable than any other cephalometric measurements as a sagittal anteroposterior
parameter.4

22
The changes in the cephalometric measures with growth, with or without treatment, were
investigated and shown in Table 8. In the control group, the ANB angle demonstrated a
statistical significant (p<.017) decrease from pre-treatment (at approximately age 12
years) to post-retention (at approximately 16 years), by 0.68°±1.03°. In a longitudinal
study by Lux et al.,30
the change in ANB in Class I subjects between the ages of 11 years
and 15 years was found to be 0.75°±3.05° in males, and 0.51°±3.99° in females.
Similarly, Bishara et al1 found that the ANB angle decreased by 0.60°±0.57° from ages
12 years to 16 years. The MMB Wits appraisal value showed a statistically significant
decrease (p<.05) in each time interval, with an overall decrease from T0 to T2 of
0.56mm±0.81mm. The FMAB Wits value demonstrated a decrease of similar magnitude
to the MMB Wits from pre-treatment to post-retention of 0.61mm±0.83mm. Generally,
all of the values in the control group decreased between the time periods.
In the treatment group, the ANB angle demonstrated a similar decrease to the control
group, by an amount of 0.60°±0.96° from pre-treatment to post-retention. Similarly, the
ANB angle in the Class I treatment group decreased by 0.63°±1.88° in the study by
Palleck et al.16
In this study, the MMB Wits value showed a statistically significant
decrease (p<.001) in each time interval, with a decrease of 1.04mm±1.49mm from T0 to
T2. This decrease was slightly smaller than that found in the Class I sample from Palleck
et al.16
of 1.21mm±2.91mm. The FMAB Wits value demonstrated a decrease of similar
magnitude to the MMB Wits from pre-treatment to post-retention of 1.12mm±1.53mm.
Only the maxillomandibular angle and mandibular plane angle in the time period during
orthodontic treatment (T0 to T1) showed an increase between time intervals, being
0.13°±2.18° and 0.29°±1.99°, respectively. These mild increases were attributed to the
extrusive effect of orthodontics, causing the mandible to tip down and back. With growth,
the maxillomandibular and mandibular plane angles returned to normal values as the
growth of the ramus compensated for these changes.12
Ultimately, while many of the values decreased with statistical significance between the
time periods, these changes do not carry clinical significance due to their small
magnitudes.
23
The data was then assessed by separating the cephalometric measurements based on
gender, as seen in Tables 9 and 10. The cephalometric measures tended to decrease with
time, with a couple of exceptions. Only for the females in the treatment group did the
maxillomandibular angle and mandibular plane angle show an overall increase from pre-
treatment to post-retention, with values of 0.17°±1.86° and 0.27°±1.60°, respectively.
This suggests that despite ramal growth occurring post-orthodontics, the mandibular
plane never fully recovered from the down and back rotation from orthodontic extrusion
in the female subjects. Interestingly, this overall increase is not seen in the male sample,
demonstrating a 0.79°±3.08° overall decrease in the maxillomandibular plane angle and
0.87°±2.29° decrease in the mandibular plane angle, which may be attributed to ramal
growth occurring later and lasting longer in males12
as compared to females, who peak,
and thus complete, growth earlier. However, given the broad standard deviations of the
changes, it is not possible to make conclusive statements in regards to treatment effects.
Changes secondary to growth were reflected not only in the ANB angle, but also in the
MMB Wits and FMAB Wits appraisal measurements. The change from T0 to T2 in the
ANB angle in the treated male group was 0.77°±1.02°, and in the treated female group
was 0.42°±0.87°. Similarly, the change of the MMB Wits over the same time interval in
the treated males was 1.29mm±1.54mm and in treated females was 0.78mm±1.39mm.
Finally, the change from pre-treatment to post-retention of the FMAB Wits demonstrated
a similar trend, with a value of 1.45mm±1.55mm in the treatment male group, and
0.79mm±1.44mm in the treatment female group. Therefore, both Wits appraisal
measurements reflect similar growth and treatment changes with the ANB angle.
Gender differences in the amount of change of the cephalometric parameters occurred
between the time periods. Only a statistical significant change (p<.05) was seen in the
treatment group, and in all cases in which a statistical change was evident, it was due to a
larger change in the male group. Specifically, a statistically larger decrease in the ANB
angle, the MM angle, the FMA, and FMAB Wits was seen from pre-treatment to post-
retention in the males. In addition, a statistically significant decrease in only the ANB
angle, FMA and FMAB Wits was seen in the time period from post-treatment to post-
retention in males. These larger changes were consistent with a later growth spurt in

24
males, and reflect a normal pattern of growth. Whether the magnitude of change is also
attributed to treatment effects is unclear, due to a smaller sample size of the control
group, limiting the ability to detect statistical significance.
Another method of determining how well an anteroposterior parameter will be able to
diagnose a sagittal skeletal discrepancy is how reliable it is. In this study, repeat tracings
of 60 radiographs designed to test the reliability of the MMB and FMAB Wits
measurements, showed that while the error in the FMAB Wits was smaller, the difference
between them is not clinically significant. Similarly, the error between the landmarks that
comprise these Wits appraisal measurements, the MM and FMA angles, were shown to
have errors of 1.14° and 1.09°, respectively, also presenting an insignificant clinical
difference. The reproducibility of the measurements was also demonstrated via the
calculated reproducibility of measurement, which demonstrated values of R>0.91 for all
measurements.
Ultimately, the difference between the Wits appraisal measurements may be better
appreciated when considering identification of the landmarks themselves. While on
average the error of measurement of the maxillomandibular angle and Frankfort
mandibular plane angle is low, when considering the individual angular measurements of
the mandibular plane and palatal plane with respect to Frankfort Horizontal, differences
associated to the spread of the data is evident. Within the treated female group, there
were 7 outliers when identifying the palatal plane in the 60 female subjects, equivalent to
approximately 10% of the sample being an outlier. However, the measurements of the
mandibular plane in the treated female group identified only a single outlier.
Interestingly, such a discrepancy with respect to the quantity of outliers was not seen in
any other groups. While these results are not entirely conclusive, it does suggest that on a
case-by-case basis, as is encountered on a daily basis with orthodontic treatment
planning, utilizing the mandibular plane, rather than the palatal plane, may be a more
reliable reference plane.
The presence of a broad spread of the data should be noted in Tables 4, 5 and 6,
especially of the ANB angle, MMB Wits and FMAB Wits measurements. The standard
25
deviations of these values are nearly half of the average value, suggesting the reliability
of the measured values is questionable. Sources of potential error in the measurement of
these values may be: difficulty in identifying landmarks in cephalometric radiographs of
poor quality, large anatomical variations in the inclinations of the planes investigated, and
the individual anatomical variation.
Future studies may consider investigating how the FMAB Wits appraisal measurement
changes in Class II and Class III samples. Alternatively, the results of this study may be
compared to Wits appraisal measurements performed to a bisector of the mandibular
plane angle using a constructed Frankfort Horizontal plane.
26
Conclusion
The conclusions that can be drawn from this study are as follows:
1. The Wits appraisal using the FMA bisector is a valid indicator of the anteroposterior
skeletal discrepancy, as its changes with growth and treatment reflect those changes
seen in the gold standard ANB angle.
2. A good correlation (r>0.86) was found between the MMB and FMAB Wits appraisal
in both the control and treatment groups for all time periods, indicating that the use of
either of these measures may be interchangeable.
3. Individual measures of the palatal plane (PP-FH) with respect to the mandibular plane
(MP-FH) demonstrated a larger number of outliers, indicating that assessment of the
anteroposterior skeletal discrepancy may be more reliable when using the mandibular
plane instead of the palatal plane as a reference plane. For extreme or controversial
cephalometric interpretations, visual inspection provides an essential aid in diagnosis
and skeletal classification.
27
References
1. Bishara SE, Fahl JA, Peterson LC. Longitudinal changes in the ANB angle and wits
appraisal: Clinical implications. Am J Orthod. 1983;84(2):133-139.
2. Baik CY, Ververidou M. A new approach of assessing sagittal discrepancies: The beta
angle. Am J Orthod Dentofacial Orthop. 2004;126(1):100-105.
3. Del Santo M,Jr. Influence of occlusal plane inclination on ANB and wits assessments
of anteroposterior jaw relationships. Am J Orthod Dentofacial Orthop. 2006;129(5):641-
648.
4. Oktay H. A comparison of ANB, WITS, AF-BF, and APDI measurements. Am J
Orthod Dentofacial Orthop. 1991;99(2):122-128.
5. Riedel RA. The relation of maxillary structures to cranium in malocclusion and in
normal occlusion. Angle Orthod. 1952;22(3):142-145.
6. Jarvinen S. Relation of the wits appraisal to the ANB angle: A statistical appraisal. Am
J Orthod Dentofacial Orthop. 1988;94(5):432-435.
7. Hussels W, Nanda RS. Analysis of factors affecting angle ANB. Am J Orthod.
1984;85(5):411-423.
8. Jacobson A. Update on the wits appraisal. Angle Orthod. 1988;58(3):205-219.
9. Jacobson A. The "wits" appraisal of jaw disharmony. Am J Orthod. 1975;67(2):125-
138.

28
10. Hurmerinta K, Rahkamo A, Haavikko K. Comparison between cephalometric
classification methods for sagittal jaw relationships. Eur J Oral Sci. 1997;105(3):221-
227.
11. Taylor CM. Changes in the relationship of nasion, point A, and point B and the effect
upon ANB. Am J Orthod. 1969;56(2):143-163.
12. Proffit WR. Contemporary orthodontics. 5th ed. St. Louis, Mo.: Elsevier/Mosby;
2013:754.
13. Rushton R, Cohen AM, Linney AD. The relationship and reproducibility of angle
ANB and the wits appraisal. Br J Orthod. 1991;18(3):225-231.
14. Haynes S, Chau MN. The reproducibility and repeatability of the wits analysis. Am J
Orthod Dentofacial Orthop. 1995;107(6):640-647.
15. Sherman SL, Woods M, Nanda RS, Currier GF. The longitudinal effects of growth on
the wits appraisal. Am J Orthod Dentofacial Orthop. 1988;93(5):429-436.
16. Palleck S, Foley TF, Hall-Scott J. The reliability of 3 sagittal reference planes in the
assessment of class I and class III treatment. Am J Orthod Dentofacial Orthop.
2001;119(4):426-435.
17. Foley TF, Stirling DL, Hall-Scott J. The reliability of three sagittal reference planes in
the assessment of class II treatment. Am J Orthod Dentofacial Orthop. 1997;112(3):320-
9.

29
18. Chang HP. Assessment of anteroposterior jaw relationship. Am J Orthod Dentofacial
Orthop. 1987;92(2):117-122.
19. DOWNS WB. Variations in facial relationships; their significance in treatment and
prognosis. Am J Orthod. 1948;34(10):812-840.
20. Tanaka JL, Ono E, Filho Medici E, Cesar de Moraes L, Cezar de Melo Castilho J,
Leonelli de Moraes ME. Influence of the facial pattern on ANB, AF-BF, and wits
appraisal. World J Orthod. 2006;7(4):369-375.
21. Thayer TA. Effects of functional versus bisected occlusal planes on the wits
appraisal. Am J Orthod Dentofacial Orthop. 1990;97(5):422-426.
22. Yang SD, Suhr CH. F-H to AB plane angle (FABA) for assessment of anteroposterior
jaw relationships. Angle Orthod. 1995;65(3):223-32.
23. Hall-Scott J. The maxillary-mandibular planes angle (MM degrees) bisector: A new
reference plane for anteroposterior measurement of the dental bases. Am J Orthod
Dentofacial Orthop. 1994;105(6):583-591.
24. Nanda RS, Merrill RM. Cephalometric assessment of sagittal relationship between
maxilla and mandible. Am J Orthod Dentofacial Orthop. 1994;105(4):328-344.
25. Chang HP, Kinoshita Z, Kawamoto T. A study of the growth changes in facial
configuration. Eur J Orthod. 1993;15(6):493-501.
26. Nanda SK. Growth patterns in subjects with long and short faces. Am J Orthod
Dentofacial Orthop. 1990;98(3):247-258.

30
27. Kumar S, Valiathan A, Gautam P, Chakravarthy K, Jayaswal P. An evaluation of the
pi analysis in the assessment of anteroposterior jaw relationship. J Orthod.
2012;39(4):262-269.
28. Neela PK, Mascarenhas R, Husain A. A new sagittal dysplasia indicator: The YEN
angle. World J Orthod. 2009;10(2):147-151.
29. Bhad WA, Nayak S, Doshi UH. A new approach of assessing sagittal dysplasia: The
W angle. Eur J Orthod. 2013;35(1):66-70.
30. Lux CJ, Burden D, Conradt C, Komposch G. Age-related changes in sagittal
relationship between the maxilla and mandible. Eur J Orthod. 2005;27(6):568-578.
31. Faul F, Erdfelder E, Buchner A, Lang A. Statistical power analyses using G*Power
3.1: Tests for correlation and regression analyses. Behavior Research Methods.
2009;41:1149-1160.
32. Tanaka JL, Ono E, Filho Medici E, Cesar de Moraes L, Cezar de Melo Castilho J,
Leonelli de Moraes ME. Influence of the facial pattern on ANB, AF-BF, and wits
appraisal. World J Orthod. 2006;7(4):369-375.
33. Zamora N, Cibrian R, Gandia JL, Paredes V. Study between anb angle and wits
appraisal in cone beam computed tomography (CBCT). Med Oral Patol Oral Cir Bucal.
2013;18(4):e725-32.
34. Nanda RS. Growth changes in skeletal-facial profile and their significance in
orthodontic diagnosis. Am J Orthod. 1971;59(5):501-513.
31
35. Horowitz SL, Hixon EH. The nature of orthodontic diagnosis. St. Louis, Mo.: C.V.
Mosby Company; 1966:393.
36. Gul-e-Erum, Fida M. A comparison of cephalometric analyses for assessing sagittal
jaw relationship. J Coll Physicians Surg Pak. 2008;18(11):679-683.
37. Rotberg S, Fried N, Kane J, Shapiro E. Predicting the "wits" appraisal from the ANB
angle. Am J Orthod. 1980;77(6):636-642.
38. Zamora N, Cibrian R, Gandia JL, Paredes V. Study between anb angle and wits
appraisal in cone beam computed tomography (CBCT). Med Oral Patol Oral Cir Bucal.
2013;18(4):e725-32.
32
Appendices
Appendix I: FABA Angle, as proposed by Yang and Suhr (1995)22
Appendix II: AF-BF, as proposed by Chang (1987)18
33
Appendix III: Pi analysis, as proposed by Kumar (2012)27
34
Appendix IV: Yen Angle, as proposed by Neeta et al. (2009)28
Appendix V: W Angle, as proposed by Bhad et al. (2013)29
35
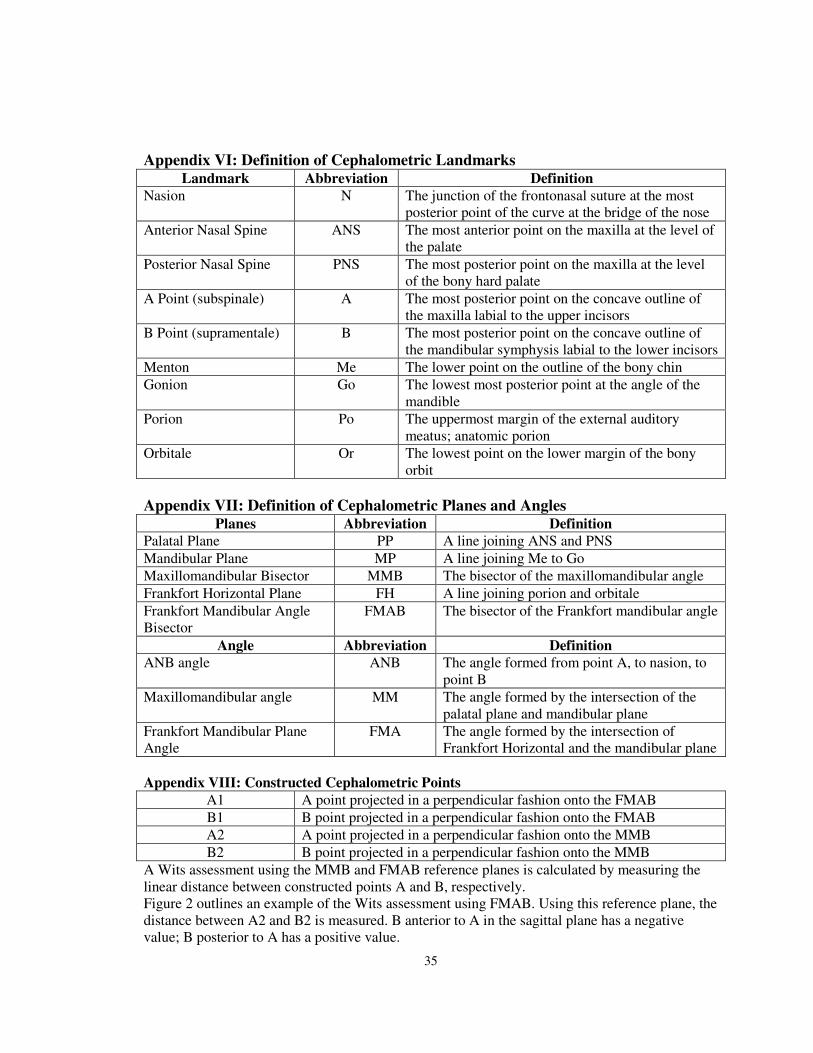
Appendix VI: Definition of Cephalometric Landmarks Landmark Abbreviation Definition
Nasion N The junction of the frontonasal suture at the most
posterior point of the curve at the bridge of the nose
Anterior Nasal Spine ANS The most anterior point on the maxilla at the level of
the palate
Posterior Nasal Spine PNS The most posterior point on the maxilla at the level
of the bony hard palate
A Point (subspinale) A The most posterior point on the concave outline of
the maxilla labial to the upper incisors
B Point (supramentale) B The most posterior point on the concave outline of
the mandibular symphysis labial to the lower incisors
Menton Me The lower point on the outline of the bony chin
Gonion Go The lowest most posterior point at the angle of the
mandible
Porion Po The uppermost margin of the external auditory
meatus; anatomic porion
Orbitale Or The lowest point on the lower margin of the bony
orbit
Appendix VII: Definition of Cephalometric Planes and Angles Planes Abbreviation Definition
Palatal Plane PP A line joining ANS and PNS
Mandibular Plane MP A line joining Me to Go
Maxillomandibular Bisector MMB The bisector of the maxillomandibular angle
Frankfort Horizontal Plane FH A line joining porion and orbitale
Frankfort Mandibular Angle
Bisector
FMAB The bisector of the Frankfort mandibular angle
Angle Abbreviation Definition
ANB angle ANB The angle formed from point A, to nasion, to
point B
Maxillomandibular angle MM The angle formed by the intersection of the
palatal plane and mandibular plane
Frankfort Mandibular Plane
Angle
FMA The angle formed by the intersection of
Frankfort Horizontal and the mandibular plane
Appendix VIII: Constructed Cephalometric Points
A1 A point projected in a perpendicular fashion onto the FMAB
B1 B point projected in a perpendicular fashion onto the FMAB
A2 A point projected in a perpendicular fashion onto the MMB
B2 B point projected in a perpendicular fashion onto the MMB
A Wits assessment using the MMB and FMAB reference planes is calculated by measuring the
linear distance between constructed points A and B, respectively.
Figure 2 outlines an example of the Wits assessment using FMAB. Using this reference plane, the
distance between A2 and B2 is measured. B anterior to A in the sagittal plane has a negative
value; B posterior to A has a positive value.
36
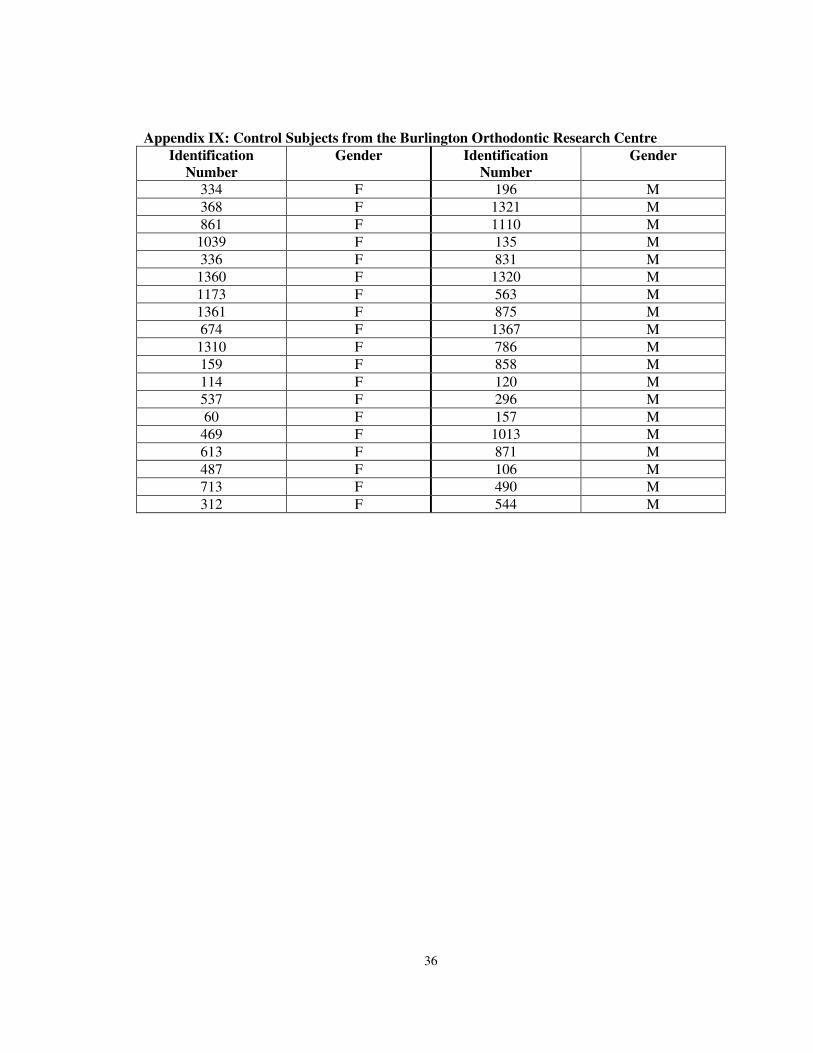
Appendix IX: Control Subjects from the Burlington Orthodontic Research Centre
Identification
Number
Gender Identification
Number
Gender
334 F 196 M
368 F 1321 M
861 F 1110 M
1039 F 135 M
336 F 831 M
1360 F 1320 M
1173 F 563 M
1361 F 875 M
674 F 1367 M
1310 F 786 M
159 F 858 M
114 F 120 M
537 F 296 M
60 F 157 M
469 F 1013 M
613 F 871 M
487 F 106 M
713 F 490 M
312 F 544 M
37
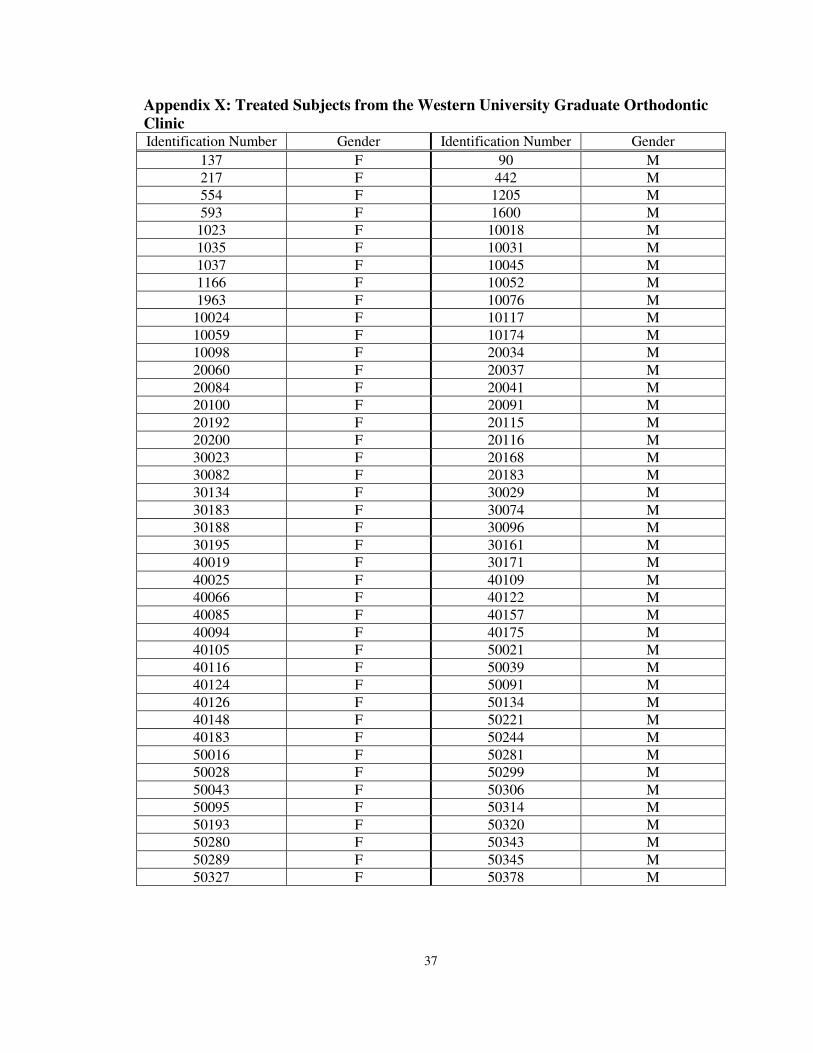
Appendix X: Treated Subjects from the Western University Graduate Orthodontic
Clinic Identification Number Gender Identification Number Gender
137 F 90 M
217 F 442 M
554 F 1205 M
593 F 1600 M
1023 F 10018 M
1035 F 10031 M
1037 F 10045 M
1166 F 10052 M
1963 F 10076 M
10024 F 10117 M
10059 F 10174 M
10098 F 20034 M
20060 F 20037 M
20084 F 20041 M
20100 F 20091 M
20192 F 20115 M
20200 F 20116 M
30023 F 20168 M
30082 F 20183 M
30134 F 30029 M
30183 F 30074 M
30188 F 30096 M
30195 F 30161 M
40019 F 30171 M
40025 F 40109 M
40066 F 40122 M
40085 F 40157 M
40094 F 40175 M
40105 F 50021 M
40116 F 50039 M
40124 F 50091 M
40126 F 50134 M
40148 F 50221 M
40183 F 50244 M
50016 F 50281 M
50028 F 50299 M
50043 F 50306 M
50095 F 50314 M
50193 F 50320 M
50280 F 50343 M
50289 F 50345 M
50327 F 50378 M
38
Appendix X (continued): Treated Subjects from the Western University Graduate
Orthodontic Clinic Identification Number Gender Identification Number Gender
70090 F 50381 M
70112 F 70066 M
70170 F 70141 M
80048 F 80045 M
80132 F 80056 M
920049 F 80084 M
920090 F 80087 M
920094 F 920008 M
920104 F 920209 M
920247 F 920256 M
920515 F 920317 M
920559 F 920460 M
920560 F 920486 M
930102 F 930029 M
960142 F 930086 M
970168 F 930116 M
980113 F 960126 M
990032 F 980080 M
980094 M
39
Curriculum Vitae
Name: Natalie Andrea Swoboda
Post-secondary McMaster University
Education and Hamilton, Ontario, Canada
Degrees: Bachelor of Science (Honours) 2000-2005
The University of Western Ontario
London, Ontario, Canada
Doctor of Dental Surgery 2005-2009
Related Work Sick Kids Hospital
Experience Toronto, Ontario, Canada
General Practice Residency 2009-2010
Publications:
Ezer M, Swoboda N, Farkouh D. Early Childhood Caries: The Dental Disease of Infants.
Oral Health. 2010, January; 3-7.
Swoboda NA, Armstrong DG, Smith J, Charkot E, Connolly BL. Pediatric patient surface
doses in neuroangiography. Pediatr Radiol. 2005 Sept;35(9):859-66.
Vitkin A, ML Gordon, VX Yang, N Swoboda, G Jones, JE Hayward. In-vivo subsurface
optical imaging of mycosis fungoides lesions prior to, during, and following radiation
therapy. Int J Radiat Oncol Biol Phys 2003;57(2 Suppl):S428.


![Frankfort Roundabout. (Frankfort, KY) 1905-08-05 [p ]](https://img.pdfslide.us/doc/110x75/619296ecf8ec4c566b77c48d/frankfort-roundabout-frankfort-ky-1905-08-05-p-.jpg)