Embed Size (px)
Citation preview

Western Kentucky UniversityTopSCHOLAR®
Masters Theses & Specialist Projects Graduate School
5-2011
An Evaluation of the Convergent Validity ofSituational Assessment of Leadership-StudentAssessment (SALSA© ) with Multi-SourceFeedback in MBA and Ed.D. in EducationalLeadership StudentsJustin TuckerWestern Kentucky University, [email protected]
Follow this and additional works at: http://digitalcommons.wku.edu/theses
Part of the Personality and Social Contexts Commons
This Thesis is brought to you for free and open access by TopSCHOLAR®. It has been accepted for inclusion in Masters Theses & Specialist Projects byan authorized administrator of TopSCHOLAR®. For more information, please contact [email protected].
Recommended CitationTucker, Justin, "An Evaluation of the Convergent Validity of Situational Assessment of Leadership-Student Assessment (SALSA© )with Multi-Source Feedback in MBA and Ed.D. in Educational Leadership Students" (2011). Masters Theses & Specialist Projects. Paper1058.http://digitalcommons.wku.edu/theses/1058


AN EVALUATION OF THE CONVERGENT VALIDITY OF
SITUATIONAL ASSESSMENT OF LEADERSHIP – STUDENT ASSESSMENT
(SALSA©) WITH MULTI-SOURCE FEEDBACK IN MBA AND ED.D. IN
EDUCATIONAL LEADERSHIP STUDENTS
A Thesis Presented to
The Faculty of the Department of Industrial/Organizational Psychology Western Kentucky University
Bowling Green, Kentucky
In Partial Fulfillment Of the Requirements for the Degree
Master of Arts
By Justin Tucker
May 2011
AN EVALUATION OF THE CONVERGENT VALIDITY OF
SITUATIONAL ASSESSMENT OF LEADERSHIP - STUDENT ASSESSMENT
(SALSACQ)WITH MULTI-SOURCE FEEDBACK IN MBA AND ED.D. IN
EDUCATIONAL LEADERSHIP STUDENTS
II, 1 7D//Date
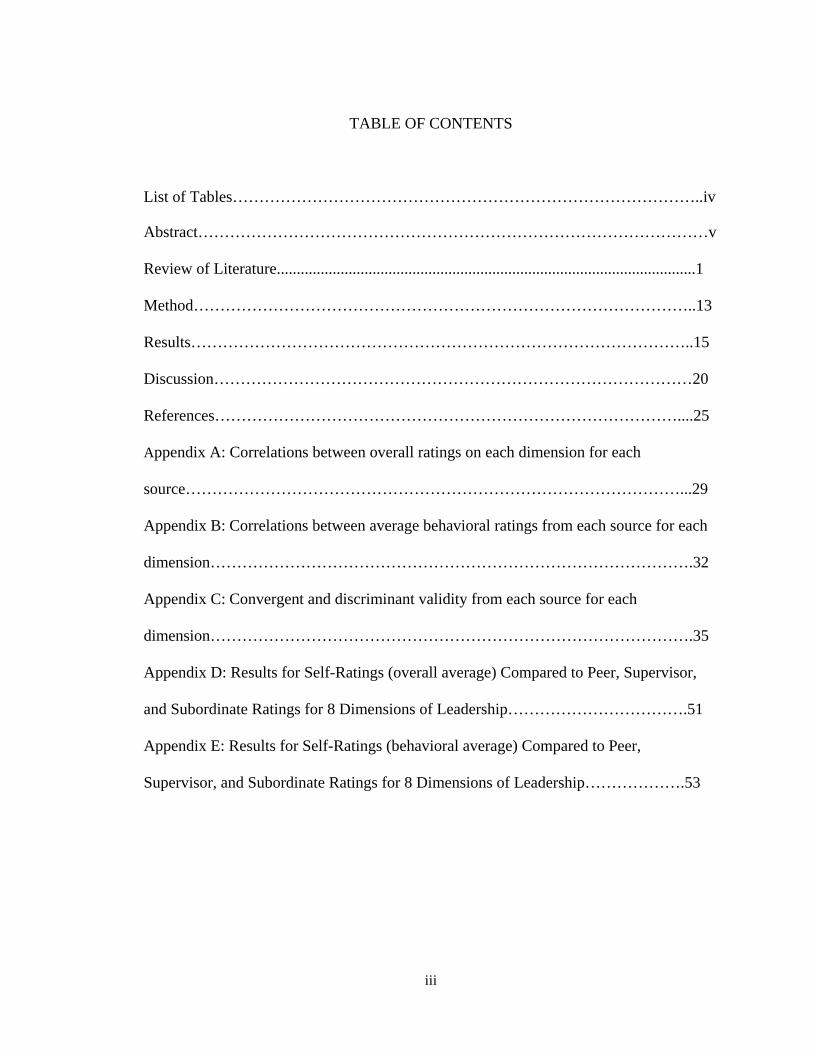
TABLE OF CONTENTS
List of Tables……………………………………………………………………………..iv Abstract……………………………………………………………………………………v Review of Literature.........................................................................................................1 Method…………………………………………………………………………………..13 Results…………………………………………………………………………………..15 Discussion………………………………………………………………………………20 References……………………………………………………………………………....25 Appendix A: Correlations between overall ratings on each dimension for each source…………………………………………………………………………………...29 Appendix B: Correlations between average behavioral ratings from each source for each
dimension……………………………………………………………………………….32
Appendix C: Convergent and discriminant validity from each source for each
dimension……………………………………………………………………………….35
Appendix D: Results for Self-Ratings (overall average) Compared to Peer, Supervisor,
and Subordinate Ratings for 8 Dimensions of Leadership…………………………….51
Appendix E: Results for Self-Ratings (behavioral average) Compared to Peer,
Supervisor, and Subordinate Ratings for 8 Dimensions of Leadership……………….53
iii

List of Tables
Table 1: Correlations between overall ratings by each source…………………….16 Table 2: Means and Standard Deviations for scores on SALSA© and ratings from each source……………………………………………………………………………….17
iv

v
AN EVALUATION OF THE CONVERGENT VALIDITY OF
SITUATIONAL ASSESSMENT OF LEADERSHIP – STUDENT ASSESSMENT
(SALSA©) WITH MULTI-SOURCE FEEDBACK IN MBA AND ED.D. IN
EDUCATIONAL LEADERSHIP STUDENTS
Justin Tucker May 2011 54 Pages
Directed by: Drs. Elizabeth L. Shoenfelt, Reagan Brown, Jacqueline Pope-Tarrence
Department of Psychology Western Kentucky University
The current study assessed the convergent validity of the Situational Assessment
of Leadership – Student Assessment (SALSA©), a situational judgment test (SJT), with
multi-source ratings. The SALSA© was administered to MBA and Ed.D. in Educational
Leadership students via Blackboard; multi-source ratings, which paralleled the leadership
dimensions of the SALSA©, were administered online. Each student completed the
SALSA© and was rated by his or her supervisor, 3-5 peers, 1-5 subordinates, and
him/herself. SALSA© scores were not correlated with any of the corresponding
dimensions on multi-source ratings. This finding may suggest that the multi-source
ratings and SALSA© are not measuring the same leadership construct; or these results
may be due to low variance in SALSA scores and low variance in the ratings. Self ratings
were not significantly higher than other ratings, with three exceptions. Also, no
difference was found between SALSA scores for MBA and Ed.D. students. This study
was limited by the small sample size.

The Situational Assessment of Leadership – Student Assessment (SALSA©) is a
situational judgment test (SJT) measuring eight dimensions of leadership; it is web-based
and consists of 120 items. Research has shown the SALSA© to be a valid measure of
leadership, demonstrating convergent validity with scores from the Western Kentucky
Center for Leadership Excellence assessment center (Grant, 2009). The current study
assessed the convergent validity of the SALSA© with multi-source feedback. The sample
consisted of MBA and Ed.D. (Doctor of Education in Educational Leadership) students
who were enrolled at Western Kentucky University (WKU) and had a full time job. The
students took the SALSA©; their scores were correlated with self ratings as well as with
ratings from their supervisors, peers, and subordinates. I will discuss an overview of the
research of situational judgment test, an overview of the SALSA©, multi-source
feedback, and finally the current study, an examination of the convergent validity of
scores on the SALSA© with multi-source feedback.
Review of the Literature
Overview of Situational Judgment Tests
SJTs are designed to evaluate an individual’s judgment about situations faced in
the work place by presenting him or her with a specific work related scenario and a
choice of possible responses. There are a number of characteristics that all SJTs share.
First, SJT items present an individual with job related situations measuring an identified
construct. These situations can be presented in a number of ways; the two most common
methods are a written or multimedia based format. The second characteristic is that the
answers for each situation are presented in a multiple choice format. Finally, all SJT
scoring keys are developed a priori; that is, scoring an SJT is not dependent on assessor
1

or raters to evaluate an individual’s behavior. SJTs may be used to measure a particular
construct, for example, leadership (Whetzel & McDaniel, 2009).
Motowidlo, Dunnette, and Carter (1990) described the development of SJTs in
three steps. The first step is using subject matter experts (SMEs) to generate critical
incidents of work situations. Once the critical incidents are generated, they are collected
and categorized into dimensions. The second step involves a different group of SMEs
who generate one or more responses to each scenario. Finally, once a range of responses
is developed for each scenario, a scoring key is developed using SMEs to determine
which option is the best or “correct” response for each scenario. The development of
most SJTs follows these steps, although there are variations on this method.
According to McDaniel and Ngyuen (2001), SJTs can be divided into two
categories based on response instructions. The response instructions either fall into the
category of knowledge or behavioral tendency. The knowledge category consists of
response instructions asking the individual to choose the best possible response to the
given situation (should do). The behavioral tendency category consists of response
instructions asking the individual to choose the response that he or she would most likely
do in the given situation (would do). McDaniel and Ngyuen (2001) hypothesized that the
construct validity of an SJT may be influenced by the response instructions. McDaniel,
Hartman, Whetzel, and Grubb (2007) found correlations between SJT scores and
measures of cognitive ability and The Big Five personality traits. They also noted that
SJTs with knowledge instructions correlated higher with cognitive ability than with
personality. In contrast, SJTs with behavior tendency instructions were found to correlate
higher with personality than with cognitive ability. These results suggest that one could
2

change the construct measured by an SJT by altering the response instructions. In the
same study, McDaniel et al. (2007) examined whether the content of the SJT had any
influence on these differences. They found that content had no effect and that, by altering
the response instructions, one could change the construct being measured by the SJT.
Several research studies have demonstrated that scores on SJTs can be
significantly related to performance; however, there is still the question of why SJTs
work. Weekley and Jones (1999) stated that explanations for the predictive power of SJTs
basically fall into two different perspectives. The first is that SJTs capture some unique
construct that predicts performance. This construct is a type of intelligence related to
solving real world problems. Sometimes labeled tacit knowledge, this construct is
independent of cognitive ability and is derived from experience. That is, one develops
tacit knowledge through experience, but not all people with experience develop this type
of knowledge. In other words, this explanation states that SJTs measure the construct of
tacit knowledge by asking individuals what should be done in complex situations. The
second perspective is that SJT’s predictive powers come from the fact that the test
reflects the influences of other constructs that are related to performance, such as
cognitive ability, experience, and job knowledge. Results from a study conducted by
Weekley and Jones (1999) supported the second perspective. In their study, Weekley and
Jones examined SJT scores of mid-level retail associates along with cognitive ability
ratings, performance ratings, experience, and biodata information. The results of the
study showed that scores on SJTs were significantly correlated with cognitive ability (r =
.45), performance (r = .19), and experience (r = .20). The authors suggested that these
results show the predictive powers of SJTs most likely come from the influence of job-
3

related abilities and do not measure a unique construct.
Weekley and Ployhart (2005) noted several possible reasons for the popularity of
SJTs for selection purposes; SJTs have similar validities to cognitive ability tests, have
shown lower subgroup differences, and usually have a positive reaction from test takers.
Weekley and Ployhart used multiple measures to predict managerial job performance.
The measures included ability (general cognitive ability, grade point average), experience
(general work experience, job tenure, training experience), and personality (Five Factor
Model), along with an SJT. Significant correlations were found between the SJT and job
performance (r = .22). Significant correlations were also found between SJTs and
cognitive ability (r = .36), job tenure (r = .13), GPA (r = .21), conscientiousness (r = .13),
emotional stability (r = .17), extroversion (r = .14), and training experience (r = .12). In
another study, Motowidlo and Tippins (1993) found a significant predictive validity
correlation for a SJT developed for marketing jobs with job performance of .26 for a
sample of 301 incumbents and applicants. They also reported significant race and sex
differences on the SJT. Whites scored higher than blacks by an average .32 standard
deviation. This difference, however, is much smaller than the differences associated with
cognitive ability tests, which usually show whites scoring higher than blacks by almost
one standard deviation. Women scored higher than men by only .20 standard deviation.
These small differences suggest SJTs have less potential adverse impact then cognitive
ability tests when used as selection tools (Motowidlo & Tippins, 1993).
The concern of fakability has been raised in previous research. The question is
whether SJTs are more susceptible to faking than other measures. Research has showed
that SJTs are susceptible to faking; however, the effect of faking on SJTs is smaller than
4

faking on other measures, such as personality tests (Lievens, Peeters, & Schollaert,
2008). Issues such as item transparency, cognitive loading, and response instructions
were found to influence the fakability of SJTs (Lievens et al., 2008). Another concern
related to fakablity is the idea of practice effects or coaching. In other words, can scores
on an SJT be improve through coaching? Research on this issue is very limited and
shows that some SJTs may be more susceptible than others, especially with high-stakes
testing (e.g., admissions or licensure), and caution must be applied when using SJTs for
high-stakes testing (Lievens et al., 2008).
Another concern relevant to this study is whether web-based SJTs are equivalent
to paper and pencil based SJTs. Ployhart, Weekley, Holtz, and Kemp (2003) tested this
hypothesis. They administered a biodata form, a personality measure, and an SJT to both
applicants and incumbents. The applicants were split into two groups and took all the
measures in either a web-based or paper and pencil format. The results showed that web-
based measures within the applicant group tended to be better measures than paper and
pencil based measures. The reason for this was that web-based measures had a more
normal distribution of scores, lower means, higher internal consistency, and more
variance. The following section will discuss research related to SJTs and leadership.
SJTs and Leadership
A meta-analysis conducted by Christian, Edwards, and Bradley (2010) discovered
the most common constructs measured by SJTs were leadership and interpersonal skills.
The total number of studies in the meta-analysis that reported measuring leadership as a
construct was 51, representing 37.5% of the total SJTs in the study. The criterion-related
validities of the SJTs for each construct were also examined for job performance. SJTs
5

measuring the construct of leadership were found to have a validity of .28. Christian et al.
reasoned that measuring leadership using an SJT is so common because one is able to
measure applicant’s behavior on tasks that are complex, time consuming, and expensive
to assess otherwise. Among other reasons, time and cost were the two main factors that
resulted in the SALSA© being developed. Details on how the SALSA© was developed
are outlined in the following section.
The SALSA©
The SJT involved in the current study, The Situational Assessment of Leadership-
Student Assessment (SALSA©), was developed by Shoenfelt (2009) to assess the seven
dimensions of leadership identified by Arthur, Day, McNelly, and Edens (2003). These
dimensions are Organizing/Visioning/Planning, Consideration/ Team Skills, Problem
Solving/Innovation, Influencing Others, Communication, Drive/Results Orientation, and
Tolerance for Stress. An eighth dimension, Integrity/Ethics, was added. The SALSA© is
a web-based test that consists of 120 items clustered into eight dimensions. These items
were generated using the critical incident technique first indentified by Flanagan (1954).
Subject matter experts (SME) were asked to write critical incidents for each of the
dimensions, as well as to provide three to four responses to each incident. The SMEs
consisted of cadets from WKU’s ROTC program, honors leadership students, and student
members of the Dynamic Leadership Institute. After all the incidents and responses were
generated, a second set of SMEs consisting of seven WKU faculty members experienced
in teaching leadership, were asked to rate the responses to each incident. These ratings
were used to calibrate the responses to indentify the correct response. Only incidents for
which one response was determined to be the correct response were kept as final items on
6

the test (Grant, 2009). The SALSA© is a knowledge based situational judgment test. It
asks individuals to pick what they believe to be the best possible response to a given
situation (i.e., “should” do rather than “would do”). Convergent validity of SALSA©
scores with scores from the CLE’s assessment center on each dimension have be found to
range from r =.28 to r = .44. The magnitude of these correlations is low but the
correlations were found to be significant. Grant, also indicated that the internal
consistency of the SALSA© is α = .91.
Multi-source Feedback
Performance ratings using multi-source feedback are becoming more widely used
and accepted. Multi-source feedback incorporates performance ratings from a number of
different sources. The most common sources are ratings from an individual’s supervisors,
peers, subordinates, and self ratings (Conway & Huffcutt, 1997). Multi-source rating is
not to be confused with the popular term 360° feedback. Three hundred and sixty degree
feedback is a type of multi-source feedback that specifically uses ratings from superiors,
peers, subordinates, and self. The raters can be conceptualized as forming a circle around
the individual, representing the varying degrees of power they have relative to the
individual being rated. Multi-source feedback requires feedback from only two or more
types of sources (Foster & Law, 2006).
When using multi-source feedback it is important that ratings reflect the true
performance of the individual and that steps are taken to reduce errors that influence
rating scores. In one study, Antonioni (1994) assigned a group of managers and their
subordinates to two different groups. The participants were told the ratings were for
developmental purposes only. The first group was an anonymous condition where
7

supervisors only received a summarized report. The second group was an accountability
condition where subordinates were identified in the feedback forms received by their
supervisors. The results showed that ratings were less inflated and therefore more
accurate in the anonymous condition. Although supervisors seemed to favor the condition
in which the subordinates were identified, the results point towards rater anonymity as the
best practice. A similar study by London and Wholers (1991) found that 24% of
participants said they would have rated their boss differently if their ratings had not been
anonymous. When attempting to receive the most accurate ratings from raters it is
important to stress the fact that their ratings will be anonymous.
Other research has shown that informing raters that their rating would be used
only for developmental purposes rather than administrative purposes (i.e., purposes that
might affect the individual’s job) will produce higher quality ratings (Farh, Cannella, &
Bedeian, 1991). A study conducted by Farh et al. showed that students were more
susceptible to leniency and halo errors in rating other team members when they were told
the ratings were for administrative purposes as opposed to developmental purposes.
London and Wholers (1991) found 34% of participants said they would have rated their
boss differently if the ratings were to be used for performance appraisal rather than for
developmental purposes. Other suggestions the authors offered to increase rating
accuracy were rater training to reduce certain types of errors and explaining to raters the
importance of providing accurate ratings. Given the results of these studies, raters in this
study will be informed that their ratings will be anonymous and will be for developmental
purposes only.
8

Additional research on multi-source feedback has shown that self ratings tend to
be higher compared to ratings from other sources (Bass & Yammarino, 1991; Brutus,
Fleenor, & McCauley, 1999; Harris & Schaubroeck, 1988). This is evident in the
discrepancies found between self and other ratings (i.e., peer, supervisor, and
subordinate). These discrepancies in some cases are related to characteristics of the ratee.
In one study that examined leadership behavior in Navy officers, it was found that the
least successful officers had the highest discrepancies (between self ratings and
subordinate ratings) while the most successful officers had the lowest discrepancies
between ratings. In other words, the least successful officers were more likely to rate
themselves much higher than the most successful officers (Bass & Yammarino, 1991).
Van Velsor, Taylor, and Leslie (1993) found similar results in that participants who rated
themselves the highest received the lowest ratings from subordinates. These results
suggest that individuals find it difficult to be objective when rating themselves, and, as a
result, their ratings tend to be inflated.
Studies on the reliability of multi-source feedback have shown reliability to vary
depending on the source. Conway and Huffcutt (1997) examined interrater reliabilities
and found supervisors to have higher reliability (.50) than peers (.37); subordinates had
the lowest reliability (.30). The authors suggested that inter-rater reliabilities can be
increased by having at least four to six raters for each source. Conway and Huffcutt also
found low agreement between sources, but this may be due to the fact that different rating
sources may actually perceive real behavior differences when making their ratings. When
estimating reliability for multi-source ratings it seems most appropriate to examine inter-
rater agreement within sources. Multi-source feedback has been shown a have good
9

internal consistency with coefficient alphas that fall in .70 range (Van Velsor & Leslie,
1991).
Multi-source feedback is valuable in that it takes into account many different
perspectives, and each of these perspectives offers relevant information. Differences
between sources may be due to different opportunities sources have to observe a
particular behavior or the fact sources may differ in terms of which behaviors they see as
critical for a dimension (Dalessio, 1993). It is because of these differences that, in the
current study, each rating source (i.e., supervisor, peer, self, and subordinate) will be
examined separately.
Multi-source feedback is an effective method for evaluating an individual’s
current performance. In this study, multi-source feedback will be used to assess
participants’ leadership skills. Participants will be rated on the same dimensions
measured by SALSA©. These ratings will then be used to help establish if SALSA© is a
valid instrument to measure leadership. This will be accomplished by examining the
convergent validity between multi-source ratings and scores on SALSA©. Convergent
validity is established by examining how scores on one instrument measuring a specific
construct correlate to scores on another instrument measuring the same construct (Brown,
2007). In other words, a person who scores high on one instrument should also score high
on another instrument measuring the same construct. Discriminant validity is the
compliment to convergent validity in that a person’s scores on one instrument should not
correlate significantly with scores on another instrument that measures a different
construct (Anastasi, 1982). Convergent and discriminant validity are used to determine
construct validity. That is, whether an instrument actually measures the construct it’s
10

supposed to measure and not something else. The goal of this study is to assess the
construct validity of SALSA©. If SALSA© is a valid measure of leadership then scores
on SALSA© dimensions should correlate with the multi-source feedback ratings on the
same dimensions and should not correlate with ratings on other dimensions.
The Current Study
The current study involved students enrolled in the MBA and Ed.D. program at
Western Kentucky University. Students completed SALSA© as well as rated themselves
on each of the eight dimension SALSA© measures. The students received ratings from
their supervisor, multiple peers, and subordinates from their current job on each of the
dimensions. In order to ensure the most accurate ratings possible, the current study
emphasized that all raters be completely honest when making their ratings, and that their
ratings would be used for developmental purposes only. Once scores and ratings were
collected, the convergent validity of SALSA© scores with multi-source feedback was
analyzed. Correlations were calculated between Overall SALSA© scores and overall
rating scores from each source, and between SALSA© scores for each dimension and
ratings on corresponding dimensions. SALSA© scores and rating feedback were
provided to the participants for potential developmental purposes.
Hypotheses
The eight dimensions on the rater feedback forms are the same as the dimensions
measured by the SALSA©. My first and second hypotheses are as follows:
H1: Overall SALSA© scores will correlate positively with the overall leadership
effectiveness (OLE) ratings from each rating source (i.e., supervisor, peer, self,
and subordinate).
11

H2: Individual SALSA© scores on each dimension will correlate positively with
corresponding overall ratings on each dimension from each rating source.
As noted earlier, research has shown that individuals are likely to rate themselves higher
than other rating sources (e.g., Bass & Yammarino, 1991; Brutus et al., 1997; Harris &
Schaubroeck, 1988). My third and fourth hypotheses are as follows:
H3: Overall Leadership Effectiveness (OLE) Self ratings will be higher than OLE
peer, OLE supervisor, and OLE subordinate ratings.
H4: Self ratings for each dimension will be higher than peer, supervisor, and
subordinate ratings for the corresponding dimension.
12

Method
Participants
Participants in this study were 21 Western Kentucky University students currently
enrolled in the MBA (n = 12) and Ed.D. program (n = 9). There were 12 males and 7
females, with an average age of 37.89 (SD = 8.34), and an average of 11-15 years of
work experience. The type of industry participants worked in included utilities (n =1),
construction (n = 1), manufacturing (n = 4), retail trade (n = 1), professional, scientific or
technical trade (n = 1), educational service (n = 10), and health care or social assistance
(n = 1).
Instruments
Participants completed SALSA© via an online platform, Blackboard. SALSA©
items present the student with a hypothetical situation; he or she must decide which
response demonstrates the most effective leadership behavior. The participants in this
study completed alternate forms of SALSA© (i.e., Form A or Form B). Both forms
measure the same eight dimensions of leadership and are equal in difficulty (Grant,
2009). SALSA© takes about forty-five minutes to complete.
Rating Scale
The rating form was completed by participants, their supervisors, peers, and
subordinates; rating forms were accessed through a link in an email sent out to
participants. The participants were asked to identify themselves only through their
relationship to the target individual (i.e., supervisor, peer, subordinate, or self), and then
to identify the participant they were rating. The rating form consisted of scales for each of
the eight dimensions measured by the SALSA©. The rating scale for each dimension
13

consisted of four to twelve behavioral items related to the dimension. Raters were asked
to rate the individual on each behavioral item on a 5-point graphic rating scale ranging
from 1 (not at all effective) to 5 (very effective). Raters then made a rating on a 5-point
graphic rating scale for an overall rating on each dimension. Finally, raters were asked to
assign an overall leadership effectiveness rating (OLE) for the target individual on the
same scale.
Procedure
With assistance from the Business College and the College of Education and
Behavioral Sciences, all MBA and Ed.D. students were given the opportunity to
participate in this study. The students who chose to participate were sent an email
detailing the study with instructions on how to proceed and on identifying their raters.
Participants were asked to fill out a form identifying their supervisor, 3-5 peers, and 1-5
subordinates. Participants then sent the form to me and I sent a separate email detailing
instructions for raters. On the online rating form, raters were asked to rate a number of
behavioral items for each dimension measured by SALSA. Also, raters were asked to rate
the target individual (or themselves) on each dimension. Once the raters gave ratings for
all of the dimensions and behavioral items, they were asked to give an overall leadership
effectiveness (OLE) rating, also on a 5-point Likert scale. This process provided two
different ratings for each student on each dimension (i.e., the overall rating for each
dimension and an overall rating on each dimension derived by averaging the behavioral
items), as well as an overall leadership effectiveness (OLE) rating.
14

Results
Overall SALSA© scores for each individual were calculated by summing each of
the eight dimension scores. Three overall rating scores were calculated for each
individual from each source. An overall rating score was calculated by averaging rating
scores across each dimension and an overall behavioral average was calculated by
averaging the ratings of each behavioral item across dimensions. The overall leadership
effectiveness scores (OLE) were also examined. All three ratings were correlated for each
source (Table 1); all correlations were found to be significant. These significant
correlations indicate that raters were consistent in how they assigned ratings to each
rating category (i.e., overall rating for dimension, ratings for behavioral items, and
overall leadership effectiveness rating). Both ratings for each dimension (i.e., the overall
rating for each dimension and an overall rating on each dimension by averaging the
behavioral items) were correlated; these ratings correlated significantly with each other
for each source (see Appendix A). These significant correlations provide further evidence
that raters were consistent in how they rated each item on the rating form. A table
showing the correlations between the averaged behavioral ratings from each source for
each dimension can be found in Appendix B.
Table 2 contains the mean and standard deviation for scores on SALSA© and
ratings from each source. A t-test to determine whether MBA and Ed.D. overall
SALSA© scores differed indicated that MBA scores (M = 47.67, SD = 6.3) did not differ
significantly from Ed.D. scores (M = 48.78, SD = 6.1), t (19) = -.406, p = .69). A t-test
was conducted to determine if work experience had an effect on SALSA© scores.
Because of the small sample, work experience was collapsed into two categories. The
15

16
first category was 1-15yrs and the second was 16-20+ yrs of work experience. There was
no significant difference in overall SALSA scores as a function of work experience.
Table 1
Correlations between overall ratings by each source
Note: OLE = Overall Leadership Effectiveness rating; Averaged Rating = Average overall rating across all 8 dimensions; Behavioral Averaged = Average of behavioral items across all 8 dimensions. *p < .05, **p < .01.
Self Ratings OLE (Self Rating)
Averaged Rating (Self)
Behavioral Averaged Rating (Self)
OLE (Self Rating) 1.00 Averaged Rating (Self)
.854** 1.00
Behavioral Averaged Rating (Self)
.573* .860** 1.00
Peer Ratings OLE (Peer) Averaged Rating
(Peer) Behavioral Averaged Rating (Peer)
OLE (Peer) 1.00 Averaged Rating (Peer)
.860** 1.00
Behavioral Averaged Rating (Peer)
.882** .984** 1.00
Supervisor Ratings OLE
(Supervisor) Averaged Rating (Supervisor)
Behavioral Averaged Rating (Supervisor)
OLE (Supervisor) 1.00 Averaged Rating (Supervisor)
.922** 1.00
Behavioral Averaged Rating (Supervisor)
.858** .967** 1.00
Subordinate Ratings
OLE (Subordinate)
Averaged Rating (Subordinate)
Behavioral Averaged Rating (Subordinate)
OLE (Subordinate) 1.00 Averaged Rating (Subordinate)
.714** 1.00
Behavioral Averaged Rating (Subordinate)
.922** .969** 1.00

Table 2
Means and Standard deviations for scores on SALSA© and ratings from each source
Dimension Self (SD)
Peer (SD)
Supervisor (SD)
Subordinate (SD)
Organization/Planning/Vision SALSA 7.14 (1.4)
Behavioral Average 4.02 (.46) 4.25 (.47) 4.32 (.63) 4.38 (.47) Overall Average 4.00 (.52) 4.28 (.62) 4.11 (.96) 4.48 (.43)
Consideration/ Team Skills SALSA 7.14 (1.7)
Behavioral Average 3.89 (.60) 4.19 (.60) 4.09 (.77) 4.32 (.56) Overall Average 3.95 (.85) 4.26 (.61) 4.20 (1.0) 4.45 (.58)
Problem Solving/Innovation SALSA 6.38 (1.6)
Behavioral Average 4.12 (.38) 4.31 (.45) 4.22 (.73) 4.42 (.35) Overall Average 4.16 (.60) 4.30 (.50) 4.08 (.98) 4.34 (.53)
Influencing Others SALSA 4.19 (1.0)
Behavioral Average 4.11 (.46) 4.24 (.52) 4.17 (.73) 4.48 (.44) Overall Average 4.00 (.67) 4.23 (.58) 4.07 (.74) 4.53 (.59)
Communication SALSA 4.81 (1.1)
Behavioral Average 4.21 (.40) 4.38 (.45) 4.21 (.70) 4.48 (.42) Overall Average 4.21 (.63) 4.40 (.48) 4.31 (.56) 4.59 (.57)
Drive/Results Orientation SALSA 9.95 (2.3)
Behavioral Average 3.99 (.43) 4.32 (.54) 4.26 (.72) 4.48 (.37) Overall Average 4.11 (.66) 4.38 (.66) 4.37 (.73) 4.55 (.42)
Tolerance For Stress SALSA 4.14 (1.1)
Behavioral Average 3.94 (.75) 4.21 (.47) 4.08 (.84) 4.30 (.47) Overall Average 4.00 (.84) 4.23 (.50) 4.08 (1.05) 4.40 (.54)
Integrity/Ethics SALSA 4.33 (1.4)
Behavioral Average 4.39 (.45) 4.48 (.42) 4.35 (.80) 4.57 (.50) Overall Average 4.44 (.62) 4.63 (.47) 4.41 (.78) 4.58 (.59)
Overall SALSA 48.14 (6.1)
Behavioral Average 4.06 (.33) 4.30 (.46) 4.32 (.54) 4.43 (.41) Overall Average 4.07 (.37) 4.35 (.47) 4.16 (.77) 4.57 (.28)
Overall Leadership Effectiveness 4.00 (.58) 4.34 (.60) 4.38 (.94) 4.47 (.78)
17

Hypothesis 1, which predicted overall SALSA© score would be positively
correlated with overall leadership effectiveness ratings (OLE) from each rating source
was not supported for any of the ratings (self (r = -.12, p = .62), peer (r = .11, p = .64),
supervisor (r = -.16, p = .56) and subordinate ratings (r = -.13, p = .66)).
Hypothesis 2, which predicted individual SALSA© scores on each dimension
would correlate positively with corresponding dimension ratings from each rating source,
was tested by correlating each SALSA© dimension score with the corresponding overall
rating for each dimension from each rating source. There were no significant correlations
found between SALSA© dimension scores and corresponding dimension ratings from
each source. Therefore, Hypothesis 2 was not supported. A table showing the convergent
and discriminant validity for each dimension can be found in Appendix C.
As noted earlier, research has shown that individuals are likely to rate themselves
higher than are other rating sources (Bass & Yammarino, 1991; Brutus et al., 1997;
Harris & Schaubroeck, 1988). Hypotheses 3 and 4 stated that self ratings would be higher
than peer and supervisor ratings, respectively. Paired-sample t-tests were used to test this
hypothesis. OLE self ratings were not significantly higher (M = 4.00, SD = .59) than OLE
peer ratings (M = 4.29, SD = .61; t (17) = -1.50, p = .152.), and not significantly higher
than OLE supervisor ratings (M = 4.36, SD = .99; t (13) = -.925, p = .372). However,
OLE subordinate ratings (M = 4.43, SD = .79) were found to be significantly higher than
OLE self ratings (M = 4.00, SD = .59; t (13) = -2.59, p < .05). This finding was in the
opposite direction from what was expected. Therefore, Hypothesis 3 was not supported.
18

Because there were two different types of ratings for each dimension (i.e., an
overall rating and an average of the ratings on the behavioral items), two different paired
t-tests were run to test Hypothesis 4. The first t-test compared the overall self rating for
each dimension to the corresponding overall rating from each source (i.e., peer,
supervisor, subordinate). The only significant difference found was between self ratings
and subordinate ratings for the dimension of influencing others. This difference was in
the opposite direction from what was predicted; that is, subordinate ratings on the
dimension of influencing others (M = 4.49, SD = .60) was significantly higher than self
ratings on the same dimension (M = 4.00, SD = .71; t (13) = -2.71, p = .019; see
Appendix D). The second t-test compared the behavioral item average for self on each
dimension to the corresponding overall rating from each source. Three significant
differences were found between self ratings and subordinate ratings: for the dimensions
of organizing/vision/planning, influencing others, and drive/results orientation. In all
three cases subordinate ratings were significantly higher than self ratings (see appendix
E). Therefore, Hypothesis 4 was not supported.
19

Discussion
Convergent Validity
The purpose of this study was to examine the convergent validity between multi-
source ratings and SALSA© scores. There were no significant correlations found
between overall ratings and overall SALSA© scores. Additionally, there were no
significant correlations found between overall ratings for each dimension and
corresponding dimensions on SALSA©. One possible explanation for these findings is
that the multi-source ratings and SALSA© are not measuring the same leadership
construct.
SALSA© was keyed based on a participative, democratic model of leadership.
This style of leadership measured by SALSA© may not be the style of leadership
commonly displayed in the organizations represented in this study. Other explanations for
the lack of convergence between SALSA© scores and the ratings are the small sample
size, the low variance is scores on SALSA©, and low variance/ceiling effect on ratings.
That is, the restricted range in both the SALSA scores and ratings may have made it
difficult to find any significant correlations.
Additional Findings
Contrary to what previous research has shown (i.e., Bass & Yammarino, 1991;
Brutus et al., 1999; Harris & Schaubroeck, 1988), in the current study, when self ratings
were compared to ratings from other sources, self ratings were not significantly higher
than peer, supervisor, or subordinate ratings. However, it is interesting to note that on
three dimensions (i.e., organizing/vision/planning, influencing others, and drive/results
orientation) subordinate ratings were significantly higher than self ratings. Previous
20
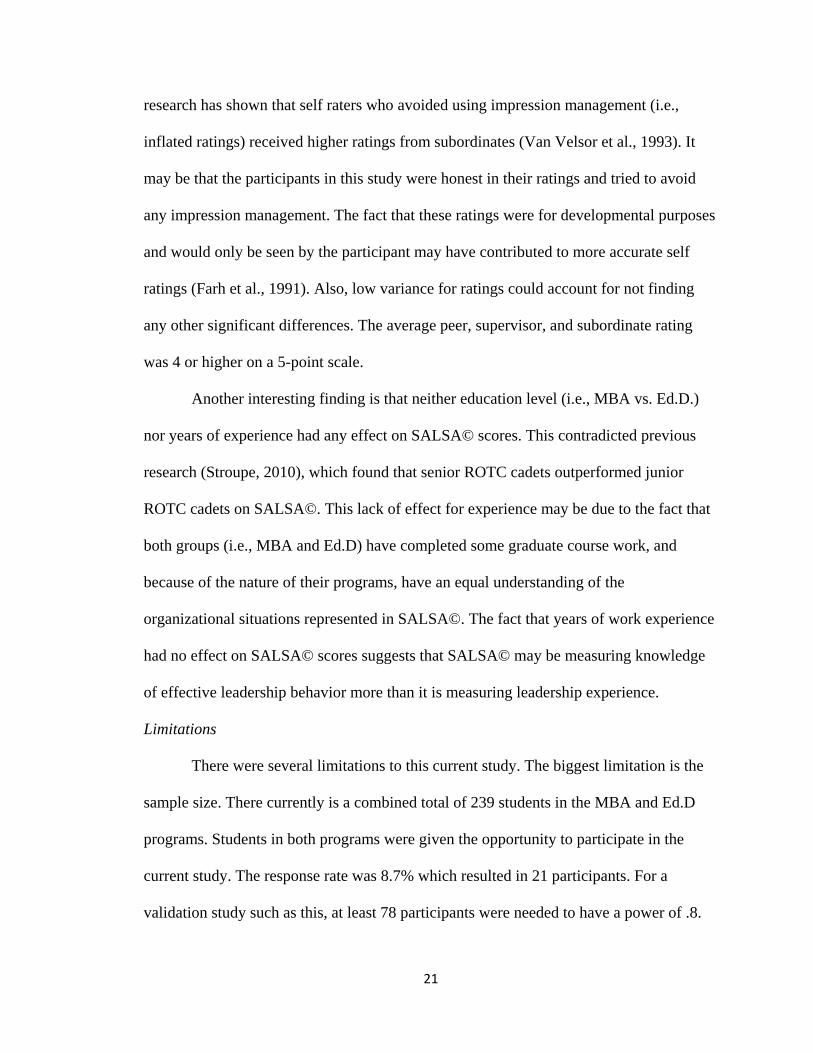
research has shown that self raters who avoided using impression management (i.e.,
inflated ratings) received higher ratings from subordinates (Van Velsor et al., 1993). It
may be that the participants in this study were honest in their ratings and tried to avoid
any impression management. The fact that these ratings were for developmental purposes
and would only be seen by the participant may have contributed to more accurate self
ratings (Farh et al., 1991). Also, low variance for ratings could account for not finding
any other significant differences. The average peer, supervisor, and subordinate rating
was 4 or higher on a 5-point scale.
Another interesting finding is that neither education level (i.e., MBA vs. Ed.D.)
nor years of experience had any effect on SALSA© scores. This contradicted previous
research (Stroupe, 2010), which found that senior ROTC cadets outperformed junior
ROTC cadets on SALSA©. This lack of effect for experience may be due to the fact that
both groups (i.e., MBA and Ed.D) have completed some graduate course work, and
because of the nature of their programs, have an equal understanding of the
organizational situations represented in SALSA©. The fact that years of work experience
had no effect on SALSA© scores suggests that SALSA© may be measuring knowledge
of effective leadership behavior more than it is measuring leadership experience.
Limitations
There were several limitations to this current study. The biggest limitation is the
sample size. There currently is a combined total of 239 students in the MBA and Ed.D
programs. Students in both programs were given the opportunity to participate in the
current study. The response rate was 8.7% which resulted in 21 participants. For a
validation study such as this, at least 78 participants were needed to have a power of .8.
21

The results of this study might change with a higher rate of participants from the MBA
and Ed.D programs. The low participation rate may have resulted in a self-selection
effect. That is, only students who believed themselves to be effective leaders chose to
participate. The ceiling effect found across all rating scores suggests this may be the case.
Another limitation is the fact that the average SALSA© score was 48.14 (SD =
6.07). That is, the average participant was considered to have a high level of knowledge
of effective leadership behavior; in fact, 62% of participants scored a 48 or above on
SALSA©. The lack of variance in scores may have contributed to finding few significant
differences or significant correlations. The high SALSA scores also suggest the
possibility that those who were high on leadership knowledge chose to participate. In
other words, those who find value in evaluating their leadership ability may have high
leadership ability. Previous research by McDaniel et al. (2007) indicated that SJTs with
knowledge instructions (i.e., ask participant what they “should do” vs. “would do”)
correlate with cognitive ability test. SALSA© falls into the knowledge test category in
that the response instructions ask the individual to choose the best possible response to
the given situation (“should do”). All participants in this study are pursuing a graduate
degree (e.g., a master’s or Ed.D.). Cognitive ability is correlated with education level;
this relationship may have contributed to the high SALSA© scores for the majority of
participants. That is, SALSA© is measuring knowledge of effective leadership behavior
as opposed to leadership ability.
Additionally, not all participants completed every part of the study. Some
participants did not have subordinates and, in some cases, participants’ raters failed to
complete some of the ratings. There were some instances where raters completed the
22
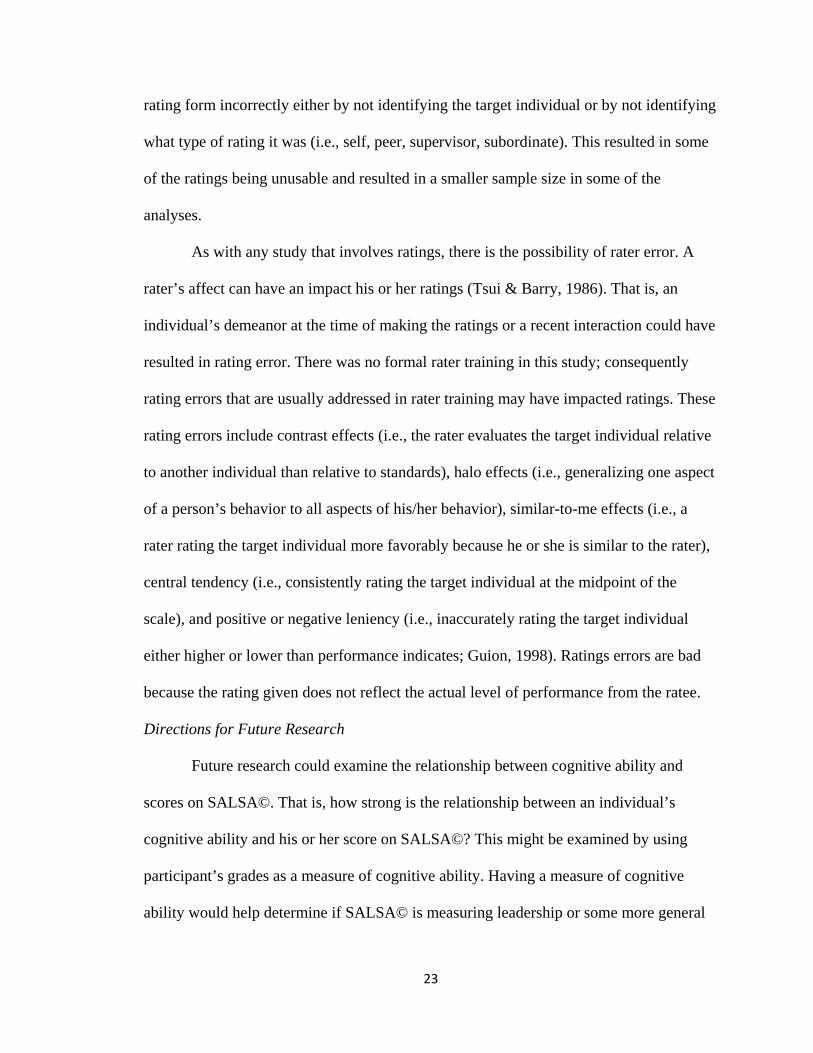
rating form incorrectly either by not identifying the target individual or by not identifying
what type of rating it was (i.e., self, peer, supervisor, subordinate). This resulted in some
of the ratings being unusable and resulted in a smaller sample size in some of the
analyses.
As with any study that involves ratings, there is the possibility of rater error. A
rater’s affect can have an impact his or her ratings (Tsui & Barry, 1986). That is, an
individual’s demeanor at the time of making the ratings or a recent interaction could have
resulted in rating error. There was no formal rater training in this study; consequently
rating errors that are usually addressed in rater training may have impacted ratings. These
rating errors include contrast effects (i.e., the rater evaluates the target individual relative
to another individual than relative to standards), halo effects (i.e., generalizing one aspect
of a person’s behavior to all aspects of his/her behavior), similar-to-me effects (i.e., a
rater rating the target individual more favorably because he or she is similar to the rater),
central tendency (i.e., consistently rating the target individual at the midpoint of the
scale), and positive or negative leniency (i.e., inaccurately rating the target individual
either higher or lower than performance indicates; Guion, 1998). Ratings errors are bad
because the rating given does not reflect the actual level of performance from the ratee.
Directions for Future Research
Future research could examine the relationship between cognitive ability and
scores on SALSA©. That is, how strong is the relationship between an individual’s
cognitive ability and his or her score on SALSA©? This might be examined by using
participant’s grades as a measure of cognitive ability. Having a measure of cognitive
ability would help determine if SALSA© is measuring leadership or some more general
23

construct such as cognitive ability.
In order to draw any definitive conclusions about the validity of SALSA©, a
larger sample size is needed. Future research should concentrate on using similar subjects
(i.e., MBA and Ed.D. students) with a wide range of leadership skills. This will help
determine if SALSA© is a valid measure of leadership. The small sample size and
restricted range on SALSA© scores and ratings in the current study made it hard to draw
any definitive conclusions about the validity of SALSA©.
Conclusion
In sum, convergent validity between the SALSA© and multi-source ratings was
examined. Participants were asked to rate themselves; they then were rated by their
supervisor, peers, and subordinates (if applicable). No significant correlations were
found between scores on SALSA© scores and ratings from any source. Across the eight
dimensions of SALSA© and overall, there were only three significant differences found
between rating sources (i.e., self and subordinate). That is, on the dimensions of
organizing/vision/planning, influencing others, and drive/results orientation subordinates
rated the target individual higher than the individual rated him/herself. No difference was
found between SALSA scores for MBA and Ed.D. students. A larger sample size with
more variance in SALSA© scores and ratings is needed to make any definitive
conclusions about the validity of SALSA©.
24

Anastasi, A. (1982). Psychological Testing. Macmillan Publishing, New York, New
York.
Antonioni, D. (1994). The effects of feedback accountability on upward appraisal ratings.
Personnel Psychology, 47, 349-356.
Arthur, Jr., W., Day, E. A., McNelly, T. L., & Edens, P. S. (2003). A meta-analysis of the
criterion-related validity of assessment center dimensions. Personnel Psychology,
53, 125-154.
Bass, B. M. & Yammarino, F. J. (1991). Congruence of self and others’ leadership
ratings of naval officers for understanding successful performance. Applied
Psychology, 40, 437-454.
Brown, R. (2007). Fundamentals of Psychometrics, Western Kentucky University.
Brutus, S., Fleenor, J. W., & McCauley, C. D. (1999). Demographic and personality
predictors of congruence in multi-source ratings. Journal of Management
Development, 18, 417-435.
Christian, M., Edwards, B., & Bradley, J. (2010). Situational Judgment Tests:
Constructs Assessed and a Meta-Analysis of Their Criterion Related Validities.
Personnel Psychology, 63, 83-117.
Conway, J. M. & Huffcutt, A. I. (1997). Psychometric properties of multisource
performance ratings: A meta-analysis of subordinate, supervisor, peer, and self-
ratings. Human Performance, 10, 331-361.
25

Dalessio, A. T. (1998). Using multisource feedback for employee development and
personnel decisions. In Smither, J.W. (Eds.), Performance appraisal: State of the
art in practice (pp. 279-330). Jossey-Bass Publishers, San Francisco, CA.
Farh, J. L., Cannella, A. A., Jr., & Bedeian, A. G. (1991). Peer ratings: The impact of
purpose on rating quality and user acceptance. Group and Organization Studies,
16, 367-386.
Flanagan, J. C. (1954). The critical incident technique. Psychological Bulletin, 5, 327–
358.
Foster, C. A. & Law, M. R. F. (2006). How many perspectives provide a compass?
Differentiating 360-degree and multi-source feedback. International Journal of
Selection and Assessment, 14, 288-291.
Grant, K. L. (2009). The validation of a situational judgment test to measure leadership
behavior. (Master’s Thesis). Retrieved from TopSCHOLAR. Paper 64.
Guion, R. M. (1998). Assessment, measurement, and prediction for personnel decisions.
Mahwah, NJ US: Lawrence Erlbaum Associates Publishers.
Harris, M. M., & Schaubroeck, J. (1988). A meta-analysis of self-supervisor, self-peer,
and peer-supervisor ratings. Personnel Psychology, 41, 43-62.
Lievens, F., Peeters, H., & Schollaert, E. (2008). Situational judgment tests: A review of
literature. Personnel Review, 37(4), 426-441.
London, M., & Wohlers, A. J. (1991). Agreement between subordinate and self-rating in
upward feedback. Personnel Psychology, 44, 375-390.
26

McDaniel, M. A., Hartman, N. S., Whetzel, D. L., & Grubb III, W. L. (2007). Situational
judgment tests, response instructions, and validity: A meta-analysis. Personnel
Psychology, 60, 63-91.
McDaniel M. A., Ngyuen N. T. (2001). Situational judgment tests: A review of practice
and constructs assessed. International Journal of Selection and Assessment, 9,
103–113.
Motowidlo, S. J., Dunnette, M. D., & Carter, G. W. (1990). An alternative selection
procedure: The low-fidelity simulation. Journal of Applied Psychology, 75, 640-
647.
Motowidlo, S., & Tippins, N. (1993). Further studies of the low-fidelity simulation in the
form of a situational inventory. Journal of Occupational & Organizational
Psychology, 66, 337-344.
Ployhart, R., Weekley, J., Holtz, B., & Kemp, C. (2003). Web-based and Paper-and-
Pencil Testing of Applications in a Proctored Setting: Are Personality, Biodata,
and Situational Judgment Test Comparable? Personnel Psychology, 56, 733-752.
Shoenfelt, E. L. (2008). Situational Assessment of Leadership – Student Assessment©
(SALSA©). Bowling Green, KY.
Stroupe, H. (2010). An Evaluation of the Convergent Validity of Multi-Source Feedback
with Situational Assessment of Leadership-Student Assessment (SALSA©).
(Master’s Thesis).
Tsui, A. S., & Barry, B. (1986). Research notes. Interpersonal affect and rating errors.
Academy of Management Journal, 29, 586-599.
27
Van Velsor, E., Taylor, S., & Leslie, J. B. (1993). An examination of the relationships
among self-perception accuracy, self-awareness, gender, and leader effectiveness.
Human Resource Management, 32, 249-263.
Weekley, J. A. & Jones, C. (1999). Further studies of situational tests. Personnel
Psychology, 52, 679-700.
Weekley, J. A. & Ployhart, R. E. (2005). Situational judgment: Antecedents and
relationships with performance. Human Performance, 18, 81-104.
Whetzel, D., & McDaniel, M. (2009). Situational judgment tests: An overview of current
research. Human Resource Management Review, 19, 188-202.
28
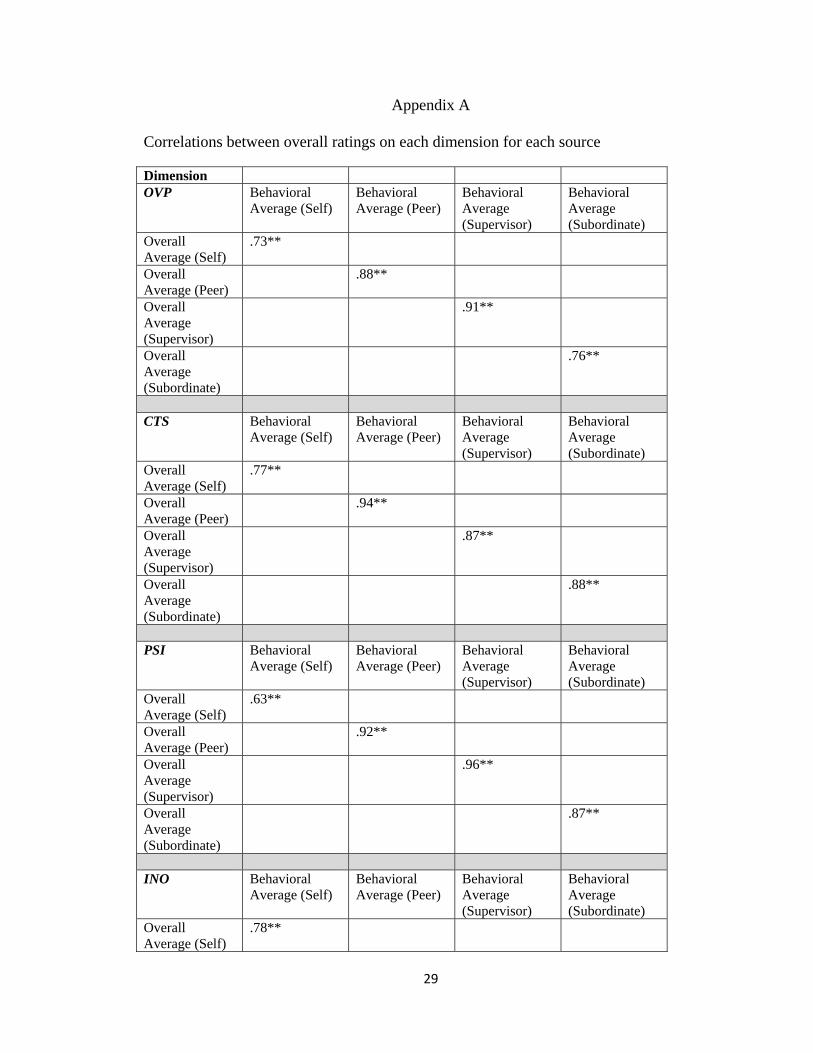
Appendix A
Correlations between overall ratings on each dimension for each source
Dimension OVP Behavioral
Average (Self) Behavioral Average (Peer)
Behavioral Average (Supervisor)
Behavioral Average (Subordinate)
Overall Average (Self)
.73**
Overall Average (Peer)
.88**
Overall Average (Supervisor)
.91**
Overall Average (Subordinate)
.76**
CTS Behavioral
Average (Self) Behavioral Average (Peer)
Behavioral Average (Supervisor)
Behavioral Average (Subordinate)
Overall Average (Self)
.77**
Overall Average (Peer)
.94**
Overall Average (Supervisor)
.87**
Overall Average (Subordinate)
.88**
PSI Behavioral
Average (Self) Behavioral Average (Peer)
Behavioral Average (Supervisor)
Behavioral Average (Subordinate)
Overall Average (Self)
.63**
Overall Average (Peer)
.92**
Overall Average (Supervisor)
.96**
Overall Average (Subordinate)
.87**
INO Behavioral
Average (Self) Behavioral Average (Peer)
Behavioral Average (Supervisor)
Behavioral Average (Subordinate)
Overall Average (Self)
.78**
29

Overall Average (Peer)
.96**
Overall Average (Supervisor)
.94**
Overall Average (Subordinate)
.92**
COM Behavioral
Average (Self) Behavioral Average (Peer)
Behavioral Average (Supervisor)
Behavioral Average (Subordinate)
Overall Average (Self)
.55*
Overall Average (Peer)
.90**
Overall Average (Supervisor)
.91*
Overall Average (Subordinate)
.87*
DRO Behavioral
Average (Self) Behavioral Average (Peer)
Behavioral Average (Supervisor)
Behavioral Average (Subordinate)
Overall Average (Self)
.65**
Overall Average (Peer)
.87**
Overall Average (Supervisor)
.91**
Overall Average (Subordinate)
.77**
TFS Behavioral
Average (Self) Behavioral Average (Peer)
Behavioral Average (Supervisor)
Behavioral Average (Subordinate)
Overall Average (Self)
.88**
Overall Average (Peer)
.89**
Overall Average (Supervisor)
.95**
Overall Average (Subordinate)
.83**
30

INE Behavioral Average (Self)
Behavioral Average (Peer)
Behavioral Average (Supervisor)
Behavioral Average (Subordinate)
Overall Average (Self)
.81**
Overall Average (Peer)
.78**
Overall Average (Supervisor)
.97**
Overall Average (Subordinate)
.96**
Overall Average = The global rating given for that particular dimension; Behavioral Average = The average ratings of the behavioral items for that particular dimension. OPV = Organizing/Visioning/Planning; CTS = Consideration/ Team Skills; PSI = Problem Solving/Innovation; INO = Influencing Others, Communication; DRO = Drive/Results Orientation; TFS = Tolerance for Stress; INE = Integrity/Ethics. *p < .05, **p < .01.
31

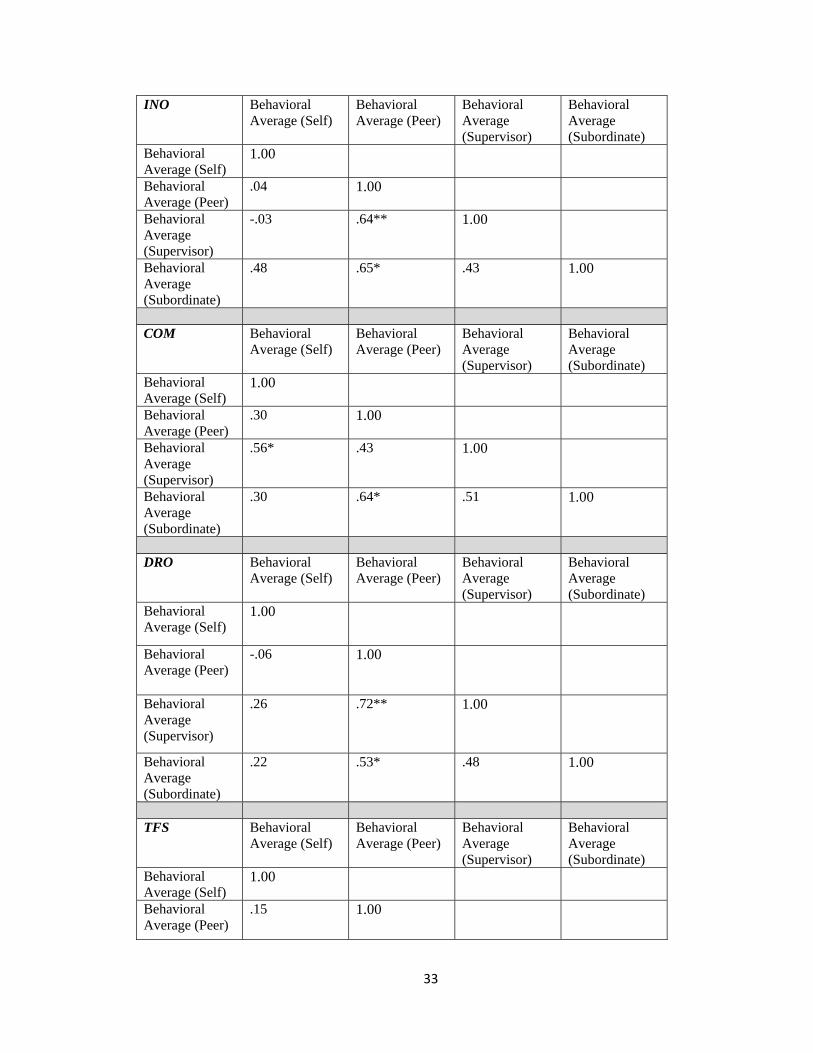
Appendix B
Correlations between average behavioral ratings from each source for each dimension
Dimension OVP Behavioral
Average (Self) Behavioral Average (Peer)
Behavioral Average (Supervisor)
Behavioral Average (Subordinate)
Behavioral Average (Self)
1.00
Behavioral Average (Peer)
.07 1.00
Behavioral Average (Supervisor)
.32 .14 1.00
Behavioral Average (Subordinate)
.21 .08 .15 1.00
CTS Behavioral
Average (Self) Behavioral Average (Peer)
Behavioral Average (Supervisor)
Behavioral Average (Subordinate)
Behavioral Average (Self)
1.00
Behavioral Average (Peer)
.19 1.00
Behavioral Average (Supervisor)
-.03 .38 1.00
Behavioral Average (Subordinate)
.24 .34 .13 1.00
PSI Behavioral
Average (Self) Behavioral Average (Peer)
Behavioral Average (Supervisor)
Behavioral Average (Subordinate)
Behavioral Average (Self)
1.00
Behavioral Average (Peer)
-.16 1.00
Behavioral Average (Supervisor)
.49 .34 1.00
Behavioral Average (Subordinate)
-.33 .43 .20 1.00
32
INO Behavioral Average (Self)
Behavioral Average (Peer)
Behavioral Average (Supervisor)
Behavioral Average (Subordinate)
Behavioral Average (Self)
1.00
Behavioral Average (Peer)
.04 1.00
Behavioral Average (Supervisor)
-.03 .64** 1.00
Behavioral Average (Subordinate)
.48 .65* .43 1.00
COM Behavioral
Average (Self) Behavioral Average (Peer)
Behavioral Average (Supervisor)
Behavioral Average (Subordinate)
Behavioral Average (Self)
1.00
Behavioral Average (Peer)
.30 1.00
Behavioral Average (Supervisor)
.56* .43 1.00
Behavioral Average (Subordinate)
.30 .64* .51 1.00
DRO Behavioral
Average (Self) Behavioral Average (Peer)
Behavioral Average (Supervisor)
Behavioral Average (Subordinate)
Behavioral Average (Self)
1.00
Behavioral Average (Peer)
-.06 1.00
Behavioral Average (Supervisor)
.26 .72** 1.00
Behavioral Average (Subordinate)
.22 .53* .48 1.00
TFS Behavioral
Average (Self) Behavioral Average (Peer)
Behavioral Average (Supervisor)
Behavioral Average (Subordinate)
Behavioral Average (Self)
1.00
Behavioral Average (Peer)
.15 1.00
33

Behavioral Average (Supervisor)
.31 .64** 1.00
Behavioral Average (Subordinate)
-.05 .50 .37 1.00
INE Behavioral
Average (Self) Behavioral Average (Peer)
Behavioral Average (Supervisor)
Behavioral Average (Subordinate)
Behavioral Average (Self)
1.00
Behavioral Average (Peer)
.04 1.00
Behavioral Average (Supervisor)
-.001 .56* 1.00
Behavioral Average (Subordinate)
.06 .17 .32 1.00
Overall Behavioral Average (Self)
Behavioral Average (Peer)
Behavioral Average (Supervisor)
Behavioral Average (Subordinate)
Behavioral Average (Self)
1.00
Behavioral Average (Peer)
.05 1.00
Behavioral Average (Supervisor)
.19 .09 1.00
Behavioral Average (Subordinate)
.04 .51 .39 1.00
Behavioral Average = The average ratings of the behavioral items for that particular dimension. OPV = Organizing/Visioning/Planning; CTS = Consideration/ Team Skills; PSI = Problem Solving/Innovation; INO = Influencing Others, Communication; DRO = Drive/Results Orientation; TFS = Tolerance for Stress; INE = Integrity/Ethics. *p < .05, **p < .01
34

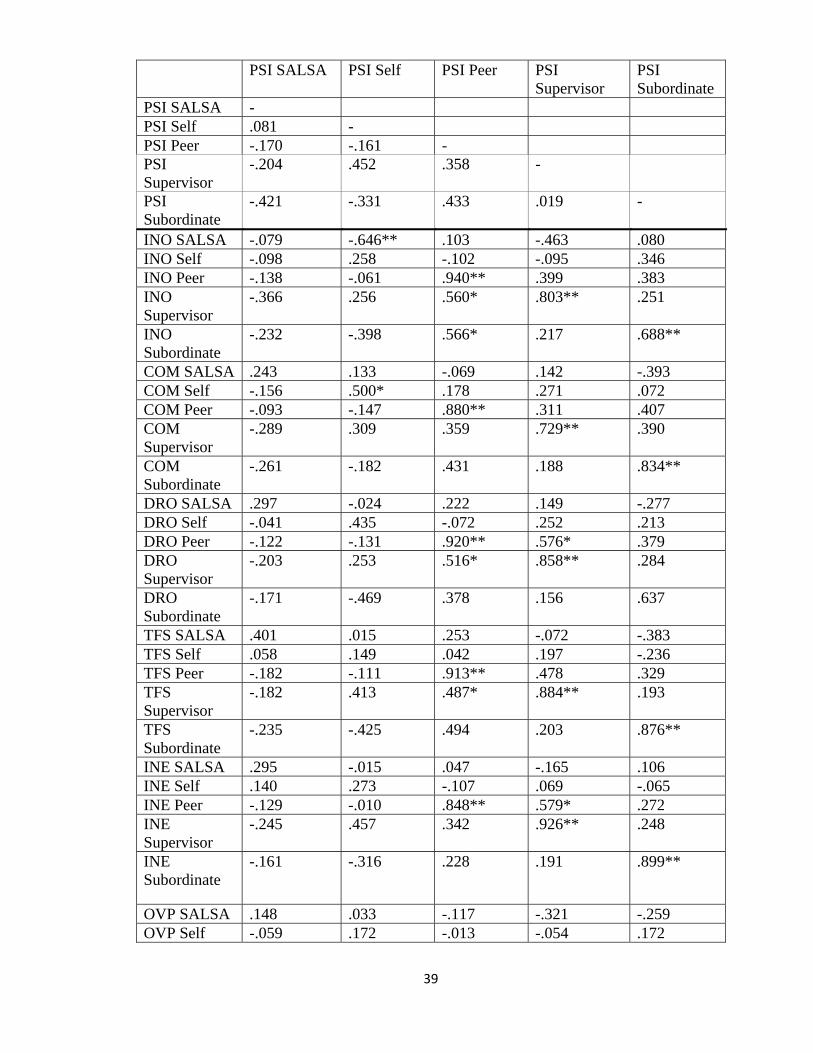
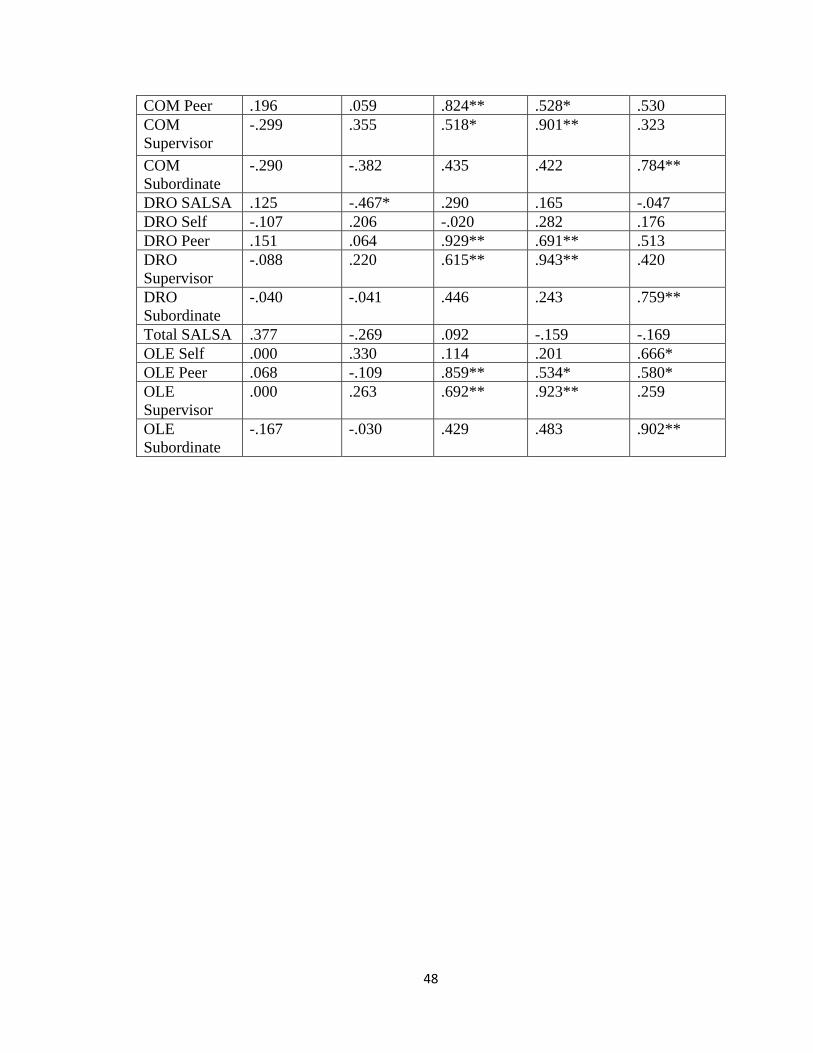
Appendix C
Convergent and discriminant validity from each source for each dimension
OVP SALSA
OVP Self OVP Peer OVP Supervisor
OVP Subordinate
OVP SALSA - OVP Self .053 - OVP Peer -.194 .065 -
OVP Supervisor
-.350 .323 .139 -
OVP Subordinate
-.262 .154 .375 .051 -
CTS SALSA .334 .347 -.151 .186 -.243
CTS Self .130 .656** .054 -.185 .140
CTS Peer -.088 .007 .901** -.067 .338
CTS Supervisor
-.212 .120 .427 .876** .050
CTS Subordinate
-.241 .147 .332 .124 .971**
PSI SALSA .148 -.059 -.067 -.155 -.387
PSI Self .033 .172 -.169 .303 -.414
PSI Peer -.117 -.013 .930** -.017 .396
PSI Supervisor
-.321 -.054 .442 .874** .061
PSI Subordinate
-.259 .172 .405 .049 .956**
INO SALSA .015 -.363 .109 -.626** .086
INO Self -.152 .719** -.041 .349 .304
INO Peer .004 .047 .850** .094 .363
INO Supervisor
.010 .160 .597* .712** .247
INO Subordinate
-.223 .357 .676** .280 .742**
COM SALSA .084 .428 .059 .391 -.350
COM Self .186 .531* .201 .136 .039
COM Peer -.029 .208 .852** .021 .435
35

COM Supervisor
-.096 .314 .440 .765** .410
COM Subordinate
-.058 .374 .411 .247 .851**
DRO SALSA .382 -.207 .132 .089 -.201
DRO Self -.225 .471* .032 .452 .081
DRO Peer -.107 .024 .888** .342 .433
DRO Supervisor
-.202 .088 .599* .878** .278
DRO Subordinate
-.219 .235 .494 .260 .656
TFS SALSA -.080 -.024 .327 -.104 -.362
TFS Self -.291 .404 .214 .032 -.222
TFS Peer .027 .057 .847** .149 .368
TFS Supervisor
-.059 .141 .559* .863** .174
TFS Subordinate
-.236 .299 .570* .181 .908**
INE SALSA .606** -.123 .022 -.281 .182
INE Self .179 .775** -.049 .441 -.025
INE Peer -.104 .024 .817** .352 .238
INE Supervisor
-.360 -.088 .437 .776** .249
INE Subordinate
-.220 .206 .249 .255 .904**
Total SALSA .657** .006 .028 -.179 -.389
OLE Self -.069 .757** .165 .177 .629*
OLE Peer -.117 -.043 .771** .231 .505
OLE Supervisor
-.164 -.004 .665** .838** -.002
OLE Subordinate
-.205 .228 .461 .335 .845**
36

CTS SALSA CTS Self CTS Peer CTS Supervisor
CTS Subordinate
CTS SALSA -
CTS Self .144 -
CTS Peer -.081 .186 -
CTS Supervisor
-.182 -.025 .384 -
CTS Subordinate
-.292 .242 .337 .126 -
PSI SALSA -.038 -.230 -.052 -.113 -.393
PSI Self -.174 .122 -.101 .443 -.379
PSI Peer -.099 .002 .862** .302 .330
PSI Supervisor
-.316 -.190 .332 .896** .164
PSI Subordinate
-.066 .137 .400 .051 .902**
INO SALSA .100 .020 .129 -.387 -.016
INO Self .055 .383 -.001 .101 .308
INO Peer -.043 -.053 .810* .425 .298
INO Supervisor
.021 .135 .551* .857** .320
INO Subordinate
-.231 .012 .579* .406 .735**
COM SALSA .095 .034 -.077 .085 -.319
COM Self -.001 .653** .237 .441 .126
COM Peer -.149 .114 .727** .374 .407
COM Supervisor
-.075 .287 .430 .865** .503
COM Subordinate
-.173 -.016 .308 .376 .820**
DRO SALSA .275 -.425 .100 .084 -.206
DRO Self .174 .135 .106 .388 .062
DRO Peer -.198 -.071 .798** .575* .400
37

DRO Supervisor
-.176 -.081 .494* .887** .278
DRO Subordinate
-.010 -.367 .303 .279 .518
TFS SALSA -.174 -.227 .136 -.227 -.416
TFS Self -.164 .560* .259 .346 -.239
TFS Peer -.066 .068 .861** .473 .332
TFS Supervisor
-.134 .062 .508 .932** .249
TFS Subordinate
-.009 .086 .482 .186 .859**
INE SALSA .083 -.054 .194 -.169 .240
INE Self .455 .504* .019 .211 .074
INE Peer -.170 .098 .779** .556 .236
INE Supervisor
-.283 -.074 .395 .934** .372
INE Subordinate
-.101 -.048 .158 .215 .846**
OVP SALSA .334 .130 -.088 -.212 -.241
OVP Self .347 .656** .007 .120 .147
OVP Peer -.151 .054 .901** .427 .332
OVP Supervisor
.186 -.185 -.067 .876** .124
OVP Subordinate
.243 .140 .338 .050 .971**
Total SALSA .476* -.178 .046 -.251 -.408
OLE Self .054 .518* .011 .165 .542
OLE Peer -.016 -.206 .759** .430 .467
OLE Supervisor
-.236 -.191 .563* .929** .018
OLE Subordinate
-.160 -.110 .324 .549 .800**
38
39
PSI SALSA PSI Self PSI Peer PSI Supervisor
PSI Subordinate
PSI SALSA - PSI Self .081 - PSI Peer -.170 -.161 - PSI Supervisor
-.204 .452 .358 -
PSI Subordinate
-.421 -.331 .433 .019 -
INO SALSA -.079 -.646** .103 -.463 .080 INO Self -.098 .258 -.102 -.095 .346 INO Peer -.138 -.061 .940** .399 .383 INO Supervisor
-.366 .256 .560* .803** .251
INO Subordinate
-.232 -.398 .566* .217 .688**
COM SALSA .243 .133 -.069 .142 -.393 COM Self -.156 .500* .178 .271 .072 COM Peer -.093 -.147 .880** .311 .407 COM Supervisor
-.289 .309 .359 .729** .390
COM Subordinate
-.261 -.182 .431 .188 .834**
DRO SALSA .297 -.024 .222 .149 -.277 DRO Self -.041 .435 -.072 .252 .213 DRO Peer -.122 -.131 .920** .576* .379 DRO Supervisor
-.203 .253 .516* .858** .284
DRO Subordinate
-.171 -.469 .378 .156 .637
TFS SALSA .401 .015 .253 -.072 -.383 TFS Self .058 .149 .042 .197 -.236 TFS Peer -.182 -.111 .913** .478 .329 TFS Supervisor
-.182 .413 .487* .884** .193
TFS Subordinate
-.235 -.425 .494 .203 .876**
INE SALSA .295 -.015 .047 -.165 .106 INE Self .140 .273 -.107 .069 -.065 INE Peer -.129 -.010 .848** .579* .272 INE Supervisor
-.245 .457 .342 .926** .248
INE Subordinate
-.161 -.316 .228 .191 .899**
OVP SALSA .148 .033 -.117 -.321 -.259 OVP Self -.059 .172 -.013 -.054 .172

OVP Peer -.06 -.169 .930** .442 .405 OVP Supervisor
-.155 .303 -.017 .874** .049
OVP Subordinate
-.387 -.414 .396 .061 .956**
CTS SALSA -.038 -.174 -.099 -.316 -.066 CTS Self -.230 .122 .002 -.190 .137 CTS Peer -.052 -.101 .862** .332 .400 CTS Supervisor
-.113 .443 .302 .896** .051
CTS Subordinate
-.393 -.379 .330 .164 .902**
Total SALSA .556** -.107 .028 -.297 -.417 OLE Self -.174 .046 .108 -.011 .623* OLE Peer .025 -.258 .852** .402 .482 OLE Supervisor
-.148 .407 .581* .920** .059
OLE Subordinate
-.064 -.504 .341 .305 .763**
40
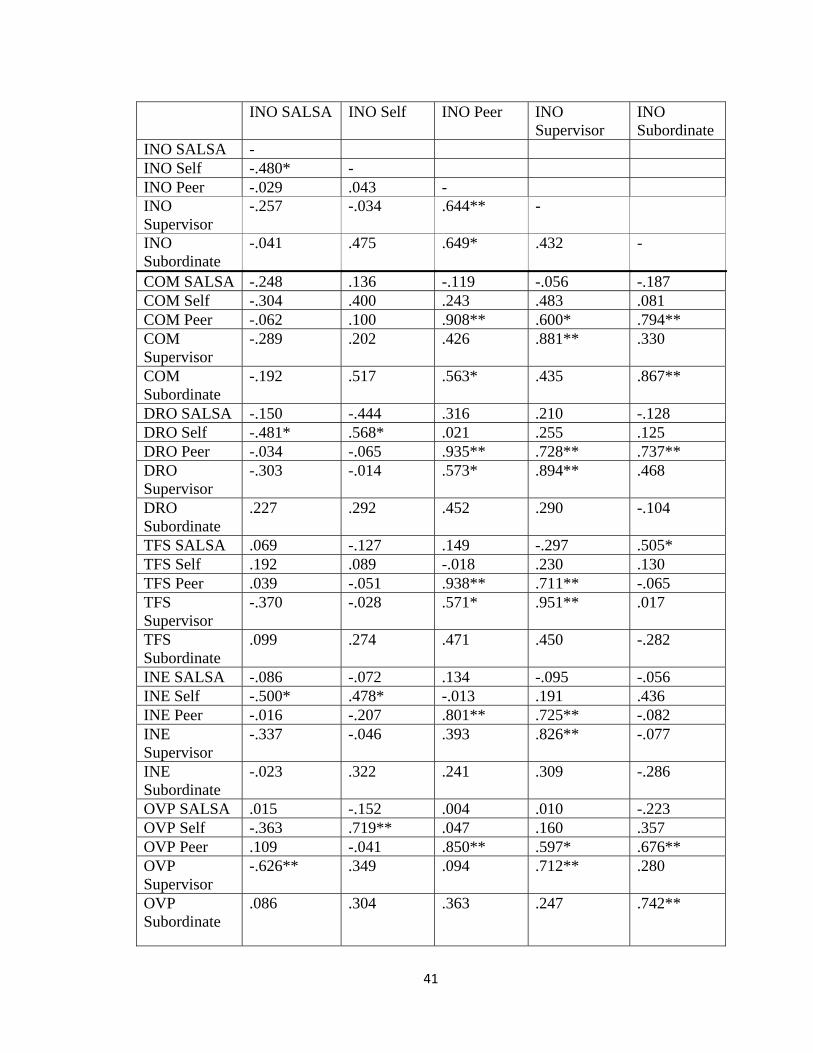
INO SALSA INO Self INO Peer INO Supervisor
INO Subordinate
INO SALSA - INO Self -.480* - INO Peer -.029 .043 - INO Supervisor
-.257 -.034 .644** -
INO Subordinate
-.041 .475 .649* .432 -
COM SALSA -.248 .136 -.119 -.056 -.187 COM Self -.304 .400 .243 .483 .081 COM Peer -.062 .100 .908** .600* .794** COM Supervisor
-.289 .202 .426 .881** .330
COM Subordinate
-.192 .517 .563* .435 .867**
DRO SALSA -.150 -.444 .316 .210 -.128 DRO Self -.481* .568* .021 .255 .125 DRO Peer -.034 -.065 .935** .728** .737** DRO Supervisor
-.303 -.014 .573* .894** .468
DRO Subordinate
.227 .292 .452 .290 -.104
TFS SALSA .069 -.127 .149 -.297 .505* TFS Self .192 .089 -.018 .230 .130 TFS Peer .039 -.051 .938** .711** -.065 TFS Supervisor
-.370 -.028 .571* .951** .017
TFS Subordinate
.099 .274 .471 .450 -.282
INE SALSA -.086 -.072 .134 -.095 -.056 INE Self -.500* .478* -.013 .191 .436 INE Peer -.016 -.207 .801** .725** -.082 INE Supervisor
-.337 -.046 .393 .826** -.077
INE Subordinate
-.023 .322 .241 .309 -.286
OVP SALSA .015 -.152 .004 .010 -.223 OVP Self -.363 .719** .047 .160 .357 OVP Peer .109 -.041 .850** .597* .676** OVP Supervisor
-.626** .349 .094 .712** .280
OVP Subordinate
.086 .304 .363 .247 .742**
41

CTS SALSA .100 .055 -.043 .021 -.231 CTS Self .020 .383 -.053 .135 .012 CTS Peer .129 -.001 .810** .551* .579* CTS Supervisor
-.387 .101 .425 .857** .406
CTS Subordinate
-.016 .308 .298 .320 .735**
PSI SALSA -.079 -.098 -.138 -.366 -.232 PSI Self -.646** .258 -.061 .256 -.398 PSI Peer .103 -.102 .940 .560* .566* PSI Supervisor
-.463 -.095 .399 .803** .217
PSI Subordinate
.080 .346 .383 .251 .688**
Total SALSA .062 -.310 .083 -.155 .371 OLE Self -.093 .565* .152 .192 .094 OLE Peer -.037 .004 .903** .557* -.150 OLE Supervisor
-.389 -.022 .644 .857** .121
OLE Subordinate
.120 .293 .430 .507 -.171
42

COM
SALSA COM Self COM Peer COM
Supervisor COM Subordinate
COM SALSA - COM Self .288 - COM Peer -.088 .296 - COM Supervisor
.078 .557* .428 -
COM Subordinate
-.214 .298 .641* .517 -
DRO SALSA .117 -.228 .212 -.058 -.016 DRO Self .341 .309 -.054 .371 .215 DRO Peer .000 .226 .898** .565* .601* DRO Supervisor
.036 .265 .545 .887** .439
DRO Subordinate
-.104 -.316 .431 .289 .665
TFS SALSA .505* -.221 .196 -.299 -.290 TFS Self .130 .352 .059 .355 -.382 TFS Peer -.065 .233 .824** .518* .435 TFS Supervisor
.017 .461 .528* .901** .422
TFS Subordinate
-.282 -.021 .530 .323 .784**
INE SALSA -.056 -.115 .048 -.225 .256 INE Self .436 .373 .054 .349 .147 INE Peer -.082 .249 .764** .625** .289 INE Supervisor
-.077 .397 .314 .787** .371
INE Subordinate
-.286 -.050 .270 .536 .765**
OVP SALSA .084 .186 -.029 -.096 -.058 OVP Self .428 .531 .208 .314 .374 OVP Peer .059 .201 .852** .440 .411 OVP Supervisor
.391 .136 .021 .765** .247
OVP Subordinate
-.350 .039 .435 .410 .851**
CTS SALSA .095 -.001 -.149 -.075 -.173 CTS Self .034 .653** .114 .287 -.016 CTS Peer -.077 .237 .727** .430 .308 CTS Supervisor
.085 .441 .374 .865** .376
CTS Subordinate
-.319 .126 .407 .503 .820**
PSI SALSA .243 -.156 -.093 -.289 -.261 PSI Self .133 .500* -.147 .309 -.182 PSI Peer -.069 .178 .880** .359 .431
43

PSI Supervisor
.142 .271 .311 .729** .188
PSI Subordinate
-.393 .072 .407 .390 .834**
INO SALSA -.248 -.304 -062 -.289 -.192 INO Self .136 .400 .100 .202 .517 INO Peer -.119 .243 .908* .426 .563* INO Supervisor
-.056 .483 .600* .881** .435
INO Subordinate
-.187 .081 .794** .330 .867**
Total SALSA .371 -.139 .015 -.301 -.213 OLE Self .094 .412 .340 .377 .716** OLE Peer -.150 .013 .810** .386 .628* OLE Supervisor
.121 .314 .552* .747** .354
OLE Subordinate
-.171 -.028 .512 .537 .832**
44

DRO
SALSA DRO Self DRO Peer DRO
Supervisor DRO Subordinate
DRO SALSA - DRO Self -.041 - DRO Peer .327 -.057 - DRO Supervisor
.119 .262 .716 -
DRO Subordinate
.035 .218 .534 .478 -
TFS SALSA .125 -.107 .151 -.088 -.040 TFS Self -.467 .206 .064 .220 -.041 TFS Peer .290 -.020 .929 .615 .446 TFS Supervisor
.165 .282 .691 .943 .243
TFS Subordinate
-.047 .176 .513 .420 .759
INE SALSA .472 -.129 .052 -.191 .030 INE Self .195 .430 -.011 .128 -.124 INE Peer .145 -.151 .880 .713 .177 INE Supervisor
.010 .321 .541 .830 .156
INE Subordinate
-.092 .252 .293 .411 .704
OVP SALSA .382 -.225 -.107 -.202 .219 OVP Self -.207 .471 .024 .088 .235 OVP Peer .132 .032 .88 .599 .494 OVP Supervisor
.089 .452 .342 .878 .260
OVP Subordinate
-.201 .081 .433 .278 .656
CTS SALSA .275 .174 -.198 -.176 -.01 CTS Self -.425 .135 -.071 -.081 -.367 CTS Peer .100 .106 .798 .494 .303 CTS Supervisor
.084 .388 .575 .887 .279
CTS Subordinate
-.206 .062 .400 .278 .518
PSI SALSA .297 -.041 -.122 .203 -.171 PSI Self -.024 .435 -.131 .253 -.469 PSI Peer .222 -.072 .920 .516 .378 PSI Supervisor
.149 .252 .576 .858 .156
PSI Subordinate
-.277 .213 .379 .284 .637
INO SALSA .150 -.481 -.034 -.303 .227 INO Self -.444 .568 -.065 .014 .292 INO Peer .316 .021 .935 .573 .452
45

INO Supervisor
.210 .255 .728 .894 .290
INO Subordinate
-.128 .125 .737 .468 .694
COM SALSA .117 .341 .000 .036 -.104 COM Self -.228 .309 .226 .265 -.316 COM Peer .212 -.054 .898 .545 .431 COM Supervisor
-.058 .371 .565 .887 .289
COM Subordinate
-.016 .215 .601 .439 .665
Total SALSA .749 -.099 .023 -.235 -.078 OLE Self -.202 .240 .156 .194 .601 OLE Peer .373 -.051 .897 .568 .522 OLE Supervisor
.198 .326 .771 .896 .350
OLE Subordinate
-.022 .115 .531 .528 .834
46

47
TFS SALSA TFS Self TFS Peer TFS Supervisor
TFS Subordinate
TFS SALSA - TFS Self .052 - TFS Peer .120 .152 - TFS Supervisor
-.193 .311 .642** -
TFS Subordinate
-.206 -.045 .500 .370 -
INE SALSA .068 -.321 .182 -.054 .263 INE Self .018 .182 .060 .224 .061 INE Peer .112 .260 .875** .729** .308 INE Supervisor
-.301 .262 .434 .884 .312
INE Subordinate
.765** -.213 .223 .345 .870**
OVP SALSA -.080 -.291 .027 -.059 -.236 OVP Self -.024 .404 .057 .141 .299 OVP Peer .327 .214 .847** .559* .570* OVP Supervisor
-.104 .032 .149 .863** .181
OVP Subordinate
-.362 -.222 .368 .174 .908**
CTS SALSA -.174 -.164 -.066 -.134 -.009 CTS Self -.227 .560* .068 .062 .086 CTS Peer .136 .259 .861** .508* .482 CTS Supervisor
-.227 .346 .473 .932** .186
CTS Subordinate
-.416 -.239 .332 .249 .859**
PSI SALSA .401 .058 -.182 -.182 -.235 PSI Self .015 .149 -.111 .413 -.425 PSI Peer .53 .042 .913** .487* .494 PSI Supervisor
-.072 .197 .478 .884** .203
PSI Subordinate
-.383 -.236 .239 .193 .876**
INO SALSA .069 .192 .039 -.370 .099 INO Self -.127 .089 -.051 -.028 .274 INO Peer .149 -.018 .938** .571* .471 INO Supervisor
-.297 .230 .711** .951** .450
INO Subordinate
-.052 -.099 .605 .363 .779
COM SALSA .505* .130 -.065 .017 -.282 COM Self -.221 .352 .233 .461 -.021
COM Peer .196 .059 .824** .528* .530 COM Supervisor
-.299 .355 .518* .901** .323
COM Subordinate
-.290 -.382 .435 .422 .784**
DRO SALSA .125 -.467* .290 .165 -.047 DRO Self -.107 .206 -.020 .282 .176 DRO Peer .151 .064 .929** .691** .513 DRO Supervisor
-.088 .220 .615** .943** .420
DRO Subordinate
-.040 -.041 .446 .243 .759**
Total SALSA .377 -.269 .092 -.159 -.169 OLE Self .000 .330 .114 .201 .666* OLE Peer .068 -.109 .859** .534* .580* OLE Supervisor
.000 .263 .692** .923** .259
OLE Subordinate
-.167 -.030 .429 .483 .902**
48

INE SALSA INE Self INE Peer INE Supervisor
INE Subordinate
INE SALSA - INE Self .236 - INE Peer -.048 .037 - INE Supervisor
-.247 -.001 .560 -
INE Subordinate
.113 .064 .168 .322 -
OVP SALSA .606 .179 -.104 -.360 -.220 OVP Self -.123 .775** .024 -.088 .206 OVP Peer .022 -.049 .817** .437 .249 OVP Supervisor
-.281 .441 .352 .776** .255
OVP Subordinate
.182 -.025 .238 .249 .904**
CTS SALSA .083 .455 -.170 -.283 -.101 CTS Self -.054 .504* .098 -.074 -.048 CTS Peer .194 .019 .779** .395 .158 CTS Supervisor
-.169 .211 .556* .934** .215
CTS Subordinate
.240 .074 .236 .372 .846**
PSI SALSA .295 .140 -.129 -.245 -.161 PSI Self -.015 .273 -.010 .457 -.316 PSI Peer .047 -.107 .848** .342 .228 PSI Supervisor
-.165 .069 .579* .926** .191
PSI Subordinate
.106 -.065 .272 .248 .899**
INO SALSA -.086 -.500* -.016 -.337 -.023 INO Self -.072 .478* -.207 -.046 .322 INO Peer .134 -.013 .801** .393 .241 INO Supervisor
-.095 .191 .725** .826** .309
INO Subordinate
.195 .076 .451 .353 .584
COM SALSA -.056 .436 -.082 -.077 -.286 COM Self -.115 .373 .249 .397 -.050 COM Peer .048 .054 .764** .314 .270 COM Supervisor
-.225 .349 .625** .787** .536
COM Subordinate
.256 .147 .289 .371 .765**
DRO SALSA .472* .195 .145 .010 -.092 DRO Self -.129 .430 -.152 .321 .252 DRO Peer .052 -.011 .880** .541* .293
49

OPV = Organizing/Visioning/Planning; CTS = Consideration/ Team Skills; PSI = Problem Solving/Innovation; INO = Influencing Others, Communication; DRO = Drive/Results Orientation; TFS = Tolerance for Stress; INE = Integrity/Ethics. *p < .05, **p < .01
DRO Supervisor
-.191 .128 .713** .830** .441
DRO Subordinate
.030 -.124 .177 .156 .704**
TFS SALSA .068 .018 .112 -.301 -.371 TFS Self -.321 .182 .260 .262 -.213 TFS Peer .182 .060 .875** .434 .223 TFS Supervisor
-.054 .224 .729** .884** .345
TFS Subordinate
.263 .061 .308 .312 .870**
Total SALSA .628** .323 -.068 -.446 -.268 OLE Self -.068 .504* .091 .012 .606* OLE Peer .199 .025 .760** .392 .418 OLE Supervisor
-.044 .059 .743** .910** .146
OLE Subordinate
.145 -.002 .498 .498 .840**
50

Appendix D
Results for Self-Ratings (overall average) Compared to Peer, Supervisor, and Subordinate Ratings for 8 Dimensions of Leadership Dimension N SD t df sig.
OVPS 14 3.93 .47 ‐1.91 13 .077 OVP Peeravg 14 4.36 .66
OVPS 13 4.00 .58 .145 12 .887 OVP Supavg 13 3.95 1.02
OVPS 11 4.09 .54 ‐2.20 10 .052 OPV Subavg 11 4.50 .43
CTSS 18 3.94 .87 ‐1.86 17 .252 CTSPeeravg 18 4.20 .61
CTSS 15 3.87 .92 ‐.954 14 .356 CTS Supavg 15 4.12 1.08
CTSS 12 4.00 .74 ‐1.70 11 .116 CTS Subavg 12 4.43 .60
PSIS 18 4.17 .62 ‐.691 17 .499 PSI Peeravg 18 4.31 .52
PSIS 15 4.13 .52 .135 14 .894 PSI Supavg 15 4.10 1.05
PSIS 13 4.08 .64 ‐.81 12 .436 PSI Subavg 13 4.29 .51
INOS 18 4.00 .69 ‐1.24 17 .232 INO Peeravg 18 4.23 .61
INOS 14 4.07 .62 .127 13 .901 INO Supavg 14 4.04 .78
INOS 13 4.00 .71 ‐2.71 12 .019 INO Subavg 13 4.49 .60
COMS 18 4.22 .65 ‐.90 17 .382 COM Peeravg 18 4.37 .48
COMS 15 4.13 .64 ‐1.15 14 .268 COM Supavg 15 4.32 .59
COMS 12 4.25 .62 ‐1.52 11 .156 COM Subavg 12 4.56 .58
DROS 18 4.11 .68 ‐1.24 17 .231 DRO Peeravg 18 4.37 .69
DROS 15 4.27 .59 ‐.434 14 .671 DRO Supavg 15 4.36 .76
51

DROS 13 4.31 .69 ‐1.21 12 .249 DRO Subavg 13 4.51 .42
TFSS 17 3.94 .83 ‐1.54 16 .143 TFS Peeravg 17 4.27 .54
TFS 15 3.93 .88 ‐.312 14 .168 TFS Supavg 15 4.03 1.10
TFSS 11 4.18 .75 ‐1.485 10 .168 TFS Subavg 11 4.48 .34
INES 17 4.47 .62 ‐.752 16 .463 INE Peeravg 17 4.60 .50
INES 14 4.57 .65 .777 13 .451 INE Supavg 14 4.36 .82
INES 12 4.58 .51 ‐.039 11 .970 INE Subavg 12 4.59 .61
The top row for each pair indicates overall self ratings (S) for that particular dimension of the rating form. The bottom row for each pair indicates the overall rating given for that particular dimension of the rating form and the specific source. Peeravg = Peer average; Supavg = Supervisor average; Subavg = Subordinate average. OVP = Organizing/Visioning/Planning; CTS = Consideration/ Team Skills; PSI = Problem Solving/Innovation; INO = Influencing Others, Communication; DRO = Drive/Results Orientation; TFS = Tolerance for Stress; INE = Integrity/Ethics. Bolded numbers represent significant differences.
52

Appendix E
Results for Self-Ratings (behavioral average) Compared to Peer, Supervisor, and Subordinate Ratings for 8 Dime sions of Leadership n
Dimension N SD t df sig. OVPS behavg 17 3.96 .45 ‐1.57 16 .135 OVP Peeravg 17 4.28 .65
OVPS behavg
15 4.05 .50 ‐.150 14 .883
OVP Supavg 15 4.09 1.02
OVPS behavg
13 4.05 .34 ‐2.69 12 .012
OVP Subavg 13 4.44 .42 CTSS behavg 18 3.86 .61 ‐1.80 17 .090
CTSPeeravg 18 4.20 .61 CTSS behavg 15 3.88 .67 ‐.972 14 .347 CTS Supavg 15 4.19 1.08
CTSS behavg 12 3.97 .53 ‐2.14 11 .055 CTS Subavg 12 4.43 .60
PSIS behavg 18 4.13 .39 ‐1.10 17 .287 PSI Peeravg 18 4.31 .52
PSIS behavg 15 4.10 .36 .010 14 .992
PSI Supavg 15 4.09 1.05
PSIS behavg 13 4.12 .44 ‐.749 12 .468 PSI Subavg 13 4.29 .51
INOS behavg 17 4.07 .44 ‐.793 16 .440 INO Peeravg 17 4.22 .62
INOS behavg 14 4.14 .41 .423 13 .679 INO Supavg 14 4.04 .78 INOS behavg 13 4.08 .46 ‐2.42 12 .032
INO Subavg 13 4.49 .60
COMS behavg
18 4.18 .39 ‐1.55 17 .141
COM Peeravg
18 4.36 .48
COMS behavg
15 4.17 .43 ‐1.22 14 .243
COM Supavg
15 4.32 .59
53

COMS behavg
15 4.27 .36 ‐1.66 11 .126
COM Subavg 15 4.56 .58
DROS behavg
18 4.00 .45 ‐1.94 17 .069
DRO Peeravg 18 4.37 .69 DROS behavg
15 4.05 .44 ‐1.48 14 .159
DRO Supavg 15 4.36 .76 DROS behavg 13 4.10 .46 ‐2.96 12 .012 DRO Subavg 13 4.51 .42 TFSS behavg 18 3.90 .75 ‐1.86 17 .080 TFS Peeravg 18 4.26 .53
TFS behavg 15 3.92 .81 ‐.391 14 .701
TFS Supavg 15 4.03 1.10
TFSS behavg 12 4.21 .52 ‐.681 11 .510 TFS Subavg 12 4.35 .53 INES behavg 18 4.42 .46 ‐1.27 17 .222 INE Peeravg 18 4.61 .49 INES behavg 15 4.43 .50 .406 14 .691 INE Supavg 15 4.33 .80 INES behavg 13 4.47 .38 ‐.386 12 .706 INE Subavg 13 4.54 .61
The top row for each pair indicates self ratings (S) that were calculated by averaging the ratings of the behavioral items for that particular dimension of the rating form. The bottom row for each pair indicates the overall rating given for that particular dimension of the rating form and the specific source. Peeravg = Peer average; Supavg = Supervisor average; Subavg = Subordinate average. OVP = Organizing/Visioning/Planning; CTS = Consideration/ Team Skills; PSI = Problem Solving/Innovation; INO = Influencing Others, Communication; DRO = Drive/Results Orientation; TFS = Tolerance for Stress; INE = Integrity/Ethics. Bolded numbers represent significant differences.
54