Embed Size (px)
Citation preview

Eastern Kentucky UniversityEncompass
Online Theses and Dissertations Student Scholarship
January 2016
An evaluation of the college readiness of graduatingEnglish language learners in Utah public schools.Lizette L. RogersEastern Kentucky University
Follow this and additional works at: https://encompass.eku.edu/etd
Part of the Educational Assessment, Evaluation, and Research Commons, and the Elementaryand Middle and Secondary Education Administration Commons
This Open Access Dissertation is brought to you for free and open access by the Student Scholarship at Encompass. It has been accepted for inclusionin Online Theses and Dissertations by an authorized administrator of Encompass. For more information, please contact [email protected].
Recommended CitationRogers, Lizette L., "An evaluation of the college readiness of graduating English language learners in Utah public schools." (2016).Online Theses and Dissertations. 420.https://encompass.eku.edu/etd/420


AN EVALUATION OF THE COLLEGE READINESS OF GRADUATING ENGLISH
LANGUAGE LEARNERS IN UTAH PUBLIC SCHOOLS
By
LIZETTE L. ROGERS
Master of Arts, Education/Elementary Teacher Education
University of Phoenix
Las Vegas, NV
2003
Bachelor of Arts, Communication
Florida Atlantic University
Boca Raton, FL
1995
Submitted to the Faculty of the Graduate School
Eastern Kentucky University
in partial fulfillment of the requirements
for the degree of
DOCTOR OF EDUCATION
December, 2016

ii
Copyright © Lizette L. Rogers, 2016
All rights reserved

iii
DEDICATION
This thesis is dedicated to husband, John Rogers, and my children Trevor, Brandon, and
Sean, for their unwavering support.

iv
ACKNOWLEDGEMENTS
This dissertation would not be possible without the support of my Advisor and
Dissertation Chair, Dr. Charles Hausman. Thank you for your guidance, patience, and
support. I would also like to thank the other committee members, Dr. James Bliss, Dr.
Deborah West and Dr. Thomas Shelton, for their support and assistance in this process.
I would like to express my thanks to my husband John, for his understanding and
patience during those times when I was less than rational. He encouraged me to keep
“pressing forward.” I would like to thank my sons, Trevor, Brandon, and Sean, for
understanding my need to work; sorry I missed so many movies.
I would like to thank my mom, Laura King, for always believing I would meet a
goal I spoke of so very long ago. Thank you to Tara Isaacs and Darlene Spurlock; we did
it!! Thank you to Stephanie Sheridan for her encouragement and friendship—you are
next! Finally, a thank you to family and friends who played a role by taking something
off my plate because you knew how full it was.

v
ABSTRACT
The linguistic diversity that began with immigration in the early 20th century
continues today. The impact of this growing population is directly affecting the economy
and workforce in our nation. This dissertation focused on the college readiness of
graduating English language learner (ELL) students in one western mountain state. The
variables of gender, language proficiency levels, and free or reduced lunch status were
studied, seeking to understand if those variables were independent of ELL students being
college ready. Descriptive statistics were used to analyze the ACT test scores for 668
English language learner graduates. A Chi-Square test for independence was also used to
determine the level independence among the variables and college readiness. After
analyzing the ACT scores, it was evident that many ELL graduates were not college
ready at graduation. The variables of gender, language proficiency, and free or reduced
lunch status statistically impact college readiness. However, the variable of gender had
the least impact on college readiness status for ELL graduates. The study concluded with
the recommendations for policies and practices that may better prepare the ELL student
for college.
vi
TABLE OF CONTENTS
CHAPTER PAGE
I. INTRODUCTION………………..……………………………….......... 1
Statement of Problem…………………………………………………… 2
Purpose …………………………………………………………………. 6
Research Question……………………………………………………… 6
Conceptual Framework…………………………………………………. 7
Significance of the Study………………………………………………. 9
II. REVIEW OF THE LITERATURE…………………….………………. 10
Purpose………………………………………………………………….. 10
Demographics of the English Language Learner………………………. 10
Historical Background of ELL Students in America…………… 11
Legislative Impact on English Language Learners……………... 11
Language Development Theory………………………………………… 13
Chomsky’s Language Acquisition Theory……………………... 14
Krashen’s Language Acquisition Theory………………………. 14
Second Language Acquisition………………………………….. 15
Linguistic Capital Theory………………………………………. 16
Culturally Responsive Teaching Theory……………………….. 17
Analysis of College Readiness…………………………………………. 19
ACT Standards for College Readiness…………………………. 21
ACT College Readiness Benchmark…………………………… 22
College Readiness Barriers and English Language Learners…………... 22
Gender…………………………………………………………... 26
Language Proficiency Level……………………………………. 27
Bilingual Student Academic Placement………………………... 29
On Track Indicators…………………………………………….. 31
Equitable Curriculum…………………………………………… 32
Language Complexity in Assessments…………………………. 34
Academic and Linguistic Identification in English Language
Learners…………………………………………………………
35
Reclassification to Fluent English Proficient…………………… 37
Teacher Effectiveness…………………………………………... 38
Parental Involvement…………………………..……………….. 40
Socioeconomic/Poverty………………………………………… 40
Conclusion……………………………………………………………… 42

vii
III. METHODOLOGY....……………………………………………........... 44
Research Questions……………………………………………………... 44
Participants……………………………………………………………… 44
Setting…………………………………………………………………... 46
Variables and Measures………………………………………………… 47
Language Proficiency Assessment……………………………... 47
ACCESS for English Language Learners Assessment…………. 49
Scale Scores for ACCESS for ELLs……………………………. 50
Proficiency Scores for ACCESS for ELLs……………………... 51
American College Testing (ACT)……………………………… 51
Data Collection and Analysis…………………………………………... 53
Limitations……………………………………………………………… 53
IV. OVERVIEW OF FINDINGS..…………………………………………. 56
Participants……………………………………………………………… 56
College Readiness Percentage of English Language Learners…………. 57
Research Question One…………………………………………. 57
Research Question Two………………………………………… 63
Research Question Three……………………………………….. 68
Research Question Four………………………………………… 82
Synopsis of English Language Learners and College Readiness………. 86
V. CONCLUSIONS AND DISCUSSION………………………………… 88
Purpose of the Study……………………………………………………. 88
Summary of Findings…………………………………………………… 89
English Learners and College Readiness……………………….. 89
Gender and College Readiness…………………………………. 90
Language Proficiency and College Readiness………………….. 91
Free or Reduced Lunch and College Readiness………………... 93
Implications for Future Practice and Policy……………………………. 94
Language Acquisition…………………………………………... 96
Academic Placement……………………………………………. 97
Language Endorsement………………………………………… 97
Academic Testing Bias…………………………………………. 98
Conclusion……………………………………………………………… 98
REFERENCES……………………………………………………………………. 101

viii
VITA………...……………………………………………………………………. 114

ix
LIST OF TABLES
Table Page
2.1 ACT College Benchmark Scores, 2016 ………………………………. 23
3.1 English Language Proficiency of 2015 Graduates…………………… 45
3.2 English Language Learner Gender……………………………………... 45
3.3 Eligibility for Free or Reduced Lunch…………………………………. 46
3.4 Race or Ethnicity of Graduating English Language Learners………….. 47
3.5 Weighting Used to Calculate Each Composite Scale Score…………… 50
4.1 Mean ACT Scores of English Language Learner Graduates………….. 58
4.2 College Ready in English by English Language Learner……………… 59
4.3 College Ready in Math by English Language Learner………………… 60
4.4 College Ready in Reading by English Language Learner……………... 61
4.5 College Ready in Science by English Language Learner……………… 62
4.6 Number of College Readiness Benchmark Attained in 2014………….. 63
4.7 Chi-Square: College Ready in English of English Learners by Gender.. 64
4.8 Chi-Square: College Ready in Math of English Learners by Gender….. 65
4.9 Chi-Square: College Ready in Reading of English Learners by Gender. 66
4.10 Chi-Square: College Ready in Science of English Learners by Gender.. 67
4.11 Chi-Square: Number of College Ready Benchmarks Attained by
English Learners by Gender…………………………………………….
68
4.12 Mean ACT Scores by English Proficiency Levels for ELL Graduates… 71
4.13 Chi-Square: College Ready English by English Proficiency Level……. 72
4.14 Chi-Square: College Ready Math by English Proficiency Level………. 74
4.15 Chi-Square: College Ready Reading by English Proficiency Level…… 76
4.16 Chi-Square: College Ready Science by English Proficiency Level……. 78
4.17 Chi-Square: Number of College Ready Benchmarks Attained by
English Proficiency Level………………………………………………
80
4.18 Chi-Square: College Ready in English of English Learners by
Free/Reduced Lunch Status……………………………………………..
82

x
4.19 Chi-Square: College Ready in Math of English Learners by
Free/Reduced Lunch Status……………………………………………..
84
4.20 Chi-Square: College Ready in Reading of English Learners by
Free/Reduced Lunch Status……………………………………………..
85
4.21 Chi-Square: College Ready in Science of English Learners by
Free/Reduced Lunch Status……………………………………………..
86

xi
LIST OF FIGURES
Figure Page
1.1 English Language Learners in Utah…………………………………….. 4
2.1 Top 10 Largest Immigrant Groups, 1960 and 2013…………………….. 13
2.2 Conley’s Elements to College Readiness………………………………. 21

COLLEGE READINESS OF GRADUATING ELLs IN UTAH PUBLIC SCHOOLS
1
CHAPTER 1: INTRODUCTION
As test scores reflect, the college readiness of the English language learner (ELL)
is a growing concern with lasting implications. The need of the English language learner
encompasses learning a new language structure and academic subject matter
simultaneously. The greatest need is to educate ELL students in a manner that produces a
student who has the choice to attend college. Passel and Cohn (2008) asserted that “the
Latino population, already the nation’s largest minority group, will triple in size and will
account for most of the nation’s population growth from 2005 through 2050.” Through
trend analysis, Passel and Cohn (2008) found that “Hispanics will make up 29% of the
U.S. population in 2050, compared to 14% in 2005” (p. 1). This growth, while focused on
Hispanics, does not encompass the other English language learners that will also be
present in the United States by 2050. Chinese is the second most common language,
spoken in the home of 4% ELL students, followed by Vietnamese at 4%, and
French/Haitian Creole at 2% in the United States (Ruiz Soto, Hooker, & Batalova, 2015).
New America (n.d.) defines the English language learner as:
An individual who, due to any of the reasons listed below, has sufficient difficulty
speaking, reading, writing, or understanding the English language to be denied the
opportunity to learn successfully in classrooms where the language of instruction
is English or to participate fully in the larger U.S. society. Such an individual (1)
was not born in the United States or has a native language other than English; (2)
comes from environments where a language other than English is dominant; or (3)
is an American Indian or Alaska Native and comes from environments where a
language other than English has had a significant impact on the individual's level

COLLEGE READINESS OF GRADUATING ELLs IN UTAH PUBLIC SCHOOLS
2
of English language proficiency. (English Language Learner/English Learner
section, para. 2)
The category of the English language learners goes by many names such as,
English for Speakers of other Language (ESOL), Limited English Proficient (LEP), or
English as a Second Language (ESL). The fact remains English language learners (ELL)
are an emergent group in the United States. For the purpose of this study, the term
English language learner (ELL) was used when referring to any student whose first
language in not English.
The background of the ELL students is often complex. An ELL student may be a
new comer to the United States, where English was not the primary language. These
students may or may not have had a formal education based on socioeconomic and
political troubles in their home country. The ELL student could also be born in the United
States, but reside in a home where English is not the primary language. In this case, the
student may have some rudimentary English skills, but would be lacking a foundation in
both their native language and English.
Statement of Problem
The issues of college readiness among the English language learner’s (ELL)
population is a growing concern. Shim (2013) stated that “English language learners
(ELLs) is the fastest growing population among the school age group in the nation” (p.
18). Callahan (2005) asserted, “Nearly one in five school age youth speaks a language
other than English in the home” (p. 305). An important concern lies in the readiness of
high school ELL students who will graduate, pursue college and still have little command
of the English language. Despite reforms such as Elementary and Secondary Education

COLLEGE READINESS OF GRADUATING ELLs IN UTAH PUBLIC SCHOOLS
3
Act (ESEA) and No Child Left Behind (NCLB), achievement gaps continue. Gandara
(2008) reported little progress in the college completion of a bachelors, or higher, for
Hispanic students ages 25-29, as compared to White and African Americans. In 1975,
Hispanics had a 9% college completion rate, that number in 2005 was 11.2%. In 1975,
Whites had a 24% college completion rate, that number in 2005 was 34.1%. In 1975,
African Americans had an 11% college completion rate, that number in 2005 was 17.5%
(Gandara, 2008). Large-scale education reform acts are not the only answer to college
readiness for ELLs, but a systematic examination of current practices, pre-service teacher
curriculum, and unbiased assessment language is needed.
The American Dream of a better life and financial freedom may be fading for an
ELL student aspiring to attend college. Currently, ACT College and Career Readiness
(CCRS) scores serve as an indicator for a high school student’s success in college.
According to ACT (2015), college readiness remains a weakness among underserved
groups. Dougherty and Fleming (2012) reported that in states where all eleventh graders
took the ACT in 2010, only 27% of low-income students met college readiness
benchmarks in reading, 16% in mathematics, and 11% in science.
This study focused on the college readiness of ELL high school graduates in Utah.
The framework for this study consisted of examining the 2014 ACT scores for graduating
ELL students. The researcher sorted students into three categories, gender and language
proficiency levels, and free or reduced lunch status. In October 2104, ELL enrollment
was 34,910. In 2015, this number grew to 36,049 (Utah State Office of Education, 2014).
This increase is expected to continue. Learning English skills is an ongoing process for
all students. It would be unrealistic to expect an ELL student to receive a proficient score

COLLEGE READINESS OF GRADUATING ELLs IN UTAH PUBLIC SCHOOLS
4
on standardized tests, without giving consideration to when the student entered an
American school. The 2013 Mathematics Utah State report for 8th grade public schools
reported that “Hispanic students had an average score that was 33 points lower than
White students” (Nation’s Report Card, 2013, p. 1). The 2013 Reading Utah State report
for 8th grade public schools reported that Hispanics had “an average score that was 18
points lower than White students” (Nations Report Card, 2013, p. 1). This gap profoundly
impacts the college readiness of those students who will enter high school. While
classroom interventions are needed, Cho, Rios, Trent, and Mayfield. (2012) stated that
just “being immersed in English in a classroom does not guarantee academic and/or
linguistic success” (p, 74). High school students, particularly, need intensive
interventions and time to reach a passable level of proficiency for testing. The following
chart shows the number of ELL students who received services in 2013-2014 (National
Clearinghouse for English Language Acquisition [NCELA], 2014).
Figure 1.1. English Language Learners in Utah

COLLEGE READINESS OF GRADUATING ELLs IN UTAH PUBLIC SCHOOLS
5
This achievement gap is not unique to urban cities but extends to rural areas.
According to the Utah Foundation (2012), “22.5% of students in Utah were racial or
ethnic minorities” (p. 9). In rural Utah, “16.8% of students were minorities” (p. 8). From
1998 to 2011, the Hispanic or Latino population increased 121% rural areas and 164.5 %
non-rural areas (Utah Foundation, 2012, p. 9). The United States has always been a haven
for refugees escaping persecution. Since the onset of the Syrian Civil War, the United
States has relocated over 2,000 Syrian refugees. The current administration is considering
raising the admission from 85,000 refugees for fiscal year 2015 to 100,000 the next year
(Capps & Fix, 2015). With world tensions high and many seeking asylum in the United
States, it is safe to assume the school-age ELL population will grow. The ages of these
immigrants will vary, but concern over language deficits and the educational needs of
ELLs remains an area of focus.
Purpose
The purpose of this study was to examine the college readiness of graduating
English language learners in one mountain west state. The analysis of data consisted of
descriptive statistics. The collected data reported the mean score, frequencies, and
standard deviation of graduating ELL students, using ACT scores. The data identified
any statistical differences that exist among college readiness in males versus females and
language proficiency levels, and if a student’s free or reduced lunch status impacted
college readiness.
Research Question
This study seeks to answer the following questions:
1. How are English language learner graduates performing in terms of college readiness?

COLLEGE READINESS OF GRADUATING ELLs IN UTAH PUBLIC SCHOOLS
6
2. Are gender and college readiness levels independent of one another for graduating
English language learners?
3. Are language proficiency levels and college readiness levels independent of one
another for graduating English language learner?
4. Is the free or reduced lunch status and college readiness level independent of one
another for graduating English language learners?
The long term ramification of graduating ELLs who are not prepared for college
may have powerful negative economic effects. When a student exits high school with
little command of the English language, job prospects remain low. Nationally, in the
second quarter of 2015, the Latino unemployment rate was 6.6% (Wilson, 2015). Wilson
(2015) reported that one mountain west state’s Hispanic unemployment rate was 5.3%.
“Increasing access to college for Latina/o students is of national concern, in particular for
the Southwest and geographic areas that are experiencing growth in their Latina/o
population” (Yamamura, Martinez, & Saenz, 2010, p. 126). While many studies highlight
Hispanics and Asians, the ELL demographic in Utah is changing. Refugees from the
Middle East and Africa are being relocated to Utah. Currently, 60,000 refugees from
Burma, Iraq, Somalia, and the Congo have been resettled in Utah (Nico, 2016).
The burden falls onto the education system to ensure proper support for all
learners. While educational reforms stay in the forefront of policy, improvements have
not adequately address the needs of students whose are culturally and linguistically
diverse (CDL) at the high school level. To prepare these students for a profitable future,
further examination of current educational strategies for immigrants and second
generation students (children of immigrants) is required. The 21st century classroom

COLLEGE READINESS OF GRADUATING ELLs IN UTAH PUBLIC SCHOOLS
7
cannot mirror the 20th century assembly line education, but must evolve with the
changing demographics and student needs in our society.
Conceptual Framework
The framework for this study consisted of examining the difficulty in language
acquisition, the college readiness of graduating ELL high school students, and barriers to
college readiness for English learners.
Language acquisition requires time and the willingness of the participant. With an
influx of immigrants and second-generation children, whose home language is not
English, attention to theory and practical language strategies demand the attention of
educational policy makers. While ELL curriculum is present and helpful, the amount of
time required for language proficiency to grow is an issue. Further discussion on reform
at the high school level is needed.
Aside from the pedagogical need, there is also the legal requirement mandated by
the Supreme Court's decision in Lau v. Nichols (1974) that classroom instruction must be
meaningful to students even if their English language proficiency is limited. Most
recently, the Every Student Succeeds Act (ESSA), signed in 2015, requires that “all
students in America be taught to high academic standards that will prepare them to
succeed in college and careers.” (U.S. Department of Education, n.d.) Yet, Callahan
(2005) noted that second language studies generally involved educators and students in
grades K-6, with fewer studies in the secondary education. If education is to focus on all
students, then more research on current practices in high school is justified.
College readiness is defined as “the level of preparation a student needs in order
to reenroll and succeed, without remediation, a credit-bearing general education course”

COLLEGE READINESS OF GRADUATING ELLs IN UTAH PUBLIC SCHOOLS
8
(Tierney & Sablan, 2014). While education is often seen as the remedy for societal
inequality, districts continue to see student achievement discrepancies. The children of
many immigrant parents are born in the United States, but enter schools with little or no
English. This phenomenon of being born in a country, where the native language is not
spoken in the home, presents an issue for educators. The ESSA, as did NCLB, offers
preschool to all students, as a measure towards being prepared for schooling. While this
step is in the right direction, if the language is only spoken in school, the student remains
at a deficit in linguistic capital.
This study seeks to determine if gender and language proficiency levels impact
the college readiness of English language learners. The barriers to college readiness are
numerous and will depend on the student ability and motivation to learn. A review of
literature discovered many other obstacles that may impede college readiness. Several are
described in the review of the literature.
Significance of the Study
The significance in examining the college readiness of graduating ELL students is
primarily economic. Students who exit high school are expected to enter the society as
productive members. While not all high school graduates will attend college, attending
college has a positive financial correlation on long-term earnings. Gandara and
Rumberger (2009) reflected that until recently the primary goal was to simply graduate
ELLs from high school. This gave little thought to long range plans and the economic
future of ELLs. The 2011 Census estimated the population in the United States at
291,524,091 people. Individuals that only spoke English was 230,947,071. Therefore,
60,577,020 individuals spoke a language other than English (U.S. Census Bureau, 2015).

COLLEGE READINESS OF GRADUATING ELLs IN UTAH PUBLIC SCHOOLS
9
Currently, the Latino population are an underrepresented racial group in higher
education (Zarate & Burciaga, 2010). Yet, with the influx of refugees, it is safe to assert
that all ethnic groups will be facing the same issues as Hispanics. These ethnic groups,
specifically ELLs, are at risk for future financial success, when language plays a role in
seeking college or careers. Slama (2012) stated that “adolescent ELLs who have not
developed academic language skills to be successful in school are at elevated risk of
dropping out of school before graduation” (p. 266). If true, the trajectory for these
students is one of an unstable future, leading to low paying jobs, potential unsecured
debt, and ultimately a life of poverty.
Cho et al. (2012) maintained that learning English should be a primary need for
children, as it is the “language of power and privilege which is central to opening doors
of opportunities” in the United States (p. 66). No educator disputes that academic English
is central to ELL college readiness, yet many struggle with the proper action in assisting
ELLs in language proficiency. If educational policies and language interventions
programs desire ELLs to be college ready by graduation, more attention to successful
researched based strategies, particularly at the high school level, is warranted. Educators
must be clear on where to focus attention, be able to identify academic gaps, and be
provided with the proper tools to prepare ELLs for their future.

COLLEGE READINESS OF GRADUATING ELLs IN UTAH PUBLIC SCHOOLS
10
CHAPTER 2: REVIEW OF THE LITERATURE
Purpose
The purpose of this chapter is to analyze and report the scholarly literature that
exists regarding the college readiness of English language learner’s (ELL) graduating
from high school. The literature reports the current demographics, educational policies
and their impact on the existing ELL population. Second, the literature reflects on
historical legislation and current initiatives that influence the college readiness of ELL
students. Third, the literature analyzes historical and contemporary academic theories that
support language acquisition. Finally, the literature reviews education practices that may
impact the college readiness graduating seniors.
Demographics of the English Language Learner
The 2015 NCES report on the Condition of Education estimated that there are 4.4
million the English Language Learner (ELL) in U.S. schools (NCES, 2015, p. 48). While
the Latino population remains dominant, other languages are present. According to the
2011 Census report, approximately 60.6 million people over the age of five, or 21% of
the population, speak a language other than English. Of that 21% of the population, the
Census Bureau tabulates that 381 of the world’s 6,500 languages are represented in the
United States (Ryan, 2013). This growth is not limited to Spanish speakers, African
languages saw a 111% growth, along with Asian language growth at 115% (Ryan, 2013).
The American classroom dynamic is rapidly changing, and college readiness for ELL
high school students is currently understudied.
If English language proficiency levels for graduating ELL students does not grow,
then college readiness benchmark scores become unattainable. An adult’s quality of life

COLLEGE READINESS OF GRADUATING ELLs IN UTAH PUBLIC SCHOOLS
11
can be directly linked to one’s earnings. A 2011 U.S. Census report showed that in 2008,
of all individuals 25 years and older 85% had only a high school diploma. Of this same
group, 27% had a bachelor’s degree or higher. Individuals with higher levels of education
are more likely to be employed full-time, year-round. It is understood that the average
earnings of full-time, year-round employment is likely to be higher than part-time work
(Day & Newburger, 2002; Julian & Kominski, 2011). Graduation from high school
coupled with a post-secondary degree is a catalyst for a robust American economy.
Historical Background of ELL Students in America
The history the English language in America dates back to exploration and the
early colonies. However, the field of Teaching English to Speakers of Other Languages
(TESOL) did not become a profession until the 1960s (Gray, 1997). The 1965
Immigration and Naturalization Act (Hart-Celler Act) brought a flood of new comers to
America. Previous quotas were lifted and changes allowed for a population growth (CIS,
1995). From the 1954-1955 school year to the 1965-1966 school year, foreign student
enrollment in American institutions doubled. They went from 34,232 students to 82,045
students—with an annual percentage increase of 9.7% (Gray, 1997). Thus, creating the
demand for educators trained to teach non-English speakers. Subsequently, the
Elementary and Secondary Education Act of 1965, the 1968 Education Professions
Development Act, and the 1968 Bilingual Education Act reinforced the demand for
English language support programs (Gray, 1997)
Legislative Impact on English Language Learners
The mid-twentieth century Civil Rights Act of 1964, which prohibited
discrimination on the bases of race, color, or national origin, established the need for
COLLEGE READINESS OF GRADUATING ELLs IN UTAH PUBLIC SCHOOLS
12
further examination of the education of bilingual students. The Bilingual Education Act
of 1968 and the Elementary and Secondary Education Act (ESEA), Title VII, further
supported the need for equal access to education programs and programs that would
improve English language proficiency. These laws also ensured ELL students were not
incorrectly identified as specials needs because of their lack of English proficiency. The
1960’s immigration reforms forced the educators to rethink how to meet the needs of
culturally and linguistically diverse students beyond teaching how to read.
While the need for improvement continued, Lau v. Nichols (1974) decision did
not specify policy, but rather required districts to take “affirmative steps” towards
providing equal educational opportunities for all students. Until this point, students were
failing, while being provided access the same materials and curriculum, but unable to
understand the language. Equality may not look the same for each student, equal
education is only equal when the students understand the information presented.
Following this case, more legislation reform came about and Title VII of ESEA was
amended to support teacher professional development in language acquisition.
In the years ahead, No Child Left Behind (NCLB) of 2001 required states to focus
on English language proficiency, along with increased accountability. Under NCLB,
student achievement is assessed by grade level and broken into subgroups, such as
ethnicity, disabilities, and English proficiency. Under this law, schools were required to
assess students in English and show grade level proficiency (National Educational
Association [NEA], 2008). Most recently, ESSA (2015), Title III funding is dedicated to
the education of English learners. Under ESSA, ELL students may be excluded for one
year from taking standardize tests and be excluded from the school accountability system.

COLLEGE READINESS OF GRADUATING ELLs IN UTAH PUBLIC SCHOOLS
13
During the ELL students second year of enrollment in a U.S. school, testing
accountability will include growth score. In the third year of school, the second time
testing, proficiency scores on tests will be included in the accountability system.
To gain perspective, researchers estimated that since 1965 about 11.6 million
immigrants have come from Mexico. Another 60% of immigrants during this time came
from Latin American countries as well as Asian countries (Chishti, Hipsman, & Ball,
2015). The face of American’s classroom is comprised of diversity that literally spans the
globe. Figure 2.1 shows the top 10 immigrant groups spanning from the 1960s to present
day.
Figure 2.1. Top 10 Largest Immigrant Groups, 1960 and 2013
Language Development Theory
There are many contributors to the study of second language acquisition.
However, before understanding how a second language is acquired, one should consider
how our first language is developed. Chomsky and Krashen are two leaders in language

COLLEGE READINESS OF GRADUATING ELLs IN UTAH PUBLIC SCHOOLS
14
development theories. Second language acquisition theory does factor in the
understanding of first language.
Chomsky’s Language Acquisition Theory
The process by which a person acquires language differ. The seminal work of
behavioral theorist suggest that language development is “influenced by environmental
stimuli, such as imitation, rewards, and practices” (Abedi, 2008). Chomsky believed that
“language is modeled by internal factors and then shaped through experience” (as cited in
Abedi, 2008). Chomsky believed that language was innate and everyone has the ability to
learn language. Students learn categories of language, such as nouns and verbs, and will
turn those words into phrases. These process take time and there is the issue for the
testing accountability model, time and language proficiency are ignored.
Krashen’s Language Acquisition Theory
Krashen believed that, “humans are born with the ability to learn language
(Abedi, 2008). Individuals will acquire a language through a natural process,
subconscious activity by listening and observing the home language (Abukhattala, 2012).
Krashen believed that developing a second language is more about the process, the
student’s conscious processes in the structure. (Abukhattala, 2012). The process is
developmental and individualized depending on the student’s development of their first
language. For students to grown in language proficiency, a rich academic classroom
environment is needed. One with activities that involve everyday activities and
interactions, with trained educators and proper materials, will impact the acquisition of
English.

COLLEGE READINESS OF GRADUATING ELLs IN UTAH PUBLIC SCHOOLS
15
Second Language Acquisition
When acquiring a second language, one must understand these learners need more
than just, “memorizing a system of grammatical rules,” but that students need to use their
“first language and culture as model for comparison” (Conley, 2007, p. 16). Increasing
language proficiency is a natural progression that requires social interactions and context
for proper development. Krashen (2013) referring to second language, as “involuntary,”
students are given input. It is the input/output in the context of conversation that assists in
meaning language development.
Hakuta, Butler, and Witt (2000) stated that the academic language needed for
students to be successful is difficult for language learners. Researchers estimated that it
could take “3-5 years for second language learners to become proficient in conversational
English but at least 4-7 years for students to develop academic proficiency” (Hakuta,
Butler, & Witt, 2000, p. 12). Slama (2012) that language proficiency can take, “6-8 years
for ELLs who immigrated between ages 12-15 years” (p. 266). Further research by
Mancila-Martinez and Lasaux (2011) showed that the rate at which vocabulary and
reading for language learners can exceed that of national norms, but their findings
depended on the use of English in the home. This rate of achievement is too slow for high
school students to become college ready, especially if English is not present in the home.
The work of Cummins (1979) discussed the relationship between basic communication
and cognitive language proficiency. His work defined early communication as basic
interpersonal communicative skills (BICS). In BICS, students gain conversational
language and can have their basic needs met. A deeper level of language is defined as
cognitive academic language proficiency (CALPS). In CALPS, students gain language
COLLEGE READINESS OF GRADUATING ELLs IN UTAH PUBLIC SCHOOLS
16
and understanding needed to be successful in school. They can read, evaluate, and infer
meanings found in textbooks or presented in class.
Linguistic Capital Theory
The responsibility of the student in their learning should not be ignored as a factor
in achievement. Identify investment has been defined as “how a person understands his or
her relationship to the work, how that relationship is constructed across time and space,
and how that person understand possibility for the future” (as cited in Cohen, 2012, p.
266). This notion was described as “imagined communities,” referencing a larger
community where the new language is spoken and the ELL desires to be a part of
(Cohen, 2012, p. 266).
The role of the student in creating their linguistic capital cannot be undersold.
Nawyn, Gjokai, LaFa Agbenyiga, and Grace (2012) cited a definition of linguistic capital
as “the acquired skills of speaking a dominant or ‘official’ language according to the
specification to those in power” (p. 258). ELLs must see the long-term investment in
learning a new language. Nawyn et al. (2012) stated that the lack of speaking the
dominant language skills can leave immigrants feeling “isolated from their communities”
(p. 258). The dominant language is necessary for forward social mobility.
The importance of having that linguistic capitol gives students confidence.
Student anxiety may play a role in classroom engagement for an ELL student. One study
examines depth of anxiety when it came to writing. Goodwin (2014) stated that “student
participation in verbal interaction offers language learners the opportunity to follow up on
new words and structures to which they have been exposed during language lessons and
to practice them in context” (p. 91). Yet, the teacher must create the classroom culture of

COLLEGE READINESS OF GRADUATING ELLs IN UTAH PUBLIC SCHOOLS
17
respect and compassion, so students will be comfortable speaking and making mistakes
without fear or embarrassment. This practice with peers may provide motivation to
improve conversation skills and become confident in the language.
Culturally Responsive Teaching Theory
Lopez and Iribarren (2014) discussed the state of Wisconsin’s approach to
culturally responsive teaching. A consulting group met with leaderships to promote
equitable activities for all students. The result was “Culturally Responsive Education for
All: Training and Enhancement” with the objective of closing achievement gaps through
training and varied strategies. In response to the growth of immigrants, the state
established a support network for the communities and schools to offer training and
educational programs for to assist refugees in assimilating. While seeking out
multicultural content may require additional time, the return on investment may provide
for a stronger educational outcome for students.
The Bilingual Education Act of 1968 included provision for teaching about
culture in the classroom. This was in part to combat negative prejudices and
discrimination among minorities in the United States (Gandara & Rumberger, 2009).
When educators intentionally and authentically seek to include a student’s culture into
academic content, opportunities for deeper learning are made. While this may not be
enough to prepare each ELL student for college, Gay’s (2002) work in being a culturally
responsive teacher did warns against controversial issues and how to use culture to
scaffold learning. By avoiding controversial issues and including culturally diverse
authors, students from other countries are able to connect with their heritage, thus

COLLEGE READINESS OF GRADUATING ELLs IN UTAH PUBLIC SCHOOLS
18
increasing engagement. Students should be able to use their culture and experiences to
expand their knowledge to gain academic achievement.
Soto-Hinman (2010) indicated that there is value in the practice of ELL student
shadowing, by educators, as a means to increase cultural knowledge and insight. The
shadowing of ELLs consists of the random selection of a student to gain information
about their academic and social engagement. One discovery, through this process, was
that the teacher was doing most of the talking, while the primary responsibility was to
develop the student’s language. The impact in shadowing allows for educators to be
reflective of their classroom practices. “Teachers with good professional preparation
make the differences in students’ learning” (Gandara, Rumberger, Maxwell-Jolly, &
Callahan, 2003, p. 9). ELLs need to be active in listening and speaking activities to
increase achievement. Those components coupled with responding in writing, will give
ELL students more confidence when it comes to their written English.
While the student does need to assimilate into the society, losing one’s heritage is
not required. A student with deep linguistic and cultural roots is a tremendous resource in
the global world. Unfortunately, a large percentage of high school dropouts are ELL
(Collier & Thomas, 2001). Historically, immigrant settled in communities with similar
spoken languages, lived and worked, and never really learned English. It was their
children who became bilingual, followed by a third generation who began to lose that
primary non English language. Today’s ELL, documented or undocumented, have
experienced a disruption in their lives that brought them to a new place. Therefore,
culturally responsive education is obligatory to assist in settling students into a new
environment while assessing and meeting their educational needs.

COLLEGE READINESS OF GRADUATING ELLs IN UTAH PUBLIC SCHOOLS
19
Aside from academics, Lopez and Iribarren (2014) discussed sociocultural
integration and the need for students to belong. Schools that promote and foster positive
student interactions will increase self-efficacy. Positive school experiences, along with
home to school connections, can impact student achievement. With high school
coursework being challenging, and student to teacher interactions being limited, this
theory of being culturally responsive to language learners becomes even more vital to
student achievement.
Analysis of College Readiness
College readiness is currently defined as “the level of preparation a student needs
in order to enroll and succeed, without remediation, in a credit-bearing general education
course at a postsecondary institution that offers a baccalaureate degree or transfer to a
baccalaureate program” (Tierney & Sablan, 2014, p. 943). At the heart of college
readiness is the idea of students entering the college system, prepared to understand,
interpret, and communicate information they have learned. As of 2013, 15% of Hispanics
ages 25-29 have a bachelor’s degree or higher (Krogstad, 2016). By comparison, 40% of
whites, 20% of African Americans, and 60% of Asians in the same age group have a
bachelor’s degree or higher. While the increase in collegial aspiration is a positive, the
road to college for an ELL is still paved with difficulties. Krogstad (2016) did report a
201% increase in Hispanics enrollment in college from 1993-2013; however, many do
not complete their degrees.
A student is deemed college ready, when enrolled in credit bearing course work,
with no remediation. Conley (2007) defined four elements of college readiness as, having
key cognitive strategies, key content knowledge, key academic behaviors, and key

COLLEGE READINESS OF GRADUATING ELLs IN UTAH PUBLIC SCHOOLS
20
contextual skills and awareness). Conley (2007) defined key cognitive strategies as a
student’s ability to learn a range of content. This included the ability to research, analyze,
and communicate in an academic setting. The key content knowledge required by
students consists of content terminology, facts, and the ability to make academic
connections within the context of what is being taught. The key learning skills or
academic behaviors required student ownership of learning. This involved self-
monitoring, goal setting, time management and note taking skills are just a few that
college ready students demonstrate. Finally, key contextual skills and awareness are
needed to navigate the requirements needed for college. For instance, how to choose an
institution, work through the admissions and financial aid process, and navigate the
independent life of a college student. When connecting Conley’s Elements to College
Readiness (2007) model of readiness to Vygotsky’s social development theory, the ELL
student’s cognitive development is based, in part, on the environment. Second language
students learn language, simultaneously, through classroom and social experiences.
However, that language is often social, functional and not highly academic. Therefore,
high school ELL students fail in Conley’s Elements to College Readiness (2007) model
of readiness, not because they are not intelligent, but lacking the time to development
readiness. His model, shown in Figure 2.2, the concentric circles indicate that college
ready students exhibit certain traits or behaviors.

COLLEGE READINESS OF GRADUATING ELLs IN UTAH PUBLIC SCHOOLS
21
Figure 2.2. Conley’s Elements to College Readiness
At present, college readiness accountability for the language learner rests with the
general education classroom teacher. Pre-service teachers receive training in educational
theories and practice, yet most are assigned to work with a diverse student population,
with little or no diverse cultural or linguistic background. Ball (2009) and Dianda (2008)
estimated that by 2020, the individuals ages 25-64 will be about 30% Latino and Black.
Both groups have a high school graduation rate of below 60%. Investment in teacher pre-
service language course work, along with professional development in language
acquisition is needed to support this exploding population of students.
ACT Standards for College Readiness
The use of college entrance exams, taken by high school juniors, is the current
standard for entrance into a four-year college and university. When students take the
ACT exam and score well, the option of college becomes an opportunity for a life of
higher earnings. However, the entrance exam for college admission remains a barrier to
enrollment. The ACT exam assess aptitude in English (language mechanics),

COLLEGE READINESS OF GRADUATING ELLs IN UTAH PUBLIC SCHOOLS
22
mathematics, reading comprehension, science, with an optional writing test. Once
students take the test, a composite score, the average of the four scores is calculated.
Students’ scores can range from 1 (low) to 36 (high). At present, colleges use the ACT
student score to determine admission, course placement, academic advising, and
scholarships.
ACT College Readiness Benchmark
The ACT College Readiness Benchmarks are the minimum scores required on
each subject test on the ACT for a student to be deemed as having a high probability of
success in credit-bearing courses (Clough & Montgomery, 2015). To prepare students for
higher education opportunities, ACT has created the ACT Aspire, previously known as
ACT Explore. This assessment has set benchmarks for grades 3-10 that indicates how
students are progressing to become ready for college ready upon graduation. In 10th
grade, students take the ACT Plan assessment, furthering their growth to reach college
readiness by graduation. The ACT Aspire and Plan assessments are a positive step
forward thinking that encourages educators, students, and parents the opportunity to
assess areas that need remediation. Table 2.1 provides the breakdown of ACT benchmark
scores.

COLLEGE READINESS OF GRADUATING ELLs IN UTAH PUBLIC SCHOOLS
23
Table 2.1
ACT College Benchmark Scores, 2016
College
Course
ACT Subject-
Area Test
ACT
Explore®
Benchmark
Grade 8
ACT
Explore®
Benchmark
Grade 9
ACT Plan®
Benchmark
The ACT®
Benchmark
English
Composition
English 13 14 15 18
College
Algebra
Mathematics 17 18 19 22
Social
Sciences
Reading 16 17 18 22
Biology Science 18 19 20 23
Source: ACT College Readiness Benchmarks, (2016). Retrieved from
https://www.act.org/content/act/en/education-and-career-planning/college-and-
career-readiness-standards/benchmarks.html
Table 2.1 shows the ACT college benchmark scores and provides the minimum
score a student may obtain in each subject area. By 11th grade, high school students are
encouraged, in some states required, to take the ACT exam. These minimum scores serve
as predictors of how students will perform academically. To further explain, each score
represents the lowest level a student may obtain to possibly score a C or higher in a first-
year, credit-bearing course in college in the same content area (ACT, 2016).
The 2015 ACT report of the conditions of college and career readiness, show that
64% of students tested met the benchmark in English, 46% met the reading benchmark,
42% met the math benchmark, and 38% met the science benchmark (ACT, 2015).
Camara (2013) noted that the primary purpose of the cut scores for college and career
readiness (CCR) is to examine the correlation between student performance on high

COLLEGE READINESS OF GRADUATING ELLs IN UTAH PUBLIC SCHOOLS
24
school assessments and post-secondary success. While these numbers include all
students, the scores grouped by ethnicity showed deficits in achieving benchmark
standards, but dual language spoke is not identified. This makes it difficult to determine if
the language proficiency played a role in scores. However, of those who identified
themselves as Hispanic, 47% did not meet English benchmark scores, 31% did not meet
reading benchmark scores, 29% did not reach math benchmark scores, and 23% did not
reach science benchmark scores.
The 2015 ACT Condition of College & Career Readiness report of students from
low income families revealed that most students are not college ready and low income
students are vulnerable (ACT, 2015). Students in high school need a curriculum that is
core to being college ready. Educational practices in course placement, along with
interventions, must be adequately supported. Non-cognitive skills also play a vital role in
collegial success. Students may lack the behavioral skills needed to study and need
mentoring. These factors while focused on low income students apply to language
learners in college, as well as first year college student.
At present, college readiness accountability of the language learner is focused on
the general education classroom teacher. Preserve teachers receive training in educational
theories and practice, yet most are assigned to work with a diverse student population,
with little or no diverse cultural or linguistic background (Ball, 2009). Properly trained
classroom teachers can deeply impact the success of students. Investment in pre-service
language course work, along with professional development in language acquisition is
needed to support this population of students.

COLLEGE READINESS OF GRADUATING ELLs IN UTAH PUBLIC SCHOOLS
25
College Readiness Barriers and English Language Learners
Access to college may be impacted by many factors. The literature review
exposed several barriers that ELL students face. The current practices in student
placement, equitable curriculum and the complexity of assessment language deeply
impact student achievement and possible collegial path.
A home language survey is given when a student registers in school. The purpose
of this form is to identify linguistic needs. If parents identify a language, other than
English, spoken at home students may be given a language proficiency assessment. The
validity of such forms could be questionable. In some cases, parents may provide
inconsistent information or may not see their child as needed language services. Many
students classified as English learners have been in America schools since kindergarten.
In many states, the yearly ACCESS (Assessing Comprehension and
Communication in English State-to-State) assessment is given to students in grades K
through 12 who have been identified as ELL. Students are tested in tiers ranging from a
beginning level to an advanced level (WIDA, 2016). This assessment identifies
proficiency levels which allows educators to develop a plan for meaningful student
accommodations. To ensure validity and fidelity, the assessment is given under standard
conditions, during a designated testing window, and by a certified administrator (WIDA,
2016).
Once students test and receive a score, parents and teachers are given a report. For
the educator, the report will provide “CAN DO Descriptors” that explain the expected
performance at each level of English proficiency. The CAN DO Descriptors is not an
inclusive list of what they student can do, but offers a start (WIDA, 2016). This tool

COLLEGE READINESS OF GRADUATING ELLs IN UTAH PUBLIC SCHOOLS
26
provides a beginning point for the general education teacher and ELL certified teachers to
collaborate and plan for a particular student. The student profile is comprised of the scale
score in listening, speaking, reading, and writing, along with proficiency level. This
profile, established from scores, is the support for the differentiated instruction and
accommodations the student will receive. Growth is determined after the second
consecutive year in school when a student’s score can be compared to the previous year.
Gender
Gender equity is often measured to determine if there is a link in high stakes
testing. Brennan, Kim, Wenz-Gross, and Siperstein’s (2001) study focused on
middle/junior high students, reported that the adolescent girls who perform poorly in
math and science on standardized test, may go on to disassociate themselves with being
good in these subjects. Therefore, widening the gap could have potential negative effects
on college coursework and career path for women. Conner and Vargyas (2013) reported
that “minority females suffer a double jeopardy as they often score lower than bother
white females and males of their own racial or ethnic group” (p. 16).
Duckworth and Seligman (2006) reported that females outperform males on
classroom report card grades, partly because they are more self-disciplined. School-age
girls are better at handling heightened emotions (Duckworth & Seligman, 2006). This
observation contrasts with the fact that if women are better emotionally and score well in
the classroom, why do they perform poorly on standardized test compared to their male
peers. Furthermore, if girls are outperforming boys in classroom grades, but not on
standardized assessment, is there a discrepancy or bias in the test questions?

COLLEGE READINESS OF GRADUATING ELLs IN UTAH PUBLIC SCHOOLS
27
It is well researched that ELL students score low, what warrants attention is male
and female motivation to increase student achievement. Hyde (2005) noted that specific
learning outcomes did not indicate differences in males and females. Yet, scores often
showed that males outperformed females in math and females outperformed males in
reading. Cornwell, Mustard, and Van Parys (2011) looked at the educational outcomes of
males vs females, and reported that girls in every racial category outperformed boys on
reading exams. Perhaps due to the stereotypical behaviors where students believe boys do
poorly in reading and girls are better in reading. Student motivation and interest toward a
subject cannot be discounted. Honigsfeld and Dunn (2003) conducted a gender
differences study, looking at students in five countries, including the United States. The
findings spanned a variety of outcomes, including morning vs afternoon working
preferences, temperature of the room, kinesthetic activities, and levels of noise noted had
effects on learning. This research, along with the understanding of learning style, is
important to educators in attempting to create conditions for ELLs to become successful
in the classroom. However, Conner and Vargyas (2013) contend that little research still
exists is on why minority women score low.
Language Proficiency Level
Language proficiency levels plays a role in academic achievement. The Pew
Hispanic Center report (2004) found that “Latinos insist that schools should teach English
to students who are immigrants or the children of immigrants” (p. 2). Families want their
children to learn English, but also maintain the “family’s native tongue.” (Pew Hispanic
Center, p. 3). Hopkins (2013) research pointed out that bilingual educators made
meaningful gains in connecting to bilingual students. While only teaching in English,

COLLEGE READINESS OF GRADUATING ELLs IN UTAH PUBLIC SCHOOLS
28
some educators drew on their cross linguistic practices to build background. Collier and
Thomas (2001) stated, “students attending one-way and two-way enrichment bilingual
schools can close the gap in achievement, by reaching the 50th percentile in their second
language after 5-6 years of bilingual schooling” (p. 70).
For the ELL student, mastery of complex reading and vocabulary is paramount to
success in academics. High-stakes testing, such state exams or the ACT exam, are
predictors of student success outside of school. Second language learners, who lack
English proficiency, fall behind their peers and may end up dropping out of high school.
“Recently arrived adolescent immigrant students were at greater risk of dropping out of
high school than their immigrant peers who had spent more time in the United States”
(Slama, 2012, p. 267). Slama’s 2012 study also reported that 60% of high school ELL
students were born in the United States, spent at minimum nine years in a U.S. school
without “developing a minimum level of academic language needed to perform
mainstream academic work in English” (p. 265). Whether the ELL student is new to the
U.S. or born in the U.S. attention to how language instruction is delivered shows requires
review.
Solorzano (2008) reported the general concern over standardized testing as a
barrier to the ELL student. The fairness and bias within these exams hinder ELL student
achievement, due to the language proficiency levels. In addition, Solorzano (2008) traced
inadequacies in education of ELLs to substandard schooling, underprepared teachers, and
inappropriate instructional placement for ELLs. The general education teacher is the first
line in accountability and current practices do not fully support the growing population of
ELL students.

COLLEGE READINESS OF GRADUATING ELLs IN UTAH PUBLIC SCHOOLS
29
Bilingual Student Academic Placement
The English language learner is expected to master the same academic standards
as their peers and be college ready by graduation. However, many of the current
placement practices thwart that readiness factor. Placement of ELL students in lower
tracks are often determined by a home language survey, coupled with scores from the
WIDA assessment. Counselors and ELL teachers greatly influence the placement of
students and need to consider the impact of placement, particularly if the student was a
high achiever in their home country. Kanno and Kangas (2014) examined one school’s
process of placing ELL students into low academic track courses to boost language
support. A longitudinal study showed that while some students test out of the ELL course
work, they entered remedial courses, never reaching a college readiness track. If this is
the case, then the use of track placements may result unequal growth and student
achievement for language learners.
Flores and Drake (2014) found that the lack of access to demanding curriculum
was a factor in college students needing remedial education in their first year. Cornwell,
Mustard, and Van Parys (2011) reported that “teacher assigned grades are arguably more
consequential, given the role they play in class placement, high school graduation, and
college admissibility” (p. 238). Therefore, if colleges place a deep value on high school
course work and grade point averages, ELL students’ low level coursework will not be a
qualifier.
Yonezawa, Wells, and Serna (2002) examined the “Freedom of choice” track in
six schools and found that choice failed. While creating heterogeneous groupings are
largely supported in education, researchers determined that the, “tracks are politically and
COLLEGE READINESS OF GRADUATING ELLs IN UTAH PUBLIC SCHOOLS
30
socially significant spaces because we assign meaning to them.” Unfortunately, cultural
prejudice can play a role in high school social circles. Yonezawa, Wells, and Serna
(2002) asserted that the “segregated nature of the tracked spaces shapes the relationships
and identifies students, parents, and educators by limiting their supportive and
informative relationships with diverse groups” (p. 37). Therefore, being recognized as
smart or having collegial aspiration can be viewed as a negative among peer groups.
While accelerated courses and educational equality is guaranteed to all students, it
remains clear why ELLs are not making academic gains. Effective reading instruction is
needed, as well as intensity, if secondary ELL students are going to make proficiency
gains. Slama’s (2012) conclusions were that the majority of secondary-level ELLs do not
reach adequate levels of academic English proficiency to exit from the ELL program
until close to the end of high school. While there are many variables that could impact
this, the students in this study were U.S. born and performing at an intermediate level of
language proficiency. Zarate and Burciaga (2010) stated that “only 54 percent of U.S.
educated Latinos complete high school” (p. 25). As a result, their trajectory could result
in one of poverty.
Student placement of ELL students can have a lingering effect, even when a
student exits the ELL program. Gonzalez, Stoner, and Jovel’s (2003) study showed that
students who, either through testing or teacher recommendations, were placed in
advanced classes (gifted programs) were more likely to be placed in higher track courses
in high school. However, due to language barriers, ELL high school students do not
always receive the same instruction as their English speaking peers and this brings into

COLLEGE READINESS OF GRADUATING ELLs IN UTAH PUBLIC SCHOOLS
31
question the fairness of state mandated testing. In other words, ELL students are being
assessed on standards that they may or may not have been taught.
On Track Indicators
Kemple, Segeritz, and Stephenson (2013) reported the value of on track indicators
to predict high school graduation. Their research followed one group of ninth grade
students and tracked their earned credits in ninth grade, along with state test scores to
predict graduation. Observed was the expected differences among SES groups, stating
that “African American and Hispanic young men are much less likely to be on track at
the end of ninth grade” as compared to whites and Asians (Kemple, Segeritz, &
Stephenson, 2013, p. 24).
An analysis of ELL ninth graders who entered high school with limited English,
but were on track by the end of ninth were more likely to graduate, barring any
unforeseen circumstance. However, Kemple, Segeritz, and Stephenson (2013) reported
that students who failed a single academic subject in ninth grade are almost half as likely
to graduate with their cohort. Not discussed or examined was student attendance, which,
along with academic performance, are pathways to college readiness. A focus on current
educational practices and on track indicators would positively impact student growth,
thus preparing students for college and careers.
Growth models are one form of accountability in closing achievement gaps for
student groups. Marzano and Toth (2013) described growth models as tracking of student
test scores from one point in time to another. This data will track gains or losses if using
equivalent tests, such as benchmark standards assessment. If ACT is conducting
longitudinal studies using standardize testing, then tracking student growth within
COLLEGE READINESS OF GRADUATING ELLs IN UTAH PUBLIC SCHOOLS
32
schools would not be too difficult. While school districts are tracking the proficiency of
all students, the validity of the growth models is not widely researched. Lakin and Young
(2013) examined the growth models as a means to predict future proficiency. The
concern in the growth models exist around the changes in the use of testing
accommodations. A large body of research reported that districts provide a “disservice to
ELLs when they offer a reductionist curriculum focusing primarily on skills and drills”
(Gandara et al., 2003). A further study on schools with successful growth models is
needed.
Equitable Curriculum
Equitable curriculum should be afforded to all students. Lopez and Iribarren
(2014) shared supporting research that promoted content taught in the students’ native
language can promote equitable opportunities to learn and gain deeper content
understanding. For many ELLs, the opportunity for higher content is limited due to track
placements. Yet, many researchers conducted longitudinal studies that concluded that
“being schooled in ones’ second language is not a quick and easy process” (Collier &
Thomas, 2001). Their research went on to show that “schooling through students’ two
languages provides the conditions needed for students to eventually reach grade-level
performance in a second language in 4-7 years” (Collier & Thomas, 2001).
With many programs, such as bilingual education or dual language programs,
school leadership should consider a student’s native language as part of the learning
process and not a hindrance. Callahan (2005) insisted that ELLs “must be exposed to
twice as much instruction as native English speakers in terms of both language and
content” (p. 324). With twice as much instruction, it is reasonable to employ the student’s

COLLEGE READINESS OF GRADUATING ELLs IN UTAH PUBLIC SCHOOLS
33
native language to make academic connections. Gandara and Rumberger (2009) reported
that immigrant students need the same “rich and broad curriculum” that will afford them
a positive social mobility (p. 755).
Instructional needs of ELL students differ, as second language development is
complex. In some cases, ELL students enter U.S. schools with below grade level
language in their native language. This gap deeply impacts their ability to achieve literacy
in a new language. Short and Fitzsimmons (2007) supported the theory that students need
a strong foundation in their native language to make progress in their second language.
Therefore, instruction and intervention support must factor in to a curriculum plan for
language students.
Academic testing in primary and secondary school also plays a role in student
placements. Gonzalez, Stoner, and Jovel’s (2003) study showed that students who, either
through testing or teacher recommendations, were placed in advanced classes in primary
or middle school were more likely to be placed in higher track courses in high school.
These higher track programs are often void of ELL students, even after students test out
of ELL services. Abedi (2008) pointed out that incorrect placement of ELL students who
may be “at a higher level of English proficiency into remedial or special education
programs” can result in promotion and graduation delays (p. 28). These improper
placements or delays in reclassification deny students to post-secondary education. The
education community must carefully assess ELL students to ensure proper placement and
opportunities are afforded to all English language learners.
With the use of sheltered or low track instruction of ELLs and the
accommodations students receive, the validity of the student score is questionable. Reyes

COLLEGE READINESS OF GRADUATING ELLs IN UTAH PUBLIC SCHOOLS
34
(2008) made the point that some bilingual educators may cheat by using the student’s
native language to explain a part of instruction, when the state, district, or school
mandates an English only policy. Ramos (2005) reported that teachers who used Spanish
to teach English were able to help “ELLs achieve higher levels of linguistic and academic
development in English” (p. 429). While the use of other language during instruction may
be frowned upon or illegal, there is merit to facilitating learning through a student’s
native language, while teaching in English. Analysis of previous research on the use of
native language in teaching showed that after accounting for the controlled variables of
socioeconomic status and parents’ level of education, the use of bilingual education
programs was effective (Reyes, 2008).
Language Complexity in Assessments
Abedi (2002) explained that the language background of students adds another
perspective to testing outcomes. When an ELL student takes a standardized test, he or she
may be subject to a host of issues. Abedi (2002) showed that most standardized tests are,
“administered in English and normed on native English speaking test populations” (p.
232). This fact may impact ELL test takers who are not able to identify vocabulary or
mistakenly interpret text (Abedi, 2002). Depending on the student’s background,
knowledge, and time spent in an English speaking school can influence an achievement
score on a standardize test. The complexity of the language and rigor of the questions
may cause native speakers to struggle, yet, academia’s expectations for language learners
achieve a proficiency is unrealistic. As Abedi (2008) reported, native English speakers
often fall below cutoff points on standardized tests. Therefore, measure for assessing
English proficiency can be unfair.

COLLEGE READINESS OF GRADUATING ELLs IN UTAH PUBLIC SCHOOLS
35
Testing language can be obscure and difficulty for native speakers. Abedi and
Dietel (2004) suggested that language modification on a test can increase student
performance, as much as 10-20%. In Massachusetts, six years of data examined did show
some growth among ELL 10th grade students, the gap still widens among ELLs and non-
ELL (Abedi & Dietel, 2004). Abedi and Dietel (2004) communicated that growth was in
part to language modification without reducing rigor. The examination of complex
language on state assessment should be examined, at minimum to remove cultural bias,
without lowering standards.
Walpole et al. (2005) studied the insights of 227 urban African Americans and
Latino high school students. The results showed that students found the standardized
assessments as an impediment to college. For a fee, many organizations, offer academic
test preparatory courses. In some districts, some schools offer free preparatory classes as
well. Many low income families lack resources to pay for those classes and that can leave
many students feeling underprepared.
Olson, Land, Anselmi, and AuBuchon (2011) reported the findings of a national
survey of high school and college professors were asked to identify important skills for
college students, revealed the ability to identify the theme of a text, making inferences,
and drawing conclusions. In addition to reading skills, writing skills were equally
important. Yet, research continues to show that ELLs are placed in skill courses to
improve English and receive little time with academic content (Gandara et al., 2003).
Academic and Linguistic Identification of English Language Learners
Callahan (2005) cited a 1984 study that caution exists among educators as to the
“confusion between language proficiency and academic readiness” (p. 306). If

COLLEGE READINESS OF GRADUATING ELLs IN UTAH PUBLIC SCHOOLS
36
requirements for exiting the English learner programs are simplified, students enter
mainstream classroom with linguistic incompetence. If the requirements are too stringent,
students never grow academically, thus creating more of an achievement gap among
ELLs and their peers. The average native speakers will gain, “about 10 months of
academic growth in one 10-month academic year” (Thomas & Collier, 2000, p. 19). This
does not take into account any special needs or barriers a student may have. Now
consider the difficulty many ELLs face when entering the United States. Some students
may be coming as refugees, displaced from their homes, living in poverty, perhaps
having little or inconstant schooling. Yet, the expectations are set to become English
proficient quickly.
Rosenberry-McKibben and Brice (2000) suggested that ELLs must make one and
a half years of progress in a single year in order to catch up to peers. It may take an ELL
student around two years to learn basic English. Then the transition to academic language
and content understanding it could take five to seven years to become equal to peers. The
learning process and rate of which skills are acquired is different for all students,
especially if the student was struggling academically in their home nation.
In many states, ELL students receive English as a Second Language (ESL)
pullout by and ESL teacher for up to two hours (Collier & Thomas, 2001). However,
previous research by Thomas and Collier (2000), showed that “the largest number of
LCD dropouts come from this program model of English-only instruction” (p. 71). While
many models of instruction exist, the socio cultural perspective insists on a, “safe and
risk-free environment for student learning, together with the provision of opportunities
for student verbalization” (Xu, 2015, p. 155) While no one model of instruction for this

COLLEGE READINESS OF GRADUATING ELLs IN UTAH PUBLIC SCHOOLS
37
group of students is the perfect answer, Cohen (2011) studied a southwestern high school
where ELLs had varied levels of 2-hour blocks of instruction existed. Cohen’s (2011)
study focused on content taught at a beginning, intermediate, and advanced level of
English as a second language class of language arts instruction. Cohen’s (2011) findings
showed that students, while feeling safe in their ELL classes, wanted more challenge
work and wanted to be “mainstreamed” and held accountable.
Gandara and Rumberger (2009) supported the need for instructional time, such as
pull-out programs or extended day school in order to grow in language proficiency. Gold
(2006) proposed that secondary ELL students should be given an extra year or two to
complete high school. ELLs face many academic struggles that include instruction in
English, assessments that are not intentionally culturally bias, goals to be mastered in a
language that is unfamiliar may seem impossible. Even when balanced with teacher
support, the requirement and strain placed on the student is great. Students in this
situation need to feel valued, empowered, and in some control of the outcomes to help
encourage them to keep moving forward.
Reclassification to Fluent English Proficient
The reclassification of English language students to proficiency is determined
through exam scores. Under federal law, school districts will annually assess a student’s
proficiency. Upon reaching the minimum score to be exited from ELL services, students
are monitored for two years after being reclassified (Education Commission of the States,
2014). The criteria for exiting a student from ELL services is currently determined by the
department of education for each state.

COLLEGE READINESS OF GRADUATING ELLs IN UTAH PUBLIC SCHOOLS
38
Abedi (2008) argued that using standardized achievement tests and language
proficiency tests are inappropriate when it comes to exit criteria, because of the
complexity of the language used in test questions. Varied criteria for exiting ELLs
included assessments, teacher evaluation, and parent input (Abedi, 2008). Nine districts
had varied approaches to exit criteria (Abedi, 2008). Among the criteria were cut scores,
monitoring of student readiness and basic skills. The criteria for being reclassified varies.
This inconsistency is a disservice to students. Abedi’s 2008 study results reported that it
took “10 semesters for Hispanic students to be reclassified” out of ELL status to
predesignated fluent English proficient (RFEP) (p. 25). This study was conducted
focused on K-12, this study does show the time factor and how that deeply impacts high
school students who enter the United States as non-English speakers.
Teacher Effectiveness
The Pew Hispanic Center report (2004) found that “Latinos insist that schools
should teach English to students who are immigrants or the children of immigrants” (p.
2). Yet, the families also stated they wanted children to maintain the “family’s native
tongue” (p. 2). Clearly, the general education teacher role is changing into more just
teaching academic content, they are responsible for teaching a language as well. Callahan
(2005) noted that the “direct effect of teacher expectations on achievement is difficult to
quantify” (p. 308). While positive relationships are part of the formula for student
achievement, attention to teacher preparation through pre-service university programs
and professional development of current educators who are with working with language
learners need consideration. Not all states require an ELL teacher endorsement, therefore,

COLLEGE READINESS OF GRADUATING ELLs IN UTAH PUBLIC SCHOOLS
39
not all teachers are adequately prepared. If closing the achievement gaps is desired, then
equipping educators with the latest researched strategies must be part of the process.
The need for trained educators in language acquisition should not be understated.
Perhaps more today than ever before, teachers need multicultural instructional strategies
to teach to ethnically diverse students. Pre-service teachers or teachers who work in high
income areas and then move to low income schools may not understand the difficulties
students living in poverty face. Student achievement may not stem from a lack of effort,
but from the effects of poverty (Taylor, 2005). Educators who do not understand the
psychological effects of living in poverty may not fully understand how to effectively
connect with students.
Lucas and Villegas (2013) believed the trend of mainstreaming ELLs into general
education classroom, where, “teachers with little or no preparation” are teaching
language learners is a disservice (p. 99). While many educators do seek professional
development, it would be advantageous to include language acquisition coursework in
pre-service teacher education curriculum. While this is not the sole answer, Tigchelaar
and Korthagen (2004) stated that there continues to be a gap in “linking experiences of
student teachers and theory” (p. 677). Feiman-Nemser (2001) believed that pre-service
teachers fall into the trap of thinking that “teaching is the passing of knowledge and
learning as absorbing and memorizing” (p. 1017). Teacher candidates must abandon any
illusion that students will sit and absorb information. Pre-service programs should seek
authentic opportunities to practice theories, beyond the student teaching requirement,
especially in districts with high numbers of ELLs.

COLLEGE READINESS OF GRADUATING ELLs IN UTAH PUBLIC SCHOOLS
40
Parental Involvement
One factor that cannot be ignored is parental influence on academic achievement.
While many ELL families may not have the ability to read to students in English, some
can, and those close proficiency gaps. “Parents reading to Latina girls more frequently
than to boys” could play a role in language fluency (Zarate & Burciaga, 2010). Parental
involvement cannot be understated. Niehaus and Adelson (2014) reported that a parent’s
positive involvement in their child’s education can enhance their social and emotional
adjustments. When children are socially relaxed they have fewer behavioral issues which
often impede learning. While many schools have parent-school outreach programs,
families of limited English proficiency may not always participate in what is offered.
Moreover, many of those outreach programs or after hour’s school events take place in an
elementary setting. It is rare, apart from open house or orientation, to see middle and high
schools hold events, beyond sports, that include families outreach.
Socioeconomic/Poverty
A student’s socioeconomic status has been a reliable predictor of student
achievement. Low socioeconomic status is a category encompassing individuals who
qualify for free or reduced lunch, for the purpose of tracking demographics. The facets of
poverty that have negative impacts can be inadequate heath care, unstable living
arrangements, or lack of parent support can impact a child’s school readiness. Markham
and Gordon (2008) summarized: “the risk factors that challenged the ELLs in developing
English proficiency, which include prior educational experiences, socioeconomic class,
cultural heritage, and levels of language and literacy proficiency in both their native
language and English” (p. 73). Scarcella (2003) supported this point and emphasized the

COLLEGE READINESS OF GRADUATING ELLs IN UTAH PUBLIC SCHOOLS
41
value of learning academic English as a means to closing the socioeconomic gap that
exists. However, many living in low income areas are often in resource poor
communities, making learning the dominant language difficult. The future of ELLs
depends on how well public schools can close achievement gaps and prepare this large
percentage of the population for college or career. Gold (2006) stated that many high
school counselors focus primarily on graduating students instead of college readiness.
Taylor (2005) stated that children who are faced with “limited resources and often
attending poor-quality schools, are at an increased risk of not succeeding academically”
(p. 54). Therefore, the role of education is to provide equitable curriculum and highly
trained educators who can assist with the closing achievement gaps and prepare students
for higher education. While programs exist to academically support low income and ELL
students, many programs lack sustained academic and social support with older students
(Taylor, 2005). Many of those educational programs target early intervention in primary
grades. Therefore, attention to secondary education programs to increase English
proficiency, close achievement gaps and prepare this group of students for a competitive
job market is needed.
Many second generation immigrant children have low, at home, exposure to
speaking English. Goldberg, Paradis, and Crago (2008) supported the idea that children
with more home literacy in English would positively impact student growth in English.
The peril exists during the summer, when presumably, nightly or weekly reading routines
become nonexistent. Developing language, building vocabulary, and making sense of
written language comes in part from reading. The “SES gap in summer reading gains
amounts to about 3 months of schooling” (Gershenson, 2013, p. 1221). While the access
COLLEGE READINESS OF GRADUATING ELLs IN UTAH PUBLIC SCHOOLS
42
to technology will vary among individual students and families, the emphasis in
promoting summer programs through a virtual platform is one approach to sustaining and
advancing students during the summer month. Gold (2006) discussed the use of virtual
schooling as an option for closing the proficiency and achievement gaps for students.
While this would require highly motivated students and proper tools, many students do
see the capital in learning the language and advancing themselves.
Conclusion
In summary, the literature supports the problem that secondary ELL students are
not college ready by graduation. The need for serious examination of practices at the
secondary level for high school English language learners. The three major points
discussed in this review of literature includes the difficulties in acquiring language
proficiency, the college readiness factors for graduating students, and barriers to college
readiness faced by the English language learners. This student group struggles greatly
with time frame given to acquire proficiency as it pertains to testing. Unfortunately for
the high school ELL student, extended time 43 prior to graduation is not available. This
particular group of students must self-monitor and work hard to achieve some level of
proficiency before ACT testing.
The college readiness success of English language student’s rests on the quality of
instruction and access to academic content. The use of low-track student placement
restricts their opportunity to coursework that will help them qualify for a four-year
college. Currently, ELL students face obstacles, such as low track placement, lack of
linguistic capital, and resource poor communities where support is lacking. While not all
students will be college ready upon graduation, the job of education is to prepare students

COLLEGE READINESS OF GRADUATING ELLs IN UTAH PUBLIC SCHOOLS
43
for their next steps. Pre-service teacher education programs and endorsements of current
professionals in each state would enhance the understanding of language acquisitions and
strategies for effective teaching. Teachers with little or no experience in language theory
will struggle with being culturally responsive in their teaching.

COLLEGE READINESS OF GRADUATING ELLs IN UTAH PUBLIC SCHOOLS
44
CHAPTER 3: METHODOLOGY
The purpose of this quantitative study was to analyze the college readiness of high
school English language learners (ELL). Presently, many ELL high school graduates are
not adequately prepared to pass a credit bearing course at the college level. This study
assessed the ACT scores of ELL high school graduates, report the college readiness based
on gender, language proficiency levels, and free or reduced lunch status using data from
Utah.
Research Questions
1. How are English language learner graduates performing in terms of college readiness?
2. Are gender and college readiness levels independent of one another for graduating
English language learners?
3. Are language proficiency levels and college readiness levels independent of one
another for graduating English language learner?
4. Is the free or reduced lunch status and college readiness level independent of one
another for graduating English language learners?
Participants
This participant sample was comprised of 1013 ELL high school juniors from
Utah who took the ACT in 2014. Their anticipated graduation date was 2015. The
ethnicity primarily encompasses Hispanics and Asians, with other races represented. No
contact personal is required for this study.
Table 3.1 identifies the English language proficiency of 2015 graduates. The
sample population was divided by five language proficiency levels. Each proficiency
level identifies the number of participants included in that category. The monitored status

COLLEGE READINESS OF GRADUATING ELLs IN UTAH PUBLIC SCHOOLS
45
category describes students who have met proficiency, based on ACCESS testing and
have tested out. Per federal mandates, once a student has tested proficient, they remain in
a monitored status for two years. For the purpose of this study, the monitored status
students was included in this study. The final category identifies all 2015 graduates in
Utah whose native language is English. The native English speaker is included to provide
a comparison for this study.
Table. 3.1
English Language Proficiency of 2015 Graduates
Frequency Valid % Cumulative %
Valid
Entering 36 .1 .1
Beginning 89 .3 .4
Developing 197 .6 1.0
Expanding 187 .6 1.5
Bridging 81 .2 1.8
Monitored Status 425 1.3 3.1
Native English Speaker 32059 96.9 100.0
Total 33074 100.0
Table 3.2 identifies the number of English language learners by gender. The
gender split is almost equivalent with 47.6% being female ad 52.4% being male.
Table 3.2
English Language Learner Gender
Frequency Valid %
Valid
Female 482 47.6
Male 531 52.4
Total 1013 100.0

COLLEGE READINESS OF GRADUATING ELLs IN UTAH PUBLIC SCHOOLS
46
Table 3.3 identifies the number of 2015 graduating English language learners that
qualify for free or reduced lunch in Utah. As the table states, 51.7% of ELL students in
Utah are receiving free or reduced lunch. In contrast, 48.3% report that they are not
eligible for free or reduced lunch. The split among this group is almost comparable.
Table 3.3
Eligibility for Free or Reduced Lunch
Frequency Valid %
Valid
No 489 48.3
Yes 524 51.7
Total 1013 100.0
Setting
A 2014 Census reported the population of this western mountain state to be
2,942,902, a 6% increase from the 2010 census. In 2014, the minority population was one
in five residents. Languages spoken other than English were reported at 14.6%. The
census data stated 30.6% of persons 25 years of age or older held a bachelor’s degree or
higher, with a median household income of $59,846 (U.S. Census Bureau, 2016).
The 2014-2015 racial makeup of public schools in this western mountain state
consist of 75.9% White, 1.1 percent African American, 1.7% Asian, 1.5% Pacific Island
alone, 16.3% Hispanic/Latino, and 2.2% Multi race. In 2014, this western mountain state
had a total enrollment of 622, 153 students. Collectively, the state total of minority
students is 24.1% (Utah State Office of Education [USOE], 2014).

COLLEGE READINESS OF GRADUATING ELLs IN UTAH PUBLIC SCHOOLS
47
Reported in Table 3.4 is the racial or ethnic makeup of the 2015 graduating
English language learners in this study. The table shows the largest ELL group; 67.5%
identify as being Hispanic. The next largest group, at 13.1% identifying as 13.1% Asian.
Table 3.4
Race or Ethnicity of Graduating English Language Learners
Frequency Valid % Cumulative %
Valid
African American/Black 52 5.1 5.1
Asian 133 13.1 18.3
Caucasian/White 56 5.5 23.8
Hispanic/Latino 684 67.5 91.3
Multiracial 8 .8 92.1
Native American 31 3.1 95.2
Pacific Islander 49 4.8 100.0
Total 1013 100.0
Variables and Measures
Language Proficiency Assessment
WIDA, formally known as World Class Instructional Design and Assessment, is
currently a nonprofit cooperative group whose purpose is to develop standards and
assessments that, “promote educational equity for English language learners” (WIDA,
2016). Presently, any student identified as an English language learner is assessed using a
test called Assessing and Communication in English State to State (ACCESS). This
assessment is used to measure a student’s language progress. ACCESS testing is

COLLEGE READINESS OF GRADUATING ELLs IN UTAH PUBLIC SCHOOLS
48
standards based, criterion referenced English proficiency test. The test is used to measure
social and instruction English used in schools, associated with language arts, math, social
studies, and science, using the four domains of listening, speaking, reading, and writing
(WIDA, 2016). The five WIDA English Language Proficiency (ELP) Standards are:
English Language Proficiency Standard 1: English language learners
communicate for Social and Instructional purposes within the school setting.
English Language Proficiency Standard 2: English language learners
communicate information, ideas, and concepts necessary for academic success
in the content area of Language Arts.
English Language Proficiency Standard 3: English language learners
communicate information, ideas, and concepts necessary for academic success
in the content area of Mathematics.
English Language Proficiency Standard 4: English language learners
communicate information, ideas, and concepts necessary for academic success
in the content area of Science.
English Language Proficiency Standard 5: English language learners
communicate information, ideas, and concepts necessary for academic success
in the content area of Social Studies. (Utah Education Network [UEN], n.d.)
These standards provide educators a progression and understanding of what students can
do at varied levels of proficiency. These standards reflect an academic expectation related
to language and instruction in given context. The four language domains: listening,
speaking, reading, and writing are how educators can structure learning.

COLLEGE READINESS OF GRADUATING ELLs IN UTAH PUBLIC SCHOOLS
49
Listening - process, understand, interpret, and evaluate spoken language in a
variety of situations
Speaking - engage in oral communication in a variety of situations for a
variety of purposes and audiences
Reading - process, understand, interpret, and evaluate written language,
symbols and text with understanding and fluency
Writing - engage in written communication in a variety of situations for a
variety of purposes and audiences. (WIDA, 2016)
ACCESS for English Language Learners Assessment
ACCESS for ELLs assessment, given annually, is used to asses a student’s current
level of English language proficiency. ELL students are assessed in the areas of speaking,
listening to, comprehending, reading, and writing academic English. The assessment has
three forms within grade level clusters. The tiers are: Tier A for Beginning, Tier B for
Intermediate, or Tier C for Advanced. In addition, the paper forms are grade level
clustered from grades 4-12: Grade 4-5, Grade 6-8, and Grade 9-12, Grades K-3 are not
clustered.
The ACCESS for ELLs test contains multiple choice questions and constructed
response tasks to assess the four domains: listening, reading, writing, and speaking.
Students will receive four different composite scores for each section and an overall
composite score for all sections. In addition, a confidence band is provided with the scale
score. The confidence band takes into account the Standard Error of Measurement (SEM)
which provides a score range. In other words, a student taking the same test on a different
day would still score in that same, assuming there were no changes in the student’s

COLLEGE READINESS OF GRADUATING ELLs IN UTAH PUBLIC SCHOOLS
50
ability. The Data Recognition Corp’s scores system assures an accuracy of 99.99%
(WIDA, 2016).
Scale Scores for ACCESS for ELLs
Student receive a scale score and an English language proficiency level score for
each domain. In addition, scale score and proficiency levels are combined to form a
composition scores. The composite scores are: Oral language (listening and speaking
sections), literacy (reading and writing sections), comprehension (listening and reading
sections), and overall composite score (combination of all four domains) (WIDA, 2016).
Table 3.5 provides the percentage breakdown of how WIDA scores are calculated.
Table 3.5
Weighting Used to Calculate Each Composite Scale Score
Type of
Composite Score
Listening Speaking Reading Writing
Oral Language 50% 50% - -
Literacy - - 50% 50%
Comprehension 30% - 70% -
Overall 15% 15% 35% 35%
On a vertical scale, the student score across the grade can be compared within in
each domain. Each domain has a separate score, therefore scores in one domain should
not be compared to scores in another. The ranges of possible scores from Kindergarten
through grade 12 is 100-600. Yet, depending on the grade and tier levels, the range may
vary. For example, the Kindergarten range is 100-400. The tiers, A-C reflect difficulty,
with Tier A being the easiest. A student taking Tier C will receive a higher score than a
student taking Tier A, even when both students answer all items correctly.

COLLEGE READINESS OF GRADUATING ELLs IN UTAH PUBLIC SCHOOLS
51
Proficiency Scores for ACCESS for ELLs
Student’s proficiency level are categorized into 6 English proficiency levels: 1 -
Entering, 2 - Emerging, 3 - Developing, 4 - Expanding, 5 - Bridging, 6 - Reaching.
(WIDA, 2016). A student’s proficiency level is presented as a whole number followed by
a decimal. The whole number is the student’s language proficiency level based on the
WIDA standards. The decimal represents the proportion with the proficiency level range.
The proficiency levels will also report what a student can do given their level. For
example, a proficiency score of 3.5, half way between 3.0 and 4.0, indicates the student is
half way between the levels of developing and expanding. In order to accurately assess a
student’s growth, the first assessment stands as a baseline score. Therefore, the second
and subsequent results from yearly assessment will provide an opportunity to examine a
trend for each student. An ELL student is recommended for exiting services when their
score is 4.5 or higher. After this point, the student is then monitored for a period of two
years.
American College Testing (ACT)
The American College Testing (ACT) currently serves as a measure of college
readiness for high school students. A student’s score relates to the skills needed to be
successful beyond high school. Presently, the benchmark score is the minimum score
needed on the ACT, in a particular subject, that suggests a 50% change of obtaining a B
or higher or a 75% chance of obtaining a C or higher in a corresponding credit bearing
college course. The benchmark scores came from actual performance of students in
college (ACT, 2014). The national average composite score is 21.

COLLEGE READINESS OF GRADUATING ELLs IN UTAH PUBLIC SCHOOLS
52
Students are assessed in four subject areas: English, Math, Reading, and Natural
Sciences. The English section contains 75 questions with a 45-minute time limit. The
English section measures written English skills. The math section contains 60 questions
with a 60-minute time limit. The math section measures mathematical skills that have
been acquired through courses taken up to grade 12. The reading section contains 40
questions and a 35-minute time limit. The reading section measures reading
comprehension. The science section contains 40 questions with a time limit of 35
minutes. The science section measures the ability to the interpretation, analysis, reasoning
and problem solving skills required in science. An optional written component of one
prompt and 40 minutes is provided. The written component measures writing skills
emphasized in high school and in entry level college composition courses.
The ACT College Readiness Benchmarks served as the dependent variable in this
study. Once a student has taken the test, a composite score, or average of all four tests is
calculated, as the students overall ACT score. The scores range from 1 (low) to 36 (high).
The minimum benchmark scores for each subject are: English, 18; Math, 22; Reading,
22; and Science, 23. These are the minimum scores required on each subject test on the
ACT for a student to be deemed as having a high probability of success in credit bearing
courses. These minimum scores serve as predictors of how students perform
academically. In other words, the scores represent the typical, lowest level a student may
obtain to possibly score a C or higher in a first year, credit bearing course in college
(ACT, 2016).

COLLEGE READINESS OF GRADUATING ELLs IN UTAH PUBLIC SCHOOLS
53
Data Collection and Analysis
The data collected came from one western mountain state, Utah. The number of
ELL students taking the ACT was 1,013. Those students self-identified as sophomores,
juniors, or seniors who were scheduled to graduate in 2015. The ACT scored serve as the
dependent variable. The independent variables for this study were English language
learners gender, language proficiency levels, and free and reduced lunch status.
As previously discussed in Chapter One, there is a growing number of ELL
students in the United States is. Many ELL children live in homes where English is not
the primary language. The study questioned the college readiness of high school English
language learner graduates utilizing ACT scores. The design consisted of using
descriptive methods. Specifically, the researcher reported percentages, means, and
frequencies describe the college readiness of English Learners. Results were
disaggregated by gender and English proficiency levels. Further analysis included Chi-
Square tests independence between college readiness and gender and English proficiency
level, and free or reduced lunch status.
Limitations
There are several limitations recognized in this study. The first limitation in this
study was the sample size only focusing on one state. This factors may limit the ability to
generalize. The results may not be representative of all western states with similar
conditions. The data received from this state may also contain thousands of errors. The
researcher used the data provided and report it accurately, with the understanding that the
data received may contain multiple errors. The researcher hoped the data will be used to

COLLEGE READINESS OF GRADUATING ELLs IN UTAH PUBLIC SCHOOLS
54
further assist with developmentally appropriate instruction for ELL students. The results
may not be representative of all western states with similar conditions.
The second limitation is the reliability of assessing language proficiency levels.
Students are tested on what they have learned each year. The assessment questions could
contain content and vocabulary the students have not yet mastered. Another factor is the
ACCESS test format does not mirror classroom based assessments. The ACCESS tests
contain images with teacher directed prompts, which does not mirror classroom
assessments. This format difference could impede understanding.
A third limitation questions the fact that does the ACT assessment take into
consideration native language proficiency levels. Presently, there is no form of ACT
administered in others languages. ACT is using language that is meant to measure how a
student will perform in an American university. Administering this assessment in a
different language would not benefit universities in determining a student’s college
readiness in an American university. A student’s language proficiency level, especially a
student entering an American school during the high school years, may be a limitation in
this study.
A fourth limitation would be the timing of when an ELL student enters an
American school. The data provided information on when each student was identified as
an English learner. Therefore, the amount of time spent in an American school, before
taking the ACT, may be a limitation in this study.
In conclusion, despite these limitations there is much to be learned from this
quantitative study. The data collected served to examine the college readiness of ELL
students in one western mountain state. While this is a generalization, the data showed a

COLLEGE READINESS OF GRADUATING ELLs IN UTAH PUBLIC SCHOOLS
55
deficiency in ELL student obtaining college readiness that needs to be addressed. Future
researchers will be able to collect similar data and to make comparisons within the
western states with similar demographics in the United States.

COLLEGE READINESS OF GRADUATING ELLs IN UTAH PUBLIC SCHOOLS
56
CHAPTER 4: OVERVIEW OF FINDINGS
This chapter will present the quantitative results which examined four research
questions that pertained to the college readiness of Utah’s 2015 graduating ELL students
who took the ACT. This research was designed to assess the college readiness of
graduating ELL students. The first research question studied the overall readiness of the
English learner. Questions two through four examined the connection between college
readiness and three factors: gender, language proficiency levels, and free or reduced
lunch status. The results of this study were used to determine if a relationship exists
between the selected variables for the English language learner high school graduate and
the ACT benchmark scores for college readiness. The analysis of this study led to the
findings that many ELL students are graduating high school and are not college ready.
The results of those questions are presented in this chapter.
Participants
The participants in this sample consist of 668 high school English language
learners graduates from Utah. The 2015 graduating class for the state of Utah consisted of
1,413 English language students. When examining the ACT test scores; the data reflected
that only 668 English language students took the ACT. Therefore, there are unaccounted
for students. It is possible that those students dropped out of school or chose not to take
ACT.

COLLEGE READINESS OF GRADUATING ELLs IN UTAH PUBLIC SCHOOLS
57
College Readiness Percentage of English Language Learners
Research Question One
How are English language learner graduates performing in terms of college readiness?
Presently, the national average ACT composite score is 21 (ACT, 2014). To be
considered college ready, ACT sets the individual content scores at: English, 18; Math,
22; Reading, 22; and Science, 23. In Table 4.1, the mean ACT scores for 688 graduating
Utah ELL students are presented. The overall composite score was 14.51 (SD = 3.19),
falling well below the national average score of 21. In comparison, those students who
took the ACT, but were not identifying as English learners earned an overall composite
score of 21.38 (SD = 5.03), yielding a six-point difference. Table 4.6 contains data
showing the college readiness of ELL graduates based on the number of benchmarks
attained. This data indicated that 2.5% of this sample obtained proficient on 3 or more of
the ACT benchmarks, making them college ready. In contrast, 88% of the sample did not
score proficient in any of the tested areas.
A comparison of mean scores between ELL students and native English speakers
reflected that ELL students scored significantly lower. The ELL students’ mean score in
English was 12.02 (SD = 4.28), as compared to their English speaking peers who scored
20.8 (SD = 6.26), The percentage of college ready ELL students in English was 9%,
compared to 68.4% of their English speaking peers were college ready (see Table 4.2). In
the area of math, the ELL students’ mean score was 15.76 (SD = 3.07), as compared to
their English speaking peers who scored 20.9 (SD = 5.02). The percentage of college
ready ELL students’ in math was 6.0%, compared to 44.4% of their English speaking
peers who were college ready (see Table 4.3). In reading, the ELL students’ mean score

COLLEGE READINESS OF GRADUATING ELLs IN UTAH PUBLIC SCHOOLS
58
was 14.41 (SD = 3.88), as compared to their English speaking peers who scored 22.13
(6.15). The percentage of college ready ELL students in reading was 4.5%, as compared
to 48.5% of their English speaking peers who were college ready (see Table 4.4). Finally,
in the area of science, the ELL students mean score was 15.66 (SD = 3.88), as compared
to their English speaking peer who scored 21.61 (SD = 4.85). The percentage of college
ready ELL students in science was 4.2%, as compared to 41.3% of their English speaking
peers who were college ready (see Table 4.5).
Table 4.1
Mean ACT Scores of English Language Learner Graduates
Tables 4.2-4.5 reported the college readiness percentiles for English, math,
reading, and science for ELL and non-ELL students. In each table, percentages are given
to demonstrate the absence of college readiness for the 668 Utah graduating student in
this study. In the tested area of English, 91.0% of ELL students were identified as not
English Language
Learner
ACT
Composite
Score
ACT English
Score
ACT Math
Score
ACT Reading
Score
ACT
Science
Score
No Mean 21.38 20.83 20.96 22.13 21.61
N 28140 28140 28140 28140 28140
Std. Deviation 5.039 6.267 5.025 6.154 4.854
Yes Mean 14.51 12.02 15.76 14.41 15.66
N 668 668 668 668 668
Std. Deviation 3.190 4.282 3.076 3.889 3.880
Total Mean 21.22 20.63 20.84 21.95 21.47
N 28808 28808 28808 28808 28808
Std. Deviation 5.109 6.367 5.049 6.221 4.915

COLLEGE READINESS OF GRADUATING ELLs IN UTAH PUBLIC SCHOOLS
59
being college ready. In comparison to English speakers, 31.6% were identified as not
college ready. Table 4.2 specifically shows the college readiness percentiles for ELL
students.
Table 4.2
College Ready in English by English Language Learner
College Ready English
Total No Yes
English Language
Learner
No
Count 8903 19237 28140
% within English
Language Learner
31.6% 68.4% 100.0%
Yes
Count 608 60 668
% within English
Language Learner
91.0% 9.0% 100.0%
Total
Count 9511 19297 28808
% within English
Language Learner
33.0% 67.0% 100.0%
The data in Table 4.3 provides information on the math portion of the ACT. The data
showed of the 668 students who took the math, 40 (94%) were considered not college
ready. Unfortunately, the data also reflected that 15,650 (55.6%) of non-ELL students
were also not college ready.

COLLEGE READINESS OF GRADUATING ELLs IN UTAH PUBLIC SCHOOLS
60
Table 4.3
College Ready in Math by English Language Learner
College Ready Math Total
No Yes
English
Language
Learners
No
Count 15650 12490 28140
% within English
Language Learner
55.6% 44.4% 100.0%
Yes
Count 628 40 668
% within English
Language Learner
94.0% 6.0% 100.0%
Total
Count 16278 12530 28808
% within English
Language Learner
56.5% 43.5% 100.0%
In the tested area of reading, 638 ELL students (95.5%) were not college ready in.
In contrast, 14, 498 native English speakers (51.5%) were identified as not college ready.
Table 4.4 provides data that demonstrates the lack of college readiness of graduating
English language learners.

COLLEGE READINESS OF GRADUATING ELLs IN UTAH PUBLIC SCHOOLS
61
Table 4.4
College Ready in Reading by English Language Learner
College Ready Reading Total
No Yes
English
Language
Learners
No
Count 14498 13642 28140
% within English
Language Learner
51.5% 48.5% 100.0%
Yes
Count 638 30 668
% within English
Language Learner
95.5% 4.5% 100.0%
Total
Count 15136 13672 28808
% within English
Language Learner
52.5% 47.5% 100.0%
In the tested area of science, 95.8% of ELL students, compared to 58.7% of non-
ELL students, tested identified as not college ready. Table 4.5 specifically shows the
college readiness percentiles for science by ELL students.

COLLEGE READINESS OF GRADUATING ELLs IN UTAH PUBLIC SCHOOLS
62
Table 4.5
College Ready in Science by English Language Learner
College Ready Science Total
No Yes
English
Language
Learners
No
Count 16528 11612 28140
% within English
Language Learner
58.7% 41.3% 100.0%
Yes
Count 640 28 668
% within English
Language Learner
95.8% 4.2% 100.0%
Total
Count 17168 11640 28808
% within English
Language Learner
59.6% 40.4% 100.0%
In Table 4.6, percentile scores for obtaining a college readiness benchmark score
for all tested areas for ELL and non-ELL students. Also reported is the break down for
obtaining a college readiness benchmark score in at least 3, 2, 1, or 0 of the tested areas.
The percentage of ELL students who obtained a college readiness score in all 4
tested areas was 1.9%, compared to 29.6% of non-ELL students. The percentage of ELL
students who obtained a college readiness score in at least 3 tested areas was 1.2%,
compared to 13.3% of non-ELL students. 13.3%. The percentage of ELL students who
obtained a college readiness score in at least 2 tested areas was 3.4%, compared to 14%
of non-ELL students. The percentage of ELL students who obtained a college readiness
score in at least 1 tested area was 5.4%, compared to 16.0% of non-ELL students. The
percentage of ELL students who obtained a zero benchmark mark scores in the four
tested areas was 88%, compared to 27% of non-ELL students.

COLLEGE READINESS OF GRADUATING ELLs IN UTAH PUBLIC SCHOOLS
63
Table 4.6
Number of College Readiness Benchmark Attained in 2014
Number of College Ready Benchmarks Attained
2014 Total
0 1 2 3 4
English
Language
Learner
No
Count 7606 4504 3950 3743 8337 28140
% within
English
Language
Learner
27.0% 16.0% 14.0% 13.3% 29.6% 100.0%
Yes
Count 588 36 23 8 13 668
% within
English
Language
Learner
88.0% 5.4% 3.4% 1.2% 1.9% 100.0%
Total
Count 8194 4540 3973 3751 8350 28808
% within
English
Language
Learner
28.4% 15.8% 13.8% 13.0% 29.0% 100.0%
Research Question Two
Are gender and college readiness levels independent of one another for graduating
English language learners?
The sample size for question two consisted of 354 males and 314 females. While
some of the percentages showed females or males outperforming each other, it is
important to remind the reader there are more males than females in this sample. Tables

COLLEGE READINESS OF GRADUATING ELLs IN UTAH PUBLIC SCHOOLS
64
4.7-4.11 examine if there is a statistical significant relationship between gender and
college readiness benchmarks in four tested areas.
The Chi-Square test in Table 4.7 examined the English benchmark for college
readiness by gender. The number of college ready males (N= 30) was 9.6% vs. females
(N= 30) which was 8.5%. The result was 60 students, or 9% of the 668 students met the
English benchmark on ACT. While the percentage of females outperforming the males
was greater there were less females taking the exam. Finally, the data showed there is a
slight statistical difference for the English college readiness benchmark for males vs.
female (χ² (1) = 0.626, p < .05).
Table 4.7
Chi-Square: College Ready in English of English Learners by Gender
Crosstab
College Ready English Total
No Yes
Gender
Female Count 284 30 314
% within Gender 90.4% 9.6% 100.0%
Male Count 324 30 354
% within Gender 91.5% 8.5% 100.0%
Total Count 608 60 668
% within Gender 91.0% 9.0% 100.0%
Chi-Square Tests
Value df Asymp.Sig (2-sided)
Pearson Chi-Square .237 a 1 .626
a. 0 cells (0.0%) have expected count less than 5. The minimum expected count is 28.20.
The Chi-Square test in Table 4.8 examined the math benchmark for college
readiness by gender. The number of college ready males (N= 25) was 7.1% vs. females
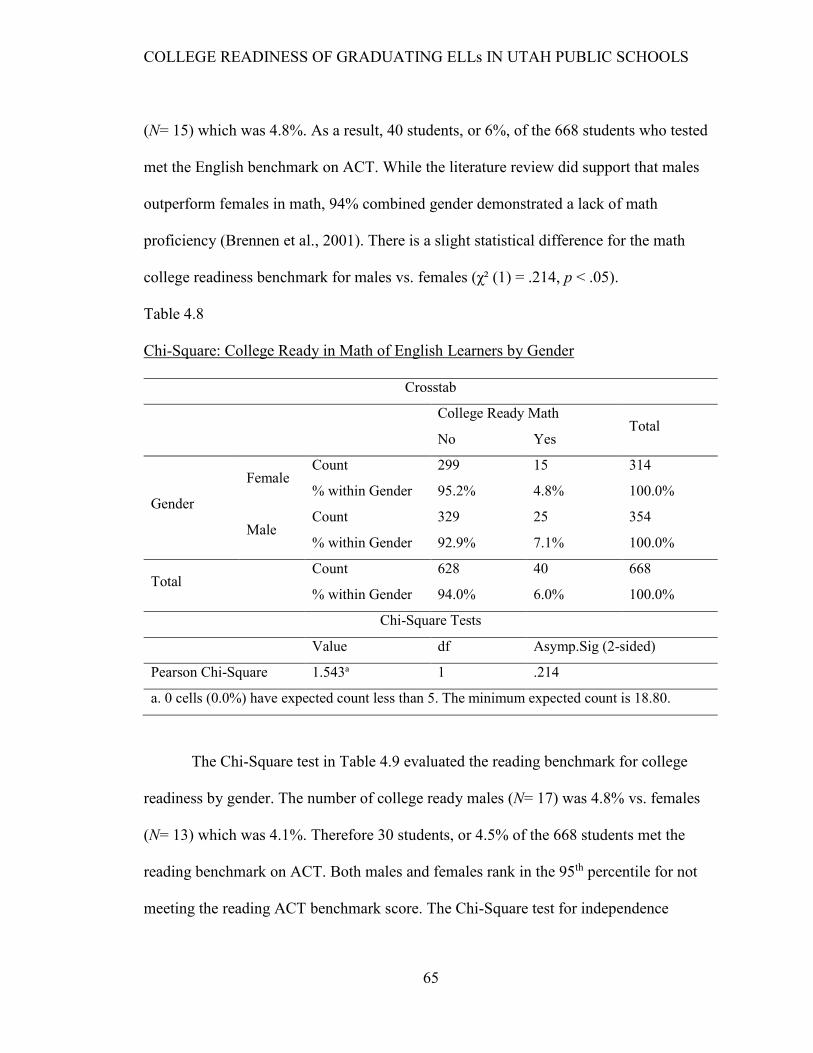
COLLEGE READINESS OF GRADUATING ELLs IN UTAH PUBLIC SCHOOLS
65
(N= 15) which was 4.8%. As a result, 40 students, or 6%, of the 668 students who tested
met the English benchmark on ACT. While the literature review did support that males
outperform females in math, 94% combined gender demonstrated a lack of math
proficiency (Brennen et al., 2001). There is a slight statistical difference for the math
college readiness benchmark for males vs. females (χ² (1) = .214, p < .05).
Table 4.8
Chi-Square: College Ready in Math of English Learners by Gender
Crosstab
College Ready Math Total
No Yes
Gender
Female Count 299 15 314
% within Gender 95.2% 4.8% 100.0%
Male Count 329 25 354
% within Gender 92.9% 7.1% 100.0%
Total Count 628 40 668
% within Gender 94.0% 6.0% 100.0%
Chi-Square Tests
Value df Asymp.Sig (2-sided)
Pearson Chi-Square 1.543a 1 .214
a. 0 cells (0.0%) have expected count less than 5. The minimum expected count is 18.80.
The Chi-Square test in Table 4.9 evaluated the reading benchmark for college
readiness by gender. The number of college ready males (N= 17) was 4.8% vs. females
(N= 13) which was 4.1%. Therefore 30 students, or 4.5% of the 668 students met the
reading benchmark on ACT. Both males and females rank in the 95th percentile for not
meeting the reading ACT benchmark score. The Chi-Square test for independence

COLLEGE READINESS OF GRADUATING ELLs IN UTAH PUBLIC SCHOOLS
66
concluded there is a slight statistical difference for the reading college readiness
benchmark for males vs. females (χ² (1) = .680, p < .05).
Table 4.9
Chi-Square: College Ready in Reading of English Learners by Gender
Crosstab
College Ready Reading Total
No Yes
Gender
Female Count 301 13 314
% within Gender 95.9% 4.1% 100.0%
Male Count 337 17 354
% within Gender 95.2% 4.8% 100.0%
Total Count 638 30 668
% within Gender 95.5% 4.5% 100.0%
Chi-Square Tests
Value df Asymp.Sig (2-sided)
Pearson Chi-Square .170a 1 .680
a. 0 cells (0.0%) have expected count less than 5. The minimum expected count is 14.10.
The Chi-Square test in Table 4.10 evaluated the science benchmark for college
readiness by gender. The number of college ready males (N= 18) was 5.1% vs. females
(N= 10) which was 3.2%. Consequently 28 students, or 4.2% of the 668 students met the
reading benchmark on ACT. Both males and females ranked between the 96-94th
percentile for not meeting the science ACT benchmark score. The data showed a slight
statistical difference for the science college readiness benchmark for males vs. females
(χ² (1) = 0.221, p < .05).

COLLEGE READINESS OF GRADUATING ELLs IN UTAH PUBLIC SCHOOLS
67
Table 4.10
Chi-Square: College Ready in Science of English Learners by Gender
Crosstab
College Ready Science Total
No Yes
Gender
Female Count 304 10 314
% within Gender 96.8% 3.2% 100.0%
Male Count 336 18 354
% within Gender 94.9% 5.1% 100.0%
Total Count 640 28 668
% within Gender 95.8% 4.2% 100.0%
Chi-Square Tests
Value df Asymp.Sig (2-sided)
Pearson Chi-Square 1.496a 1 .221
a. 0 cells (0.0%) have expected count less than 5. The minimum expected count is 13.16.
The number of college ready benchmark scores attained by English learners based
on gender are provided in Table 4.11. A Chi-Square test revealed that 1.5% (N= 5)
females and 2.3% (N= 8) males obtained benchmark scores in all four tested areas. On
three college readiness benchmark tested area only 0.6% (N= 2) females and 1.7% (N= 6)
males attained proficient scores. The percentage of students scoring readiness in two
benchmark content areas were 3.5% (N= 11) females and 3.4% (N= 12) males. The
percentage of students score readiness in one benchmark content area was 6.4% (N= 20)
females and 4.5% (N= 16) males. The percentage of students who scored readiness in
zero content areas of the ACT was 87.9% (N= 275) females and 88.1% (N= 312) males.
The data reflected the there is a statistical difference for the college readiness benchmark

COLLEGE READINESS OF GRADUATING ELLs IN UTAH PUBLIC SCHOOLS
68
for males vs. females on the number of college ready benchmark scores attained in 2014
(χ² (4) = 0.558, p < .05).
Table 4.11
Chi-Square: Number of College Ready Benchmarks Attained by English Learners by
Gender
Crosstab
Number of College Ready Benchmarks
Attained 2014 Total
0 1 2 3 4
Gender
Female Count 276 20 11 2 5 314
% within Gender 87.9% 6.4% 3.5% 0.6% 1.6% 100.0%
Male Count 312 16 12 6 8 354
% within Gender 88.1% 4.5% 3.4% 1.7% 2.3% 100.0%
Total Count 588 36 23 8 13 668
% within Gender 88.0% 5.4% 3.4% 1.2% 1.9% 100.0%
Chi-Square Tests
Value df Asymp.Sig (2-sided)
Pearson Chi-
Square
3.000a 4 .558
a. 2 cells (20.0%) have expected count less than 5. The minimum expected count is 3.76
Research Question Three
Are language proficiency levels and college readiness levels independent of one another
for graduating English language learner?
The variable of language proficiency levels and college readiness is presented in
Table 4.12. The mean composite scores for graduating ELL students are reported for each
of the five English language proficiency levels, including students who fall into the

COLLEGE READINESS OF GRADUATING ELLs IN UTAH PUBLIC SCHOOLS
69
Monitored Status and Native English speakers. The mean ACT score for each tested area
(English, Math, Reading, and Science) is also reported for each English proficiency level.
The Entering Level, Level 1 or lowest level, revealed a mean ACT Composite
score of 13.36 (SD= 1.43) for 11 ELL students. In English, the mean ACT score was
11.55 (SD= 2.65). In math, the mean ACT score was14.27 (SD= .78). In reading, the
mean ACT score was 13.73 (SD= 2.79). In science, the mean ACT science score was
13.82 (SD= 2.85).
At the Beginning Level, Level 2, mean ACT composite score for 38 ELL students
was 12.79 (SD= 2.04). In English, the mean ACT score was 10.03 (SD= 2.83). In math,
the mean ACT score was 14.21 (SD= 1.67). In reading, the mean ACT score was 12.47
(SD= 2.78). In science, the mean ACT score was 14.31 (SD = 3.66).
At the Developing Level, Level 3, mean ACT composite score for 123 ELL
students was 13.05 (SD= 1.83). In English, the mean ACT score was 10.03 (SD= 2.39).
In math, the mean ACT score was 14.80 (SD= 2.03). In reading, the mean ACT score was
12.84 (SD= 2.82). In science, the mean ACT score was 14.17 (SD= 3.09).
At the Expanding Level, Level 4, mean ACT composite score for 136 ELL
students was 13.54 (SD= 1.95). In English, the mean ACT score was 10.84 (SD= 2.78).
In math, the mean ACT score was 15.12 (SD= 1.53). In reading, the mean ACT score was
13.43 (SD= 3.05). In science, the mean ACT was 14.70 (SD= 3.51).
At the Bridging Level, Level 5 or highest level before exiting ELL services, the
mean ACT composite score for 61 ELL students was 15.38 (SD= 2.49). In English, the
mean ACT score was 12.93 (SD= 3.50). In math, the mean ACT score was 16.59 (SD=

COLLEGE READINESS OF GRADUATING ELLs IN UTAH PUBLIC SCHOOLS
70
2.98). In reading, the mean ACT score was 14.90 (SD= 3.82). In science, the mean ACT
score was 16.93 (SD= 3.42).
For the purpose of comparison, there were 301 students in the Monitored status
whose composite ACT was 15.65 (SD= 3.82). These are students who tested out of
receiving ELL services, but remain in a monitored status for 2 years. The 301 students
are part of the sample of 668. In addition, there were 28, 138 Native English Speakers
who received a composite ACT score of 21.38 (SD= 5.03). This category was included to
provide context to the question of are English proficiency levels and college readiness
independent of each other.
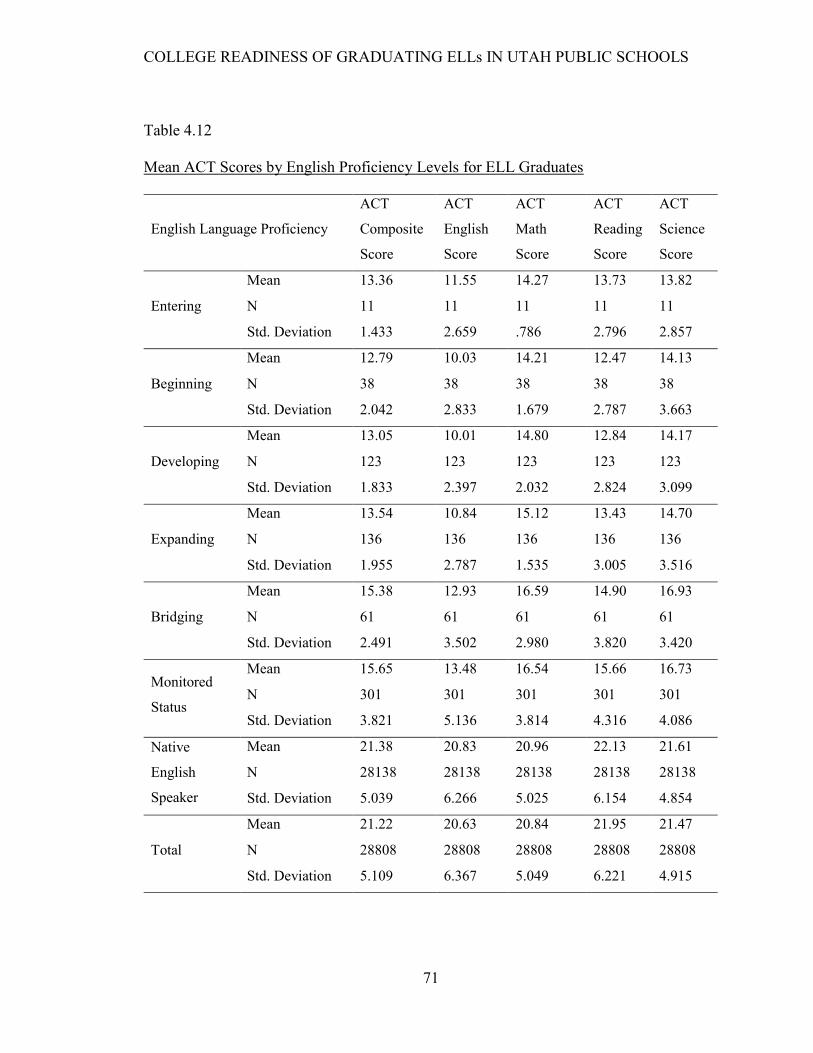
COLLEGE READINESS OF GRADUATING ELLs IN UTAH PUBLIC SCHOOLS
71
Table 4.12
Mean ACT Scores by English Proficiency Levels for ELL Graduates
English Language Proficiency
ACT
Composite
Score
ACT
English
Score
ACT
Math
Score
ACT
Reading
Score
ACT
Science
Score
Entering
Mean 13.36 11.55 14.27 13.73 13.82
N 11 11 11 11 11
Std. Deviation 1.433 2.659 .786 2.796 2.857
Beginning
Mean 12.79 10.03 14.21 12.47 14.13
N 38 38 38 38 38
Std. Deviation 2.042 2.833 1.679 2.787 3.663
Developing
Mean 13.05 10.01 14.80 12.84 14.17
N 123 123 123 123 123
Std. Deviation 1.833 2.397 2.032 2.824 3.099
Expanding
Mean 13.54 10.84 15.12 13.43 14.70
N 136 136 136 136 136
Std. Deviation 1.955 2.787 1.535 3.005 3.516
Bridging
Mean 15.38 12.93 16.59 14.90 16.93
N 61 61 61 61 61
Std. Deviation 2.491 3.502 2.980 3.820 3.420
Monitored
Status
Mean 15.65 13.48 16.54 15.66 16.73
N 301 301 301 301 301
Std. Deviation 3.821 5.136 3.814 4.316 4.086
Native
English
Speaker
Mean 21.38 20.83 20.96 22.13 21.61
N 28138 28138 28138 28138 28138
Std. Deviation 5.039 6.266 5.025 6.154 4.854
Total
Mean 21.22 20.63 20.84 21.95 21.47
N 28808 28808 28808 28808 28808
Std. Deviation 5.109 6.367 5.049 6.221 4.915

COLLEGE READINESS OF GRADUATING ELLs IN UTAH PUBLIC SCHOOLS
72
Table 4.13 provides the college readiness English scores of ELL graduates based
on language proficiency. On the English portion of the ACT assessment, 60 (9.0%)
students of the 668 showed English proficiency levels on the ACT assessment did not
impact college readiness. Consequently, 91% of the students in this sample were affected
at some level by their English proficiency on the English portion of the ACT assessment.
The Chi-Square test data shows there is a relationship between a student’s English
proficiency levels and obtaining proficiency on the English portion of the ACT (χ² (1) =
0.000, p < .05).
Table 4.13
Chi-Square: College Ready English by English Proficiency Level
Crosstab
College Ready
English
Total No Yes
English Language
Proficiency
Entering Count 11 0 11
% within English
Language
Proficiency
100.0% 0.0% 100.0%
Beginning Count 37 1 38
% within English
Language
Proficiency
97.4% 2.6% 100.0%
Developing Count 123 0 123
% within English
Language
Proficiency
100.0% 0.0% 100.0%

COLLEGE READINESS OF GRADUATING ELLs IN UTAH PUBLIC SCHOOLS
73
Table 4.13 (continued)
Crosstab
College Ready
English
Total No Yes
English Language
Proficiency
Expanding Count 131 4 135
% within English
Language
Proficiency
97.0% 3.0% 100.0%
Bridging Count 56 4 60
% within English
Language
Proficiency
93.3% 6.7% 100.0%
Monitored
Status
Count 250 51 301
% within English
Language
Proficiency
83.1% 16.9% 100.0%
Total Count 608 60 668
% within English
Language
Proficiency
91.0% 9.0% 100.0%
Chi-Square Tests
Value df Asymp. Sig. (2-sided)
Pearson Chi-Square 44.812a 5 .000
a. 2 cells (16.7%) have expected count less than 5. The minimum expected count is .99.
In Table 4.14, the math portion of the ACT assessment revealed that 40 (6.0%)
students of the 668 showed English proficiency levels on the ACT assessment did not
impact college readiness. Therefore, 94% of the students in this sample were affected at
some level by their English proficiency on the math portion of the ACT assessment. The

COLLEGE READINESS OF GRADUATING ELLs IN UTAH PUBLIC SCHOOLS
74
Chi-Square test revealed there is a relationship between a student’s English proficiency
levels and obtaining proficiency on the math portion of the ACT (χ² (5) = 0.001, p < .05).
Table 4.14
Chi-Square: College Ready Math by English Proficiency Level
Crosstab
College Ready Math
Total No Yes
English Language
Proficiency
Entering Count 11 0 11
% within English
Language
Proficiency
100.0% 0.0% 100.0%
Beginning Count 38 0 38
% within English
Language
Proficiency
100.0% 0.0% 100.0%
Developing Count 119 4 123
% within English
Language
Proficiency
96.7% 3.3% 100.0%
Expanding Count 134 1 135
% within English
Language
Proficiency
99.3% 0.7% 100.0%

COLLEGE READINESS OF GRADUATING ELLs IN UTAH PUBLIC SCHOOLS
75
Table 4.14 (continued)
Crosstab
College Ready Math
Total No Yes
English Language
Proficiency
Bridging Count 53 7 60
% within English
Language
Proficiency
88.3% 11.7% 100.0%
Monitored
Status
Count 273 28 301
% within English
Language
Proficiency
90.7% 9.3% 100.0%
Total Count 628 40 668
% within English
Language
Proficiency
94.0% 6.0% 100.0%
Chi-Square Tests
Value df Asymp. Sig. (2-sided)
Pearson Chi-Square 20.670a 5 .001
a. 3 cells (25.0%) have expected count less than 5. The minimum expected count is .66.
Table 4.15 shows the results of the reading portion of the ACT assessment. Thirty
(4.5%) students of the 668 showed English proficiency levels on the ACT assessment did
not impact college readiness. Therefore, 95.5% of the students in this sample were
affected at some level by their English proficiency on the reading portion of the ACT
assessment. The Chi-Square test found that there is a relationship between a student’s
English proficiency levels and obtaining proficiency on the reading portion of the ACT
(χ² (1) = 0.061, p < .05).

COLLEGE READINESS OF GRADUATING ELLs IN UTAH PUBLIC SCHOOLS
76
Table 4.15
Chi-Square: College Ready Reading by English Proficiency Level
Crosstab
College Ready Reading
Total No Yes
English Language
Proficiency
Entering Count 11 0 11
% within English
Language
Proficiency
100.0% 0.0% 100.0%
Beginning Count 37 1 38
% within English
Language
Proficiency
97.4% 2.6% 100.0%
Developing Count 121 2 123
% within English
Language
Proficiency
98.4% 1.6% 100.0%
Expanding Count 132 3 135
% within English
Language
Proficiency
97.8% 2.2% 100.0%
Bridging Count 58 2 60
% within English
Language
Proficiency
96.7% 3.3% 100.0%
Monitored
Status
Count 279 22 301
% within English
Language
Proficiency
92.7% 7.3% 100.0%

COLLEGE READINESS OF GRADUATING ELLs IN UTAH PUBLIC SCHOOLS
77
Table 4.15 (continued)
Crosstab
College Ready Reading
Total No Yes
Total Count 638 30 668
% within English
Language
Proficiency
95.5% 4.5% 100.0%
Chi-Square Tests
Value df Asymp. Sig. (2-sided)
Pearson Chi-Square 10.557a 5 .061
a. 3 cells (25.0%) have expected count less than 5. The minimum expected count is .49.
Table 4.16 provides the college readiness science scores based on English
proficiency. On the science portion of the ACT assessment, 28 (4.2%) students of the 668
showed English proficiency levels on the ACT assessment did not impact college
readiness. The remaining 95.8% of the students in this sample were affected at some level
by their English proficiency on the science portion of the ACT assessment. The Chi-
Square test finding show that there is a relationship between a student’s English
proficiency levels and obtaining proficiency on the science portion of the ACT (χ² (5) =
0.002, p < .05).

COLLEGE READINESS OF GRADUATING ELLs IN UTAH PUBLIC SCHOOLS
78
Table 4.16
Chi-Square: College Ready Science by English Proficiency Level
Crosstab
College Ready Science
Total No Yes
English Language
Proficiency
Entering Count 11 0 11
% within English
Language
Proficiency
100.0% 0.0% 100.0%
Beginning Count 37 1 38
% within English
Language
Proficiency
97.4% 2.6% 100.0%
Developing Count 123 0 123
% within English
Language
Proficiency
100.0% 0.0% 100.0%
Expanding Count 134 1 135
% within English
Language
Proficiency
99.3% 0.7% 100.0%
Bridging Count 57 3 60
% within English
Language
Proficiency
95.0% 5.0% 100.0%
Monitored
Status
Count 278 23 301
% within English
Language
Proficiency
92.4% 7.6% 100.0%

COLLEGE READINESS OF GRADUATING ELLs IN UTAH PUBLIC SCHOOLS
79
Table 4.16 (continued)
Crosstab
College Ready Science
Total No Yes
Total Count 640 28 668
% within English
Language
Proficiency
95.8% 4.2% 100.0%
Chi-Square Tests
Value df Asymp. Sig. (2-sided)
Pearson Chi-Square 19.113a 5 .002
a. 3 cells (25.0%) have expected count less than 5. The minimum expected count is .46.
The number of college ready benchmark scores are sorted by language
proficiency levels in Table 4.17. A Chi square test revealed that at the entering level (N=
11) 0% of ELL students obtained proficient benchmark scores in all four tested areas. At
the Beginning level (N= 38), 2.6% of ELL students attained college readiness proficiency
on three college readiness benchmark tested areas. The remaining 97.4% were not
proficient in any tested area.
At the Developing level (N= 123), 0.8% (1 student) was proficient in two tested
areas, 3.3% (4 students), was proficient in one tested area, and 95.9% were not proficient
in any tested areas. In the Expanding level (N= 130), 0.7% (1 student) was proficient in
three tested areas, 1.5% (2 students) were proficient in two tested areas, 1.5% (2 students)
were proficient in one tested area, and 96.3% were not proficient in any tested area.
At the Bridging level (N= 60), 8.3% (5 students) were proficient in two tested
areas, 10% (6 students) were proficient in one tested areas, and 81.7% were not proficient

COLLEGE READINESS OF GRADUATING ELLs IN UTAH PUBLIC SCHOOLS
80
in any tested area. In the category of Monitored Status (N= 301), 80.7% were not
proficient in any tested area, with only 4.3% achieving proficiency in all four tested
areas. The Chi-square test produced a p-value of 0.000 showing there is a significant
association between language proficiency levels and reaching college readiness
benchmark scores (χ² (20) = 0.000 p < .05).
Table 4.17
Chi-Square: Number of College Ready Benchmarks Attained by English Proficiency
Level
Crosstab
Number of College Ready Benchmarks
Attained 2014 Total
0 1 2 3 4
English
Language
Proficiency
Entering Count 11 0 0 0 0 11
% within
English
Language
Proficiency
100.0% 0.0% 0.0% 0.0% 0.0% 100.0%
Beginning Count 37 0 0 1 0 38
% within
English
Language
Proficiency
97.4% 0.0% 0.0% 2.6% 0.0% 100.0%
Developing Count 118 4 1 0 0 123
% within
English
Language
Proficiency
95.9% 3.3% 0.8% 0.0% 0.0% 100.0%

COLLEGE READINESS OF GRADUATING ELLs IN UTAH PUBLIC SCHOOLS
81
Table 4.17 (continued)
Crosstab
Number of College Ready Benchmarks
Attained 2014 Total
0 1 2 3 4
English
Language
Proficiency
Expanding Count 130 2 2 1 0 135
% within
English
Language
Proficiency
96.3% 1.5% 1.5% 0.7% 0.0% 100.0%
Bridging Count 49 6 5 0 0 60
% within
English
Language
Proficiency
81.7% 10.0% 8.3% 0.0% 0.0% 100.0%
Monitored
Status
Count 243 24 15 6 13 301
% within
English
Language
Proficiency
80.7% 8.0% 5.0% 2.0% 4.3% 100.0%
Total Count 588 36 23 8 13 668
% within
English
Language
Proficiency
88.0% 5.4% 3.4% 1.2% 1.9% 100.0%
Chi-Square Tests
Value df Asymp. Sig. (2-sided)
Pearson Chi-
Square
50.741a 20 .000
a. 19 cells (63.3%) have expected count less than 5. The minimum expected count is .13.

COLLEGE READINESS OF GRADUATING ELLs IN UTAH PUBLIC SCHOOLS
82
Research Question Four
Is the free or reduced lunch status and college readiness level independent of one another
for graduating English language learners?
The effect of free or reduced lunch status and obtaining college readiness in
English is examined in Table. 4.18. In this sample, 369 ELL students identified as having
free or reduced lunch status and 299 ELL students identified as not receiving free or
reduced lunch.
On the English portion of the ACT assessment, within that category of free or
reduced lunch status, 93.7% (N= 343) were not college ready. By comparison, 88.6% (N=
265) ELL students in the sample, who do not qualify for free or reduced lunch status,
were not college ready either. The Chi-Square p-value was .052 indicating that in this
sample, there is an association between low income ELL student and being college ready
(χ² (1) = 0.052, p < .05).
Table 4.18
Chi-Square: College Ready in English of English Learners by Free/Reduced Lunch
Status
Crosstab
College Ready English
Total No Yes
Low Income No Count 265 34 299
% within Low Income 88.6% 11.4% 100.0%
Yes Count 343 26 369
% within Low Income 93.0% 7.0% 100.0%

COLLEGE READINESS OF GRADUATING ELLs IN UTAH PUBLIC SCHOOLS
83
Table 4.18 (continued)
Crosstab
College Ready English
Total No Yes
Total Count 608 60 668
% within Low Income 91.0% 9.0% 100.0%
Chi-Square Tests
Value df Asymp. Sig. (2-sided)
Pearson Chi-Square 3.779a 1 .052
a. 0 cells (0.0%) have expected count less than 5. The minimum expected count is 26.86.
The effect of free or reduced lunch status and obtaining college readiness in math
is examined in Table 4.19. On the math portion of the ACT assessment, within the
category of free or reduced lunch status, 95.7% (N= 353) were not college ready. By
comparison, 92% (N= 275) of ELL students in the sample, who do not qualify for free or
reduced lunch status, were not college ready either. The Chi-Square p-value was .046
indicating that in this sample, there may be an association between low income ELL
student and being college ready in math (χ² (1) = 0.046, p < .05).

COLLEGE READINESS OF GRADUATING ELLs IN UTAH PUBLIC SCHOOLS
84
Table 4.19
Chi-Square: College Ready in Math of English Learners by Free/Reduced Lunch Status
Crosstab
College Ready Math
Total No Yes
Low Income No Count 275 24 299
% within Low Income 92.0% 8.0% 100.0%
Yes Count 353 16 369
% within Low Income 95.7% 4.3% 100.0%
Total Count 628 40 668
% within Low Income 94.0% 6.0% 100.0%
Chi-Square Tests
Value df Asymp. Sig. (2-sided)
Pearson Chi-Square 3.996a 1 .046
a. 0 cells (0.0%) have expected count less than 5. The minimum expected count is 17.90.
The effect of free or reduced lunch status and obtaining college readiness in
reading is examined in Table 4.20. On the reading portion of the ACT assessment, within
the category of free or reduced lunch status, 95.7% (N= 353) were not college ready. By
comparison, 95.3% (N= 285) of ELL students in the sample, who do not qualify for free
or reduced lunch status, were not college ready either. The Chi-Square p-value was .830
indicating that in this sample, there is a strong association between a low income ELL
student and being college ready in reading (χ² (1) = 0.830, p < .05).

COLLEGE READINESS OF GRADUATING ELLs IN UTAH PUBLIC SCHOOLS
85
Table 4.20
Chi-Square: College Ready in Reading of English Learners by Free/Reduced Lunch
Status
Crosstab
College Ready Reading
Total No Yes
Low Income No Count 285 14 299
% within Low Income 95.3% 4.7% 100.0%
Yes Count 353 16 369
% within Low Income 95.7% 4.3% 100.0%
Total Count 638 30 668
% within Low Income 95.5% 4.5% 100.0%
Chi-Square Tests
Value df Asymp. Sig. (2-sided)
Pearson Chi-Square .046a 1 .830
a. 0 cells (0.0%) have expected count less than 5. The minimum expected count is 13.43.
The effect of free or reduced lunch status and obtaining college readiness in
science is examined in Table 4.21. On the science portion of the ACT assessment, within
the category of free or reduced lunch status, 96.7% (N= 357) were not college ready. By
comparison, 94.6% (N= 283) of ELL students in the sample, who do not qualify for free
or reduced lunch status, were not college ready either. The Chi-Square p-value was .178
indicating that in this sample, there is an association between a low income ELL student
and being college ready in science (χ² (1) = 0.178, p < .05).

COLLEGE READINESS OF GRADUATING ELLs IN UTAH PUBLIC SCHOOLS
86
Table 4.21
Chi-Square: College Ready in Science of English Learners by Free/Reduced Lunch
Status
Crosstab
College Ready Science
Total No Yes
Low Income No Count 283 16 299
% within Low Income 94.6% 5.4% 100.0%
Yes Count 357 12 369
% within Low Income 96.7% 3.3% 100.0%
Total Count 640 28 668
% within Low Income 95.8% 4.2% 100.0%
Chi-Square Tests
Value df Asymp. Sig. (2-sided)
Pearson Chi-Square 1.812a 1 .178
a. 0 cells (0.0%) have expected count less than 5. The minimum expected count is 12.53.
Synopsis of English Language Learners and College Readiness
This study was conducted to determine the college readiness of English language
learners. The determination for this study was based on student ACT scores. Further
analysis looked into three variables: gender, language level proficiency, and free or
reduced lunch status are markers for college readiness.
Gender, as a variable, did not yield significant differences in student achievement.
However, language proficiency strongly impacted student achievement on the ACT.
Specifically, language proficiency levels in English, reading, and science had higher
significance than math. Overall, only 1.9% of ELL students scored proficient in all tested
areas of the ACT, as shown in Table 4.17. The free or reduced lunch status variable

COLLEGE READINESS OF GRADUATING ELLs IN UTAH PUBLIC SCHOOLS
87
showed less significance being college ready. In other words, in this sample for each
tested area, between 91-95% of students, regardless of their income status, were not
college ready.
The variables used in this study generated results that showed that graduating
ELL students were not scoring college ready on the ACT assessment. This research data
can be useful in support of high school ELL program reform and assist states in making
instructional decisions to support these students.

COLLEGE READINESS OF GRADUATING ELLs IN UTAH PUBLIC SCHOOLS
88
CHAPTER 5: CONCLUSIONS AND DISCUSSION
This chapter will communicate the findings based on the data analysis from
Chapter Four. This chapter will begin with the purpose of this study followed by a
findings summary for each of the four research questions. The next section will include a
discussion of the opportunities for further research to assist ELL students in becoming
college ready. The conclusion will provide final thoughts for policy makers, educators,
and future research. The conclusion will provide final comments.
Purpose of the Study
The purpose of this study to examine the college readiness of graduating English
language learners in one western state. Most studies encompassing English learners focus
on primary grades, where researchers have time to collect data. There are few studies on
high school English language learners because long term studies are not practical. The
goal in studying the college readiness of graduating English learners was to focus on this
underprepared population that is exiting high school.
In this sample, the variables of gender, language proficiency levels, and free or
reduced lunch status were chosen. The objective was to determine if these variables and
college readiness were independent of each other. The overall findings from this study
demonstrate that English language learners are not achieving college readiness by the
time they are taking the ACT in 11th grade. The findings for each research question will
be discussed and include potential areas for further research.
A review of the literature supported that each English language learner enters the
American classroom with diverse English skills. Some enter with little or no education in
English and some are U.S. born but are not fluent in English. Slama (2012) reported that

COLLEGE READINESS OF GRADUATING ELLs IN UTAH PUBLIC SCHOOLS
89
60% of high school ELL students were born in the United States and spent about nine
years in American schools. This is alarming because the findings for this study focused
on high school ELL students and found that ELL students are not college ready at
graduation. If the ACT is a predictor of success in college and ELL students are
graduating without access to college, then their future earnings potential may be bleak.
Summary of Findings
The research focused on four questions to seeking to determine the college
readiness of graduating English learners in one western mountain state. With an increase
in English learners in American schools, the need for research and support in this area is
great. While many studies focused on primary grades and practices, there is little research
directed at the high school ELL students. Therefore, this study sought to contribute to a
high needs student population. The four research questions were:
1. How are English language learner graduates performing in terms of college
readiness?
2. Are gender and college readiness levels independent of one another for
graduating English language learners?
3. Are language proficiency levels and college readiness levels independent of
one another for graduating English language learner?
4. Is the free or reduced lunch status and college readiness level independent of
one another for graduating English language learners?
English Learners and College Readiness
The purpose of the first question, how are English learner graduates performing in
terms of college readiness, was to determine if graduating ELL students were meeting

COLLEGE READINESS OF GRADUATING ELLs IN UTAH PUBLIC SCHOOLS
90
proficiency standards as set by the ACT assessment. This question focused solely on
mean ACT composite scores as the measure of college readiness. The conclusions for this
sample found the mean ACT composite score for graduating ELL students was 14.51, far
below the national average of 21 (ACT, 2014). The ACT consist of four tested areas.
Therefore, this finding required a further look into how this sample scored on individual
portions of the ACT.
The mean score for the English portion of the ACT yielded the lowest score,
12.02. Subsequent mean scores varied slightly between 14 and 15, with math yielding the
highest score, 15.76. While math was higher, the significance was minimal because
students are required to compute word problems, as well as computation problems. The
reality is that ELL students struggle with the academic language that appears in
standardized tests, no matter the content area. Areas such as math and science show a
slightly higher score, but that could be attributed to straight computation or factual
information that does not require inferential skills.
Gender and College Readiness
The second question sought to determine if gender and college readiness were
independent of one another for English learners. The literature review pointed out that
females and males often outperform each other in classroom work. In most studies, the
males were outperforming females in math and females were outperforming males in
English. (Duckworth & Seligman, 2006; Brennen et al., 2001). One study went on to
point out that the female minority was in “double jeopardy” of being an at risk student in
some content areas as a result of being a female and being from an ethic group (Conner &
Vargyas, 2013). In contrast, Hyde (2005) did not find major difference in learning

COLLEGE READINESS OF GRADUATING ELLs IN UTAH PUBLIC SCHOOLS
91
outcomes between males and females. Therefore, this study sought to add to that research
by reviewing mean ACT scores for males versus females.
The sample consisted of 354 males and 314 females. While the number of males
to females is not equal, the results did reflect a p – value of .6 showing there was not
statistical difference in college readiness based on gender. When taking a closer look at
each tested area, females slightly outperformed males in English only. The literature
supported that females generally outperform males in school work. The conclusion drawn
from this study finds that English language learner males are outperforming females on
standardized assessments. The implication for future research would be to closely ask
why there is a disparity between classroom work grades and standardize testing, if class
work is meant to prepare students for standardize testing.
Language Proficiency and College Readiness
The third question sought to discover if language proficiency levels and college
readiness were independent of one another. Students with low language proficiency,
specifically in low academic language proficiency, are at a higher risk of dropping out of
school (Slama, 2012). The literature review stated that language acquisition may take
students several years. However, the high school English learner does not have years to
gain proficiency in academic English. The results of this study reflected that many ELL
students did not achieve benchmark scores on ACT. Therefore, language proficiency is
not independent of college readiness.
For further analysis, question three focused deeper into the five language
proficiency level scores, including students in a monitored status. The goal was to see if
there was a level of language proficiency that was independent of college readiness. The

COLLEGE READINESS OF GRADUATING ELLs IN UTAH PUBLIC SCHOOLS
92
study concluded that in the category of the ACT composite score, no single group
obtained the minimum benchmark score for the ACT. If fact, the scores ranged from 13-
15, five points or more below what is considered the benchmark minimum, as shown in
Table 2.1.
With the ACT composite scores being lower than the benchmark minimum,
scores for individually tested area and each level of English proficiency was evaluated.
The findings concluded that the Bridging level (highest level before exiting services) had
higher mean ACT scores in math (16.59) and science (16.93). This could be attributed to
rote work that is done in content areas such as math and science. In most cases, math and
science questions are straightforward questions seeking factual responses.
At the Entering, Beginning, and Developing language levels (level 1, 2, and 3),
this researcher was surprised to see higher than anticipated math and science ACT mean
scores. In these tested areas, student scores were remained lower than needed to be
considered passing, the scores were 1 -3 points higher than in English. While language is
a barrier, subjects such as math and science are more concrete and require less inferential
thinking, which may be why scores are higher in those areas (as shown in Table 4.12).
The tested area of English remains a challenge for ELL students. Students in the
monitored status, students no longer receiving ELL services, scored a mean of 13. 48. A
troubling finding was that students in the Beginning, Developing, and Expanding levels
(levels, 2, 3, and 4) had mean ACT scores between 10.03 and 10.84. As shown in Table
4.12, those levels are mid-range levels of support and one might think that scores would
show more growth in this area.

COLLEGE READINESS OF GRADUATING ELLs IN UTAH PUBLIC SCHOOLS
93
The English portion of the ACT assess grammar, requires understanding of
rigorous vocabulary, and context of a passage. In some instance, ELL student placement
impedes their access to higher level academic content. Depending on their language
proficiency level and time in a U.S. school, many ELL students will not have adequate
background vocabulary to be successful. Furthermore, passages may be biased to culture
groups or regions in the United States; therefore, the ELL student has little or no context.
In contrast, the mean reading scores for this sample ranged from 13.73 (Entering
level) to 15.66 (Monitored Level). Depending on the passage and background of the ELL
student, some may not have enough background knowledge or exposure to scenarios
displayed in literature. In order to understand context in a story, students need to
exposure to various types of literature, such as various fiction and non-fiction. Then the
classroom teacher works to create background knowledge and have students relate the
connection to some event in their life. Some ELL students, depending on the home
nation’s educational system, they may have little or no access to literature. Fortunately,
this study did reveal that mean scores for this group showed overall growth. Therefore,
how to best educate, specifically high school ELL students, in reading should be an area
for further research.
Free or Reduced Lunch Status and College Readiness
The fourth question examined if a student’s free or reduced lunch status was
independent of college readiness for graduating English learners. Research has shown
that a student’s socioeconomic status has multiple effects on student learning outcomes.
However, when socioeconomic status is coupled with low English proficiency levels, a
heightened disadvantage is added. In the literature review, Scarella (2003) pointed out

COLLEGE READINESS OF GRADUATING ELLs IN UTAH PUBLIC SCHOOLS
94
that poorer communities, with few resources, can make learning the dominant language
problematic. Furthermore, Gold (2006) found that the greater focus is simply graduating
students instead of graduating college ready students. This line of thinking must change if
we want all our graduates to be financially self-sufficient adults.
In the sample, 369 students of the 668 were identified as having free or reduced
lunch status. The data collected reviewed each tested area of the ACT to see if one
subject area was impacted more by poverty than other. The findings from this study show
that about 95% of the students, in all four tested areas, who identify as free or reduced
lunch exited high school did not meet ACT benchmark scores for college readiness.
In contrast, there were 299 ELL students that identified as not being free or
reduced lunch status, who also scored low in all tested areas. In English, 88% tested as
not college ready. This trend for not achieving benchmark scores continues in math
(92%), reading (95%), and science (94%). The assumption here is that while poverty does
play a role in not achieving college readiness, ELL students poor or not are not achieving
college readiness. These findings support the need for more research in programs that
support language proficiency.
Implications for Future Practice and Policy
College readiness for the English language learner is an area that needs
improvement. The analysis of the data indicated that ELL students are not graduating
ready for college, this implication can last a lifetime. The educational challenges for
educators working with high school ELL students will vary. However, to gain positive
educational outcomes, several factors can be evaluated to explore the greatest potential
for growth.

COLLEGE READINESS OF GRADUATING ELLs IN UTAH PUBLIC SCHOOLS
95
The first question, are English learner’s college ready, reported a strong no. While
this study did not focus on curriculum, this study did prove that ELL students in high
school in one western mountain state were not college ready at graduation. The literature
review identified equity in curriculum as a possible barrier to achieving college readiness.
The implication here is that ELL programs are ineffective and reform in how to provide
support should be reexamined. In the areas of reading and English, ELL students may
need more instruction in how to glean meaning from a passage, understanding figurative
language, and other skills that require inferential thinking. While the ELL student needs
instruction in all areas, gaining a language proficiency should be foremost priority.
As evident in Table 4.6, 88% of students were not able to achieve a college ready
benchmark score in any tested areas. While this study demonstrated that students were
not college ready, the study does not have detailed data on time in the United States. With
an influx of refugees, along with other immigrants, the approach to working with English
language students requires further research. Many of the incoming refugees have
experienced interrupted schooling, social and emotional turmoil and need support. While
many will need academic support, social and emotional support to avoid isolation is
something to consider. Schools should seek out mentorship programs to support those
needs and help refugees who resettle in American, feel a part of their community.
While there are many programs to assist the English learner, further research into
how to achieve a higher English proficiency quicker for those students who are entering
middle or high school is needed. Intensive programs are expensive, and immersion is
certainly significant, but graduating students should not be the only goal. That thinking

COLLEGE READINESS OF GRADUATING ELLs IN UTAH PUBLIC SCHOOLS
96
places the burden on society where a high school dropout’s opportunities are few, which
repeats the poverty cycle or worse, a life of crime.
Language Acquisition
This study shed light on the lack of college readiness based on language
proficiency levels. The larger problem for this group is the amount of time it takes to
obtain language and the lack of time they have in acquiring the dominant language. If the
rate of acquiring academic language is longer than the students stays in school, then the
possibility of being college ready at graduation is an impossibility. Therefore, the English
learner may be at a greater risk for living longer in a poverty status. The reality of not
attending college can have a lasting impact on future earnings. The implication for future
practice will require educators and policy makers to seek interventions that support
language acquisition.
The literature review also cites Solorzano’s (2008) claim that inadequacies in
education hinder achievement. More research in the area of specific programs aimed at
high school language acquisition is important that work would benefit thousands. This
study did not look at specific programs, however, the literature did support bilingual
programs (Reyes, 2008). The literature pointed to how schooling in a student’s native
language, along with English, showed grade level performance in as little as four years
(Collier & Thomas, 2001). While staffing schools in multiple languages would be
expensive, policymakers should consider the return on the investment because there is
evidence that supports dual language instruction. While our society is in favor of English
only and acculturation, it is wrong to ask a group to lose their culture completely. The
goal should be to use language and culture to link instruction and academic growth.

COLLEGE READINESS OF GRADUATING ELLs IN UTAH PUBLIC SCHOOLS
97
Students in high school may need to use both languages to bridge from their language to
English.
Academic Placement
Currently graduating ELL students are struggling meeting ACT benchmark
scores. Therefore, a closer look at current practices, such as academic student placement,
are needed. A study by Kanno and Kangas (2014) examined the academic placement of
ELL students. The study revealed that once students exited language services, they were
placed in remedial courses. With little or no access to content that supports success on
ACT and in college, the ELL student is essentially forced into coursework that may be
slower paced and negatively impacting student growth. This presents the need for more
research in the area of sheltered instruction. In this environment, the ELL students is
learning English along with academic content. With immigration on the rise, varied
languages present in U.S. schools, this option is costly but could be worth the investment
if the end result is high levels of language proficiency and college ready graduates.
Language Endorsement
While looking at curriculum is certainly a positive step forward, research in the
areas of pre-service teacher preparation programs is needed. Many of the classroom
teachers have little or no training in how to service English learners (Lucas & Villegas,
2013). The classroom educator has a great impact on English learners. Yet, many states
do not require classroom teachers to receive endorsements.
It would be in the best interest for universities to work with states to require ELL
coursework for pre-service teachers. The implications for students in classrooms with
underprepared teachers, teachers with little or no language acquisition understanding, is

COLLEGE READINESS OF GRADUATING ELLs IN UTAH PUBLIC SCHOOLS
98
long lasting. Current educators, in areas with high ELL populations should seek out
language professional development and ultimately endorsements to better service ELL
students. While this one mountain west state does require an endorsement for all
educators, this is a policy that should be enacted across the nation.
Academic Testing Bias
The language bias in the ACT assessment is another area of study for possible
research and change in policy. At this time, the ACT is given only in English. In doing
so, what an ELL student really knows is unknown. In the review of literature, Abedi
(2008) discussed the complexity of language on standardized testing and the difficulty
native speakers have; therefore, the impact on non-native speakers is even greater. While
educational reform does call for rich content and rigor. The rigorous language, inferential
skill, and lack of language are all factors that can lead to low student achievement for
many ELL students. If ACT scores are showing a gap among ethnic groups, then
consideration in giving the ACT in the student’s native language is case for study.
Conclusion
This study focused on area of the country, today’s ELL student is in classroom
across the United States. The goal of graduating the ELL student is not enough. Society
practically demands students graduate and attend college. Our ELL students need to
graduate, able to communicate and prepared to for college, even technical schools. The
implications for not learning the dominant language and missing out on college can lead
to a life of poverty.
This study also challenges the educators and policy makers to look deeply into
how to service ELL high school students. Specifically, policy makers should consider the

COLLEGE READINESS OF GRADUATING ELLs IN UTAH PUBLIC SCHOOLS
99
value of the immigrants in our nation, the time it takes to gain language proficiency, and
offer more language programs to support. The amount of time it takes to acquire
academic English is lengthy; therefore, the post-graduation college prospects for the ELL
student is dismal.
In addition, not only are students learning English, but simultaneously learning
content. This requires more of the ELL student than their English speaking peers. The
assumption is that students will learn English over time, but time is a great barrier for the
high school ELL student. If the work load is doubled without a realistic timeline is given,
their future will not be the American Dream. Many will give up and possibly drop out,
which may lead to a life of constant struggle and generational poverty. With this
population growing, their academic outcomes should alarm policy makers. Reform
should examine how to use a student’s native language to bridge language barriers, along
with programs that support academic growth for the ELL student.
For educators, this study confirms that high school ELL students are not meeting
college benchmark scores. First, examination of student placement and support could be a
first step in ensuring equal access to higher level content. Also, seeking out curriculum
that supports varied levels of the ELL student in all content areas is needed. The variables
of language proficiency and free or reduced lunch are areas that school districts can
specifically address. The variable of poverty, while serious, is difficult for educators to
overcome in the classroom. A family’s socioeconomic status is one that schools or
teachers cannot change. Yet, schools do offer family support and services that can impact
motivation and that is key to learning a new language and becoming part of the
community.

COLLEGE READINESS OF GRADUATING ELLs IN UTAH PUBLIC SCHOOLS
100
For researchers, this study confirms that more studies on effective language
programs and services in high school is needed. To better understand this issue,
researchers should examine the variables of language proficiency and free or reduced
lunch status as barriers for the ELL student and college readiness. The variable of
poverty, while serious, is impossible to change for a child. However, there may be
opportunities when studying poverty to determine opportunities that motivate this student
group. Also, while levels of English proficiency will vary significantly, the need for
programs that support high school ELL students is a benefit that should not be
overlooked. This is an area where teachers and support staff can make a difference.
The academic success and future of the ELL student is at risk. The data gathered
and analyzed supports the need for a deeper study into how to best service high school
ELL students. While not all students will choose college, each student should be able to
choose. This study adds to the literature on college readiness and the English learner in
hopes that educators and policy makers will consider the critical educational needs of this
growing student population.

COLLEGE READINESS OF GRADUATING ELLs IN UTAH PUBLIC SCHOOLS
101
REFERENCES
Abedi, J. (2002). Standardized achievement tests and English language learners:
Psychometrics issues. Educational Assessment, 8(3), 231-257.
doi:10.1207/S15326977EA0803_02
Abedi, J. (2008). Classification system for English language learners: Issues and
recommendations. Educational Measurement: Issues and Practices, 27(3), 17-31.
Abedi, J., & Dietel, R. (2004). Challenges in the No Child Left Behind Act for English
language learners: Policy brief 7. Retrieved from
https://www.cse.ucla.edu/products/policy/cresst_policy7.pdf
Abukhattala, I. (2012, August). Krashen’s five proposals on language learning: Are they
valid in Libyan EFL classes. English Language Teaching, 6(1), 128-131.
ACT. (2014). The condition of college & career readiness 2014. Retrieved from
http://www.act.org/content/dam/act/unsecured/documents/CCCR14-
NationalReadinessRpt.pdf
ACT. (2015). The condition of college & career readiness 2015. Retrieved from
http://www.act.org/content/dam/act/unsecured/documents/Condition-of-College-
and-Career-Readiness-Report-2015-United-States.pdf
ACT. (2016). ACT college readiness benchmarks. Retrieved from
https://www.act.org/content/act/en/education-and-career-planning/college-and-
career-readiness-standards/benchmarks.html
Ball, A. F. (2009). Toward a theory of generative change in culturally and linguistically
complex classrooms. American Educational Research Journal, 46(1), 45-72.

COLLEGE READINESS OF GRADUATING ELLs IN UTAH PUBLIC SCHOOLS
102
Brennan, R. T., Kim, J., Wenz-Gross, M., & Siperstein, G. N. (2001). The relative
equitability of high-stakes testing versus teacher-assigned grades: An analysis of
the Massachusetts comprehensive assessment system (MCAS). Harvard
Educational Review, 71(2), 173-216. Retrieved from
http://search.proquest.com/docview/212301951?accountid=458
Callahan, R. (2005, Summer). Tracking and high school English learners: Limiting
opportunity to learn. American Educational Research Journal, 42 (2), 305-328.
Camara, W. (2013). Defining and measuring college and career readiness: A validation
framework. Education Measurement Issues and Practice, 32(4) 16-27.
Capps, R., & Fix, M. (2015, October). Ten facts about U.S. refugee resettlement.
Migration Policy Institute. Retrieved from
http://www.migrationpolicy.org/research/ten-facts-about-us-refugee-resettlement
Chishti, M., Hipsman, F., & Ball, I. (2015, October). Fifty years on, the 1965
Immigration and Nationality Act continues to reshape the United States.
Migration Policy Institute. Retrieved from
http://www.migrationpolicy.org/article/fifty-years-1965-immigration-and-
nationality-act-continues-reshape-united-states
Cho, J., Rios, F., Trent, A., & Mayfield, K. K. (2012). Integrating language diversity into
teacher education curricula in a rural context: Candidates’ developmental
perspectives and understandings. Teacher Education Quarterly, 39(2), 63-85.
Retrieved from http://search.proquest.com/docview/1267642603?accountid=458

COLLEGE READINESS OF GRADUATING ELLs IN UTAH PUBLIC SCHOOLS
103
Clough, S., & Montgomery, S. (2015). How ACT assessments align with state college
and career readiness standards. Retrieved from
http://www.actstudent.org/scores/understand/howused.html
Cohen, J. (2011). Imaginary community of the mainstream classroom: Adolescent
immigrants' perspectives. The Urban Review, 44(2), 265-280.
doi:http://dx.doi.org/10.1007/s11256-011-0194-x
Collier, V., & Thomas, W. (2001). Educating linguistically and culturally diverse
students in correctional settings. Journal of Correctional Education, 52(2), 68-73.
Conley, D. T. (2007). Redefining college readiness. EPIC. Retrieved from
http://www.aypf.org/documents/RedefiningCollegeReadiness.pdf
Conner, K., & Vargyas, E. (2013, September). The legal implications of gender bias in
standardized testing. Berkeley Journal of Gender, Law & Justice, 1(7), 13-89.
Retrieved from
http://scholarship.law.berkeley.edu/cgi/viewcontent.cgi?article=1063&context=bg
lj
Cornwell, C., Mustard, D., & Van Parys, J. (2011, September). Noncognitive skills and
the gender disparities in test scores and teacher assessment: Evidence from
primary schools. Journal of Human Resources, 48(1), 236-264.
Cummins, J. (1979, January). Cognitive/academic language proficiency, linguistic
independence, the optimum age question and some other matters. Retrieved from
https://www.reseachgate.net/publication/234573070
Cummins, J. (1999). BICS and CALPS: Clarifying the distinction. Retrieved from
files.eric.ed.gov/fulltext/ED438551.pdf

COLLEGE READINESS OF GRADUATING ELLs IN UTAH PUBLIC SCHOOLS
104
Day, J. C., & Newburger, E. C. (2002, July). The big payoff: Educational attainment and
synthetic estimates of work-life earnings. U.S. Census Bureau. Retrieved from
http://www.census.gov/prod/2002pubs/p23-210.pdf
Dianda, M. (2008, November). Preventing future high school dropouts. An advocacy and
action guide for NEA state and local affiliates. National Education Association.
Retrieved from www.nea.org/.../dropoutguide1108.pdf
Dougherty, C., & Fleming, S. (2012). Getting students on track to college and career
readiness: How many catch up from far behind? ACT Research Report Series.
Retrieved from http://files.eric.ed.gov/fulltext/ED542022.pdf
Duckworth, A. L., & Seligman, M. E. P. (2006). Self-discipline gives girls the edge:
Gender in self-discipline, grades, and achievement test scores. Journal of
Educational Psychology, 98(1), 198-208. Retrieved from
http://dx.doi.org/10.1037/0022-0663.98.1.198
Education Commission of the States. (2014, November). What measures do schools use
to reclassify students as English proficient? Retrieved from
http://ecs.force.com/mbdata/mbquestNB2?rep=ELL1407
Feiman-Nemser, S. (2001). From preparation to practice: Designing a continuum to
strengthen and sustain teaching. Teachers College Record, 103(6), 1013-1055.
Flores, S. M., & Drake, T. A. (2014). Does English language learner (ELL) identification
predict college remediation designation? A comparison by race and ethnicity, and
ELL waiver status. Review of Higher Education, 38(1), 1-36.
Gandara, P. (2008, Spring). The crisis in the education of Latino students. NEA Research
Visiting Scholars Series, 1a. Retrieved from http://www.nea.org/home/17404.htm

COLLEGE READINESS OF GRADUATING ELLs IN UTAH PUBLIC SCHOOLS
105
Gandara, P., & Rumberger, R. W. (2009, March). Immigration, language, and education:
How does language policy structure opportunity? Teachers College Record,
111(3), 750-782.
Gandara, P., Rumberger, R. W., Maxwell-Jolly, J., & Callahan, R. (2003, October).
English learners in California schools: Unequal resources, unequal outcomes.
Education Policy Analysis, 11(36), 1-54.
Gay, G. (2002). Preparing for culturally responsive teaching. Journal of Teacher
Education, 53(2), 106–116.
Gershenson, S. (2013, December). Do summer time-use gaps vary by socioeconomic
status? American Educational Research Journal, 50(6), 1219-1248.
Gold, N. (2006, June). The high schools English learners need. Policy paper. Retrieved
from http://escholarship.org/uc/item/6h72r068
Goldberg, H., Paradis, J., & Crago, M. (2008). Lexical acquisition over time in minority
first language children learning English as a second language. Applied
Psycholinguistics, 29, 1-25.
Gonzalez, K., Stoner, C., & Jovel, J. (2003, April). Examining the role of social capital in
access to college for Latina: Toward a college opportunity framework. Journal of
Hispanic Higher Education, 2(2), 146-170.
Goodwin, R. E. (2014). Getting ELL students out of their shells: Enhancing student
engagement through writing. Modern Journal of Language Teaching Methods,
4(3), 79-99.
Gray, P. (1997, Fall). The formation and development of TESOL: A brief history.
International Education, 27, 71-83.

COLLEGE READINESS OF GRADUATING ELLs IN UTAH PUBLIC SCHOOLS
106
Hakuta, K., Butler, Y. G., & Witt, D. (2000, January). How long does it take English
learners to attain proficiency? The University of California Linguistic Research
Institute Policy Report 2000-1. Retrieved from
http://www.usc.edu/dept/education/CMMR/FullText/Hakuta_HOW_LONG_DOE
S_IT_TAKE.pdf
Honigsfeld, A., & Dunn, R. (2003). High school male and female learning-style
similarities and differences in diverse nations. The Journal of Educational
Research, 96(4), 195. Retrieved from
http://search.proquest.com/docview/204313855?accountid=458
Hopkins, M. (2013). Building on our teaching assets: The unique pedagogical
contributions of bilingual educators. Bilingual Research Journal, 36, 350-370.
Hyde, J.S. (2005). The gender similarities hypothesis. American Psychologist, 60(6),
581-592.
Kanno, Y., & Kangas S. (2014, October). I’m not going to be, like, for the AP: English
language learners’ limited access to advanced college-preparatory courses in high
school. American Educational Research Journal, 51(5), 848-878.
Kemple, J., Segeritz, M., & Stephenson, N. (2013). Building on-track indicators for high
school graduation and college readiness: Evidence from New York City. Journal
of Education for Students Placed at Risk, 18, 7-28.
Krashen, S. (2013). Second language acquisition: Theory, application, and some
conjectures. New York, NY: Cambridge University Press.

COLLEGE READINESS OF GRADUATING ELLs IN UTAH PUBLIC SCHOOLS
107
Krogstad, J. M. (2016, July). 5 facts about Latinos and education. Retrieved from
http://www.pewresearch.org/fact-tank/2016/07/28/5-facts-about-latinos-and-
education/
Julian, T., & Kominski, R. (2011, September). Education and Synthetic Work-Life
Earnings Estimates. American Community Survey Reports, U. S. Census Bureau.
Retrieved from https://www.census.gov/prod/2011pubs/acs-14.pdf
Lakin, J. M., & Young, J. W. (2013). Evaluating growth for ELL students: Implications
for accountability policies. Educational Measurement: Issues & Practice, 32(3),
11-26. doi:10.1111/emip.12012
Lopez, F., & Iribarren, J. (2014). Creating and sustaining inclusive instructional settings
for English language learners: Why, what, and how. Theory into Practice, 53,
106-114.
Lucas, T., & Villegas, A. (2013). Preparing linguistically responsive teachers: Laying the
foundation in preservice teacher education. Theory into Practice, 52(2), 98-109.
Mancilla-Martinez, J., & Lesaux, N. K. (2011). Early home language use and later
vocabulary development. Journal of Educational Psychology, 103(3), 535-546.
Retrieved from
http://search.proquest.com/docview/873312973?accountid=166133
Markham, P. L., & Gordon, K. E. (2008). Challenges and instruction approaches
impacting the literacy performance of English language learners. Multiple Voice,
10(1), 73-81.
Marzano, J., & Toth, M. (2013). Teacher evaluation that makes a difference: A new
model for teacher growth and student achievement. Alexandria, VA: ASCD.

COLLEGE READINESS OF GRADUATING ELLs IN UTAH PUBLIC SCHOOLS
108
National Center for Education Statistics (NCES). (2015, May). The condition of
education 2015. Retrieved from http://nces.ed.gov/pubs2015/2015144.pdf
National Center for Education Statistics (NCES). (2016). Fast facts: English language
learners. Retrieved from https://nces.ed.gov/fastfacts/display.asp?id=96
National Clearinghouse for English Language Acquisition (NCELA). (2014). Title III
state profiles: Utah. Retrieved from http://www.ncela.us/t3sis/Utah.php
National Educational Association (NEA). (2008). English language learners face unique
challenges. Retrieved from
http://www.nea.org/assets/docs/HE/ELL_Policy_Brief_Fall_08_(2).pdf
Nation’s Report Card: 2013 Mathematics state snapshot report: Utah grade 8 public
schools. Retrieved from
https://nces.ed.gov/nationsreportcard/subject/publications/stt2013/pdf/2014465UT
8.pdf
Nawyn, S., Gjokai, L., LaFa Agbenyiga, D., & Grace, B. (2012). Linguistic isolation,
social capital, and immigrant belonging. Journal of Contemporary Ethnography,
42(3), 255-282.
New America. (n.d.). Key definitions. Retrieved from
https://www.newamerica.org/education-policy/policy-explainers/early-ed-prek-
12/dual-language-learners/key-definitions/
Nico, L. (2016, April 4). How to help refugees in Utah: What you need to know.
KUTV.com. Retrieved from http://kutv.com/news/local/find-out-how-you-can-
volunteer-to-help-refugees-at-an-orientation-open-house

COLLEGE READINESS OF GRADUATING ELLs IN UTAH PUBLIC SCHOOLS
109
Niehaus, K., & Adelson, J, (2014). School support, parental involvement, and academic
and social-emotional outcomes for English language learners. American
Educational Research Journal, 51(4), 810-844.
Olsen, C., Land, R., Anselmi, T., AuBuchon, C. (2011). Teaching secondary English
learners to understand, analyze, and write interpretive essays about theme.
Journal of Adolescent & Adult Literacy, 54(4), 245-256.
Passel, J., & Cohn, D. (2008, February 11). U.S. population projections: 2005–2050. Pew
Research Center. Retrieved from http://pewhispanic.org/files/reports/85.pdf
Pew Hispanic Center/Kaiser Family Foundation. (2004, January). National survey of
Latinos: Education. Retrieved from www.pewhispanic.org/files/reports/25.pdf
Ramirez, J. D. (1992). Executive summary of the final report: Longitudinal study of
structured English-immersion strategy, early-exit and late-exit transitional
bilingual programs for language-minority students. Bilingual Research Journal,
16, 1-62.
Ramos, F. (2005). Spanish teachers' opinions about the use of Spanish in mainstream
English classrooms before and after their first year in California. Bilingual
Research Journal, 29(2), 411-433, 500. Retrieved from
http://search.proquest.com/docview/222028538?accountid=458
Reyes, R., III. (2008). Cheating as good pedagogy: Bilingual teachers defying English-
only to foster student achievement. Multicultural Perspectives, 10(4), 209-213.
doi:10.1080/15210960802526136
Rosenberry-McKibbin, C., & Brice, A. (2000). Acquiring English as a second language:
What’s normal, what’s not. Allied Health, 5(12), 4-7.

COLLEGE READINESS OF GRADUATING ELLs IN UTAH PUBLIC SCHOOLS
110
Ruiz Soto, A., Hooker, S., & Batalova, J. (2015, June). Top languages spoken by English
language learners nationally and by state. Migration Policy Institute. Retrieved
from http://www.migrationpolicy.org/research/top-languages-spoken-english-
language-learners-nationally-and-state
Ryan, C. (2013, August). Language use in the United States: 2011. American Community
Survey Report. United States Census Bureau. Retrieved from
https://www.census.gov/prod/2013pubs/acs-22.pdf
Scarcella, R. (2003, April). Academic English: A conceptual framework. Technical
Report. University of California Linguistic Minority Research Institute. Retrieved
from http://escholarship.org/uc/item/6pd082d4
Shim, J. (2013, Spring/Summer). Involving the parents of English language learners in a
rural area: Focus on the dynamics of the teacher parent interactions. Rural
Educator, 34 (3), 18-26.
Short, D. J., & Fitzsimmons, S. (2007). Double the work: Challenges and solutions to
acquiring language and academic literacy for adolescent English language
learners. Carnegie Corporation of New York. Retrieved from
https://www.carnegie.org/media/filer_public/bd/d8/bdd80ac7-fb48-4b97-b082-
df8c49320acb/ccny_report_2007_double.pdf
Slama, R. B. (2012). A longitudinal analysis of academic English proficiency outcomes
for adolescent English language learners in the United States. Journal of
Educational Psychology, 104(2), 265.
Solorzano, R. (2008, June). High stakes testing: Issues, implications, and remedies for
English learners. Review of Educational Research, 78(2), 250-329.

COLLEGE READINESS OF GRADUATING ELLs IN UTAH PUBLIC SCHOOLS
111
Soto-Hinman, I. (2010). ELL shadowing: Strengthening pedagogy and practice with pre-
service and in-service teachers. Research in Higher Education Journal, 8, 1-11.
Retrieved from http://search.proquest.com/docview/760866454?accountid=35812
Taylor, J. A. (2005). Poverty and student achievement. Multicultural Education, 12(4),
53-55. Retrieved from
http://search.proquest.com/docview/216523194?accountid=458
Thomas, W. P., & Collier, V. P. (2000). Accelerated schooling for all students: Research
findings on education in multilingual communities. Retrieved from
www.thomasandcollier.com/assets/accelerated-schooling.pdf
Tierney, W., & Sablan, J. (2014). Examining college readiness. American Behavioral
Scientist, 58(8) 943-946. doi:10.1177/0002764213515228
Tigchelaar, A., & Korthagen, F. (2004). Deepening the exchange of student teaching
experiences: Implications for the pedagogy of teacher education of recent insights
into teacher behavior. Teaching and Teacher Education, 20, 665-679.
United States Census Bureau. (2015, October 28). Detailed languages spoken at home
and ability to speak English for the population 5 years and over: 2009-2013.
Data. Retrieved from http://www.census.gov/data/tables/2013/demo/2009-2013-
lang-tables.html
United States Census Bureau. (2016). QuickFacts, Utah. Available at
http://www.census.gov/quickfacts/table/PST045215/49
U.S. Department of Education. (n.d.). Every Student Succeeds Act (ESSA). Retrieved
from http://www.ed.gov/essa?src=rn

COLLEGE READINESS OF GRADUATING ELLs IN UTAH PUBLIC SCHOOLS
112
Utah Education Network (UEN). (n.d.). English language proficiency core. Retrieved
from http://www.uen.org/core/englishlanguage/
Utah Foundation. (2012, November). Reaching for educational equity: An evaluation of
Utah’s rural schools, Report 712. Retrieved from
http://www.ursa.k12.ut.us/sites/default/files/studies/Utah%20Foundation%20Rura
l%20Schools%20Report%202012.pdf
Utah State Office of Education. (2014). 2014-2015 fingertip facts. Retrieved from
http://www.schools.utah.gov/data/Fingertip-Facts/2015.aspx
Walpole, M., McDonough, P., Bauer, C., Gibson, C., Kanyi, K., & Toliver, R. (2005).
This test is unfair: Urban African American and Latino high school students'
perceptions of standardized college admission tests. Urban Education, 40(3), 321-
349.
WIDA. (2016). ACCESS for ELLs. 2.0 summative assessment. Retrieved from
https://www.wida.us/assessment/access20.aspx#scoring
Wilson, V. (2015, August 4). Black unemployment rate dips below 10 percent in 11 of 24
states measured in second quarter. Economic Policy Institute. Retrieved from
http://www.epi.org/publication/black-unemployment-rate-dips-below-10-percent-
in-11-of-24-states-measured-in-second-quarter/
Wong-Fillmore, L. (1991). Second-language learning in children: A model of language
learning in social context. In E. Bialystok (Ed.), Language processing in bilingual
children (pp. 49-69). New York, NY: Cambridge University Press.

COLLEGE READINESS OF GRADUATING ELLs IN UTAH PUBLIC SCHOOLS
113
Xu, W. (2015). Exploring ESL/EFL teachers' pedagogical content knowledge on reading
strategy instruction. English Language Teaching, 8(11), 155-175. Retrieved from
http://search.proquest.com/docview/1733144593?accountid=458
Yamamura, E., Martinez, M., & Saenz, V. (2010). Moving beyond high school
expectations: Examining stakeholders’ responsibility for increasing Latina/o
students’ college readiness. High School Journal, 93(3), 126-128.
Yonezawa, S., Wells, A. S., & Serna, I. (2002). Choosing tracks: Freedom of choice in
detracking schools. American Educational Research Journal, 39(1), 37.
Zarate, M., & Burciaga, R. (2010, Fall). Latinos and college access: Trends and future
directions Journal of College Admission; 209.

COLLEGE READINESS OF GRADUATING ELLs IN UTAH PUBLIC SCHOOLS
114
VITA
Lizette L. Rogers
January 7, 1972
Hialeah, FL
Education
BA in Communication December 1995
Florida Atlantic University, Boca Raton, FL
MA in Organizational Management May 2000
University of Phoenix, Tampa, FL
MA in Elementary Teacher Education May 2003
University of Phoenix, Las Vegas, NV
EdD in Educational Leadership and Policy Studies Dec 2016
Eastern Kentucky University
Dissertation Title: An evaluation of the college readiness of graduating English
language learners in Utah public schools
Committee: Charles Hausman (Chair), James Bliss, Thomas Shelton, Deborah
West
Professional Experience
2004-Present University of Phoenix, Faculty- Online, College of Education
2014-Present, Fayette County Public School, Lexington, KY, 5th Grade Teacher
2012-2014, Clark County Public Schools, Winchester, KY, 4th Grade Teacher
2008-2011, Pasco County Public Schools, Land O Lakes, FL, 1st Grade Teacher
2004-2007, University of Phoenix, Faculty Development Administrator, Education
Program-Asia-Pacific Campus, Misawa, Japan