Embed Size (px)
Citation preview
i
An Evaluation of the Activities of Grihayan Tahobil (Housing Fund)
Md. Harunur Rashid Bhuyan
Abdul Hye Mondal
Zabid Iqbal
Maruf Ahmed
September 2018
Bangladesh Institute of Development Studies
E-17 Agargaon, Dhaka-1207
ii
Table of Contents
Abbreviations and Acronyms ................................................................................................................ viii
Executive Summary ................................................................................................................................. ix
I. Introduction ........................................................................................................................................... 1
I.1 Background of Grihayan Tahobil (Housing Fund) ............................................................................. 1
I.2 Objective of the Study ......................................................................................................................... 6
I.3 Methodology of the Study ................................................................................................................... 6
1.3.1 Selection of Sample ..................................................................................................................... 7
1.3.2 Selection of Geographic Units and Respondents ......................................................................... 8
1.4.3 Implementation Strategy ............................................................................................................ 13
II. Socioeconomic Background of the Survey Households .................................................................... 14
III. Analysis and Evaluation of Overall Program of Fund Management Unit ........................................ 22
III.1 Legal framework ......................................................................................................................... 22
III.2 Evaluating the structure and management of Housing Fund ...................................................... 22
III.3 Implementation guidelines .......................................................................................................... 23
III.4 Analysis of NGO selection process by Housing Fund Management Unit .................................. 25
III.5 Analysis and evaluation of HF related field level programs of the NGOs.................................. 25
IV. Operation, Transparency and Accountability of Housing Loan Program ........................................ 27
IV.1 Operational mechanism of Housing Loan Program .................................................................... 27
IV.3 Scrutinizing loan implementation, disbursement and recovery .................................................. 28
IV.4 Evaluation of housing plan sketched/designed by Housing Fund .............................................. 32
IV.5 Assessing the effectiveness of inspection method in order to ensure implementation of loan
allocated by Housing Fund ................................................................................................................. 35
iii
IV.6 SWOT(C) Analysis of Housing Fund Loan Program ................................................................. 36
V. Economic and Social Benefits of Housing Loan ............................................................................... 37
V.1 Investigating the advantages of house receipt in redressing the grievances of the beneficiaries . 37
V.2 Examining different aspects of the development of living standards of beneficiaries at the receipt
of house ............................................................................................................................................... 38
V.3 Measuring the satisfaction level of the beneficiaries ................................................................... 43
V.4 Assessing the opinion of the local people on the Housing Fund Loan Program .......................... 45
VI. Summary of Findings, Conclusions and Recommendations ............................................................ 51
VI.1 Findings and Conclusions ........................................................................................................... 51
VI.2 Recommendations ....................................................................................................................... 60
iv
List of Tables
Table 1. 1: List of Selected Geographic Units and Respondents for the Study ............................................ 8
Table 1. 2: Profile of the KIIs Respondents ................................................................................................ 10
Table 1. 3: List of Selected FGDs ............................................................................................................... 11
Table 1. 4: List of NGOs Interviewed Using Checklist .............................................................................. 11
Table 2. 1: Profile of the Households ......................................................................................................... 14
Table 2. 2: Demographic Profile of the Housing Fund Borrowers ............................................................. 15
Table 2. 3: Housing Fund Borrower‟s Education ....................................................................................... 15
Table 2. 4: Land Ownership Pattern of Survey Households ....................................................................... 16
Table 2. 5: Income, Expenditure and Asset of Survey Households ............................................................ 16
Table 2. 6: Household Head‟s Education Level of Survey Households ..................................................... 17
Table 2. 7: Percentage Distribution of Household Head‟s Main Occupation ............................................. 17
Table 2. 8: Household Loan Status of Survey Households (in Taka) ......................................................... 18
Table 2. 9: Household Saving Status of Survey Households (in Taka) ...................................................... 18
Table 2. 10: Percentage Distribution of Household Income Sources ......................................................... 19
Table 2. 11: Percentage Distribution of House Ownership ......................................................................... 19
Table 2. 12: Village Electrification Status of Survey Households .............................................................. 19
Table 2. 13: Percentage Distribution of Water Sources of Survey Households ......................................... 20
Table 2. 14: Sanitation Status of the Survey Households (%) .................................................................... 20
Table 2. 15: Yearly Food Consumption Status of the Survey Households ................................................. 21
Table 3. 1: Monitoring of House Construction by NGOs and Housing Fund Authority ............................ 26
Table 4. 1: Role of NGOs in Selecting Households & Providing the Housing Fund Loan ........................ 27
Table 4. 2: HFL Amount, Duration and Place of Disbursement ................................................................. 28
Table 4. 3: Processing Fees of HFL Charged by NGOs ............................................................................. 28
v
Table 4. 4: Mode of Loan Repayment on Monthly Installments .......................................................... 29
Table 4. 5: Additional Payment Related Issues that Housing Fund Beneficiaries Experienced ................. 29
Table 4. 6: Description of the Persons who helped the Beneficiary to Obtain the Loan .................... 30
Table 4. 7: Current Loan Repayment Procedure by the Program Participants ........................................... 30
Table 4. 8: Reason for Taking Housing Loans from Housing Funds by the Borrower .............................. 30
Table 4. 9: Reasons for not Selecting the Proper Households by the NGOs for HFL ................................ 31
Table 4. 10: Reasons for Dissatisfaction with the NGOs that Provide Housing Fund Loans ..................... 32
Table 4. 11: Main Actors Involved in Designing the Houses Built with HFL (%) .................................... 32
Table 4. 12: Description of the House Built with the Housing Fund Loan ................................................. 33
Table 4. 13: Ratings of NGO Activities on Housing Fund Loans by the Program Participants (%) 34
Table 4. 14: Suggestions by Program Participants for Improving HFL program ....................................... 34
Table 4. 15: Perception of Borrowers on Various Aspects of Housing Fund Loan .................................... 35
Table 4. 16: Sources of Additional Money Spent to Build the House ........................................................ 35
Table 4. 17: Uses of HFL for Purposes other than Building Houses .......................................................... 36
Table 5. 1: Perception of Households on the Changes in Social Status ...................................................... 38
Table 5. 2: Differences in Income and Expenditure between the Beneficiary and Non-beneficiary
Households .................................................................................................................................................. 39
Table 5. 3: Health Status of the Respondent Households ........................................................................... 39
Table 5. 4: Differences in the Indicators of Women Empowerment (women take decisions independently)
between Program Beneficiaries and Non-beneficiaries .............................................................................. 40
Table 5. 5: Frequency Distribution of HF Beneficiaries by the Change Status of Socioeconomic Indicators
.................................................................................................................................................................... 41
Table 5. 6: Impact of HF Loan on Socioeconomic Indicators .................................................................... 41
Table 5. 7: Frequency Distribution of HF Beneficiaries by Level of Satisfaction on the House Built ....... 44
Table 5. 8: Frequency Distribution of HF Beneficiaries by Level of Satisfaction on the Ways the NGOs
provide HF Loan ......................................................................................................................................... 44
vi
Table 5. 9: Frequency Distribution of HF Beneficiaries by Satisfaction and Dissatisfaction on the Process
of Receiving HF Loan ................................................................................................................................. 44
Table 5. 10: Selection Criteria or Process of the Beneficiary ..................................................................... 45
Table 5. 11: Whether Beneficiary has been Selected Discussing with the Beneficiary .............................. 45
Table 5. 12: Stages of Discussion with the Beneficiary at the Selection Process ....................................... 46
Table 5. 13: Recommendation for Receiving a Housing Loan ................................................................... 46
Table 5. 14: Socioeconomic Indicators that have been Changed due to Housing Loan ............................. 46
Table 5. 15: Housing Loan Plays Role in Reducing Poverty ................................................................. 47
Table 5. 16: Mechanism of Reducing Poverty by Housing Loan ............................................................... 47
Table 5. 17: Current Activity of the HF Beneficiary Household Members (Aged 5 years and above) ...... 47
Table 5. 18: Positive Aspects of Housing Loan Program ........................................................................... 48
Table 5. 19: Weaknesses of Housing Loan Program .................................................................................. 48
Table 5. 20: Opportunities to Improve Housing Loan Program ................................................................. 49
Table 5. 21: Threats to Sustain Housing Loan Program ............................................................................. 49
Table 5. 22: Recommendations to Improve Housing Loan Program .......................................................... 50

vii
Acknowledgements
This Evaluation of the Activities of Grihayan Tahobil (Housing Fund) report is a product of the
collective efforts of the Bangladesh Institute of Development Studies (BIDS) and the Grihayan
Tahobil. The concept, the study design and the questionnaire for the study were developed by
BIDS in consultation with the Grihayan Tahobil. BIDS is thankful to the Grihayan Tahobil for its
unstinted cooperation and support in designing the study and in obtaining missing information
from different sources.
The authors are particularly indebted to Mr. Md. Nojibur Rahman, Principal Secretary to the
Honorable Prime Minister, Prime Minister‟s Office, Mr. Md. Abdur Rahim, Executive Director,
Grihayan Tahobil (Fund Management Unit), Mr. Nirmal Kumar Sarker, General Manager, Mr.
Md. Monsur Ali, Joint Director, Mr. Md. Mizanur Rahman, Joint Director and Other officials of
Grihayan Tahobil for their unstinted cooperation and support throughout the entire period of the
study. The authors would like to thanks Mr. Monoranjan Bagchi, Mr. Tanvir Ahmed, and Ahsan
Ullah Bahar for providing necessary research, computing, and secretarial assistance for the report
preparation. Last, but not the least, BIDS team is thankful to the respondents and NGOs for their
full cooperation during the survey.
Study Team
Dr. Mohammad Harunur Rashid Bhuyan
Dr. Abdul Hye Mondal
Dr. Zabid Iqbal
Mr. Maruf Ahmed
viii
Abbreviations and Acronyms
BEPZA : Bangladesh Export Processing Zones Authority
BJMEA : Bangladesh Jute Mills Employers Association
BTMA : Bangladesh Textile Mills Association
EPZs : Export Processing Zones
FGDs : Focus Group Discussions
GOB : Government of the People‟s Republic of Bangladesh
HFMU : Grihayan Tahobil (Housing Fund) Management Unit
HFL : Housing Fund Loan
HFP : Housing Fund Program
HFSC : Grihayan Tahobil (Housing Fund) Steering Committee
KIIs : Key Informant Interviews
NGOs : Nongovernmental Organizations
PKSF : Palli Karma Sahayak Foundation
SWOT(C) : Strengths, weaknesses, opportunities and threats/constraints
ix
Executive Summary
The central objective of the study is two-fold: (i) evaluation of social program of the Grihayan
Tahobil (Housing Fund), and (ii) evaluation of the economic and social status of the beneficiaries
of the Housing Fund and assessment of the overall social impact of the project. To this end, the
study has made use of both primary and secondary information. The secondary data were
obtained from various official sources especially the project office. Primary data were collected
through structured open and close-ended questionnaires from the beneficiaries and different
organizations and persons involved in the implementation of the program. We have also
collected information through key informant interviews and group discussions.
To capture the impact of the program sample households were selected from those households
who received housing fund loan between 2014 and 2017. Housing Fund Authority provided lists
of 5,485 households and 78 NGOs. From these lists 47 NGOs from all over Bangladesh were
selected randomly and 1700 beneficiary households were selected systematically from 48
districts for field survey. To compare the beneficiaries with non-beneficiaries in order to
understand the real impact of the program 300 non-program households were also selected from
the same districts.
Key Findings of the Study
The structure of the HFMU works well for all practical purposes. But there is acute shortage of
HFMU staff especially for field supervision. Besides, money allocated for field visits by HFMU
staff is also inadequate. This works to the detriment of smooth field supervision of HFMU.
NGO selection process by HFMU is working well to meet the ground realities of loan program at
the field level. In several instances showcase NGOs are selected repeatedly to affirm credibility,
economy and efficiency in the whole system. The process is intricate and time-taking but reflects
transparency and accountability of HFMU.
x
The study finds that NGO officials visit the house construction process in every case with a view
to monitoring the design and quality of the house. Approximately 5 times the NGO officials visit
a house construction process to ensure full utilization of the loans. During these visits the NGO
officials give them suggestions about the quality of materials (95%) and evaluate the house
standard (89%). Approximately 94 percent of the beneficiaries reported that the NGO officials
also inquired about the full spending of the HFL so that the money allotted for construction of
houses cannot be diverted to other uses. Around 88 percent of the beneficiaries informed that
Housing Fund Authority officials also visit the house construction process with more than one
visit per house to monitor the construction design and quality of the houses. The Housing Fund
Authority officials have given suggestions about the quality of construction materials in around
66 percent cases and verified the standard of the house built with the loan money in around 70
percent cases. In addition, they have also investigated the full utilization of the loan money
amount in around 76 percent cases of house construction.
The members of the beneficiary households have on average more than one different NGO
membership. NGO membership is the necessary condition for obtaining Housing Fund loan from
an NGO.
NGOs provide Housing Fund loan to the household head in 32 percent cases and to the prime
bread winner of the households in approximately 31 percent cases. The NGOs do not seem to
bother about whether there is an existing loan of the borrower from other sources since 26
percent of the borrowers of HFL have an average loan of Tk. 42,528 during borrowing which is
60 percent higher than the HFL amount.
To receive the HFL 52 percent of the borrowers go to Upazila, while 39 percent of them get loan
from Union Office and 9 percent of them receive loan in their own villages.
A striking feature of the HFL disbursement is that 69.5 percent of the borrowers pay on average
Tk. 465 to the NGOs as processing fee for obtaining HFL. The monthly installment of loan
repayment works out to an average of Tk. 1,559 because 57 percent of the beneficiaries repay
xi
loan weekly with installment amounting to Tk. 400 (i.e. a monthly total of Tk. 1,600) while 43
percent of them pay out loan installments monthly with average rate of Tk. 1,559.
However, NGO officials come to 98 percent of the borrowers‟ houses to collect the monthly
installments. The NGOs usually recover the HFL completely within 48 months from the
borrowers. Encouragingly, around 85 percent of the borrowers have always been successful to
repay the installments of the HFL.
Around 4 percent of the Housing Fund borrowers pay on average Tk. 623 as any kind of extra
incentive or transaction cost to the NGO officials for obtaining the HFL. The underlying causes
of this invisible cost of HFL charged by the NGO officials are the so-called excuses as
refreshment purpose from 74 percent of the borrowers and document purpose from 26 percent of
the borrowers.
Lobbying plays an important role in obtaining HFL. Around 65 percent of the borrowers
mentioned that help or lobbying by any external person is needed to obtain the loan. Around 85
percent of them reported that insider NGO activists help them grant the HFL. Out of 65 percent
of the borrowers who would seek help from others to obtain HFL, only 0.45 percent of them pay
anything in kind or cash. On average a HFL borrower pays Tk. 280 to the person (outside the
NGO) who helps to obtain the HFL.
The factors accountable for the attraction of the borrowers to apply for HFL vary widely. Most
important among them is lower interest rate (40%) followed by longer loan repayment time
(27%) and easiness to get. However, more than 16 percent of the beneficiaries have failed to
repay the monthly installments of HFL about four times.
Approximately 53 percent of the borrowers of the HFL have previously received a loan
averaging 5 times from the same NGO that provides them with HFL. It implies that NGOs prefer
to select the HFL borrowers from amongst the pool of people who have already gained the trust
of the NGOs.
xii
Only 2 percent of the beneficiaries reported that NGOs do not select proper households to
provide them with HFL. Approximately 70 percent of them reported cases of corruption by the
NGO officials in selecting the borrowers of HFL. Besides, political party pressure (17%), non-
payment of commissions to the NGO officials (7%) and pressure from the local elite (3%) have
also been attributed to the causes of why NGOs do not select proper beneficiaries for a HFL.
Further, around 15 percent of the borrowers have alleged affiliation with the local elite who help
them to obtain the HFL.
One of the striking facts is that around 89 percent of the beneficiaries are satisfied with the
NGOs that provide HFL – around 11 percent of them are not satisfied with the current activities
of the NGOs. The reasons are rooted elsewhere. Charging high interest rate has been found to be
the major cause of dissatisfaction by around 32 percent of the beneficiaries. In addition, too strict
rules (24%) and prolonged process of granting the HFL (24%) have been reported to be reasons
for dissatisfaction of the beneficiaries with the NGOs. Besides, 15 percent of the beneficiaries
have also complained about rude behavior of the NGO officials.
Majority of the house designs are instructed by NGOs (42%) followed by Housing Fund
authority (36%). Only 14 percent of these houses are designed by household members.
Average size of the houses built with HFL is found to be around 264 sq. ft. which is fully
consistent with the Grihayan Tahobil approved specification of 220–300 sq. ft along with an
attached bathroom. All the houses have an attached bathroom and only 12 percent of them have
an attached kitchen. These houses have on average 2 doors and 3 windows. Around 4 persons
live in the house. Only 5 (29%) out of 17 houses have been rented out. These houses are
expected to sustain for around 30 years and all of them can withstand natural calamities.
Around 5 percent of the beneficiary compared to 3 percent of non-beneficiary houses are built on
squatter land which is inconsistent with the existing laws of the land. Further, it may be noted
that 17 out of 1700 houses built with HFL are not used by the beneficiaries as the main living
house. While 94.12 percent of these houses are used for living purposes 5.88 percent of them are
xiii
used for economic activities. Around 71 percent of these houses are in fairly good and 18 percent
of them are in good condition, while around 12 percent of them are found seriously dilapidated.
Majority of the beneficiaries (65%) have reported that there are no weak parts of the houses.
However, 18 percent of them have identified floor to be the weak part or inconsistent with the
standard of the house. Besides, 6 percent of them report door and another 6 percent of them
report bata (props) to be the weak parts of the house. In keeping with expectations, 29 percent of
them have repaired the floor, while 14 perrcent of them have repaired the roof, wall, and the door
of their houses. Money spent for repair purposes of the house averaged Tk. 19,457.
More than half of the beneficiaries are “satisfied” with respect to interest rates, documentation
procedure required to obtain the loan, sanctioning procedure and overall procedure of obtaining
housing fund loan from the NGOs. With respect to amount of loans 47 percent of them are fairly
satisfied. By and large, most of them are satisfied in various degrees on all aspects of NGO
activities related to HFL program. However, dissatisfaction of the beneficiaries primarily relates
to the amount of loan, interest rate and loan repayment installment period.
According to around 87 percent of the borrowers of HFL, current amount of loan is insufficient
to construct a standard house. The HFL beneficiaries need to obtain a loan amounting to Tk.
134,129 in order to build a standard house. They also consider 3 percent as the appropriate
interest rate with a loan repayment period of 5 years and 7.6 months. Moreover, they prefer to
get monthly installment not to exceed Tk. 1363 under both weekly and monthly schemes.
The loan allocated by Housing Fund is being implemented effectively. This is attributable to
good governance of housing fund loan and inspection method applied in supervising and
monitoring the utilization of housing fund loan. However, inspection by the HFMU is largely
limited by the shortage of field staff of the HFMU coupled with shortage of fund for regular and
close field supervision.
Around 99 percent of the HFL beneficiaries spend the entire loan amount to construct the house
and according to around 87 percent of them, the amount of loan received is insufficient to build a
xiv
standard house. Consequently, approximately 94 percent of the beneficiaries have spent
additional money to construct the house and the amount of additional money spent on top of the
loan amount totals on average Tk. 67,611 per house.
Past savings of the beneficiaries accounts for the lion‟s share (around 58%) of the sources of
additional money spent on house construction followed by relatives or any other person (21.5%)
and loan from Govt./NGO organizations (18.4%) and other sources.
A very negligible 2.6 percent of the beneficiaries have acknowledged diverting the use of HFL to
other purposes than building houses. Other uses of the HFL by the beneficiaries include: medical
expenses (36%), repayment of other loans (20%), marriage ceremonies (16%) and food expenses
(14%). From this scenario it is difficult to conclude that the HFL money is being abused. Instead,
this situation warrants consideration of tying up HFL program with other social protection
programs so that overall quality of life of the beneficiaries improves.
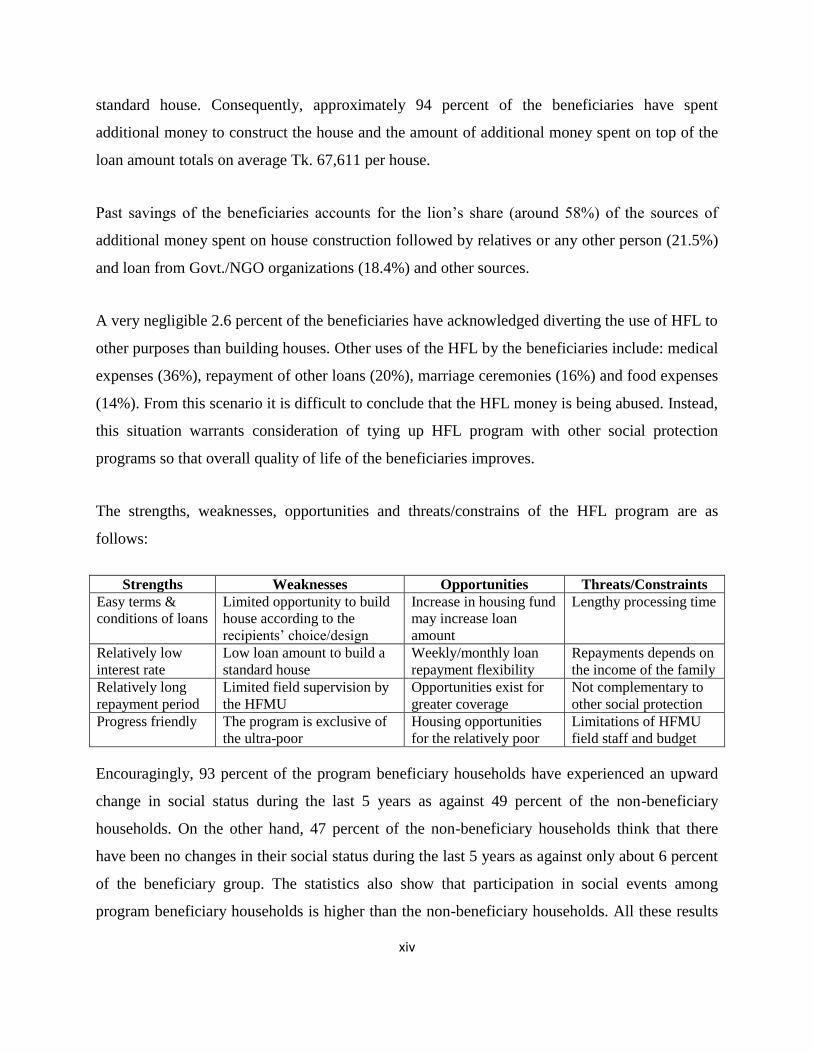
The strengths, weaknesses, opportunities and threats/constrains of the HFL program are as
follows:
Strengths Weaknesses Opportunities Threats/Constraints
Easy terms &
conditions of loans
Limited opportunity to build
house according to the
recipients‟ choice/design
Increase in housing fund
may increase loan
amount
Lengthy processing time
Relatively low
interest rate
Low loan amount to build a
standard house
Weekly/monthly loan
repayment flexibility
Repayments depends on
the income of the family
Relatively long
repayment period
Limited field supervision by
the HFMU
Opportunities exist for
greater coverage
Not complementary to
other social protection
Progress friendly The program is exclusive of
the ultra-poor
Housing opportunities
for the relatively poor
Limitations of HFMU
field staff and budget
Encouragingly, 93 percent of the program beneficiary households have experienced an upward
change in social status during the last 5 years as against 49 percent of the non-beneficiary
households. On the other hand, 47 percent of the non-beneficiary households think that there
have been no changes in their social status during the last 5 years as against only about 6 percent
of the beneficiary group. The statistics also show that participation in social events among
program beneficiary households is higher than the non-beneficiary households. All these results
xv
indicate that access to housing fund loan for a new but less expensive house is likely to change
the social status of a household.
Construction of a new house through housing fund loan leads to an increase in the income of the
beneficiary households by Tk. 560 per month. This difference in income is statistically
significant as confirmed by a significant t-test. And this increase in income is perhaps due to the
investment made by beneficiary by minimizing the maintenance cost of the house. The results
also show that per capita income and expenditure among program beneficiary households are
higher than non-program households.
The new house with HFL lowers the number of households becoming ill in a year from 2.7 to
1.7. The difference between a program and non-program households on this indicator is also
about 1. A new house through HF loan also reduces the frequency of illness from 4.30 to 2.53
and the difference between a program and non-program households are also visible. All these
differences are statistically significant as confirmed by t-test. This result is not surprising because
a new house improves the living condition of a household and therefore the health status of a
household improves.
The women in the program households are more empowered than the non-program households.
The indicators of women empowerment that are better in program households are women going
outside the village; women going to public places like market, school, health care center; women
visiting her own or relatives home; spending on children education; selecting NGOs for
membership; attending the NGO meeting. The differences are statistically significant as
confirmed by a low p-value.
On average 97 percent of the program beneficiary households see improvement in healthy
environment, children‟s education, peace of mind, and social status because of the new house
financed by housing fund loan. Moreover, the construction of the new house has contributed to
the marriage happenings in 100 percent of cases. These findings on the development indicators
xvi
of household socioeconomic life indicate housing fund loan is likely to improve the lifestyle of a
household.
About 30 percent of the beneficiaries reported that access to housing fund loan improved several
socioeconomic indicators significantly. These are food standard, income, health services,
children‟s education, and cleanliness of household. About 50-70 percent said that the changes of
these indicators with housing loan are somewhat better than without housing loan or new house.
Only 6-10 percent beneficiaries reported that access to housing loan had no impact on their
living standard. The findings indicating a new house through housing fund loan create a positive
impact on their socioeconomic life.
Of the total survey beneficiary about 80 percent reported that housing fund loan was very
beneficial followed by 16 percent and 5 percent of them who said that loan was beneficial and
somewhat beneficial respectively. Overall, the findings show that the construction of a new
house through housing fund loan leads to significant improvement in the socioeconomic
development indicators of program households.
About 46 percent of the beneficiaries reported that they were very satisfied with the way the
house was being built. About 33 percent of them said that they were satisfied, followed by 21
percent of them who said that they were somewhat satisfied. On the process of distribution of
NGO loan, about 32 percent said that they were highly satisfied, followed by 49 percent and 21
percent of the total beneficiaries who said that they were satisfied and somewhat satisfied
respectively. On the process of receiving HF loan, almost 100 percent respondents said that they
were satisfied. The overall findings indicate that the level of satisfaction of the beneficiaries at
each step of the loan process to the house being built was good.
Majority recipients of HF loan are poor. However, only 31 percent of the beneficiaries have been
selected through discussing with beneficiaries. Among them, only about 38 percent were selected
through a direct discussion with beneficiaries. The most positive side of the beneficiary selection
was that in 91 percent cases recommendation was not required in selecting them.
xvii
About 27 percent of the beneficiaries reported that social status was the key indicator that had
changed after getting a new house, followed by income, quality of the house, work ability etc.
About 85 percent of key informants said that HF loan played a role in reducing poverty. The key
factors that helped in reducing poverty are an increase in income, work ability, and educational
attainment. This finding is reinforced by other findings which show that unemployment rate
among the program beneficiary households is much less than one percent compared to national
average of 5 percent. Similarly, more than 94 percent of their children and 12 percent of their
working age members are currently studying.
The most important positive issues of HF loan are the lower interest rate, quality house, and loan
without collateral, including many others. The main weaknesses of the HF are a smaller amount
of loan, quick repayment of the loan, no specific design of the house built, and so forth. Thus,
there are scope of opportunities to improve HF loan program. Improvements of loan repayment
system, increase the coverage of loan without collateral, and increase the amount of loan are key
the areas that were suggested by key informants.
The threats that can make the sustainability of HF loan program questionable include: a smaller
amount of loan, lack of monitoring, the problem in the design of the house, slow loan processing
etc.
In sum, the social program of the Grihayan Tahobil (Housing Fund) is working smoothly. Its
contribution to the improvement of economic and social status of the targeted beneficiaries is
remarkable. The economic and social benefits accruing from the Housing Fund greatly outweigh
its negative externalities.
xviii
Recommendations
The existing housing fund loan program may be improved along the following areas:
1. Amount of loan may be enhanced to Tk. 100,000 for the present.
2. Loan repayment period may be extended up to 15 years subject to intergenerational transfer of
housing fund loan.
3. Coverage of loan without collateral may be increased.
4. Other social protection programs may be combined with HFL program.
5. Field supervisory staff of HFMU may be increased along with budget for field supervision for
closer monitoring and supervision of HFL program.
6. Housing fund loan program may be continued on a regular basis to ensure affordable housing
for the poorer people of the society.
1
I. Introduction
I.1 Background of Grihayan Tahobil (Housing Fund)
Basic human needs are the elements required for survival and normal mental and physical health,
such as food, water, shelter, protection from environmental threats, and love. According to Social
Progress Index-2016, Bangladesh performs best on nutrition and basic medical care and has most
opportunity to improve on the shelter component. In the foundations of wellbeing dimension,
Bangladesh scores highest on access to basic knowledge but lags behind on the environmental
quality component.1 Overall, Bangladesh is an under-performer in components of personal
rights, tolerance and inclusion. The fulfillment of these basic human needs is seen as an
„essential precondition for full participation in social life‟. Grihayan Tahobil (Housing Fund)
Program was the brainchild of the Honorable Prime Minister Sheikh Hasina and is being
administered by the Prime Minister‟s Office. This Project is essentially based on the basic human
needs approach.
In FY 1997-98, the Government of the People‟s Republic of Bangladesh (GoB) formed
Grihayan Tahobil (Housing Fund) with the initial seed money of Tk. 500 million through budget
allocation for the purpose of providing low-cost housing to the poor, distressed and homeless
people of the society. Besides house building, this fund also looks at the poverty alleviation of
the poor and the helpless housing loan receivers. In short, the targets and objectives of Grihayan
Tahobil (Housing Fund) are the following:
Targets and Objectives of Grihayan Tahobil (Housing Fund)
The primary objective of Grihayan Tahobil (Housing Fund) is to alleviate the acute crisis of
housing of the homeless, poor and low income brackets of people of the country, especially
1 In the basic human needs dimension of Social Progress Index, there are 12 components under the broad areas:
nutrition and basic medical care; water and sanitation; shelter; personal safety; access to basic knowledge; access to
information and communications; health and wellness; and environmental quality; personal rights; personal freedom
and choice; tolerance and inclusion; and access to advanced education.
2
female workers, homeless families due to river erosion and poor people in the urban slum areas.
Apart from these objectives, currently steps have been taken to include the following programs:
►Undertaking housing provisions for industrial workers employed in factories, especially for
female workers, in terms of construction of hostel/dormitory through Department of Women
Affairs/Ministry of Labour and Employment;
►To undertake housing provisions for female workers employed in the industrial establishments
of the EPZs under BEPZA in terms of construction of dormitory/workers hostel suitable for
living alone or with family;
►Construction of hostel/dormitory for the housing of workers employed in the BJMEA and its
enlisted member companies;
►Construction of hostel/dormitory for the housing of workers employed in the BTMA enlisted
textile mills;
►Construction of hostel/dormitory for the housing of workers employed in the garments
industry under the supervision of nongovernmental organizations (NGOs);
►Taking initiative for the construction of flats/dwelling houses for the housing of the
disadvantageously deprived people of the society, especially workers employed in the tea
gardens;
Programs under implementation by Grihayan Tahobil
(a) HFSC has approved in principle the construction of a ten storey women hostel in Nilkhet
(Dhaka) for working women and a twelve storey women hostel/dormitory in Ashulia of Savar
Upazila for women workers under the supervision of the Department of Women Affairs. It may
be noted that the estimated cost of these projects is (Tk. 304 + Tk. 457.9) = Tk. 761.9 million.
Report on Working Women Hostel in Ashulia, Savar, Dhaka
Housing Fund authority allocated Tk. 257.6 million to establish a Working Women Hostel under
the Department of Women Affairs in Ashulia, Savar, Dhaka. As many as 744 women workers

3
can live in this hostel according to the original plan. This project was completed and handed over
to the Department of Women Affairs in November 2016. In total 11 employees (cleaner 4,
gardener 1, liftman 1, pump operator 1, security guard 2 and office assistant 2) are currently
working in this hostel from an agency who received the outsourcing contract. In addition, one
Hostel Super (now working ex officio), one Accountant, one Matron, one Store Keeper and One
Cashier are working on deputation from the Department of Women Affairs to run the hostel
administration. This 12-storey hostel building has one big hall room (62 women can live there)
and another small room (18 women can live there) for accommodation in each floor. Ground
floor is currently used for office, dinning and one day-care center. One more day-care center is
located in the 1st floor. In addition to these office spaces and day-care centers there are 720-seats
capacity in this hostel.
Employees who are working on appointment from the Department of Women Affairs are
reportedly not receiving any salary after 30 June 2017 because of the completion of the project.
They are serving the hostel in the hope that they will get their salary after reviewing the phase of
the project. Even the employees working from outsourcing agency are apprehensive of losing
their jobs in the near future due to changed situation. Their current employer (present
outsourcing company) is no longer interested to renew their contract and new company already
received the tender of providing employees of the hostel in the next phase. So, the Department of
Women Affairs should take necessary steps to solve the problems of the hostel staff. According
to the staff of the hostel, the main problem is accommodation system inside the room – one
room has 62 seats and another one 18 seats. Boarders leave the hostel after residing there one or
two months due to this barrack system accommodation. Women boarders want privacy and
security, which can be ensured by dividing these rooms into several rooms where 4 to 6 boarders
can live in one room. Even the local land lords spread rumors against this hostel that it is not a
safe place for the ladies and government officials would abuse the boarders. Hostel authority is
distributing leaflets in the adjacent garments industry about the benefits of this hostel. Almost 80
percent respondents of FGD session agreed that they came to know about this hostel through
these leaflets.
4
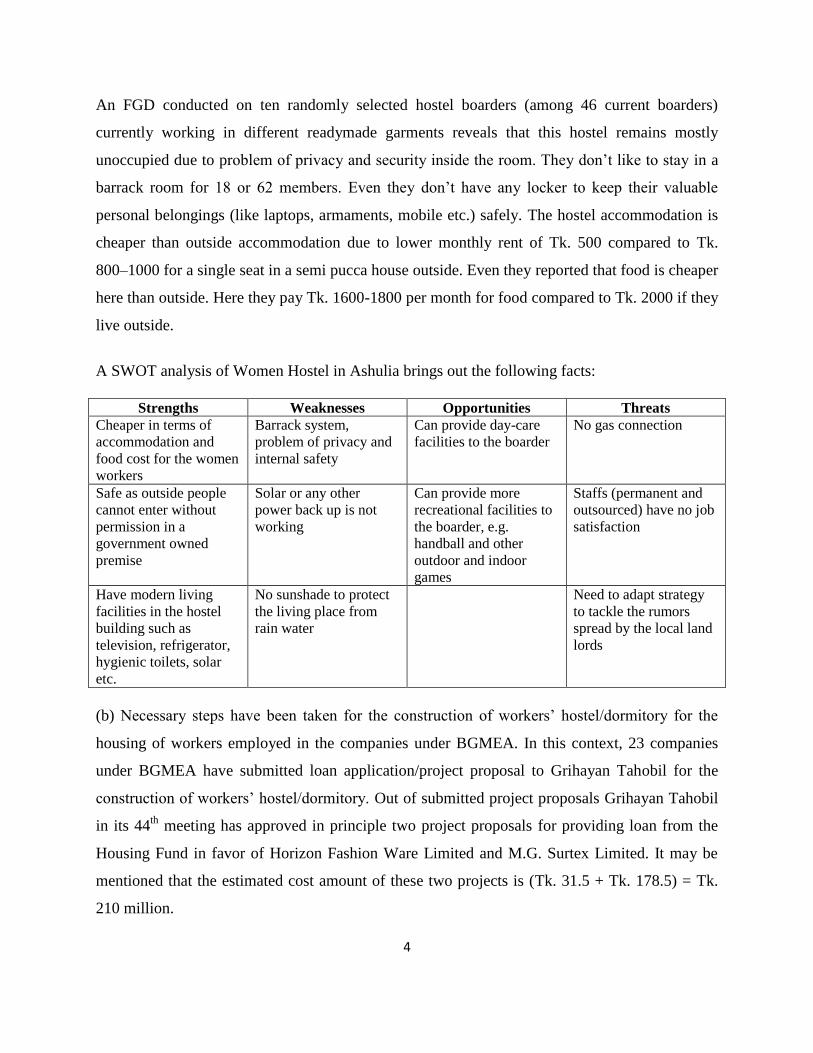
An FGD conducted on ten randomly selected hostel boarders (among 46 current boarders)
currently working in different readymade garments reveals that this hostel remains mostly
unoccupied due to problem of privacy and security inside the room. They don‟t like to stay in a
barrack room for 18 or 62 members. Even they don‟t have any locker to keep their valuable
personal belongings (like laptops, armaments, mobile etc.) safely. The hostel accommodation is
cheaper than outside accommodation due to lower monthly rent of Tk. 500 compared to Tk.
800–1000 for a single seat in a semi pucca house outside. Even they reported that food is cheaper
here than outside. Here they pay Tk. 1600-1800 per month for food compared to Tk. 2000 if they
live outside.
A SWOT analysis of Women Hostel in Ashulia brings out the following facts:
Strengths Weaknesses Opportunities Threats
Cheaper in terms of
accommodation and
food cost for the women
workers
Barrack system,
problem of privacy and
internal safety
Can provide day-care
facilities to the boarder
No gas connection
Safe as outside people
cannot enter without
permission in a
government owned
premise
Solar or any other
power back up is not
working
Can provide more
recreational facilities to
the boarder, e.g.
handball and other
outdoor and indoor
games
Staffs (permanent and
outsourced) have no job
satisfaction
Have modern living
facilities in the hostel
building such as
television, refrigerator,
hygienic toilets, solar
etc.
No sunshade to protect
the living place from
rain water
Need to adapt strategy
to tackle the rumors
spread by the local land
lords
(b) Necessary steps have been taken for the construction of workers‟ hostel/dormitory for the
housing of workers employed in the companies under BGMEA. In this context, 23 companies
under BGMEA have submitted loan application/project proposal to Grihayan Tahobil for the
construction of workers‟ hostel/dormitory. Out of submitted project proposals Grihayan Tahobil
in its 44th
meeting has approved in principle two project proposals for providing loan from the
Housing Fund in favor of Horizon Fashion Ware Limited and M.G. Surtex Limited. It may be
mentioned that the estimated cost amount of these two projects is (Tk. 31.5 + Tk. 178.5) = Tk.
210 million.
5
(c) In accordance with the proposal of the Ministry of Labour and Employment HFSC has
approved in principle in providing a loan of Tk. 250 million from Grihayan Tahobil to two
projects for the construction of multi-storey Labour Welfare Centre in Bandar Thana of
Narayanganj District and Kalurghat in Chittagong as well as a hostel for the working women to
be managed under the supervision of the Department of Labour.
(d) A pursuable policy in the case of providing loan in favor of BEPZA for the construction of
dormitory suitable for living of women workers employed in the industrial units in the EPZs
under BEPZA has been approved by the HFSC. The following projects are implementable/under
consideration with financing of Grihayan Tahobil and under the supervision of BEPZA:
(i) BEPZA authority has submitted two project proposals for the housing of women workers of
Dhaka and Chittagong EPZs. The estimated cost amounts to Tk. 500 million. BEPZA authority
has been requested to send project related necessary information by verifying/appraising the
submitted two proposals.
(ii) To construct two hostels/dormitories in Mongla and Uttara EPZs.
(iii) To implement multi-storey building construction project with financing of Grihayan
Tahobil in 12.66 acre land of Shelter Project provided by BEPZA for the non-Bengali families in
Adamjee EPZ. But very recently BEPZA authority has expressed its inability to implement the
project.
Composition of Grihayan Tahobil (Housing Fund) Steering Committee
Grihayan Tahobil (Housing Fund) Steering Committee (HFSC) consists of thirteen members
with the Chief Secretary, Prime Minister‟s Office, as the Chair and Adviser, Grihayan Tahobil,
Fund Management Unit, as the Member-Secretary. Other eleven members of the HFSC are:
Governor, Bangladesh Bank, Secretary, Ministry of Finance (Finance Division), Secretary,

6
Ministry of Finance (Banking and Financial Institution Division), Secretary, Local Government
Division, Secretary, Ministry of Social Welfare, Secretary, Ministry of Land, Secretary, Ministry
of Housing and Public Works, Secretary, Ministry of Women and Children Affairs, Director,
NGO Affairs Bureau, Miss Aroma Dutt, Executive Director, PREEP Trust, Dhaka, and Momota
Chakladar, Executive Director, Pabna Promise, Pabna.
Provision of Grant Facilities
As regards the provision of loan/grant from Grihayan Tahobil, within the HFSC approved policy
there is a provision for 20 percent grant allocation from the total fund for natural catastrophes
e.g. housing grants for cyclone and flood affected people.
I.2 Objective of the Study
The central objective of the study is two-fold: (i) evaluation of social program of Grihayan
Tahobil (Housing Fund), and (ii) evaluation of the economic and social status of the beneficiaries
of Grihayan Tahobil (Housing Fund) and assessment of the overall social impact of the Project.
I.3 Methodology of the Study
To accomplish the above objectives, the study has made use of both primary and secondary
information. The secondary data were obtained from various official sources especially the
project office. These were analyzed to gain insights into the operational aspects of the HF
Program (HFP) and to understand the spatial distribution of its main beneficiaries. To
complement the available information, primary data were collected through structured open and
close-ended questionnaires from the beneficiaries and different organizations and persons
involved in the implementation of the program. We have also collected information through key
informant interviews and group discussions.
7
To understand the targeting efficiency of the program and the impact of the program on the
targeted population, information were collected from a representative group of non-beneficiaries,
and were juxtaposed with the beneficiary group. A wide range of information pertaining to
economic and social life of the rural people were collected. To assess whether the program is
custom-tailored to accommodate the local problems and align with the local opportunities, the
nature and growth drivers of the locality has also been collected to match with the supported
activities under this program. The views of different stakeholders of the program have been
gathered through 45 key informants interviews (KIIs) as well. In addition qualitative data were
collected through 25 Focus Group Discussions (FGDs) of the beneficiaries in which all together
184 people participated (19.56% female and 80.44% male). To understand the institutional
aspects of the program the implementing Housing Fund Management Unit (HFMU) and NGOs
were personally interviewed through checklists.
1.3.1 Selection of Sample
To ensure that the selected sample population represents unbiased and nationally representative
information, the survey has covered almost all the divisions and 48 districts of Bangladesh. After
long discussion with Housing Fund Authority and NGO representatives, it has been decided that
to get actual picture of the impact of the program sample households would be selected from
those households who have received housing fund loan between 2014 and 2017. Then the
Housing Fund Authority provided lists of 5,485 households, who built their houses between
2014 and 2017, and of 78 NGOs. From these lists 47 NGOs from all over Bangladesh have been
selected randomly. With the help of those NGOs 1700 beneficiary households have been selected
systematically from 48 districts for survey.
According to the existing literature, it is better to compare the beneficiaries with non-
beneficiaries in order to understand the real impact of a program. Therefore, 300 non-program
households, who were not benefitted from the Housing Fund loan, have also been selected from
the same districts and Upazilas.
8
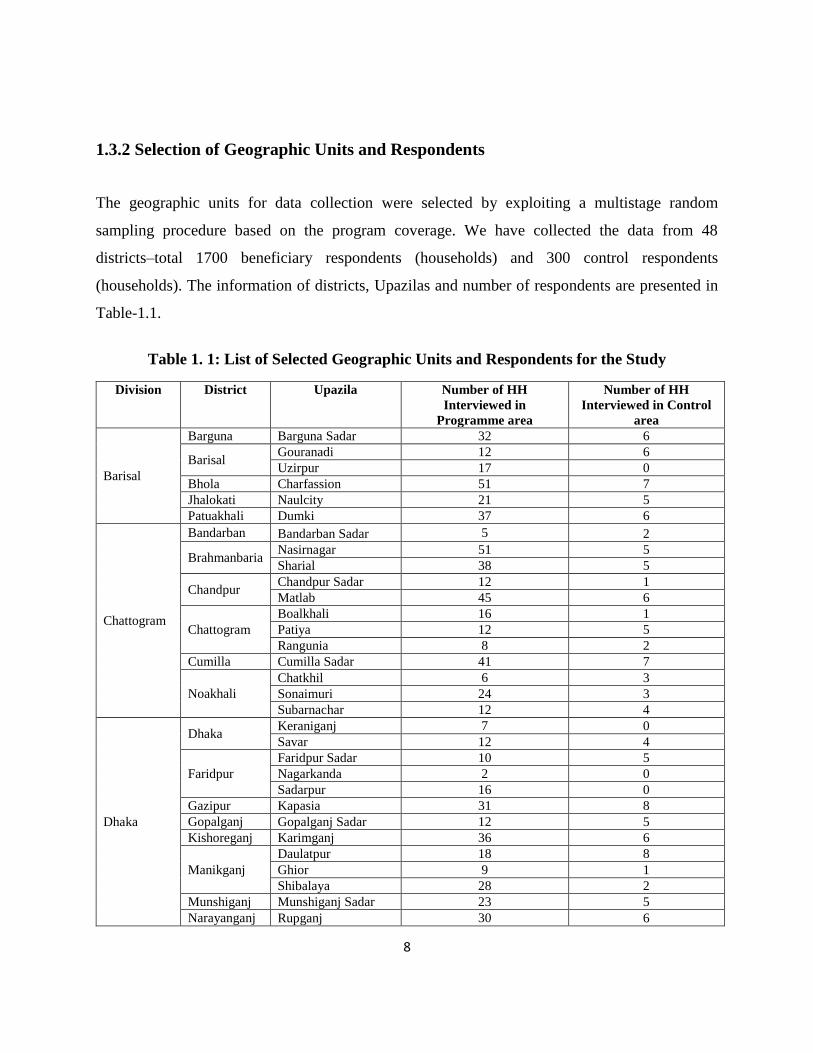
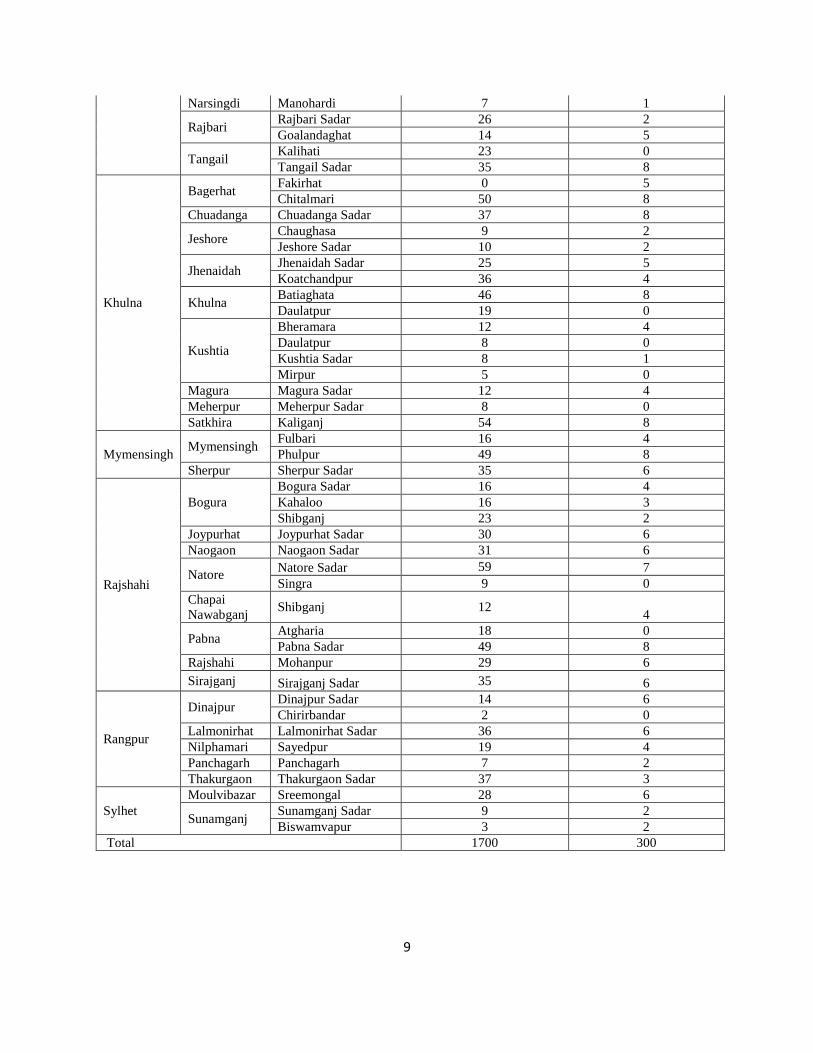
1.3.2 Selection of Geographic Units and Respondents
The geographic units for data collection were selected by exploiting a multistage random
sampling procedure based on the program coverage. We have collected the data from 48
districts–total 1700 beneficiary respondents (households) and 300 control respondents
(households). The information of districts, Upazilas and number of respondents are presented in
Table-1.1.
Table 1. 1: List of Selected Geographic Units and Respondents for the Study
Division
District
Upazila
Number of HH
Interviewed in
Programme area
Number of HH
Interviewed in Control
area
Barisal
Barguna Barguna Sadar 32 6
Barisal Gouranadi 12 6
Uzirpur 17 0
Bhola Charfassion 51 7
Jhalokati Naulcity 21 5
Patuakhali Dumki 37 6
Chattogram
Bandarban Bandarban Sadar 5 2
Brahmanbaria Nasirnagar 51 5
Sharial 38 5
Chandpur Chandpur Sadar 12 1
Matlab 45 6
Chattogram
Boalkhali 16 1
Patiya 12 5
Rangunia 8 2
Cumilla Cumilla Sadar 41 7
Noakhali
Chatkhil 6 3
Sonaimuri 24 3
Subarnachar 12 4
Dhaka
Dhaka Keraniganj 7 0
Savar 12 4
Faridpur
Faridpur Sadar 10 5
Nagarkanda 2 0
Sadarpur 16 0
Gazipur Kapasia 31 8
Gopalganj Gopalganj Sadar 12 5
Kishoreganj Karimganj 36 6
Manikganj
Daulatpur 18 8
Ghior 9 1
Shibalaya 28 2
Munshiganj Munshiganj Sadar 23 5
Narayanganj Rupganj 30 6
9
Narsingdi Manohardi 7 1
Rajbari Rajbari Sadar 26 2
Goalandaghat 14 5
Tangail Kalihati 23 0
Tangail Sadar 35 8
Khulna
Bagerhat Fakirhat 0 5
Chitalmari 50 8
Chuadanga Chuadanga Sadar 37 8
Jeshore Chaughasa 9 2
Jeshore Sadar 10 2
Jhenaidah Jhenaidah Sadar 25 5
Koatchandpur 36 4
Khulna Batiaghata 46 8
Daulatpur 19 0
Kushtia
Bheramara 12 4
Daulatpur 8 0
Kushtia Sadar 8 1
Mirpur 5 0
Magura Magura Sadar 12 4
Meherpur Meherpur Sadar 8 0
Satkhira Kaliganj 54 8
Mymensingh Mymensingh
Fulbari 16 4
Phulpur 49 8
Sherpur Sherpur Sadar 35 6
Rajshahi
Bogura
Bogura Sadar 16 4
Kahaloo 16 3
Shibganj 23 2
Joypurhat Joypurhat Sadar 30 6
Naogaon Naogaon Sadar 31 6
Natore Natore Sadar 59 7
Singra 9 0
Chapai
Nawabganj Shibganj 12
4
Pabna Atgharia 18 0
Pabna Sadar 49 8
Rajshahi Mohanpur 29 6
Sirajganj Sirajganj Sadar 35 6
Rangpur
Dinajpur Dinajpur Sadar 14 6
Chirirbandar 2 0
Lalmonirhat Lalmonirhat Sadar 36 6
Nilphamari Sayedpur 19 4
Panchagarh Panchagarh 7 2
Thakurgaon Thakurgaon Sadar 37 3
Sylhet
Moulvibazar Sreemongal 28 6
Sunamganj Sunamganj Sadar 9 2
Biswamvapur 3 2
Total 1700 300
10
Data
In keeping with the central objectives of the proposed study, information were collected through
a structured questionnaire on the following variables (the list is not exhaustive):
-Income-expenditure of the households;
-Socioeconomic background of the respondents and their households;
-Demographic information of the household members;
-Housing condition of provision for water-sanitation;
-Health status and health care utilization by the household;
-Education and employment situation of the household members;
-Women‟s empowerment, early marriage and reproductive health situation etc;
-Use of loan received from Housing Fund program;
-Savings and investment status of the households;
-Use of microcredit;
-Return from microcredit; and
-Perception about the program (problems and prospects).
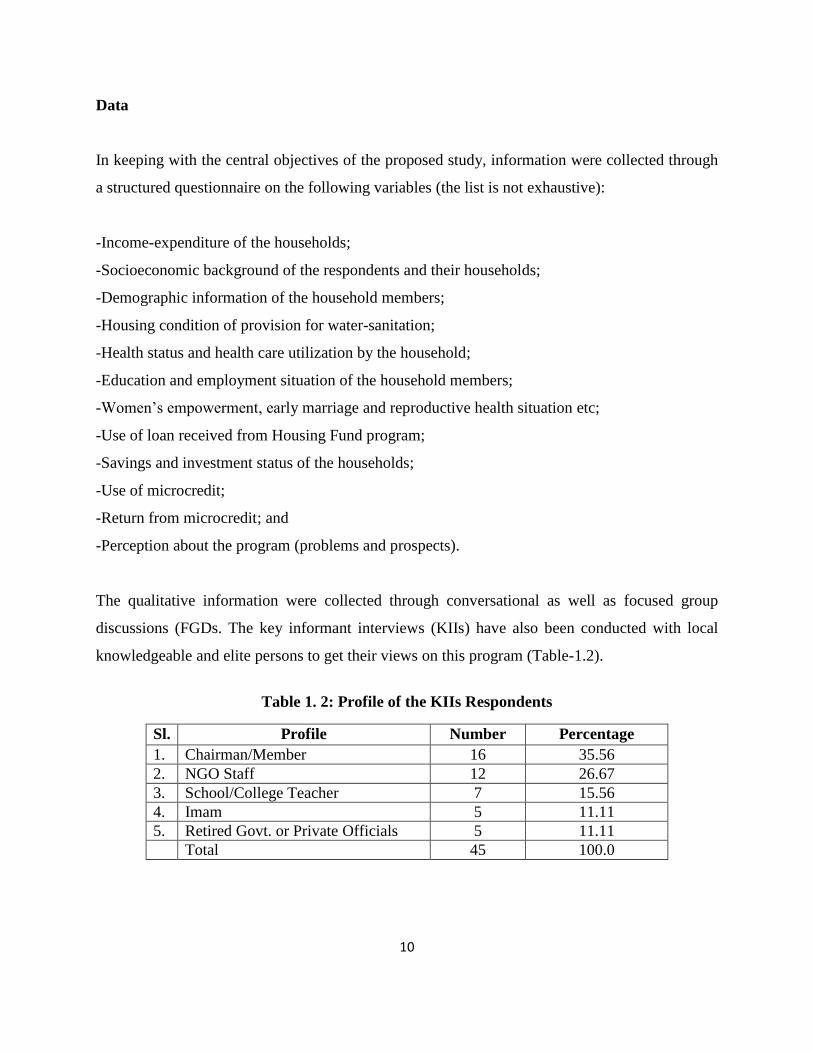
The qualitative information were collected through conversational as well as focused group
discussions (FGDs. The key informant interviews (KIIs) have also been conducted with local
knowledgeable and elite persons to get their views on this program (Table-1.2).
Table 1. 2: Profile of the KIIs Respondents
Sl. Profile Number Percentage
1. Chairman/Member 16 35.56
2. NGO Staff 12 26.67
3. School/College Teacher 7 15.56
4. Imam 5 11.11
5. Retired Govt. or Private Officials 5 11.11
Total 45 100.0
11
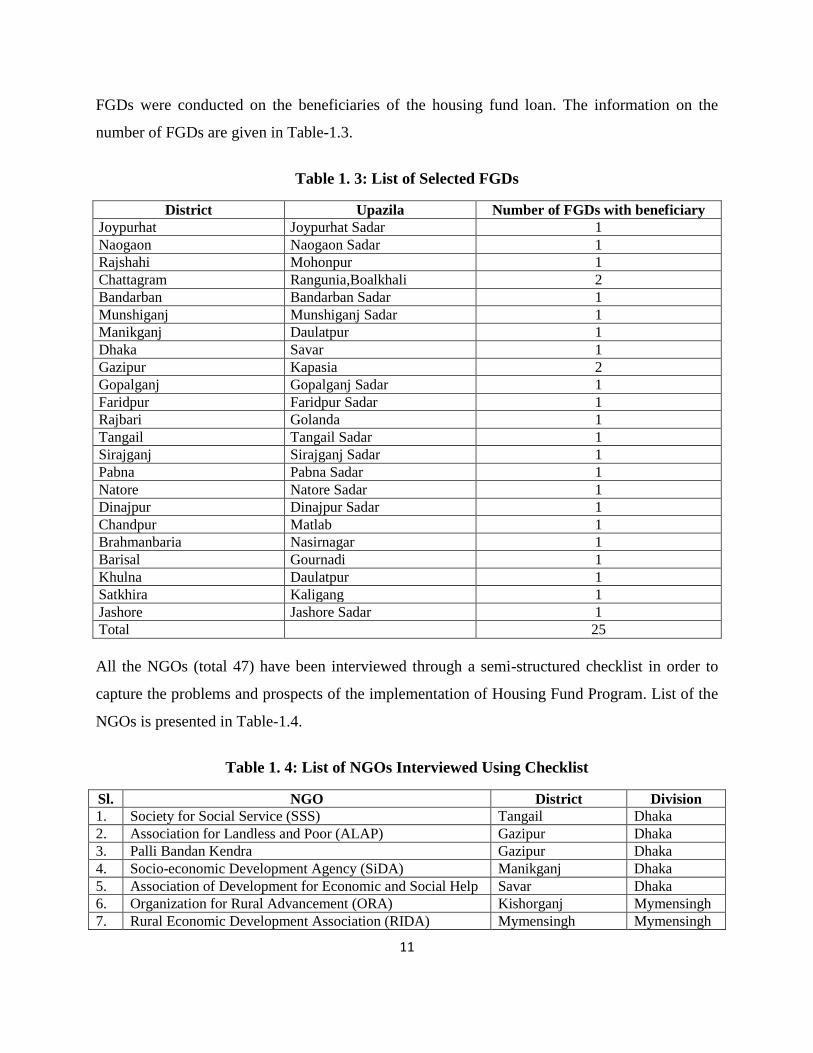
FGDs were conducted on the beneficiaries of the housing fund loan. The information on the
number of FGDs are given in Table-1.3.
Table 1. 3: List of Selected FGDs
District Upazila Number of FGDs with beneficiary
Joypurhat Joypurhat Sadar 1
Naogaon Naogaon Sadar 1
Rajshahi Mohonpur 1
Chattagram Rangunia,Boalkhali 2
Bandarban Bandarban Sadar 1
Munshiganj Munshiganj Sadar 1
Manikganj Daulatpur 1
Dhaka Savar 1
Gazipur Kapasia 2
Gopalganj Gopalganj Sadar 1
Faridpur Faridpur Sadar 1
Rajbari Golanda 1
Tangail Tangail Sadar 1
Sirajganj Sirajganj Sadar 1
Pabna Pabna Sadar 1
Natore Natore Sadar 1
Dinajpur Dinajpur Sadar 1
Chandpur Matlab 1
Brahmanbaria Nasirnagar 1
Barisal Gournadi 1
Khulna Daulatpur 1
Satkhira Kaligang 1
Jashore Jashore Sadar 1
Total 25
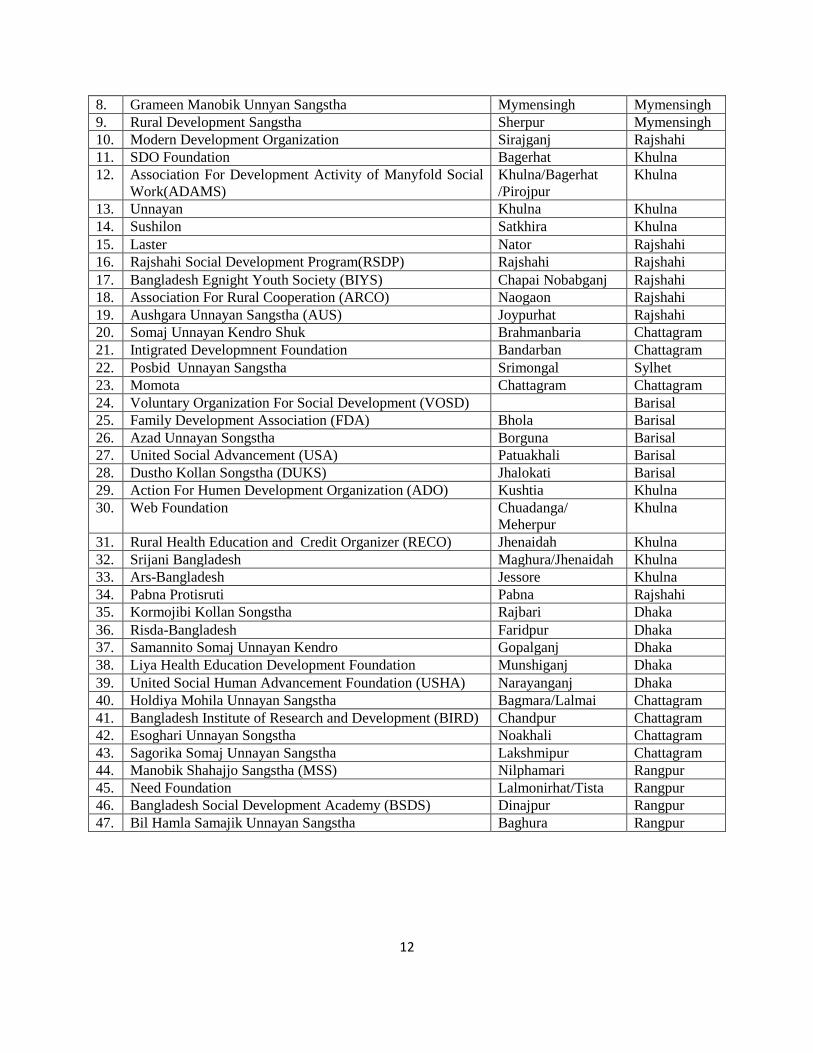
All the NGOs (total 47) have been interviewed through a semi-structured checklist in order to
capture the problems and prospects of the implementation of Housing Fund Program. List of the
NGOs is presented in Table-1.4.
Table 1. 4: List of NGOs Interviewed Using Checklist
Sl. NGO District Division
1. Society for Social Service (SSS) Tangail Dhaka
2. Association for Landless and Poor (ALAP) Gazipur Dhaka
3. Palli Bandan Kendra Gazipur Dhaka
4. Socio-economic Development Agency (SiDA) Manikganj Dhaka
5. Association of Development for Economic and Social Help Savar Dhaka
6. Organization for Rural Advancement (ORA) Kishorganj Mymensingh
7. Rural Economic Development Association (RIDA) Mymensingh Mymensingh
12
8. Grameen Manobik Unnyan Sangstha Mymensingh Mymensingh
9. Rural Development Sangstha Sherpur Mymensingh
10. Modern Development Organization Sirajganj Rajshahi
11. SDO Foundation Bagerhat Khulna
12. Association For Development Activity of Manyfold Social
Work(ADAMS)
Khulna/Bagerhat
/Pirojpur
Khulna
13. Unnayan Khulna Khulna
14. Sushilon Satkhira Khulna
15. Laster Nator Rajshahi
16. Rajshahi Social Development Program(RSDP) Rajshahi Rajshahi
17. Bangladesh Egnight Youth Society (BIYS) Chapai Nobabganj Rajshahi
18. Association For Rural Cooperation (ARCO) Naogaon Rajshahi
19. Aushgara Unnayan Sangstha (AUS) Joypurhat Rajshahi
20. Somaj Unnayan Kendro Shuk Brahmanbaria Chattagram
21. Intigrated Developmnent Foundation Bandarban Chattagram
22. Posbid Unnayan Sangstha Srimongal Sylhet
23. Momota Chattagram Chattagram
24. Voluntary Organization For Social Development (VOSD) Barisal
25. Family Development Association (FDA) Bhola Barisal
26. Azad Unnayan Songstha Borguna Barisal
27. United Social Advancement (USA) Patuakhali Barisal
28. Dustho Kollan Songstha (DUKS) Jhalokati Barisal
29. Action For Humen Development Organization (ADO) Kushtia Khulna
30. Web Foundation Chuadanga/
Meherpur
Khulna
31. Rural Health Education and Credit Organizer (RECO) Jhenaidah Khulna
32. Srijani Bangladesh Maghura/Jhenaidah Khulna
33. Ars-Bangladesh Jessore Khulna
34. Pabna Protisruti Pabna Rajshahi
35. Kormojibi Kollan Songstha Rajbari Dhaka
36. Risda-Bangladesh Faridpur Dhaka
37. Samannito Somaj Unnayan Kendro Gopalganj Dhaka
38. Liya Health Education Development Foundation Munshiganj Dhaka
39. United Social Human Advancement Foundation (USHA) Narayanganj Dhaka
40. Holdiya Mohila Unnayan Sangstha Bagmara/Lalmai Chattagram
41. Bangladesh Institute of Research and Development (BIRD) Chandpur Chattagram
42. Esoghari Unnayan Songstha Noakhali Chattagram
43. Sagorika Somaj Unnayan Sangstha Lakshmipur Chattagram
44. Manobik Shahajjo Sangstha (MSS) Nilphamari Rangpur
45. Need Foundation Lalmonirhat/Tista Rangpur
46. Bangladesh Social Development Academy (BSDS) Dinajpur Rangpur
47. Bil Hamla Samajik Unnayan Sangstha Baghura Rangpur
13
1.4.3 Implementation Strategy
The study started with an extensive review of the available secondary information on the
Housing Fund Program e.g. program documents, in-house survey and evaluation, and other
documents. At this stage, a meeting with the Housing Fund Authority and NGO representatives
was held. This enabled us to grasp basic ideas about the ground reality of the project.
Subsequently, the study team conducted a number of discussion meetings with the relevant
officials about the methodology, sample size, sampling design and contents of the study.
Necessary modifications in the study plan and techniques have been made on the basis of these
discussions. A preliminary questionnaire and other instruments for the survey were prepared
accordingly, and a pretest of the tools has been conducted before finalizing them.
14
II. Socioeconomic Background of the Survey Households
This chapter analyses the socioeconomic and demographic profile of the respondents from both
the program beneficiaries and non-beneficiaries. Information on various aspects of microcredit
has been collected from comparable groups of households to understand the impact of the
Housing Fund loan program.
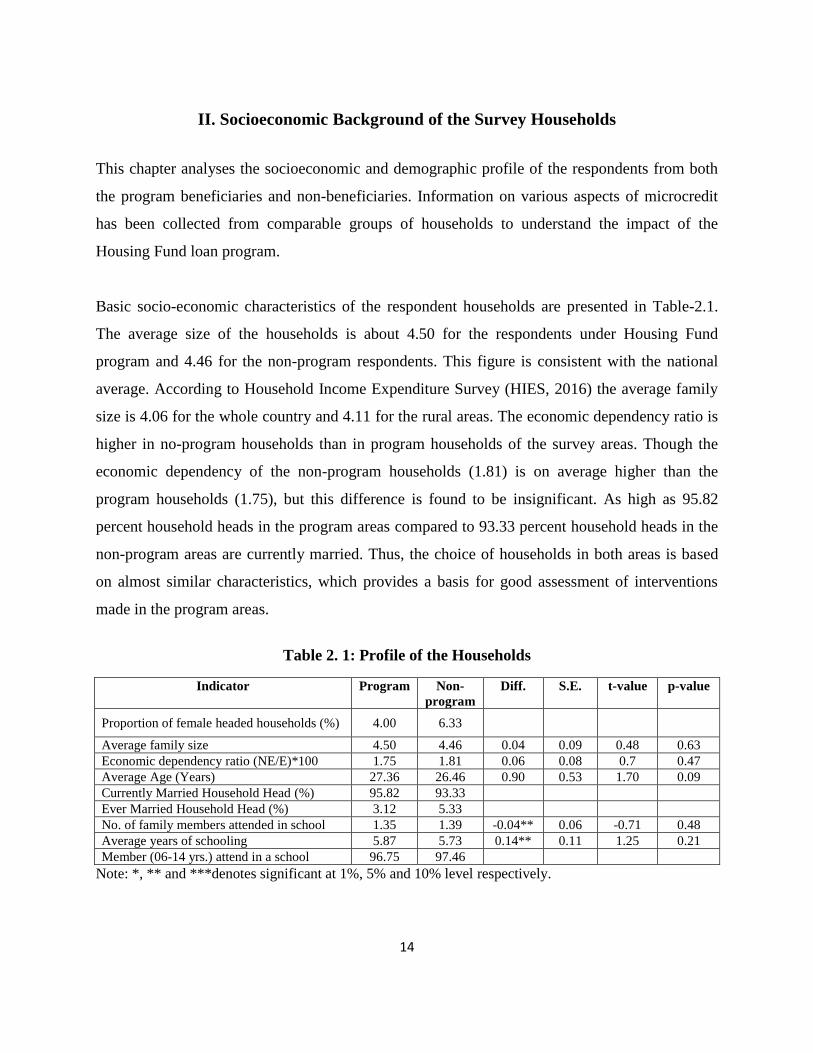
Basic socio-economic characteristics of the respondent households are presented in Table-2.1.
The average size of the households is about 4.50 for the respondents under Housing Fund
program and 4.46 for the non-program respondents. This figure is consistent with the national
average. According to Household Income Expenditure Survey (HIES, 2016) the average family
size is 4.06 for the whole country and 4.11 for the rural areas. The economic dependency ratio is
higher in no-program households than in program households of the survey areas. Though the
economic dependency of the non-program households (1.81) is on average higher than the
program households (1.75), but this difference is found to be insignificant. As high as 95.82
percent household heads in the program areas compared to 93.33 percent household heads in the
non-program areas are currently married. Thus, the choice of households in both areas is based
on almost similar characteristics, which provides a basis for good assessment of interventions
made in the program areas.
Table 2. 1: Profile of the Households
Indicator Program Non-
program
Diff. S.E. t-value p-value
Proportion of female headed households (%) 4.00 6.33
Average family size 4.50 4.46 0.04 0.09 0.48 0.63
Economic dependency ratio (NE/E)*100 1.75 1.81 0.06 0.08 0.7 0.47
Average Age (Years) 27.36 26.46 0.90 0.53 1.70 0.09
Currently Married Household Head (%) 95.82 93.33
Ever Married Household Head (%) 3.12 5.33
No. of family members attended in school 1.35 1.39 -0.04** 0.06 -0.71 0.48
Average years of schooling 5.87 5.73 0.14** 0.11 1.25 0.21
Member (06-14 yrs.) attend in a school 96.75 97.46
Note: *, ** and ***denotes significant at 1%, 5% and 10% level respectively.
15
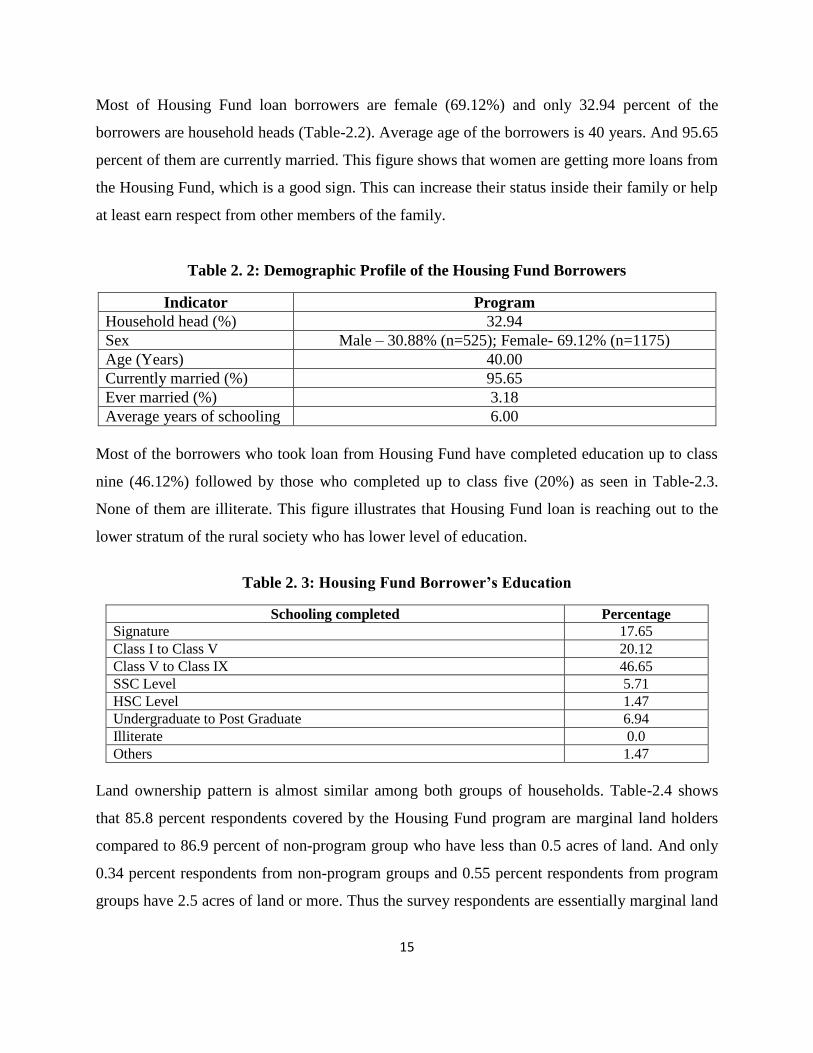
Most of Housing Fund loan borrowers are female (69.12%) and only 32.94 percent of the
borrowers are household heads (Table-2.2). Average age of the borrowers is 40 years. And 95.65
percent of them are currently married. This figure shows that women are getting more loans from
the Housing Fund, which is a good sign. This can increase their status inside their family or help
at least earn respect from other members of the family.
Table 2. 2: Demographic Profile of the Housing Fund Borrowers
Indicator Program
Household head (%) 32.94
Sex Male – 30.88% (n=525); Female- 69.12% (n=1175)
Age (Years) 40.00
Currently married (%) 95.65
Ever married (%) 3.18
Average years of schooling 6.00
Most of the borrowers who took loan from Housing Fund have completed education up to class
nine (46.12%) followed by those who completed up to class five (20%) as seen in Table-2.3.
None of them are illiterate. This figure illustrates that Housing Fund loan is reaching out to the
lower stratum of the rural society who has lower level of education.
Table 2. 3: Housing Fund Borrower’s Education
Schooling completed Percentage
Signature 17.65
Class I to Class V 20.12
Class V to Class IX 46.65
SSC Level 5.71
HSC Level 1.47
Undergraduate to Post Graduate 6.94
Illiterate 0.0
Others 1.47
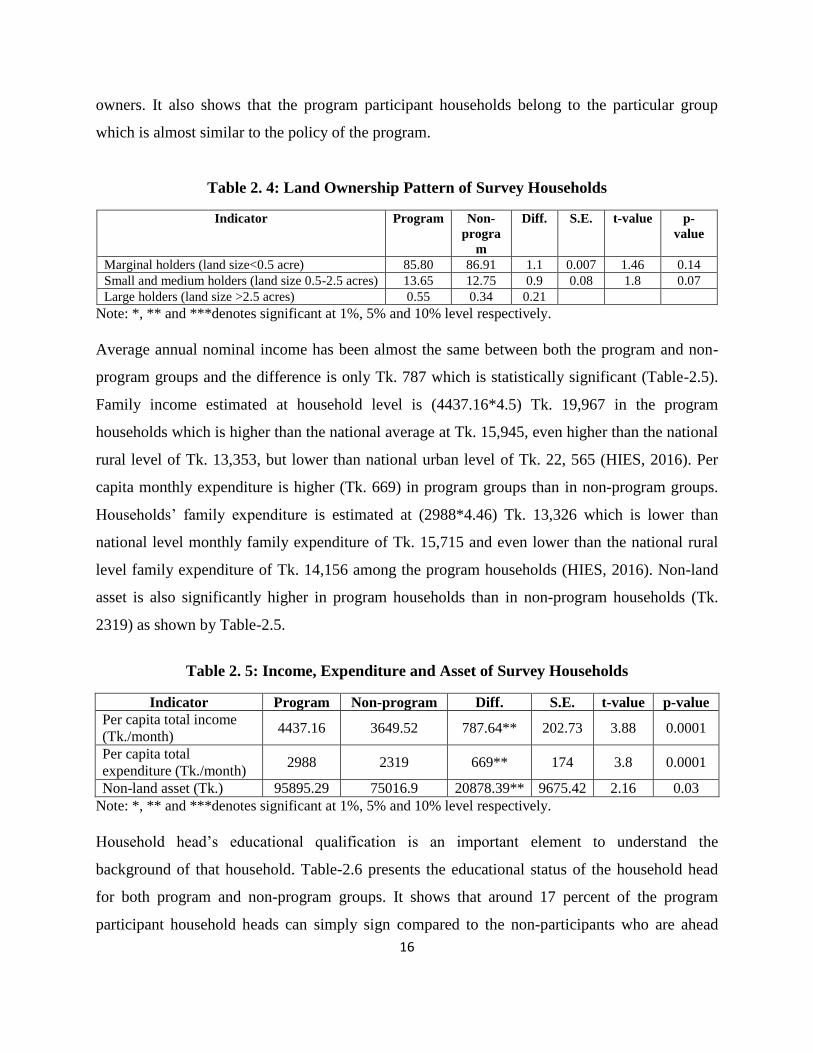
Land ownership pattern is almost similar among both groups of households. Table-2.4 shows
that 85.8 percent respondents covered by the Housing Fund program are marginal land holders
compared to 86.9 percent of non-program group who have less than 0.5 acres of land. And only
0.34 percent respondents from non-program groups and 0.55 percent respondents from program
groups have 2.5 acres of land or more. Thus the survey respondents are essentially marginal land
16
owners. It also shows that the program participant households belong to the particular group
which is almost similar to the policy of the program.
Table 2. 4: Land Ownership Pattern of Survey Households
Indicator Program Non-
progra
m
Diff. S.E. t-value p-
value
Marginal holders (land size<0.5 acre) 85.80 86.91 1.1 0.007 1.46 0.14
Small and medium holders (land size 0.5-2.5 acres) 13.65 12.75 0.9 0.08 1.8 0.07
Large holders (land size >2.5 acres) 0.55 0.34 0.21
Note: *, ** and ***denotes significant at 1%, 5% and 10% level respectively.
Average annual nominal income has been almost the same between both the program and non-
program groups and the difference is only Tk. 787 which is statistically significant (Table-2.5).
Family income estimated at household level is (4437.16*4.5) Tk. 19,967 in the program
households which is higher than the national average at Tk. 15,945, even higher than the national
rural level of Tk. 13,353, but lower than national urban level of Tk. 22, 565 (HIES, 2016). Per
capita monthly expenditure is higher (Tk. 669) in program groups than in non-program groups.
Households‟ family expenditure is estimated at (2988*4.46) Tk. 13,326 which is lower than
national level monthly family expenditure of Tk. 15,715 and even lower than the national rural
level family expenditure of Tk. 14,156 among the program households (HIES, 2016). Non-land
asset is also significantly higher in program households than in non-program households (Tk.
2319) as shown by Table-2.5.
Table 2. 5: Income, Expenditure and Asset of Survey Households
Indicator Program Non-program Diff. S.E. t-value p-value
Per capita total income
(Tk./month) 4437.16 3649.52 787.64** 202.73 3.88 0.0001
Per capita total
expenditure (Tk./month) 2988 2319 669** 174 3.8 0.0001
Non-land asset (Tk.) 95895.29 75016.9 20878.39** 9675.42 2.16 0.03
Note: *, ** and ***denotes significant at 1%, 5% and 10% level respectively.
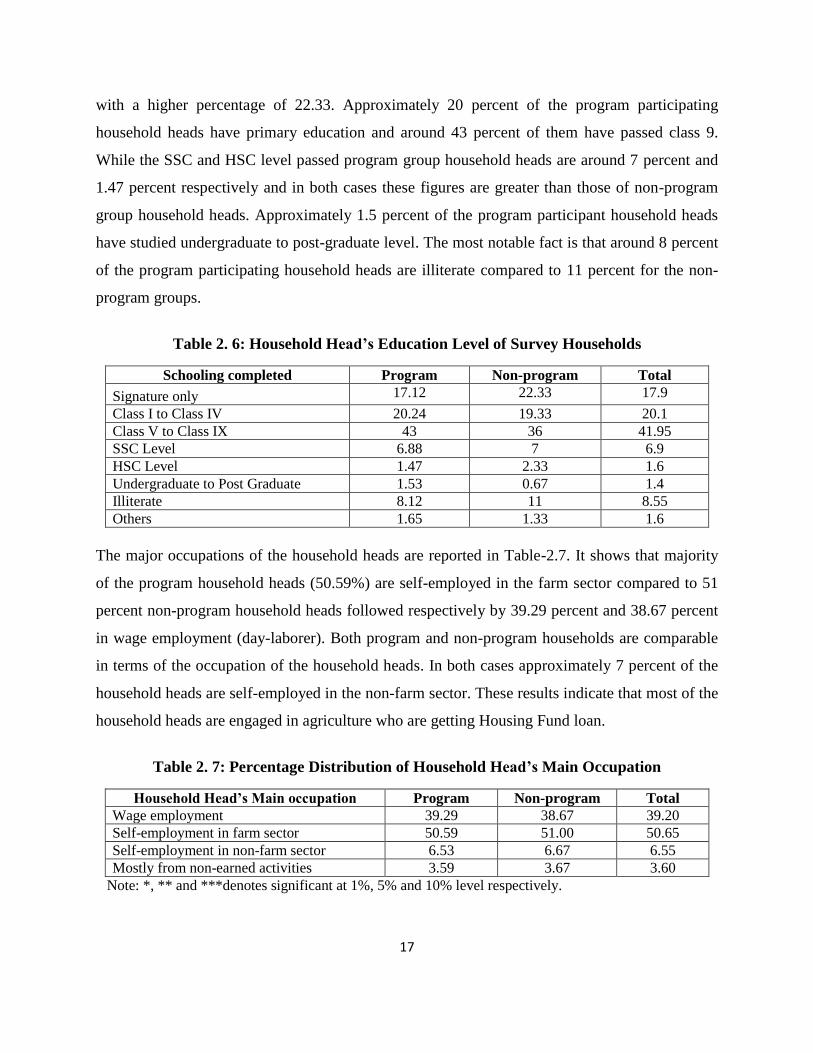
Household head‟s educational qualification is an important element to understand the
background of that household. Table-2.6 presents the educational status of the household head
for both program and non-program groups. It shows that around 17 percent of the program
participant household heads can simply sign compared to the non-participants who are ahead
17
with a higher percentage of 22.33. Approximately 20 percent of the program participating
household heads have primary education and around 43 percent of them have passed class 9.
While the SSC and HSC level passed program group household heads are around 7 percent and
1.47 percent respectively and in both cases these figures are greater than those of non-program
group household heads. Approximately 1.5 percent of the program participant household heads
have studied undergraduate to post-graduate level. The most notable fact is that around 8 percent
of the program participating household heads are illiterate compared to 11 percent for the non-
program groups.
Table 2. 6: Household Head’s Education Level of Survey Households
Schooling completed Program Non-program Total
Signature only 17.12 22.33 17.9
Class I to Class IV 20.24 19.33 20.1
Class V to Class IX 43 36 41.95
SSC Level 6.88 7 6.9
HSC Level 1.47 2.33 1.6
Undergraduate to Post Graduate 1.53 0.67 1.4
Illiterate 8.12 11 8.55
Others 1.65 1.33 1.6
The major occupations of the household heads are reported in Table-2.7. It shows that majority
of the program household heads (50.59%) are self-employed in the farm sector compared to 51
percent non-program household heads followed respectively by 39.29 percent and 38.67 percent
in wage employment (day-laborer). Both program and non-program households are comparable
in terms of the occupation of the household heads. In both cases approximately 7 percent of the
household heads are self-employed in the non-farm sector. These results indicate that most of the
household heads are engaged in agriculture who are getting Housing Fund loan.
Table 2. 7: Percentage Distribution of Household Head’s Main Occupation
Household Head’s Main occupation Program Non-program Total
Wage employment 39.29 38.67 39.20
Self-employment in farm sector 50.59 51.00 50.65
Self-employment in non-farm sector 6.53 6.67 6.55
Mostly from non-earned activities 3.59 3.67 3.60
Note: *, ** and ***denotes significant at 1%, 5% and 10% level respectively.
18
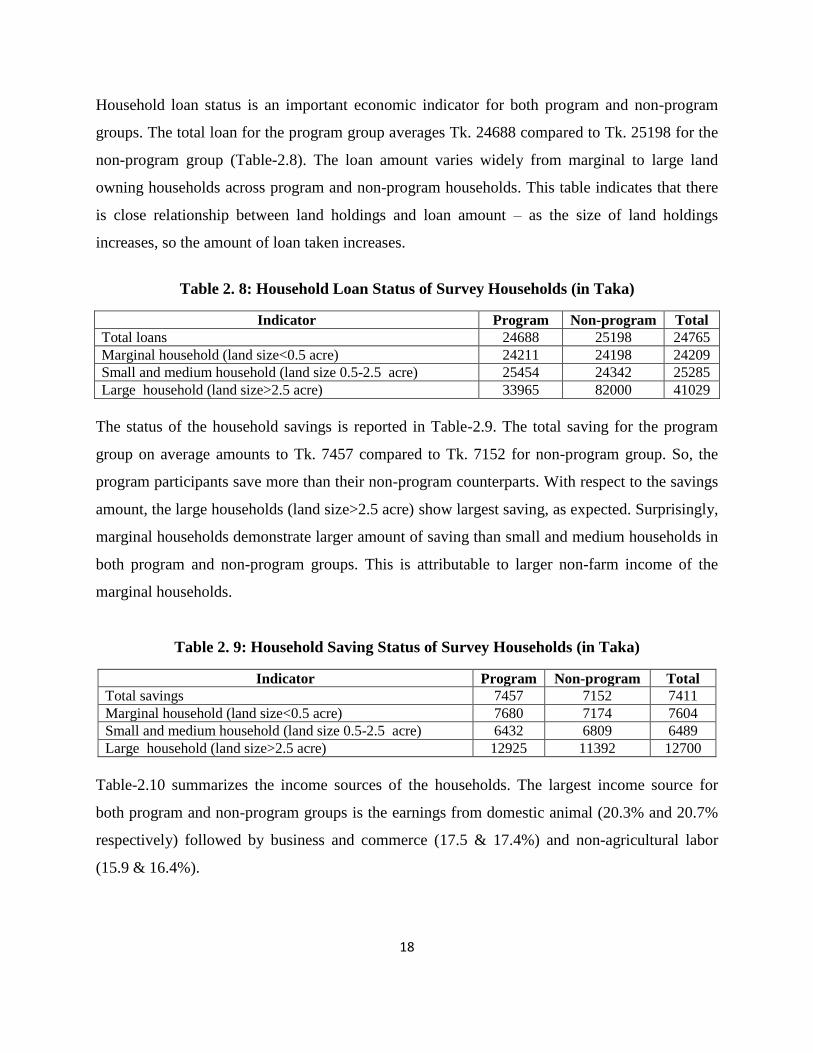
Household loan status is an important economic indicator for both program and non-program
groups. The total loan for the program group averages Tk. 24688 compared to Tk. 25198 for the
non-program group (Table-2.8). The loan amount varies widely from marginal to large land
owning households across program and non-program households. This table indicates that there
is close relationship between land holdings and loan amount – as the size of land holdings
increases, so the amount of loan taken increases.
Table 2. 8: Household Loan Status of Survey Households (in Taka)
Indicator Program Non-program Total
Total loans 24688 25198 24765
Marginal household (land size<0.5 acre) 24211 24198 24209
Small and medium household (land size 0.5-2.5 acre) 25454 24342 25285
Large household (land size>2.5 acre) 33965 82000 41029
The status of the household savings is reported in Table-2.9. The total saving for the program
group on average amounts to Tk. 7457 compared to Tk. 7152 for non-program group. So, the
program participants save more than their non-program counterparts. With respect to the savings
amount, the large households (land size>2.5 acre) show largest saving, as expected. Surprisingly,
marginal households demonstrate larger amount of saving than small and medium households in
both program and non-program groups. This is attributable to larger non-farm income of the
marginal households.
Table 2. 9: Household Saving Status of Survey Households (in Taka)
Indicator Program Non-program Total
Total savings 7457 7152 7411
Marginal household (land size<0.5 acre) 7680 7174 7604
Small and medium household (land size 0.5-2.5 acre) 6432 6809 6489
Large household (land size>2.5 acre) 12925 11392 12700
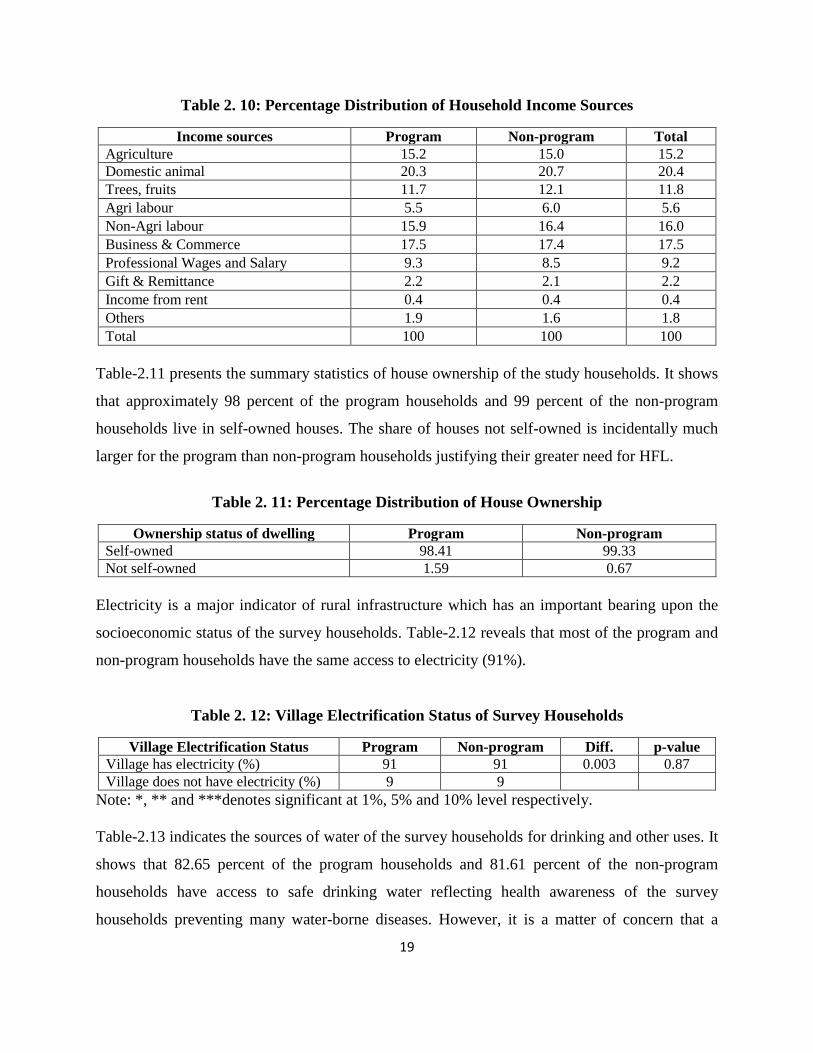
Table-2.10 summarizes the income sources of the households. The largest income source for
both program and non-program groups is the earnings from domestic animal (20.3% and 20.7%
respectively) followed by business and commerce (17.5 & 17.4%) and non-agricultural labor
(15.9 & 16.4%).
19
Table 2. 10: Percentage Distribution of Household Income Sources
Income sources Program Non-program Total
Agriculture 15.2 15.0 15.2
Domestic animal 20.3 20.7 20.4
Trees, fruits 11.7 12.1 11.8
Agri labour 5.5 6.0 5.6
Non-Agri labour 15.9 16.4 16.0
Business & Commerce 17.5 17.4 17.5
Professional Wages and Salary 9.3 8.5 9.2
Gift & Remittance 2.2 2.1 2.2
Income from rent 0.4 0.4 0.4
Others 1.9 1.6 1.8
Total 100 100 100
Table-2.11 presents the summary statistics of house ownership of the study households. It shows
that approximately 98 percent of the program households and 99 percent of the non-program
households live in self-owned houses. The share of houses not self-owned is incidentally much
larger for the program than non-program households justifying their greater need for HFL.
Table 2. 11: Percentage Distribution of House Ownership
Ownership status of dwelling Program Non-program
Self-owned 98.41 99.33
Not self-owned 1.59 0.67
Electricity is a major indicator of rural infrastructure which has an important bearing upon the
socioeconomic status of the survey households. Table-2.12 reveals that most of the program and
non-program households have the same access to electricity (91%).
Table 2. 12: Village Electrification Status of Survey Households
Village Electrification Status Program Non-program Diff. p-value
Village has electricity (%) 91 91 0.003 0.87
Village does not have electricity (%) 9 9
Note: *, ** and ***denotes significant at 1%, 5% and 10% level respectively.
Table-2.13 indicates the sources of water of the survey households for drinking and other uses. It
shows that 82.65 percent of the program households and 81.61 percent of the non-program
households have access to safe drinking water reflecting health awareness of the survey
households preventing many water-borne diseases. However, it is a matter of concern that a
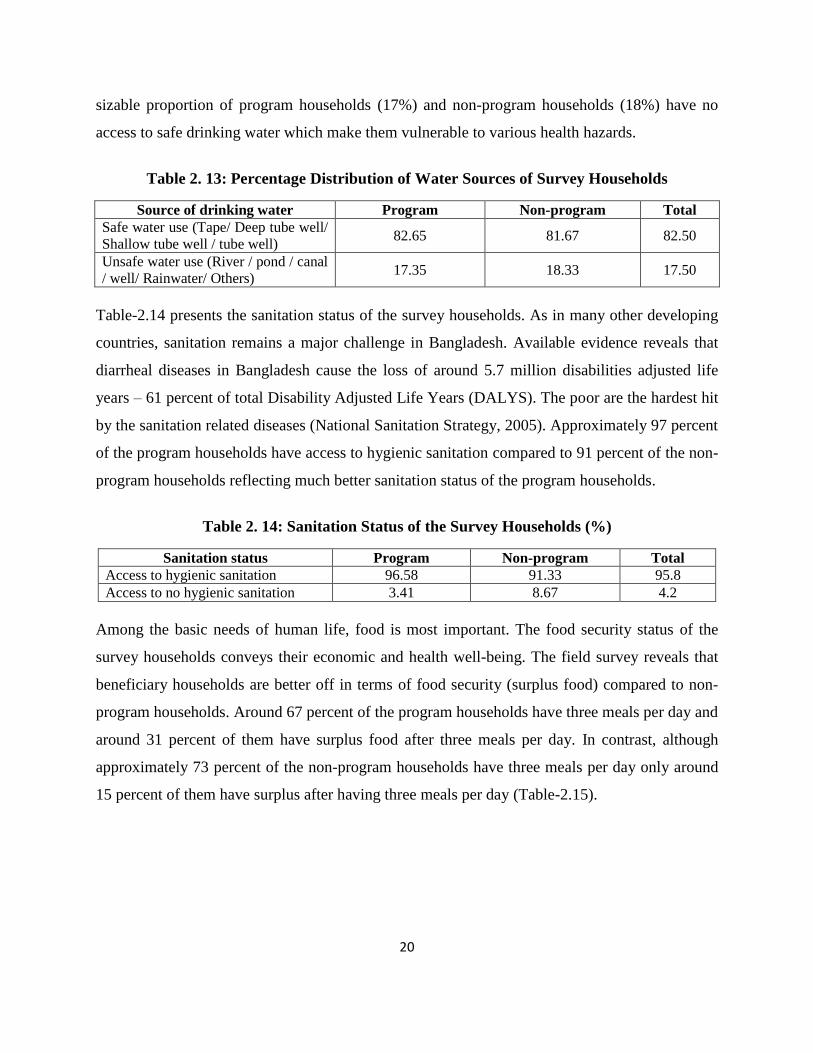
20
sizable proportion of program households (17%) and non-program households (18%) have no
access to safe drinking water which make them vulnerable to various health hazards.
Table 2. 13: Percentage Distribution of Water Sources of Survey Households
Source of drinking water Program Non-program Total
Safe water use (Tape/ Deep tube well/
Shallow tube well / tube well) 82.65 81.67 82.50
Unsafe water use (River / pond / canal
/ well/ Rainwater/ Others) 17.35 18.33 17.50
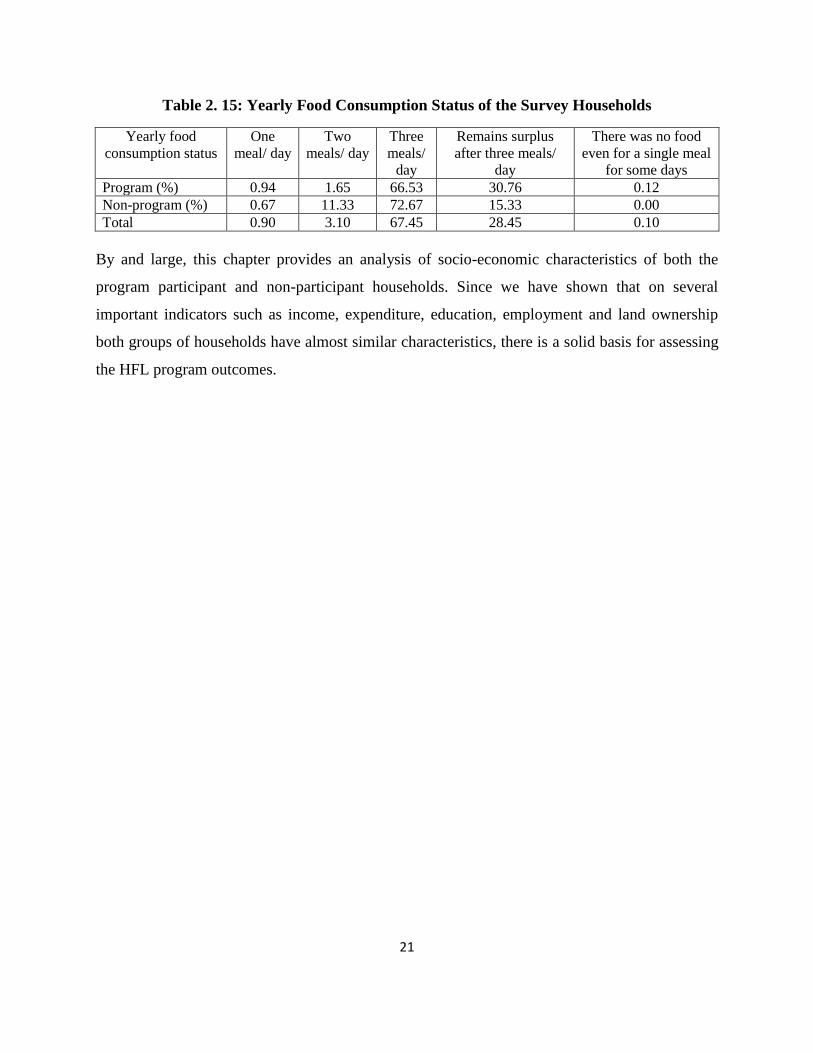
Table-2.14 presents the sanitation status of the survey households. As in many other developing
countries, sanitation remains a major challenge in Bangladesh. Available evidence reveals that
diarrheal diseases in Bangladesh cause the loss of around 5.7 million disabilities adjusted life
years – 61 percent of total Disability Adjusted Life Years (DALYS). The poor are the hardest hit
by the sanitation related diseases (National Sanitation Strategy, 2005). Approximately 97 percent
of the program households have access to hygienic sanitation compared to 91 percent of the non-
program households reflecting much better sanitation status of the program households.
Table 2. 14: Sanitation Status of the Survey Households (%)
Sanitation status Program Non-program Total
Access to hygienic sanitation 96.58 91.33 95.8
Access to no hygienic sanitation 3.41 8.67 4.2
Among the basic needs of human life, food is most important. The food security status of the
survey households conveys their economic and health well-being. The field survey reveals that
beneficiary households are better off in terms of food security (surplus food) compared to non-
program households. Around 67 percent of the program households have three meals per day and
around 31 percent of them have surplus food after three meals per day. In contrast, although
approximately 73 percent of the non-program households have three meals per day only around
15 percent of them have surplus after having three meals per day (Table-2.15).
21
Table 2. 15: Yearly Food Consumption Status of the Survey Households
Yearly food
consumption status
One
meal/ day
Two
meals/ day
Three
meals/
day
Remains surplus
after three meals/
day
There was no food
even for a single meal
for some days
Program (%) 0.94 1.65 66.53 30.76 0.12
Non-program (%) 0.67 11.33 72.67 15.33 0.00
Total 0.90 3.10 67.45 28.45 0.10
By and large, this chapter provides an analysis of socio-economic characteristics of both the
program participant and non-participant households. Since we have shown that on several
important indicators such as income, expenditure, education, employment and land ownership
both groups of households have almost similar characteristics, there is a solid basis for assessing
the HFL program outcomes.

22
III. Analysis and Evaluation of Overall Program of Fund Management Unit
III.1 Legal framework
The creation of Grihayan Tahobil (Housing Fund) is based on the executive order of the Prime
Minister. The impact of this executive order on the legislative process is clearly executive
lawmaking – a prerogative of the Prime Minister. This order enjoys the force of law and
constitutes no infringement of the powers and duties of the National Parliament or a specific
appropriation for the purpose of the executive order.
III.2 Evaluating the structure and management of Housing Fund
Grihayan Tahobil (Housing Fund) is managed by the Grihayan Tahobil (Housing Fund)
Management Unit (HFMU) under the supervision of high-powered steering committee at the
helm of the Chief Secretary of the Honorable Prime Minister. One Deputy Governor/Executive
Director of Bangladesh Bank works as the ex officio Adviser or the Chief Executive of the
HFMU. Side by side with the responsibility of the Chief Executive of the HFMU, he/she
discharges the responsibility of the Member-Secretary of HFSC. Currently, one Mr. Abdur
Rahim, Executive Director of Bangladesh Bank is working as the Adviser of the HFMU. For the
organization and management of HFMU, 25 officers and 10 employees are working full-time
including one HFMU Manager (General Manager).
The structure of the HFMU works well and is fine for all practical purposes. Discussions with
the HFMU staff reveal that there is acute shortage of HFMU staff especially for field
supervision. Besides, money allocated for field visits by HFMU staff is also reportedly
inadequate. This works to the detriment of smooth field supervision of HFMU.
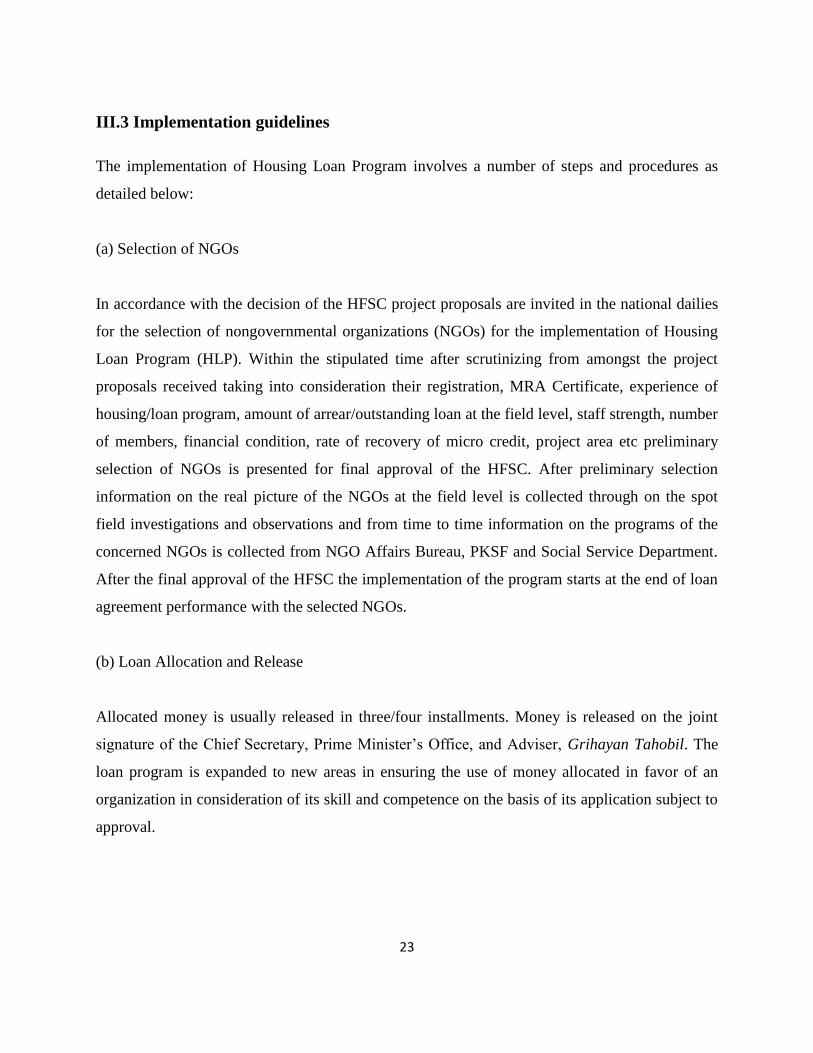
23
III.3 Implementation guidelines
The implementation of Housing Loan Program involves a number of steps and procedures as
detailed below:
(a) Selection of NGOs
In accordance with the decision of the HFSC project proposals are invited in the national dailies
for the selection of nongovernmental organizations (NGOs) for the implementation of Housing
Loan Program (HLP). Within the stipulated time after scrutinizing from amongst the project
proposals received taking into consideration their registration, MRA Certificate, experience of
housing/loan program, amount of arrear/outstanding loan at the field level, staff strength, number
of members, financial condition, rate of recovery of micro credit, project area etc preliminary
selection of NGOs is presented for final approval of the HFSC. After preliminary selection
information on the real picture of the NGOs at the field level is collected through on the spot
field investigations and observations and from time to time information on the programs of the
concerned NGOs is collected from NGO Affairs Bureau, PKSF and Social Service Department.
After the final approval of the HFSC the implementation of the program starts at the end of loan
agreement performance with the selected NGOs.
(b) Loan Allocation and Release
Allocated money is usually released in three/four installments. Money is released on the joint
signature of the Chief Secretary, Prime Minister‟s Office, and Adviser, Grihayan Tahobil. The
loan program is expanded to new areas in ensuring the use of money allocated in favor of an
organization in consideration of its skill and competence on the basis of its application subject to
approval.
24
(c) Field Level Program
At the field level, currently Tk. 70,000 (seventy thousand) is provided by the selected NGOs to
each loan receiver as loan assistance in order to build house (including a sanitary latrine)
measuring 220–300 sq. ft. according to the specification approved by Grihayan Tahobil. The
loan receivers must be inclusive of project target groups and capable of loan repayment.
(d) Loan Recovery
The loan recovery period is minimum 3 (three) and maximum 10 (ten) years with 6 months grace
period and the loan receivers at the field level repays loan in monthly/weekly installments at 6
percent simple interest. The implementing NGOs repays loan to the Grihayan Tahobil in six-
monthly installments in keeping with the loan recovery period of the field level along with 2
percent simple interest.
(e) Program Implementation/Supervision
HFMU discharges the responsibility of implementing and supervising the field level program of
the NGOs finally selected by the HFSC. Allocated money in favor of the NGOs is released from
the Grihayan Tahobil in three/four installments. As regards proper utilization of money of the
first installment the organization submits the name of the loan receiver, detailed report with
address (including recommendations of local verification/appraisal committee) and house
building and transfer related certificates. After the receipt of the report the supervisors of the
HFMU through spot investigation at the field level verifies/appraises the rightness/accuracy of
the report submitted by the NGO. There is an Upazila Housing Program Supervision and
Coordination Committee at the helm of Upazila Nirbahi Officer in order to supervise and
coordinate the implementation of this program at the Upazila level.
25
III.4 Analysis of NGO selection process by Housing Fund Management Unit
NGO selection process by HFMU is working well to meet the ground realities of loan program at
the field level. In several instances showcase NGOs are selected repeatedly in order to affirm
credibility, economy and efficiency in the whole system. The process is intricate and time-taking
but reflects transparency and accountability of HFMU.
III.5 Analysis and evaluation of HF related field level programs of the NGOs
Table-3.1 gives statistics showing the aspects of monitoring the house construction with the
Housing Fund Loan (HFL). Beneficiaries of the HFL confirm that NGO officials visit the house
during construction process in every case with a view to monitoring the design and quality of the
house. The table shows that on average approximately 5 times the NGO officials visit a house
construction process to ensure the quality of the equipment along with the full utilization of the
loans. During these visits to the house construction, the NGO officials give them suggestions
about the quality of materials (95%) and evaluate the house standard (89%). Approximately 94
percent of the interviewed beneficiaries have ensured that the NGO officials have also inquired
about the full spending of the Housing Fund loan so that the money allotted for construction of
houses cannot be diverted to other uses. All this points to the evidence that NGO officials are
very much active and attentive to the house construction processes and full utilization of the
HFL. In the same vein, around 88 percent of the interviewed beneficiaries have confirmed that
Housing Fund Authority officials also visit the house construction process with more than one
visit per house in order to monitor the construction design and quality of the houses. Despite
short span surprise visit compared to the intensive field visits of the NGO officials, the Housing
Fund Authority officials have given suggestions about the quality of construction materials to the
beneficiaries in around 66 percent of the cases and verified the standard of the house built with
the loan money in around 70 percent cases. In addition, they have also investigated the full
utilization of the loan money amount in around 76 percent of cases of the construction of the
houses. From the above analysis it stands out that the monitoring and supervision of the house
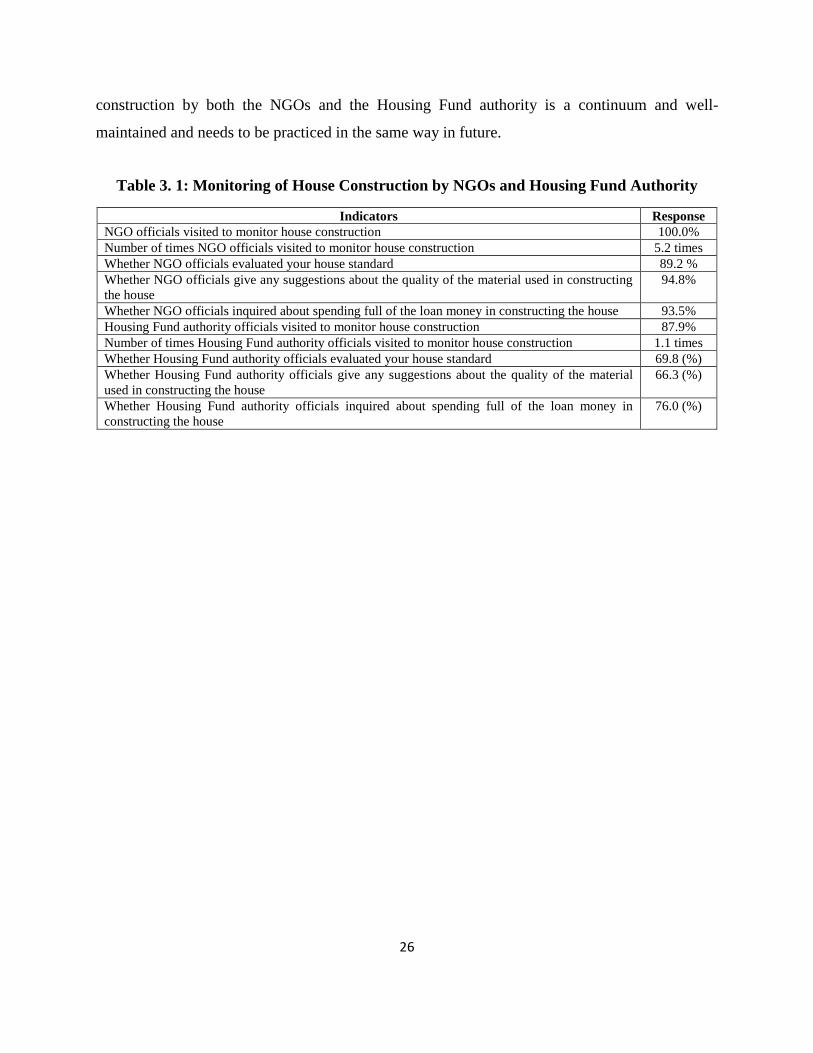
26
construction by both the NGOs and the Housing Fund authority is a continuum and well-
maintained and needs to be practiced in the same way in future.
Table 3. 1: Monitoring of House Construction by NGOs and Housing Fund Authority
Indicators Response
NGO officials visited to monitor house construction 100.0%
Number of times NGO officials visited to monitor house construction 5.2 times
Whether NGO officials evaluated your house standard 89.2 %
Whether NGO officials give any suggestions about the quality of the material used in constructing
the house
94.8%
Whether NGO officials inquired about spending full of the loan money in constructing the house 93.5%
Housing Fund authority officials visited to monitor house construction 87.9%
Number of times Housing Fund authority officials visited to monitor house construction 1.1 times
Whether Housing Fund authority officials evaluated your house standard 69.8 (%)
Whether Housing Fund authority officials give any suggestions about the quality of the material
used in constructing the house
66.3 (%)
Whether Housing Fund authority officials inquired about spending full of the loan money in
constructing the house
76.0 (%)
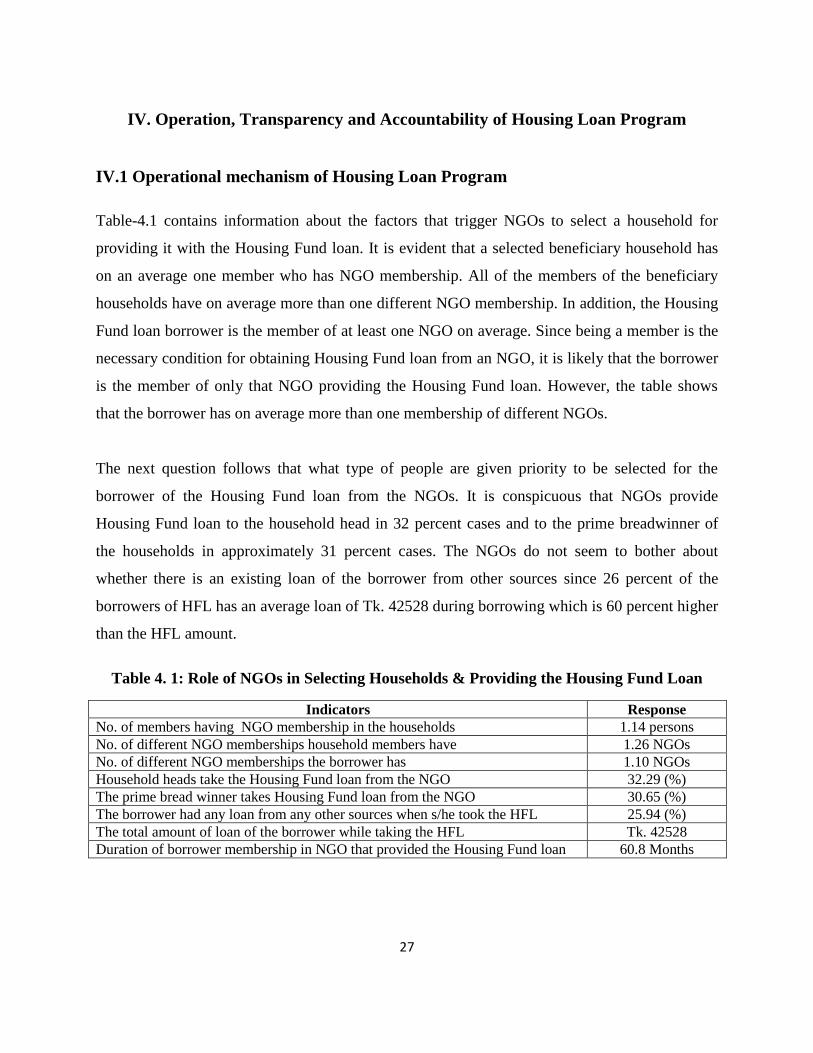
27
IV. Operation, Transparency and Accountability of Housing Loan Program
IV.1 Operational mechanism of Housing Loan Program
Table-4.1 contains information about the factors that trigger NGOs to select a household for
providing it with the Housing Fund loan. It is evident that a selected beneficiary household has
on an average one member who has NGO membership. All of the members of the beneficiary
households have on average more than one different NGO membership. In addition, the Housing
Fund loan borrower is the member of at least one NGO on average. Since being a member is the
necessary condition for obtaining Housing Fund loan from an NGO, it is likely that the borrower
is the member of only that NGO providing the Housing Fund loan. However, the table shows
that the borrower has on average more than one membership of different NGOs.
The next question follows that what type of people are given priority to be selected for the
borrower of the Housing Fund loan from the NGOs. It is conspicuous that NGOs provide
Housing Fund loan to the household head in 32 percent cases and to the prime breadwinner of
the households in approximately 31 percent cases. The NGOs do not seem to bother about
whether there is an existing loan of the borrower from other sources since 26 percent of the
borrowers of HFL has an average loan of Tk. 42528 during borrowing which is 60 percent higher
than the HFL amount.
Table 4. 1: Role of NGOs in Selecting Households & Providing the Housing Fund Loan
Indicators Response
No. of members having NGO membership in the households 1.14 persons
No. of different NGO memberships household members have 1.26 NGOs
No. of different NGO memberships the borrower has 1.10 NGOs
Household heads take the Housing Fund loan from the NGO 32.29 (%)
The prime bread winner takes Housing Fund loan from the NGO 30.65 (%)
The borrower had any loan from any other sources when s/he took the HFL 25.94 (%)
The total amount of loan of the borrower while taking the HFL Tk. 42528
Duration of borrower membership in NGO that provided the Housing Fund loan 60.8 Months
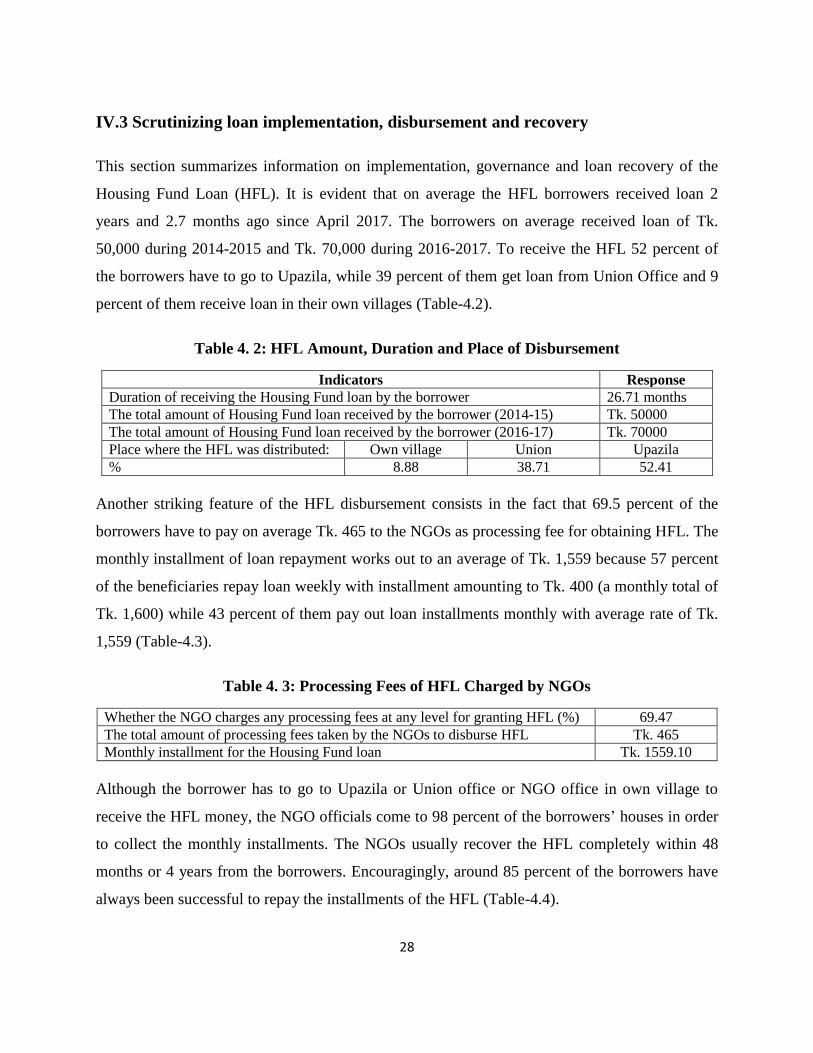
28
IV.3 Scrutinizing loan implementation, disbursement and recovery
This section summarizes information on implementation, governance and loan recovery of the
Housing Fund Loan (HFL). It is evident that on average the HFL borrowers received loan 2
years and 2.7 months ago since April 2017. The borrowers on average received loan of Tk.
50,000 during 2014-2015 and Tk. 70,000 during 2016-2017. To receive the HFL 52 percent of
the borrowers have to go to Upazila, while 39 percent of them get loan from Union Office and 9
percent of them receive loan in their own villages (Table-4.2).
Table 4. 2: HFL Amount, Duration and Place of Disbursement
Indicators Response
Duration of receiving the Housing Fund loan by the borrower 26.71 months
The total amount of Housing Fund loan received by the borrower (2014-15) Tk. 50000
The total amount of Housing Fund loan received by the borrower (2016-17) Tk. 70000
Place where the HFL was distributed: Own village Union Upazila
% 8.88 38.71 52.41
Another striking feature of the HFL disbursement consists in the fact that 69.5 percent of the
borrowers have to pay on average Tk. 465 to the NGOs as processing fee for obtaining HFL. The
monthly installment of loan repayment works out to an average of Tk. 1,559 because 57 percent
of the beneficiaries repay loan weekly with installment amounting to Tk. 400 (a monthly total of
Tk. 1,600) while 43 percent of them pay out loan installments monthly with average rate of Tk.
1,559 (Table-4.3).
Table 4. 3: Processing Fees of HFL Charged by NGOs
Whether the NGO charges any processing fees at any level for granting HFL (%) 69.47
The total amount of processing fees taken by the NGOs to disburse HFL Tk. 465
Monthly installment for the Housing Fund loan Tk. 1559.10
Although the borrower has to go to Upazila or Union office or NGO office in own village to
receive the HFL money, the NGO officials come to 98 percent of the borrowers‟ houses in order
to collect the monthly installments. The NGOs usually recover the HFL completely within 48
months or 4 years from the borrowers. Encouragingly, around 85 percent of the borrowers have
always been successful to repay the installments of the HFL (Table-4.4).
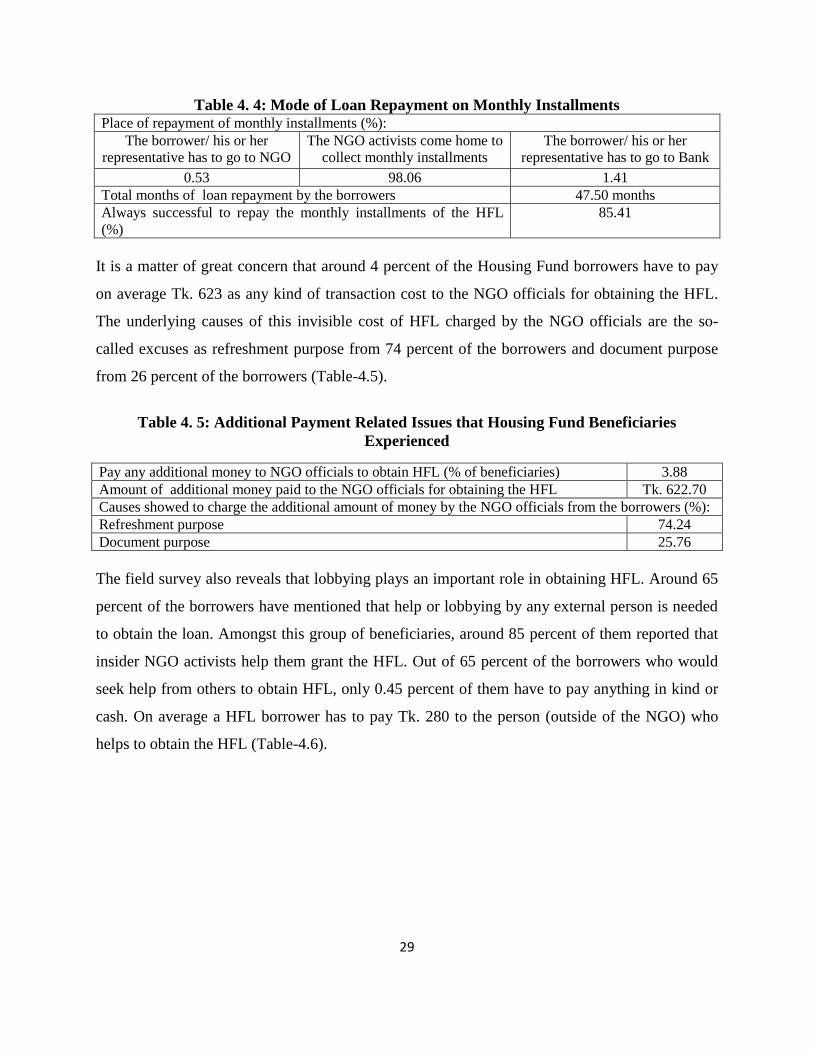
29
Table 4. 4: Mode of Loan Repayment on Monthly Installments Place of repayment of monthly installments (%):
The borrower/ his or her
representative has to go to NGO
The NGO activists come home to
collect monthly installments
The borrower/ his or her
representative has to go to Bank
0.53 98.06 1.41
Total months of loan repayment by the borrowers 47.50 months
Always successful to repay the monthly installments of the HFL
(%)
85.41
It is a matter of great concern that around 4 percent of the Housing Fund borrowers have to pay
on average Tk. 623 as any kind of transaction cost to the NGO officials for obtaining the HFL.
The underlying causes of this invisible cost of HFL charged by the NGO officials are the so-
called excuses as refreshment purpose from 74 percent of the borrowers and document purpose
from 26 percent of the borrowers (Table-4.5).
Table 4. 5: Additional Payment Related Issues that Housing Fund Beneficiaries
Experienced
Pay any additional money to NGO officials to obtain HFL (% of beneficiaries) 3.88
Amount of additional money paid to the NGO officials for obtaining the HFL Tk. 622.70
Causes showed to charge the additional amount of money by the NGO officials from the borrowers (%):
Refreshment purpose 74.24
Document purpose 25.76
The field survey also reveals that lobbying plays an important role in obtaining HFL. Around 65
percent of the borrowers have mentioned that help or lobbying by any external person is needed
to obtain the loan. Amongst this group of beneficiaries, around 85 percent of them reported that
insider NGO activists help them grant the HFL. Out of 65 percent of the borrowers who would
seek help from others to obtain HFL, only 0.45 percent of them have to pay anything in kind or
cash. On average a HFL borrower has to pay Tk. 280 to the person (outside of the NGO) who
helps to obtain the HFL (Table-4.6).
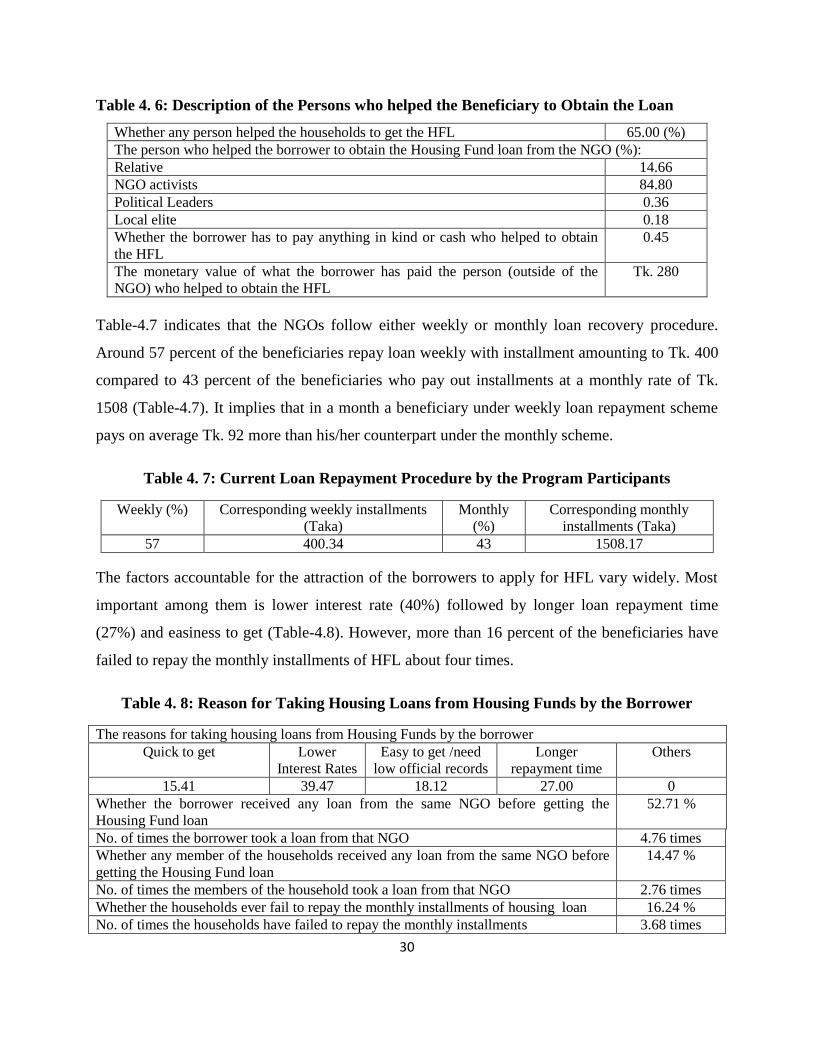
30
Table 4. 6: Description of the Persons who helped the Beneficiary to Obtain the Loan
Whether any person helped the households to get the HFL 65.00 (%)
The person who helped the borrower to obtain the Housing Fund loan from the NGO (%):
Relative 14.66
NGO activists 84.80
Political Leaders 0.36
Local elite 0.18
Whether the borrower has to pay anything in kind or cash who helped to obtain
the HFL
0.45
The monetary value of what the borrower has paid the person (outside of the
NGO) who helped to obtain the HFL
Tk. 280
Table-4.7 indicates that the NGOs follow either weekly or monthly loan recovery procedure.
Around 57 percent of the beneficiaries repay loan weekly with installment amounting to Tk. 400
compared to 43 percent of the beneficiaries who pay out installments at a monthly rate of Tk.
1508 (Table-4.7). It implies that in a month a beneficiary under weekly loan repayment scheme
pays on average Tk. 92 more than his/her counterpart under the monthly scheme.
Table 4. 7: Current Loan Repayment Procedure by the Program Participants
Weekly (%) Corresponding weekly installments
(Taka)
Monthly
(%)
Corresponding monthly
installments (Taka)
57 400.34 43 1508.17
The factors accountable for the attraction of the borrowers to apply for HFL vary widely. Most
important among them is lower interest rate (40%) followed by longer loan repayment time
(27%) and easiness to get (Table-4.8). However, more than 16 percent of the beneficiaries have
failed to repay the monthly installments of HFL about four times.
Table 4. 8: Reason for Taking Housing Loans from Housing Funds by the Borrower
The reasons for taking housing loans from Housing Funds by the borrower
Quick to get Lower
Interest Rates
Easy to get /need
low official records
Longer
repayment time
Others
15.41 39.47 18.12 27.00 0
Whether the borrower received any loan from the same NGO before getting the
Housing Fund loan
52.71 %
No. of times the borrower took a loan from that NGO 4.76 times
Whether any member of the households received any loan from the same NGO before
getting the Housing Fund loan
14.47 %
No. of times the members of the household took a loan from that NGO 2.76 times
Whether the households ever fail to repay the monthly installments of housing loan 16.24 %
No. of times the households have failed to repay the monthly installments 3.68 times
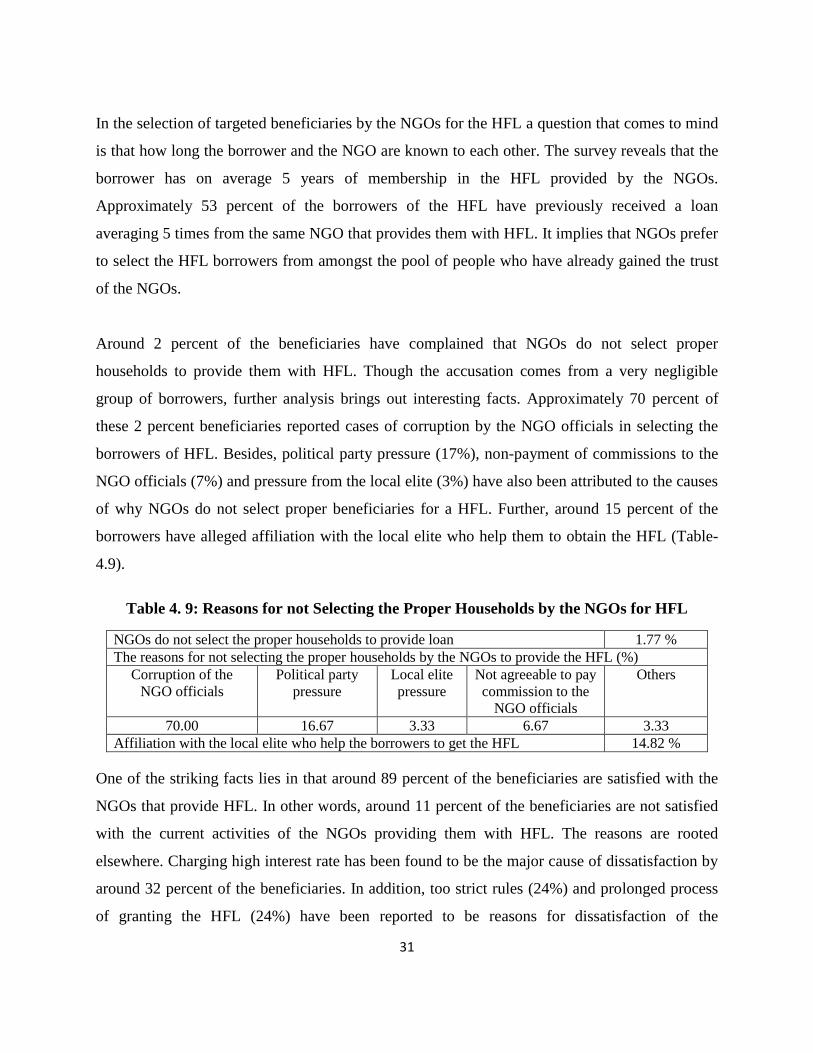
31
In the selection of targeted beneficiaries by the NGOs for the HFL a question that comes to mind
is that how long the borrower and the NGO are known to each other. The survey reveals that the
borrower has on average 5 years of membership in the HFL provided by the NGOs.
Approximately 53 percent of the borrowers of the HFL have previously received a loan
averaging 5 times from the same NGO that provides them with HFL. It implies that NGOs prefer
to select the HFL borrowers from amongst the pool of people who have already gained the trust
of the NGOs.
Around 2 percent of the beneficiaries have complained that NGOs do not select proper
households to provide them with HFL. Though the accusation comes from a very negligible
group of borrowers, further analysis brings out interesting facts. Approximately 70 percent of
these 2 percent beneficiaries reported cases of corruption by the NGO officials in selecting the
borrowers of HFL. Besides, political party pressure (17%), non-payment of commissions to the
NGO officials (7%) and pressure from the local elite (3%) have also been attributed to the causes
of why NGOs do not select proper beneficiaries for a HFL. Further, around 15 percent of the
borrowers have alleged affiliation with the local elite who help them to obtain the HFL (Table-
4.9).
Table 4. 9: Reasons for not Selecting the Proper Households by the NGOs for HFL
NGOs do not select the proper households to provide loan 1.77 %
The reasons for not selecting the proper households by the NGOs to provide the HFL (%)
Corruption of the
NGO officials
Political party
pressure
Local elite
pressure
Not agreeable to pay
commission to the
NGO officials
Others
70.00 16.67 3.33 6.67 3.33
Affiliation with the local elite who help the borrowers to get the HFL 14.82 %
One of the striking facts lies in that around 89 percent of the beneficiaries are satisfied with the
NGOs that provide HFL. In other words, around 11 percent of the beneficiaries are not satisfied
with the current activities of the NGOs providing them with HFL. The reasons are rooted
elsewhere. Charging high interest rate has been found to be the major cause of dissatisfaction by
around 32 percent of the beneficiaries. In addition, too strict rules (24%) and prolonged process
of granting the HFL (24%) have been reported to be reasons for dissatisfaction of the
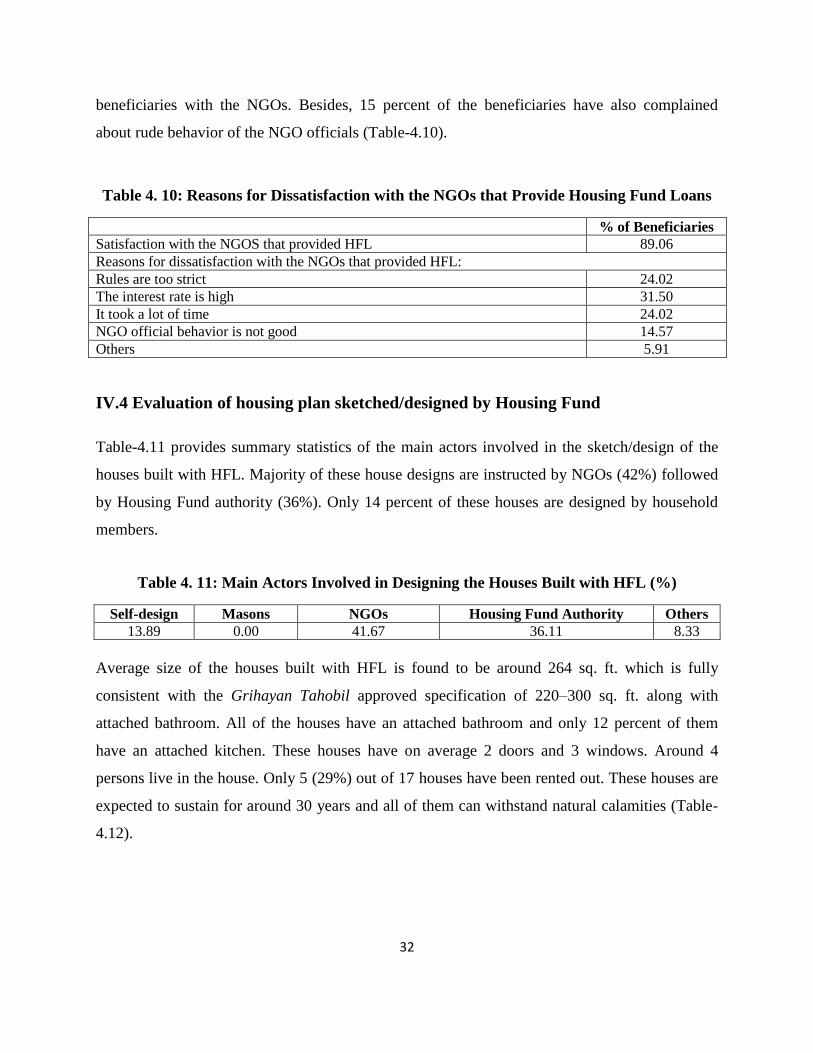
32
beneficiaries with the NGOs. Besides, 15 percent of the beneficiaries have also complained
about rude behavior of the NGO officials (Table-4.10).
Table 4. 10: Reasons for Dissatisfaction with the NGOs that Provide Housing Fund Loans
% of Beneficiaries
Satisfaction with the NGOS that provided HFL 89.06
Reasons for dissatisfaction with the NGOs that provided HFL:
Rules are too strict 24.02
The interest rate is high 31.50
It took a lot of time 24.02
NGO official behavior is not good 14.57
Others 5.91
IV.4 Evaluation of housing plan sketched/designed by Housing Fund
Table-4.11 provides summary statistics of the main actors involved in the sketch/design of the
houses built with HFL. Majority of these house designs are instructed by NGOs (42%) followed
by Housing Fund authority (36%). Only 14 percent of these houses are designed by household
members.
Table 4. 11: Main Actors Involved in Designing the Houses Built with HFL (%)
Self-design Masons NGOs Housing Fund Authority Others
13.89 0.00 41.67 36.11 8.33
Average size of the houses built with HFL is found to be around 264 sq. ft. which is fully
consistent with the Grihayan Tahobil approved specification of 220–300 sq. ft. along with
attached bathroom. All of the houses have an attached bathroom and only 12 percent of them
have an attached kitchen. These houses have on average 2 doors and 3 windows. Around 4
persons live in the house. Only 5 (29%) out of 17 houses have been rented out. These houses are
expected to sustain for around 30 years and all of them can withstand natural calamities (Table-
4.12).
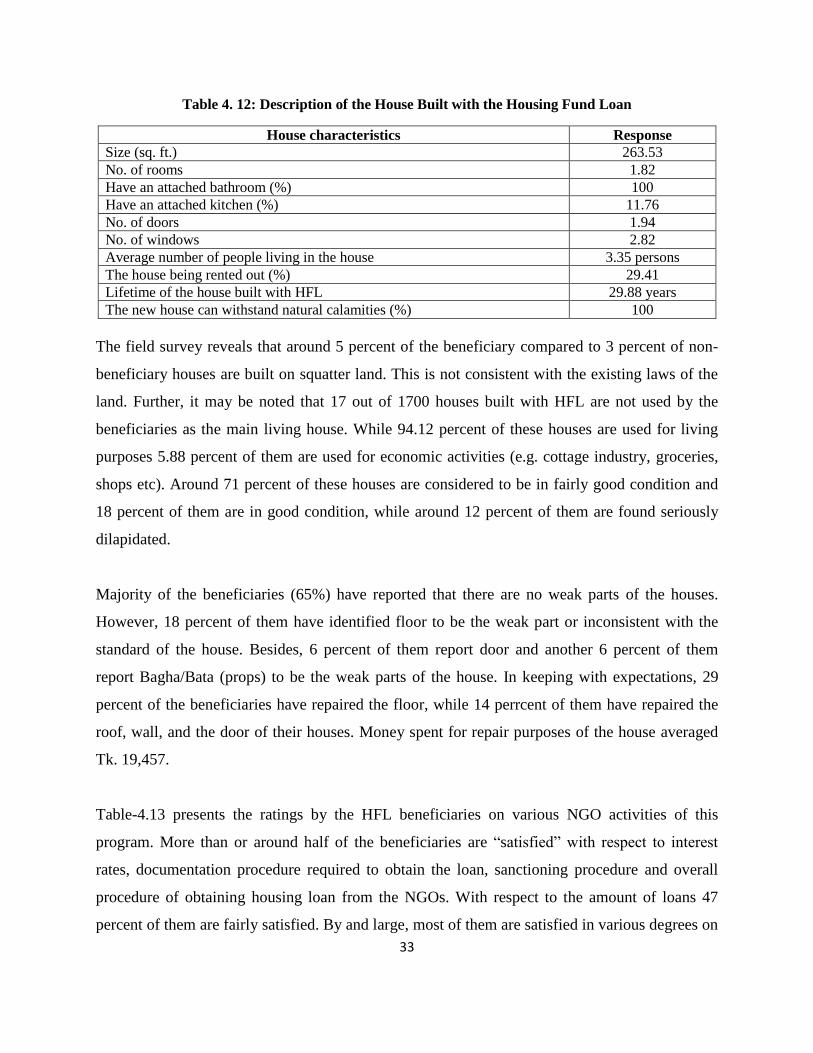
33
Table 4. 12: Description of the House Built with the Housing Fund Loan
House characteristics Response
Size (sq. ft.) 263.53
No. of rooms 1.82
Have an attached bathroom (%) 100
Have an attached kitchen (%) 11.76
No. of doors 1.94
No. of windows 2.82
Average number of people living in the house 3.35 persons
The house being rented out (%) 29.41
Lifetime of the house built with HFL 29.88 years
The new house can withstand natural calamities (%) 100
The field survey reveals that around 5 percent of the beneficiary compared to 3 percent of non-
beneficiary houses are built on squatter land. This is not consistent with the existing laws of the
land. Further, it may be noted that 17 out of 1700 houses built with HFL are not used by the
beneficiaries as the main living house. While 94.12 percent of these houses are used for living
purposes 5.88 percent of them are used for economic activities (e.g. cottage industry, groceries,
shops etc). Around 71 percent of these houses are considered to be in fairly good condition and
18 percent of them are in good condition, while around 12 percent of them are found seriously
dilapidated.
Majority of the beneficiaries (65%) have reported that there are no weak parts of the houses.
However, 18 percent of them have identified floor to be the weak part or inconsistent with the
standard of the house. Besides, 6 percent of them report door and another 6 percent of them
report Bagha/Bata (props) to be the weak parts of the house. In keeping with expectations, 29
percent of the beneficiaries have repaired the floor, while 14 perrcent of them have repaired the
roof, wall, and the door of their houses. Money spent for repair purposes of the house averaged
Tk. 19,457.
Table-4.13 presents the ratings by the HFL beneficiaries on various NGO activities of this
program. More than or around half of the beneficiaries are “satisfied” with respect to interest
rates, documentation procedure required to obtain the loan, sanctioning procedure and overall
procedure of obtaining housing loan from the NGOs. With respect to the amount of loans 47
percent of them are fairly satisfied. By and large, most of them are satisfied in various degrees on
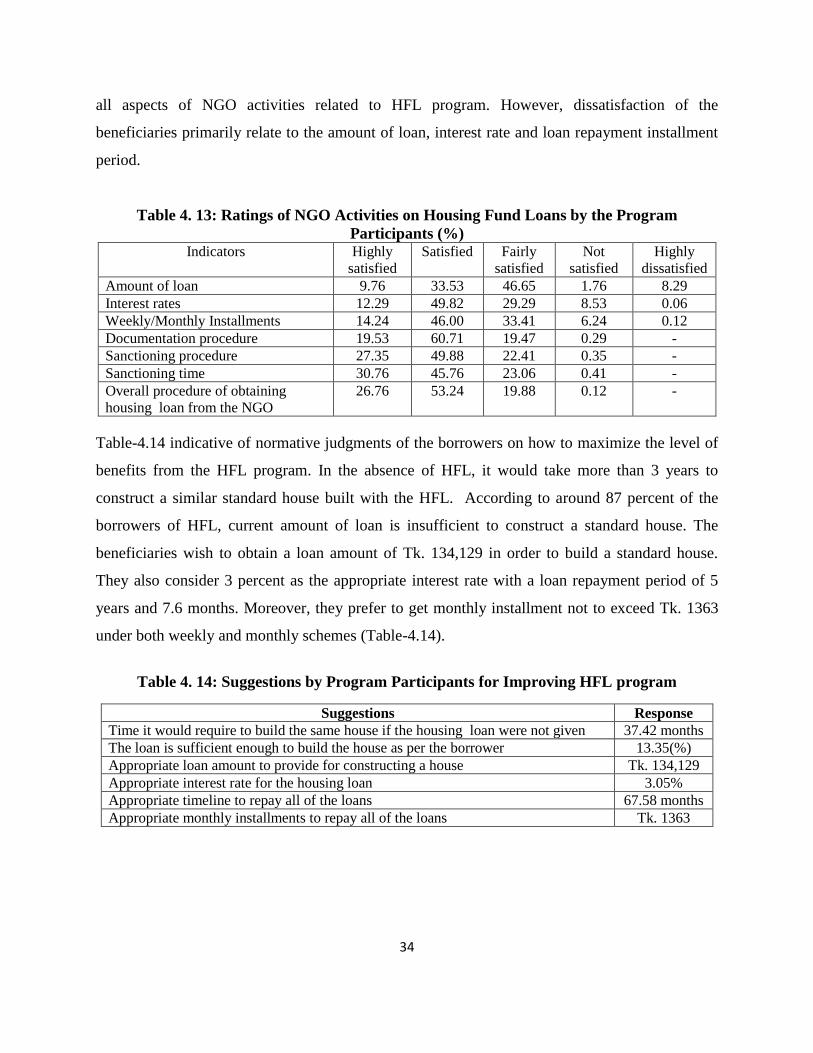
34
all aspects of NGO activities related to HFL program. However, dissatisfaction of the
beneficiaries primarily relate to the amount of loan, interest rate and loan repayment installment
period.
Table 4. 13: Ratings of NGO Activities on Housing Fund Loans by the Program
Participants (%) Indicators Highly
satisfied
Satisfied Fairly
satisfied
Not
satisfied
Highly
dissatisfied
Amount of loan 9.76 33.53 46.65 1.76 8.29
Interest rates 12.29 49.82 29.29 8.53 0.06
Weekly/Monthly Installments 14.24 46.00 33.41 6.24 0.12
Documentation procedure 19.53 60.71 19.47 0.29 -
Sanctioning procedure 27.35 49.88 22.41 0.35 -
Sanctioning time 30.76 45.76 23.06 0.41 -
Overall procedure of obtaining
housing loan from the NGO
26.76 53.24 19.88 0.12 -
Table-4.14 indicative of normative judgments of the borrowers on how to maximize the level of
benefits from the HFL program. In the absence of HFL, it would take more than 3 years to
construct a similar standard house built with the HFL. According to around 87 percent of the
borrowers of HFL, current amount of loan is insufficient to construct a standard house. The
beneficiaries wish to obtain a loan amount of Tk. 134,129 in order to build a standard house.
They also consider 3 percent as the appropriate interest rate with a loan repayment period of 5
years and 7.6 months. Moreover, they prefer to get monthly installment not to exceed Tk. 1363
under both weekly and monthly schemes (Table-4.14).
Table 4. 14: Suggestions by Program Participants for Improving HFL program
Suggestions Response
Time it would require to build the same house if the housing loan were not given 37.42 months
The loan is sufficient enough to build the house as per the borrower 13.35(%)
Appropriate loan amount to provide for constructing a house Tk. 134,129
Appropriate interest rate for the housing loan 3.05%
Appropriate timeline to repay all of the loans 67.58 months
Appropriate monthly installments to repay all of the loans Tk. 1363
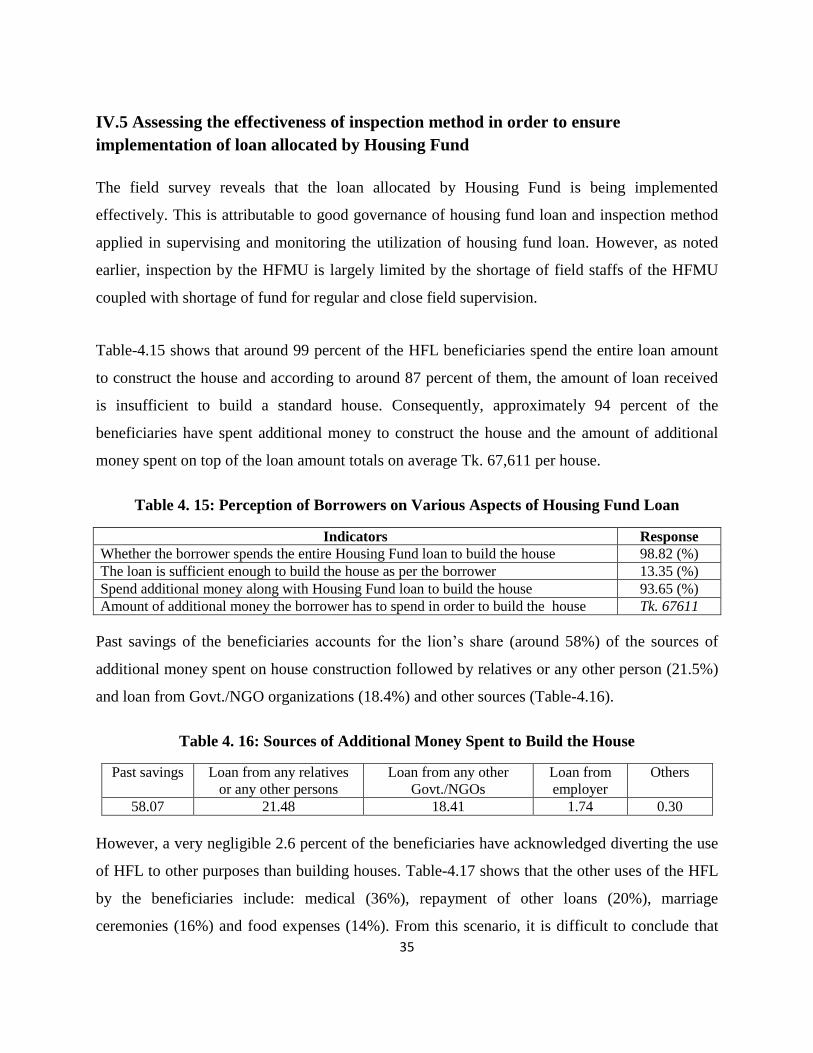
35
IV.5 Assessing the effectiveness of inspection method in order to ensure
implementation of loan allocated by Housing Fund
The field survey reveals that the loan allocated by Housing Fund is being implemented
effectively. This is attributable to good governance of housing fund loan and inspection method
applied in supervising and monitoring the utilization of housing fund loan. However, as noted
earlier, inspection by the HFMU is largely limited by the shortage of field staffs of the HFMU
coupled with shortage of fund for regular and close field supervision.
Table-4.15 shows that around 99 percent of the HFL beneficiaries spend the entire loan amount
to construct the house and according to around 87 percent of them, the amount of loan received
is insufficient to build a standard house. Consequently, approximately 94 percent of the
beneficiaries have spent additional money to construct the house and the amount of additional
money spent on top of the loan amount totals on average Tk. 67,611 per house.
Table 4. 15: Perception of Borrowers on Various Aspects of Housing Fund Loan
Indicators Response
Whether the borrower spends the entire Housing Fund loan to build the house 98.82 (%)
The loan is sufficient enough to build the house as per the borrower 13.35 (%)
Spend additional money along with Housing Fund loan to build the house 93.65 (%)
Amount of additional money the borrower has to spend in order to build the house Tk. 67611
Past savings of the beneficiaries accounts for the lion‟s share (around 58%) of the sources of
additional money spent on house construction followed by relatives or any other person (21.5%)
and loan from Govt./NGO organizations (18.4%) and other sources (Table-4.16).
Table 4. 16: Sources of Additional Money Spent to Build the House
Past savings Loan from any relatives
or any other persons
Loan from any other
Govt./NGOs
Loan from
employer
Others
58.07 21.48 18.41 1.74 0.30
However, a very negligible 2.6 percent of the beneficiaries have acknowledged diverting the use
of HFL to other purposes than building houses. Table-4.17 shows that the other uses of the HFL
by the beneficiaries include: medical (36%), repayment of other loans (20%), marriage
ceremonies (16%) and food expenses (14%). From this scenario, it is difficult to conclude that
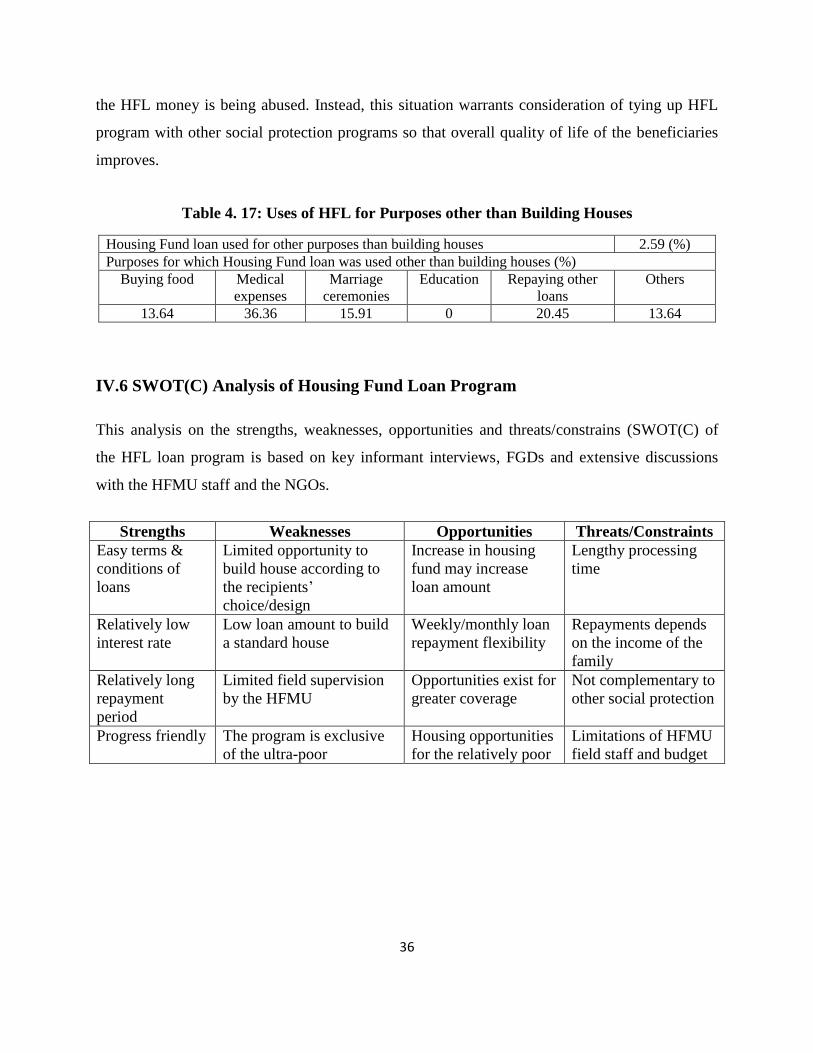
36
the HFL money is being abused. Instead, this situation warrants consideration of tying up HFL
program with other social protection programs so that overall quality of life of the beneficiaries
improves.
Table 4. 17: Uses of HFL for Purposes other than Building Houses
Housing Fund loan used for other purposes than building houses 2.59 (%)
Purposes for which Housing Fund loan was used other than building houses (%)
Buying food Medical
expenses
Marriage
ceremonies
Education Repaying other
loans
Others
13.64 36.36 15.91 0 20.45 13.64
IV.6 SWOT(C) Analysis of Housing Fund Loan Program
This analysis on the strengths, weaknesses, opportunities and threats/constrains (SWOT(C) of
the HFL loan program is based on key informant interviews, FGDs and extensive discussions
with the HFMU staff and the NGOs.
Strengths Weaknesses Opportunities Threats/Constraints
Easy terms &
conditions of
loans
Limited opportunity to
build house according to
the recipients‟
choice/design
Increase in housing
fund may increase
loan amount
Lengthy processing
time
Relatively low
interest rate
Low loan amount to build
a standard house
Weekly/monthly loan
repayment flexibility
Repayments depends
on the income of the
family
Relatively long
repayment
period
Limited field supervision
by the HFMU
Opportunities exist for
greater coverage
Not complementary to
other social protection
Progress friendly The program is exclusive
of the ultra-poor
Housing opportunities
for the relatively poor
Limitations of HFMU
field staff and budget
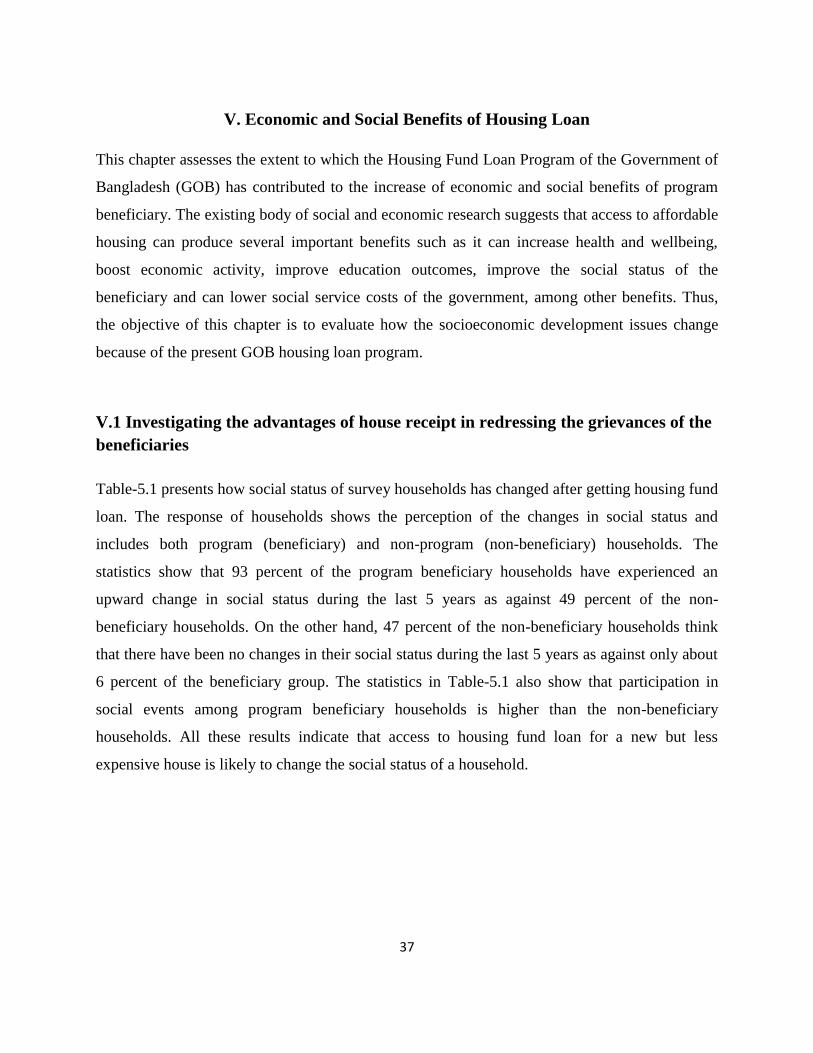
37
V. Economic and Social Benefits of Housing Loan
This chapter assesses the extent to which the Housing Fund Loan Program of the Government of
Bangladesh (GOB) has contributed to the increase of economic and social benefits of program
beneficiary. The existing body of social and economic research suggests that access to affordable
housing can produce several important benefits such as it can increase health and wellbeing,
boost economic activity, improve education outcomes, improve the social status of the
beneficiary and can lower social service costs of the government, among other benefits. Thus,
the objective of this chapter is to evaluate how the socioeconomic development issues change
because of the present GOB housing loan program.
V.1 Investigating the advantages of house receipt in redressing the grievances of the
beneficiaries
Table-5.1 presents how social status of survey households has changed after getting housing fund
loan. The response of households shows the perception of the changes in social status and
includes both program (beneficiary) and non-program (non-beneficiary) households. The
statistics show that 93 percent of the program beneficiary households have experienced an
upward change in social status during the last 5 years as against 49 percent of the non-
beneficiary households. On the other hand, 47 percent of the non-beneficiary households think
that there have been no changes in their social status during the last 5 years as against only about
6 percent of the beneficiary group. The statistics in Table-5.1 also show that participation in
social events among program beneficiary households is higher than the non-beneficiary
households. All these results indicate that access to housing fund loan for a new but less
expensive house is likely to change the social status of a household.
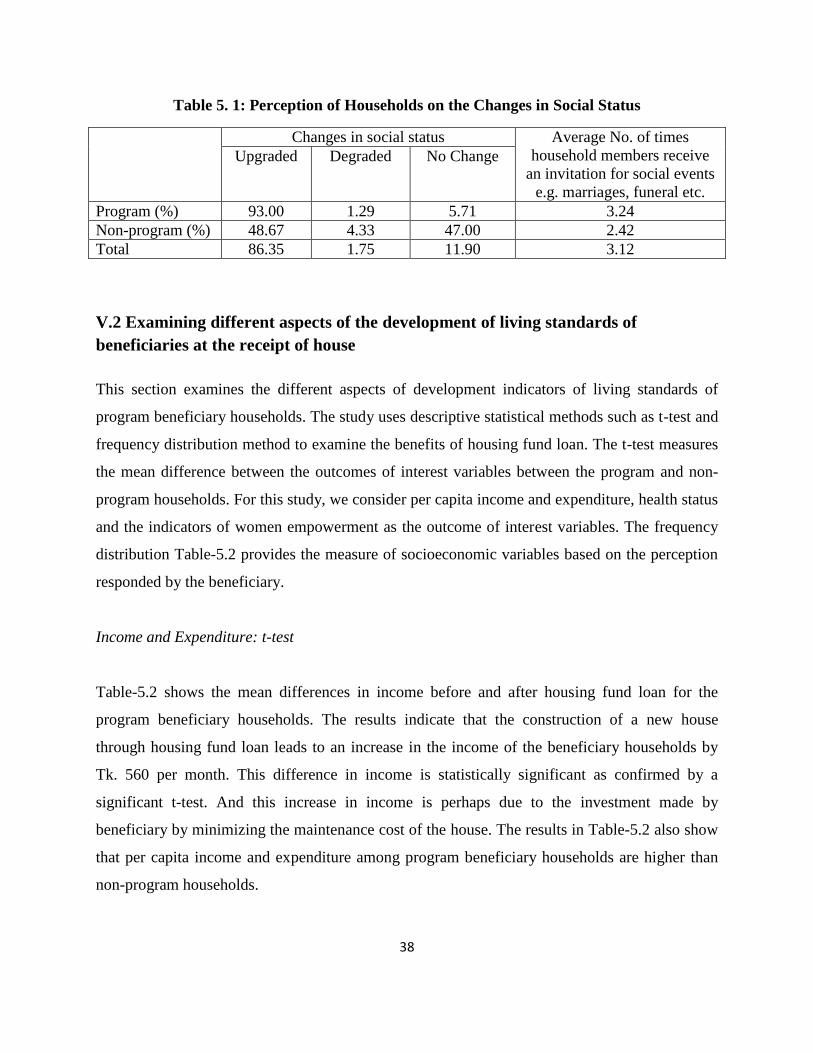
38
Table 5. 1: Perception of Households on the Changes in Social Status
Changes in social status Average No. of times
household members receive
an invitation for social events
e.g. marriages, funeral etc.
Upgraded Degraded No Change
Program (%) 93.00 1.29 5.71 3.24
Non-program (%) 48.67 4.33 47.00 2.42
Total 86.35 1.75 11.90 3.12
V.2 Examining different aspects of the development of living standards of
beneficiaries at the receipt of house
This section examines the different aspects of development indicators of living standards of
program beneficiary households. The study uses descriptive statistical methods such as t-test and
frequency distribution method to examine the benefits of housing fund loan. The t-test measures
the mean difference between the outcomes of interest variables between the program and non-
program households. For this study, we consider per capita income and expenditure, health status
and the indicators of women empowerment as the outcome of interest variables. The frequency
distribution Table-5.2 provides the measure of socioeconomic variables based on the perception
responded by the beneficiary.
Income and Expenditure: t-test
Table-5.2 shows the mean differences in income before and after housing fund loan for the
program beneficiary households. The results indicate that the construction of a new house
through housing fund loan leads to an increase in the income of the beneficiary households by
Tk. 560 per month. This difference in income is statistically significant as confirmed by a
significant t-test. And this increase in income is perhaps due to the investment made by
beneficiary by minimizing the maintenance cost of the house. The results in Table-5.2 also show
that per capita income and expenditure among program beneficiary households are higher than
non-program households.
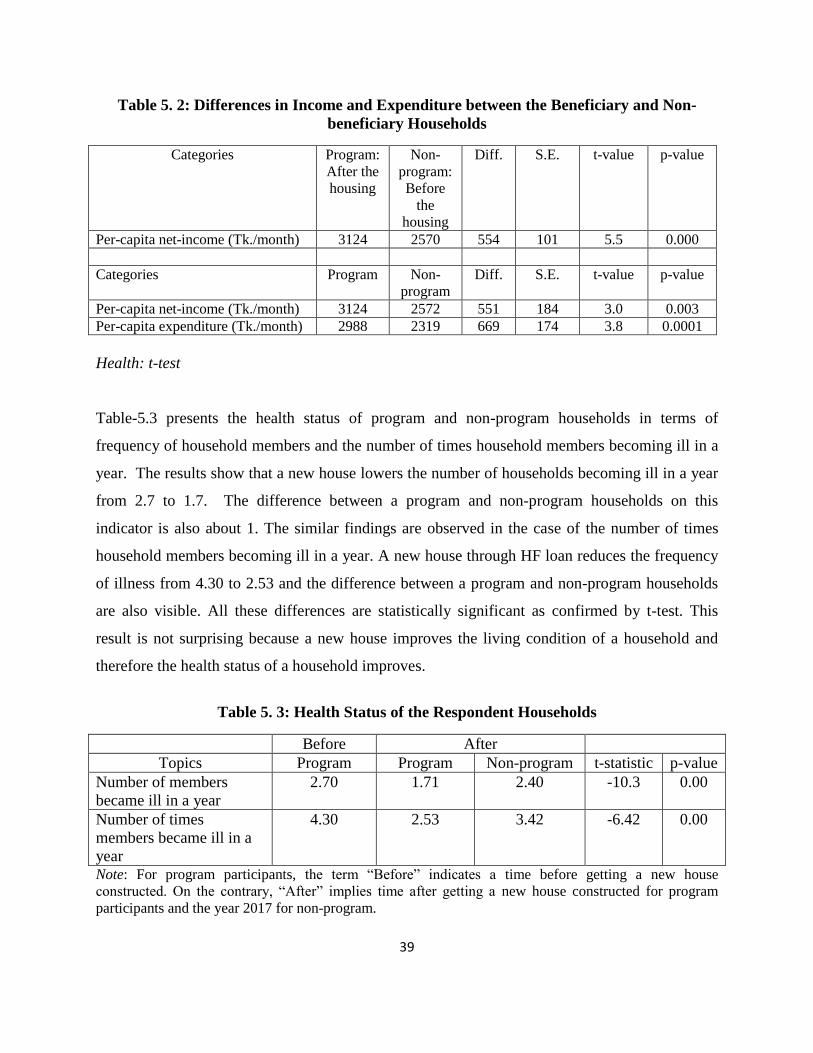
39
Table 5. 2: Differences in Income and Expenditure between the Beneficiary and Non-
beneficiary Households
Categories Program:
After the
housing
Non-
program:
Before
the
housing
Diff. S.E. t-value p-value
Per-capita net-income (Tk./month) 3124 2570 554 101 5.5 0.000
Categories Program Non-
program
Diff. S.E. t-value p-value
Per-capita net-income (Tk./month) 3124 2572 551 184 3.0 0.003
Per-capita expenditure (Tk./month) 2988 2319 669 174 3.8 0.0001
Health: t-test
Table-5.3 presents the health status of program and non-program households in terms of
frequency of household members and the number of times household members becoming ill in a
year. The results show that a new house lowers the number of households becoming ill in a year
from 2.7 to 1.7. The difference between a program and non-program households on this
indicator is also about 1. The similar findings are observed in the case of the number of times
household members becoming ill in a year. A new house through HF loan reduces the frequency
of illness from 4.30 to 2.53 and the difference between a program and non-program households
are also visible. All these differences are statistically significant as confirmed by t-test. This
result is not surprising because a new house improves the living condition of a household and
therefore the health status of a household improves.
Table 5. 3: Health Status of the Respondent Households
Before After
Topics Program Program Non-program t-statistic p-value
Number of members
became ill in a year
2.70 1.71 2.40 -10.3 0.00
Number of times
members became ill in a
year
4.30 2.53 3.42 -6.42 0.00
Note: For program participants, the term “Before” indicates a time before getting a new house
constructed. On the contrary, “After” implies time after getting a new house constructed for program
participants and the year 2017 for non-program.
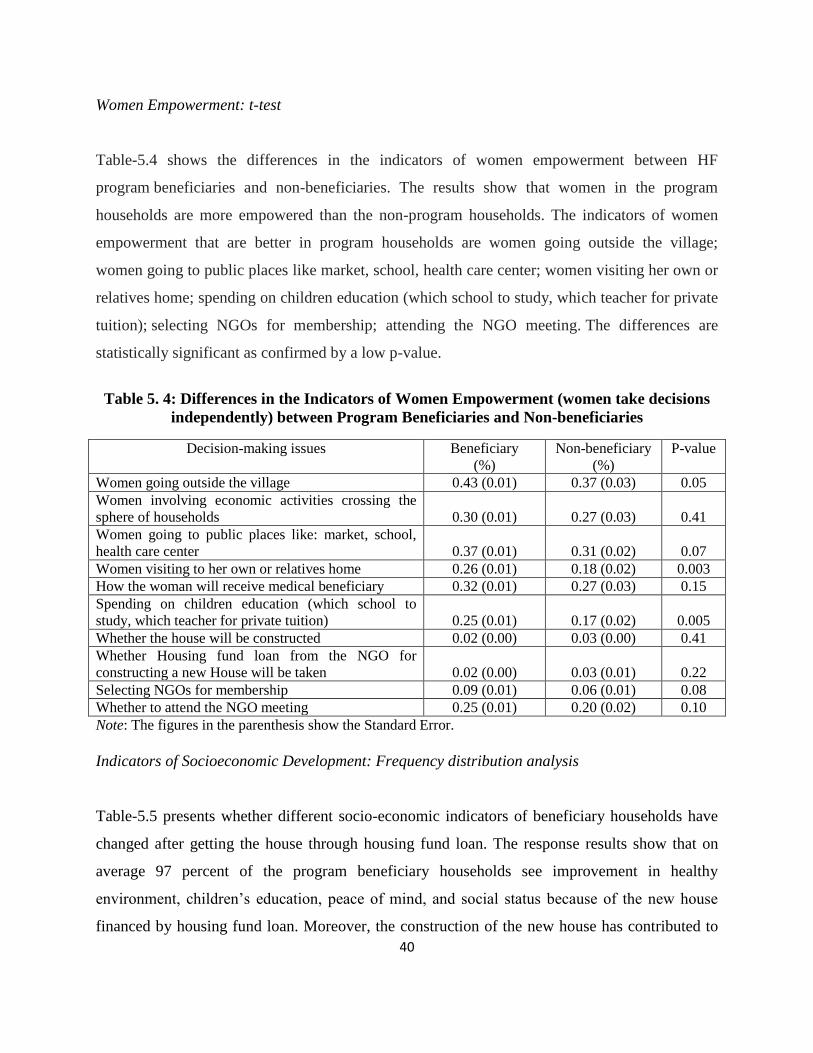
40
Women Empowerment: t-test
Table-5.4 shows the differences in the indicators of women empowerment between HF
program beneficiaries and non-beneficiaries. The results show that women in the program
households are more empowered than the non-program households. The indicators of women
empowerment that are better in program households are women going outside the village;
women going to public places like market, school, health care center; women visiting her own or
relatives home; spending on children education (which school to study, which teacher for private
tuition); selecting NGOs for membership; attending the NGO meeting. The differences are
statistically significant as confirmed by a low p-value.
Table 5. 4: Differences in the Indicators of Women Empowerment (women take decisions
independently) between Program Beneficiaries and Non-beneficiaries
Decision-making issues Beneficiary
(%)
Non-beneficiary
(%)
P-value
Women going outside the village 0.43 (0.01) 0.37 (0.03) 0.05
Women involving economic activities crossing the
sphere of households 0.30 (0.01) 0.27 (0.03) 0.41
Women going to public places like: market, school,
health care center 0.37 (0.01) 0.31 (0.02) 0.07
Women visiting to her own or relatives home 0.26 (0.01) 0.18 (0.02) 0.003
How the woman will receive medical beneficiary 0.32 (0.01) 0.27 (0.03) 0.15
Spending on children education (which school to
study, which teacher for private tuition) 0.25 (0.01) 0.17 (0.02) 0.005
Whether the house will be constructed 0.02 (0.00) 0.03 (0.00) 0.41
Whether Housing fund loan from the NGO for
constructing a new House will be taken 0.02 (0.00) 0.03 (0.01) 0.22
Selecting NGOs for membership 0.09 (0.01) 0.06 (0.01) 0.08
Whether to attend the NGO meeting 0.25 (0.01) 0.20 (0.02) 0.10
Note: The figures in the parenthesis show the Standard Error.
Indicators of Socioeconomic Development: Frequency distribution analysis
Table-5.5 presents whether different socio-economic indicators of beneficiary households have
changed after getting the house through housing fund loan. The response results show that on
average 97 percent of the program beneficiary households see improvement in healthy
environment, children‟s education, peace of mind, and social status because of the new house
financed by housing fund loan. Moreover, the construction of the new house has contributed to
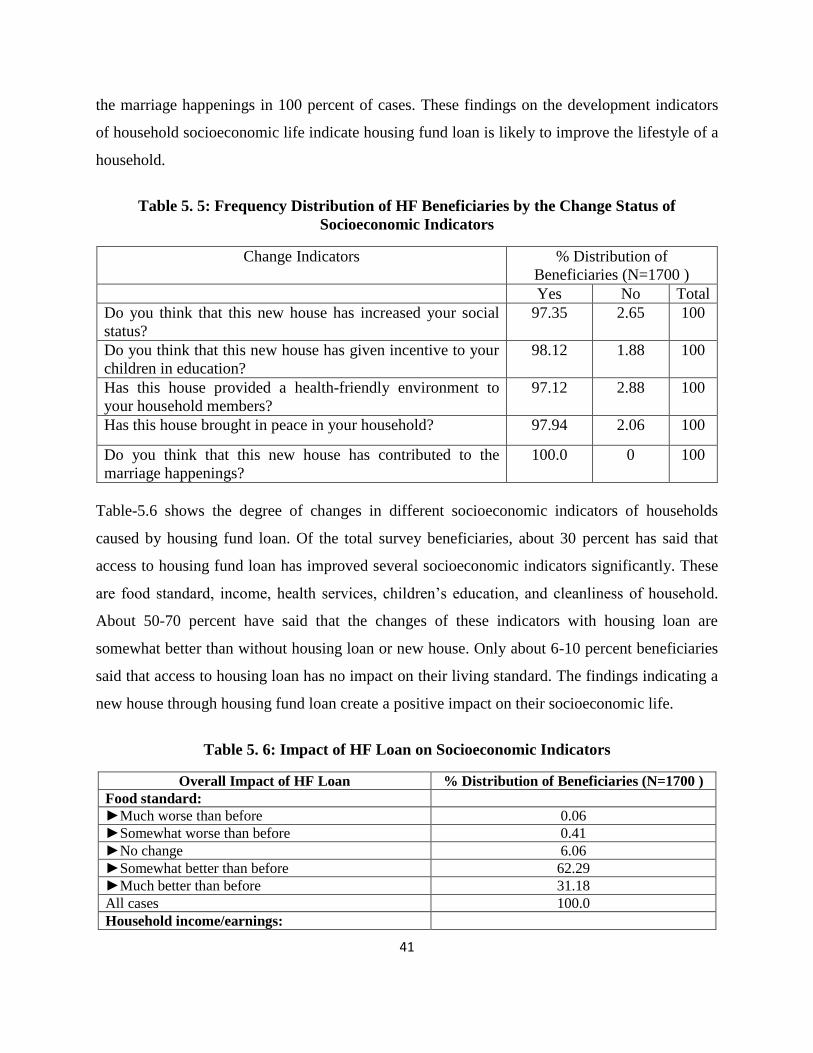
41
the marriage happenings in 100 percent of cases. These findings on the development indicators
of household socioeconomic life indicate housing fund loan is likely to improve the lifestyle of a
household.
Table 5. 5: Frequency Distribution of HF Beneficiaries by the Change Status of
Socioeconomic Indicators
Change Indicators % Distribution of
Beneficiaries (N=1700 )
Yes No Total
Do you think that this new house has increased your social
status?
97.35 2.65 100
Do you think that this new house has given incentive to your
children in education?
98.12 1.88 100
Has this house provided a health-friendly environment to
your household members?
97.12 2.88 100
Has this house brought in peace in your household? 97.94 2.06 100
Do you think that this new house has contributed to the
marriage happenings?
100.0 0 100
Table-5.6 shows the degree of changes in different socioeconomic indicators of households
caused by housing fund loan. Of the total survey beneficiaries, about 30 percent has said that
access to housing fund loan has improved several socioeconomic indicators significantly. These
are food standard, income, health services, children‟s education, and cleanliness of household.
About 50-70 percent have said that the changes of these indicators with housing loan are
somewhat better than without housing loan or new house. Only about 6-10 percent beneficiaries
said that access to housing loan has no impact on their living standard. The findings indicating a
new house through housing fund loan create a positive impact on their socioeconomic life.
Table 5. 6: Impact of HF Loan on Socioeconomic Indicators
Overall Impact of HF Loan % Distribution of Beneficiaries (N=1700 )
Food standard:
►Much worse than before 0.06
►Somewhat worse than before 0.41
►No change 6.06
►Somewhat better than before 62.29
►Much better than before 31.18
All cases 100.0
Household income/earnings:
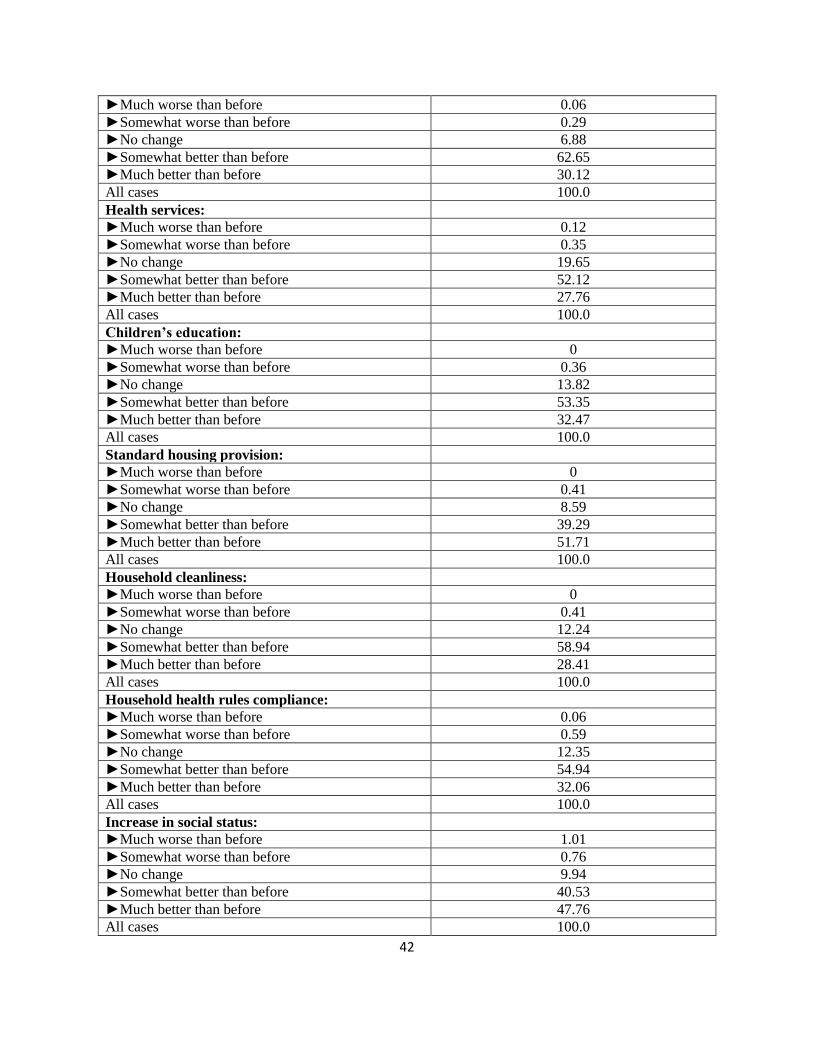
42
►Much worse than before 0.06
►Somewhat worse than before 0.29
►No change 6.88
►Somewhat better than before 62.65
►Much better than before 30.12
All cases 100.0
Health services:
►Much worse than before 0.12
►Somewhat worse than before 0.35
►No change 19.65
►Somewhat better than before 52.12
►Much better than before 27.76
All cases 100.0
Children’s education:
►Much worse than before 0
►Somewhat worse than before 0.36
►No change 13.82
►Somewhat better than before 53.35
►Much better than before 32.47
All cases 100.0
Standard housing provision:
►Much worse than before 0
►Somewhat worse than before 0.41
►No change 8.59
►Somewhat better than before 39.29
►Much better than before 51.71
All cases 100.0
Household cleanliness:
►Much worse than before 0
►Somewhat worse than before 0.41
►No change 12.24
►Somewhat better than before 58.94
►Much better than before 28.41
All cases 100.0
Household health rules compliance:
►Much worse than before 0.06
►Somewhat worse than before 0.59
►No change 12.35
►Somewhat better than before 54.94
►Much better than before 32.06
All cases 100.0
Increase in social status:
►Much worse than before 1.01
►Somewhat worse than before 0.76
►No change 9.94
►Somewhat better than before 40.53
►Much better than before 47.76
All cases 100.0
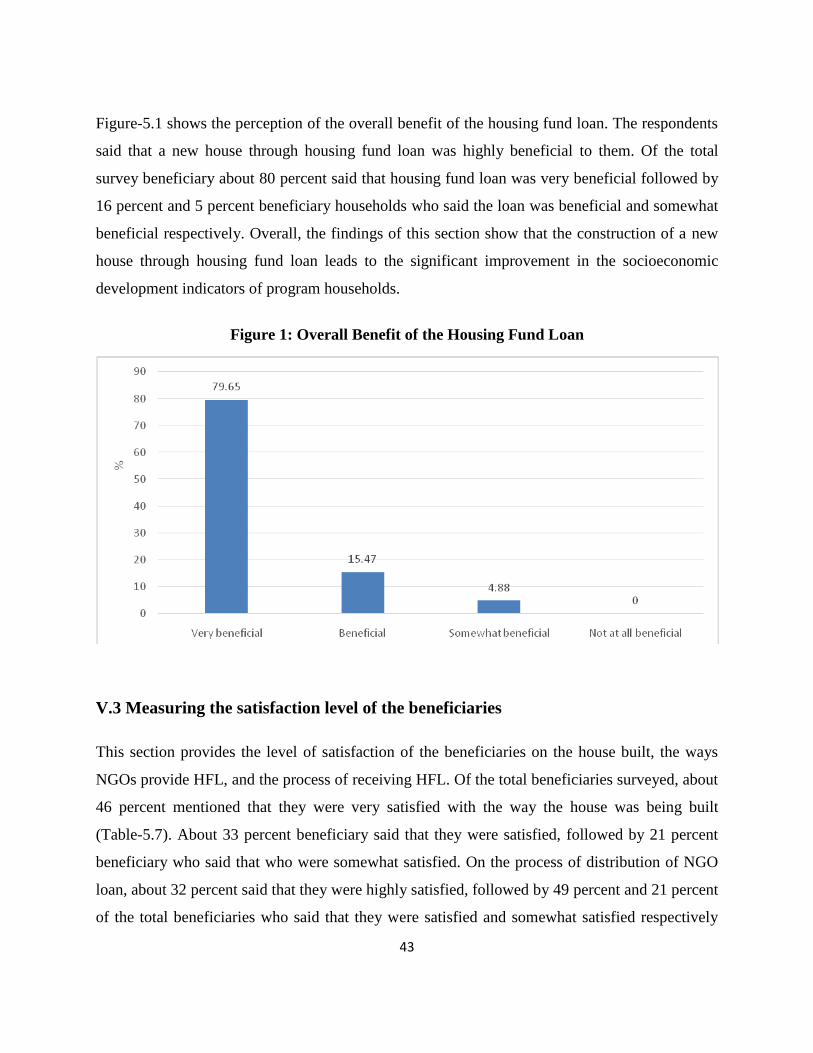
43
Figure-5.1 shows the perception of the overall benefit of the housing fund loan. The respondents
said that a new house through housing fund loan was highly beneficial to them. Of the total
survey beneficiary about 80 percent said that housing fund loan was very beneficial followed by
16 percent and 5 percent beneficiary households who said the loan was beneficial and somewhat
beneficial respectively. Overall, the findings of this section show that the construction of a new
house through housing fund loan leads to the significant improvement in the socioeconomic
development indicators of program households.
Figure 1: Overall Benefit of the Housing Fund Loan
V.3 Measuring the satisfaction level of the beneficiaries
This section provides the level of satisfaction of the beneficiaries on the house built, the ways
NGOs provide HFL, and the process of receiving HFL. Of the total beneficiaries surveyed, about
46 percent mentioned that they were very satisfied with the way the house was being built
(Table-5.7). About 33 percent beneficiary said that they were satisfied, followed by 21 percent
beneficiary who said that who were somewhat satisfied. On the process of distribution of NGO
loan, about 32 percent said that they were highly satisfied, followed by 49 percent and 21 percent
of the total beneficiaries who said that they were satisfied and somewhat satisfied respectively
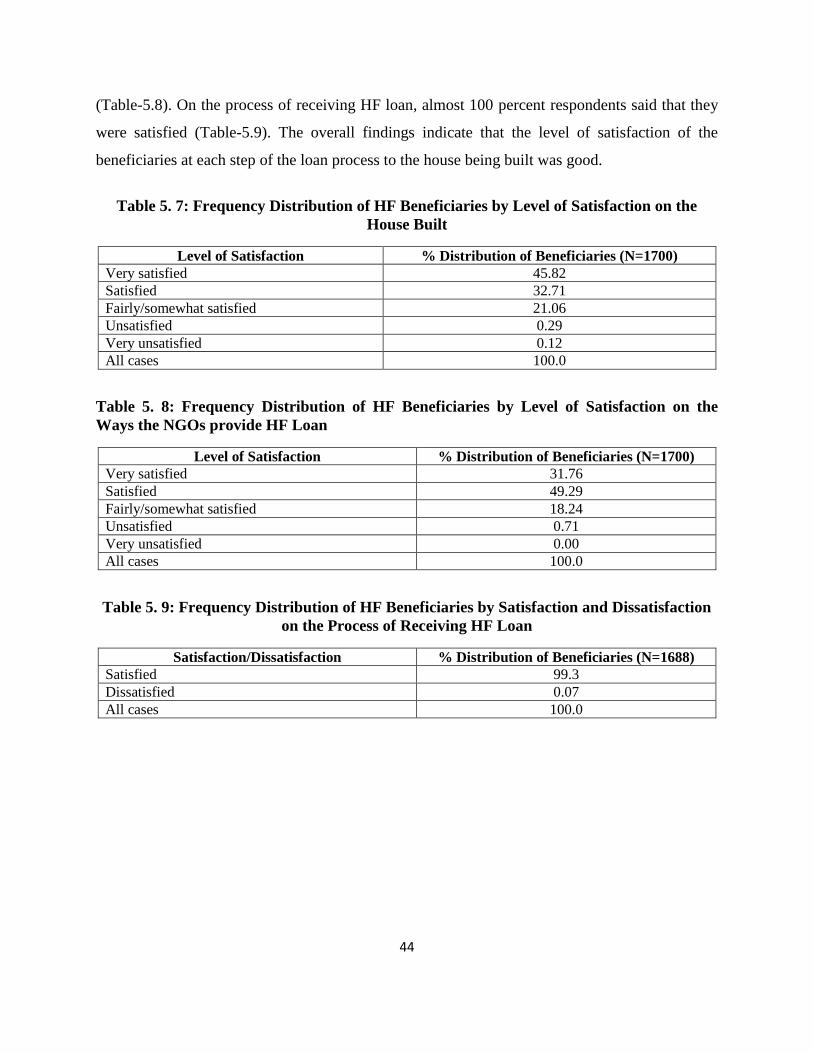
44
(Table-5.8). On the process of receiving HF loan, almost 100 percent respondents said that they
were satisfied (Table-5.9). The overall findings indicate that the level of satisfaction of the
beneficiaries at each step of the loan process to the house being built was good.
Table 5. 7: Frequency Distribution of HF Beneficiaries by Level of Satisfaction on the
House Built
Level of Satisfaction % Distribution of Beneficiaries (N=1700)
Very satisfied 45.82
Satisfied 32.71
Fairly/somewhat satisfied 21.06
Unsatisfied 0.29
Very unsatisfied 0.12
All cases 100.0
Table 5. 8: Frequency Distribution of HF Beneficiaries by Level of Satisfaction on the
Ways the NGOs provide HF Loan
Level of Satisfaction % Distribution of Beneficiaries (N=1700)
Very satisfied 31.76
Satisfied 49.29
Fairly/somewhat satisfied 18.24
Unsatisfied 0.71
Very unsatisfied 0.00
All cases 100.0
Table 5. 9: Frequency Distribution of HF Beneficiaries by Satisfaction and Dissatisfaction
on the Process of Receiving HF Loan
Satisfaction/Dissatisfaction % Distribution of Beneficiaries (N=1688)
Satisfied 99.3
Dissatisfied 0.07
All cases 100.0
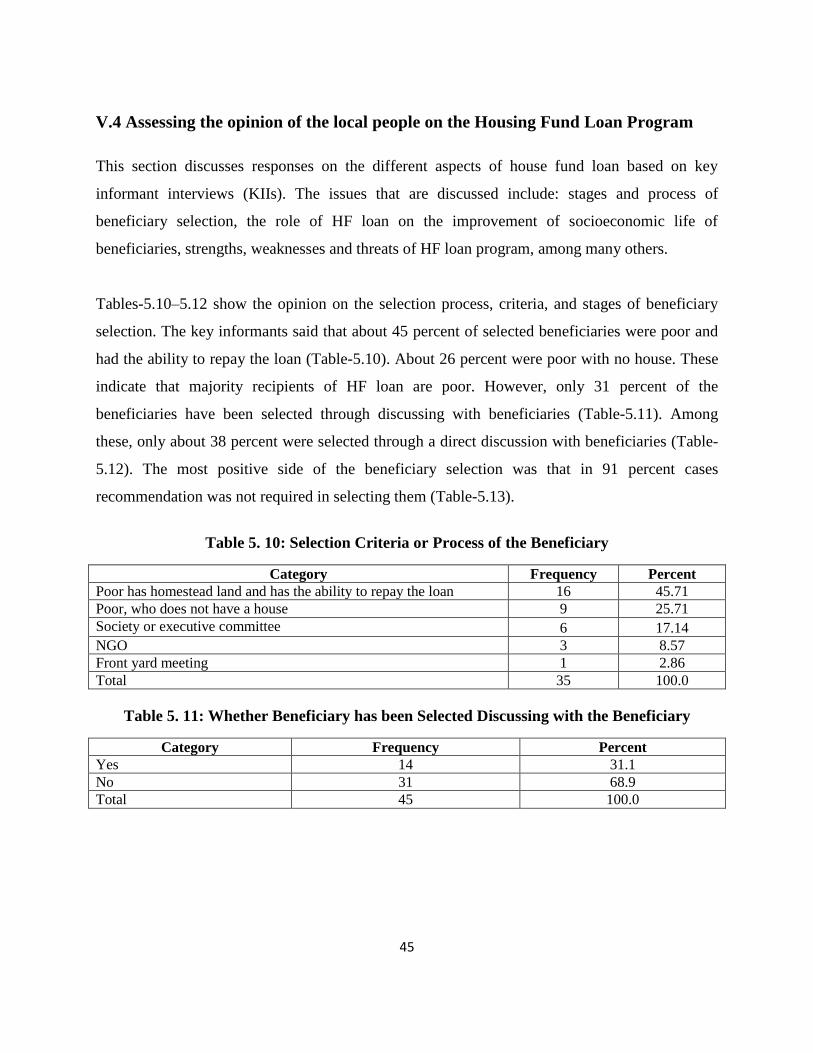
45
V.4 Assessing the opinion of the local people on the Housing Fund Loan Program
This section discusses responses on the different aspects of house fund loan based on key
informant interviews (KIIs). The issues that are discussed include: stages and process of
beneficiary selection, the role of HF loan on the improvement of socioeconomic life of
beneficiaries, strengths, weaknesses and threats of HF loan program, among many others.
Tables-5.10–5.12 show the opinion on the selection process, criteria, and stages of beneficiary
selection. The key informants said that about 45 percent of selected beneficiaries were poor and
had the ability to repay the loan (Table-5.10). About 26 percent were poor with no house. These
indicate that majority recipients of HF loan are poor. However, only 31 percent of the
beneficiaries have been selected through discussing with beneficiaries (Table-5.11). Among
these, only about 38 percent were selected through a direct discussion with beneficiaries (Table-
5.12). The most positive side of the beneficiary selection was that in 91 percent cases
recommendation was not required in selecting them (Table-5.13).
Table 5. 10: Selection Criteria or Process of the Beneficiary
Category Frequency Percent
Poor has homestead land and has the ability to repay the loan 16 45.71
Poor, who does not have a house 9 25.71
Society or executive committee 6 17.14
NGO 3 8.57
Front yard meeting 1 2.86
Total 35 100.0
Table 5. 11: Whether Beneficiary has been Selected Discussing with the Beneficiary
Category Frequency Percent
Yes 14 31.1
No 31 68.9
Total 45 100.0
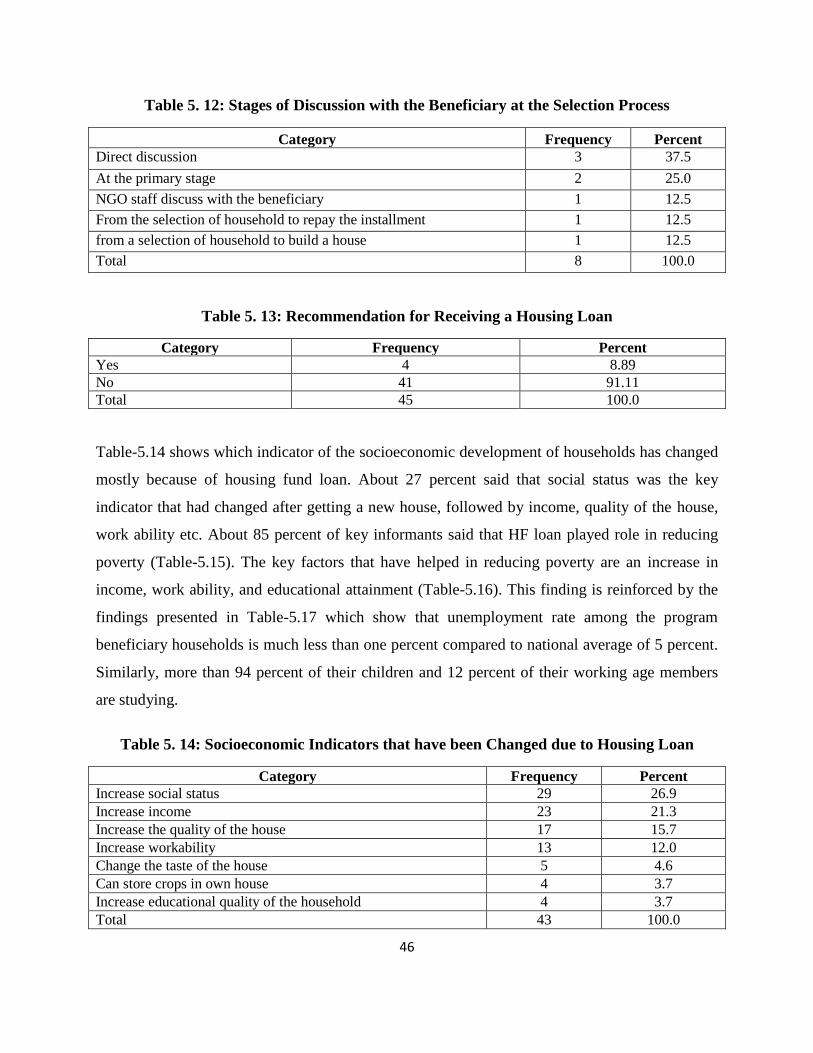
46
Table 5. 12: Stages of Discussion with the Beneficiary at the Selection Process
Category Frequency Percent
Direct discussion 3 37.5
At the primary stage 2 25.0
NGO staff discuss with the beneficiary 1 12.5
From the selection of household to repay the installment 1 12.5
from a selection of household to build a house 1 12.5
Total 8 100.0
Table 5. 13: Recommendation for Receiving a Housing Loan
Category Frequency Percent
Yes 4 8.89
No 41 91.11
Total 45 100.0
Table-5.14 shows which indicator of the socioeconomic development of households has changed
mostly because of housing fund loan. About 27 percent said that social status was the key
indicator that had changed after getting a new house, followed by income, quality of the house,
work ability etc. About 85 percent of key informants said that HF loan played role in reducing
poverty (Table-5.15). The key factors that have helped in reducing poverty are an increase in
income, work ability, and educational attainment (Table-5.16). This finding is reinforced by the
findings presented in Table-5.17 which show that unemployment rate among the program
beneficiary households is much less than one percent compared to national average of 5 percent.
Similarly, more than 94 percent of their children and 12 percent of their working age members
are studying.
Table 5. 14: Socioeconomic Indicators that have been Changed due to Housing Loan
Category Frequency Percent
Increase social status 29 26.9
Increase income 23 21.3
Increase the quality of the house 17 15.7
Increase workability 13 12.0
Change the taste of the house 5 4.6
Can store crops in own house 4 3.7
Increase educational quality of the household 4 3.7
Total 43 100.0
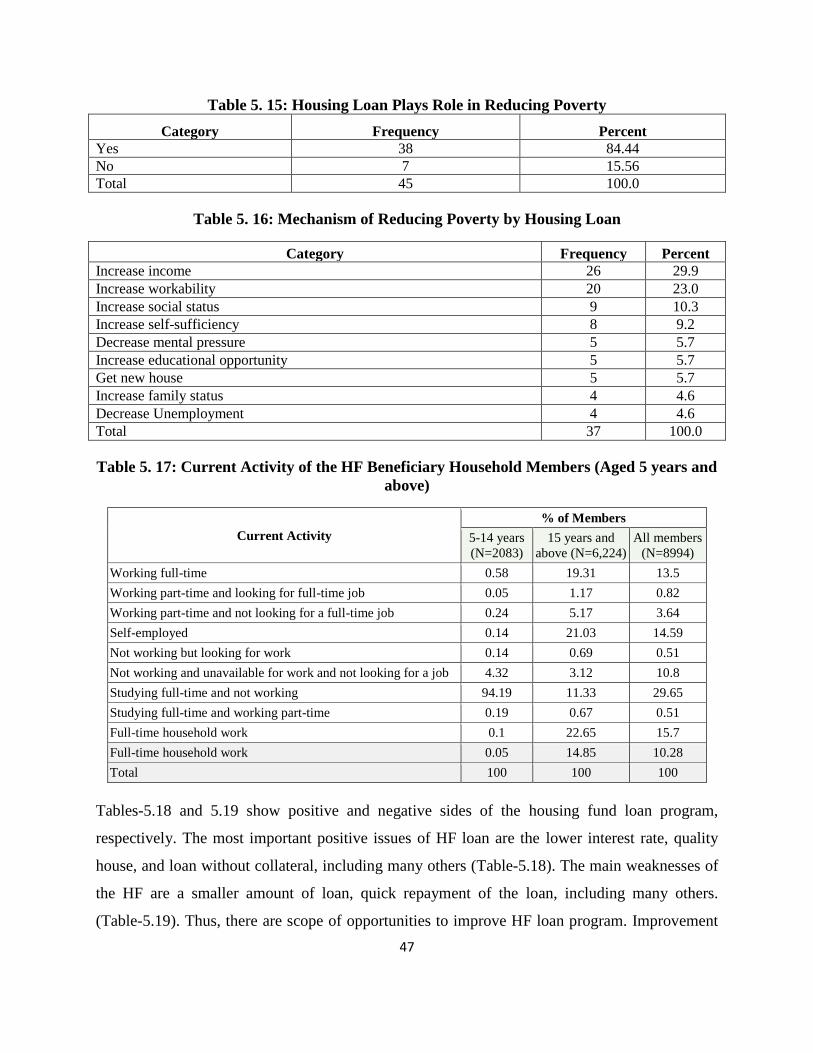
47
Table 5. 15: Housing Loan Plays Role in Reducing Poverty
Category Frequency Percent
Yes 38 84.44
No 7 15.56
Total 45 100.0
Table 5. 16: Mechanism of Reducing Poverty by Housing Loan
Category Frequency Percent
Increase income 26 29.9
Increase workability 20 23.0
Increase social status 9 10.3
Increase self-sufficiency 8 9.2
Decrease mental pressure 5 5.7
Increase educational opportunity 5 5.7
Get new house 5 5.7
Increase family status 4 4.6
Decrease Unemployment 4 4.6
Total 37 100.0
Table 5. 17: Current Activity of the HF Beneficiary Household Members (Aged 5 years and
above)
Current Activity
% of Members
5-14 years
(N=2083)
15 years and
above (N=6,224)
All members
(N=8994)
Working full-time 0.58 19.31 13.5
Working part-time and looking for full-time job 0.05 1.17 0.82
Working part-time and not looking for a full-time job 0.24 5.17 3.64
Self-employed 0.14 21.03 14.59
Not working but looking for work 0.14 0.69 0.51
Not working and unavailable for work and not looking for a job 4.32 3.12 10.8
Studying full-time and not working 94.19 11.33 29.65
Studying full-time and working part-time 0.19 0.67 0.51
Full-time household work 0.1 22.65 15.7
Full-time household work 0.05 14.85 10.28
Total 100 100 100
Tables-5.18 and 5.19 show positive and negative sides of the housing fund loan program,
respectively. The most important positive issues of HF loan are the lower interest rate, quality
house, and loan without collateral, including many others (Table-5.18). The main weaknesses of
the HF are a smaller amount of loan, quick repayment of the loan, including many others.
(Table-5.19). Thus, there are scope of opportunities to improve HF loan program. Improvement
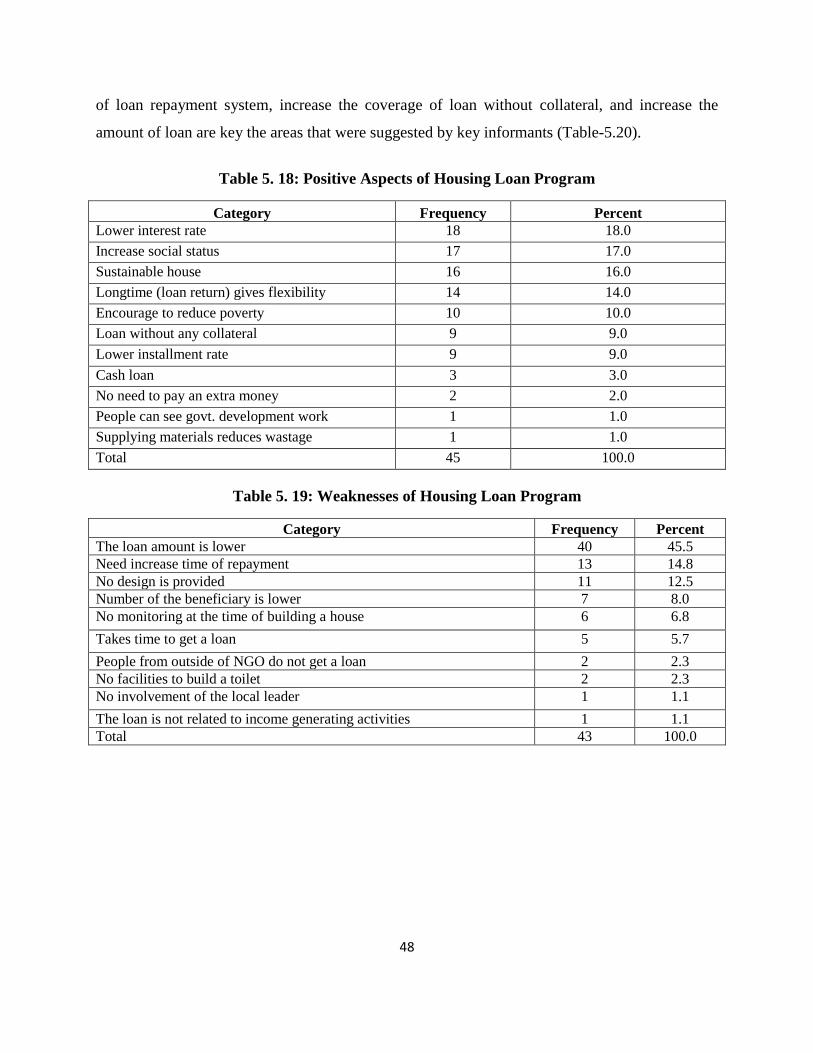
48
of loan repayment system, increase the coverage of loan without collateral, and increase the
amount of loan are key the areas that were suggested by key informants (Table-5.20).
Table 5. 18: Positive Aspects of Housing Loan Program
Category Frequency Percent
Lower interest rate 18 18.0
Increase social status 17 17.0
Sustainable house 16 16.0
Longtime (loan return) gives flexibility 14 14.0
Encourage to reduce poverty 10 10.0
Loan without any collateral 9 9.0
Lower installment rate 9 9.0
Cash loan 3 3.0
No need to pay an extra money 2 2.0
People can see govt. development work 1 1.0
Supplying materials reduces wastage 1 1.0
Total 45 100.0
Table 5. 19: Weaknesses of Housing Loan Program
Category Frequency Percent
The loan amount is lower 40 45.5
Need increase time of repayment 13 14.8
No design is provided 11 12.5
Number of the beneficiary is lower 7 8.0
No monitoring at the time of building a house 6 6.8
Takes time to get a loan 5 5.7
People from outside of NGO do not get a loan 2 2.3
No facilities to build a toilet 2 2.3
No involvement of the local leader 1 1.1
The loan is not related to income generating activities 1 1.1
Total 43 100.0
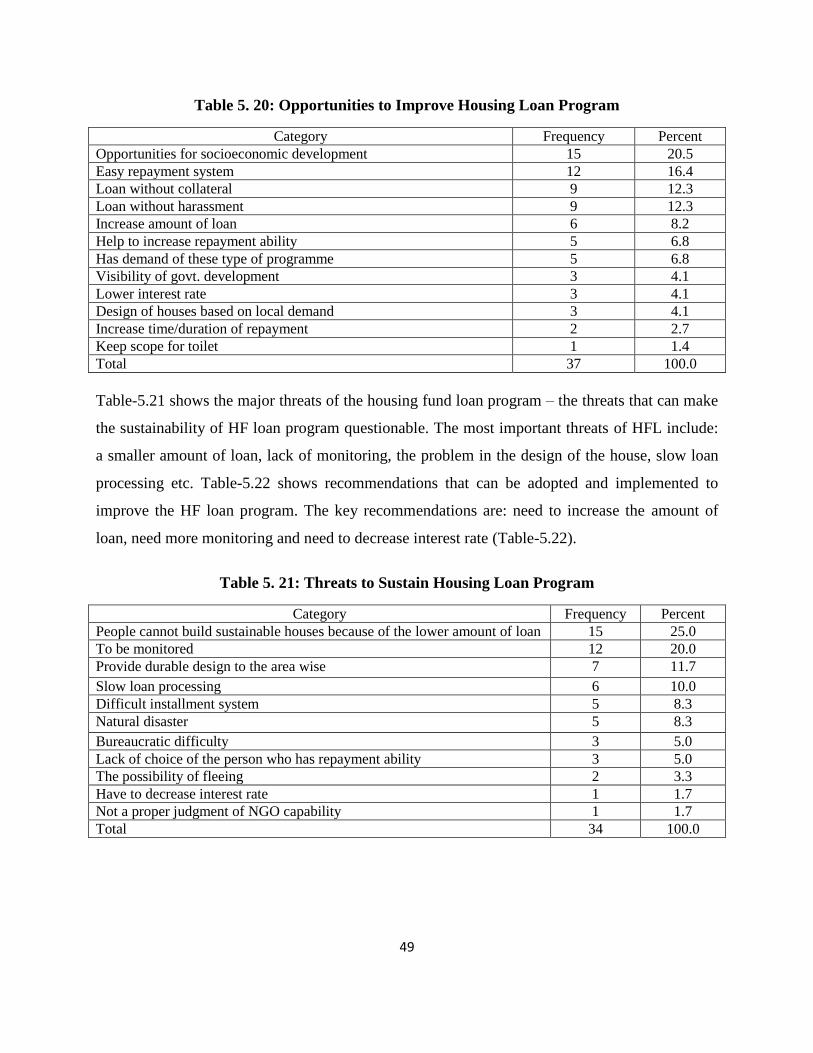
49
Table 5. 20: Opportunities to Improve Housing Loan Program
Category Frequency Percent
Opportunities for socioeconomic development 15 20.5
Easy repayment system 12 16.4
Loan without collateral 9 12.3
Loan without harassment 9 12.3
Increase amount of loan 6 8.2
Help to increase repayment ability 5 6.8
Has demand of these type of programme 5 6.8
Visibility of govt. development 3 4.1
Lower interest rate 3 4.1
Design of houses based on local demand 3 4.1
Increase time/duration of repayment 2 2.7
Keep scope for toilet 1 1.4
Total 37 100.0
Table-5.21 shows the major threats of the housing fund loan program – the threats that can make
the sustainability of HF loan program questionable. The most important threats of HFL include:
a smaller amount of loan, lack of monitoring, the problem in the design of the house, slow loan
processing etc. Table-5.22 shows recommendations that can be adopted and implemented to
improve the HF loan program. The key recommendations are: need to increase the amount of
loan, need more monitoring and need to decrease interest rate (Table-5.22).
Table 5. 21: Threats to Sustain Housing Loan Program
Category Frequency Percent
People cannot build sustainable houses because of the lower amount of loan 15 25.0
To be monitored 12 20.0
Provide durable design to the area wise 7 11.7
Slow loan processing 6 10.0
Difficult installment system 5 8.3
Natural disaster 5 8.3
Bureaucratic difficulty 3 5.0
Lack of choice of the person who has repayment ability 3 5.0
The possibility of fleeing 2 3.3
Have to decrease interest rate 1 1.7
Not a proper judgment of NGO capability 1 1.7
Total 34 100.0
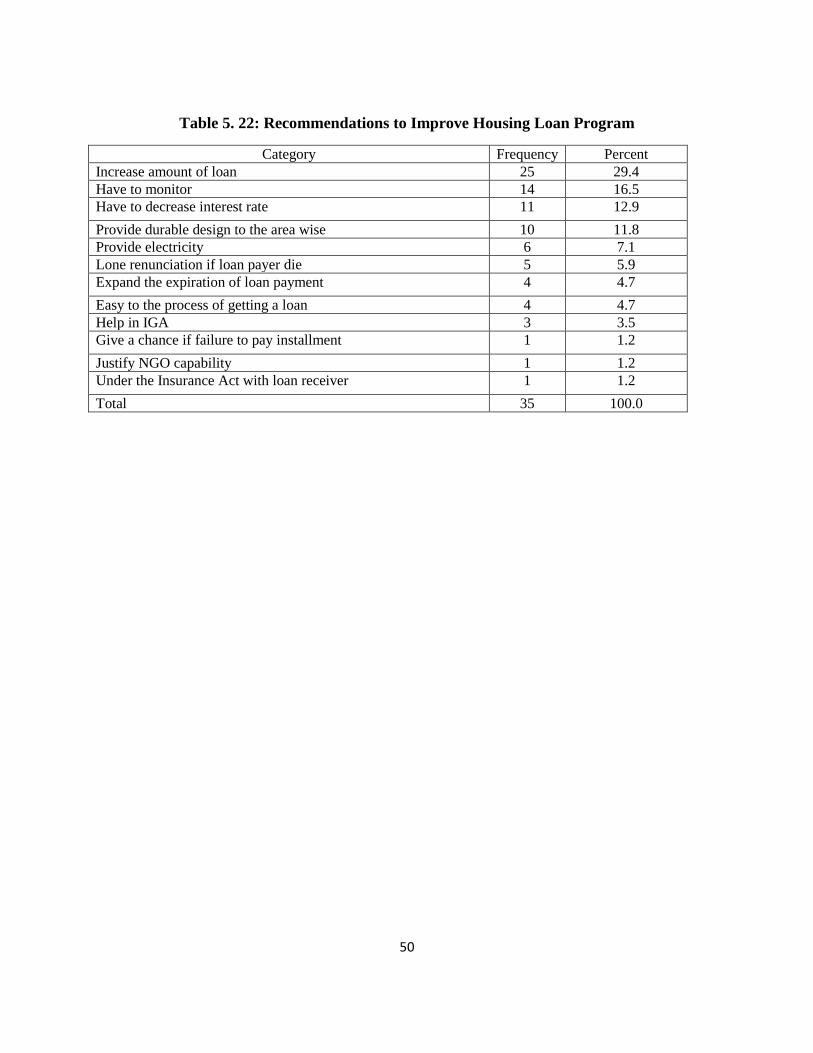
50
Table 5. 22: Recommendations to Improve Housing Loan Program
Category Frequency Percent
Increase amount of loan 25 29.4
Have to monitor 14 16.5
Have to decrease interest rate 11 12.9
Provide durable design to the area wise 10 11.8
Provide electricity 6 7.1
Lone renunciation if loan payer die 5 5.9
Expand the expiration of loan payment 4 4.7
Easy to the process of getting a loan 4 4.7
Help in IGA 3 3.5
Give a chance if failure to pay installment 1 1.2
Justify NGO capability 1 1.2
Under the Insurance Act with loan receiver 1 1.2
Total 35 100.0
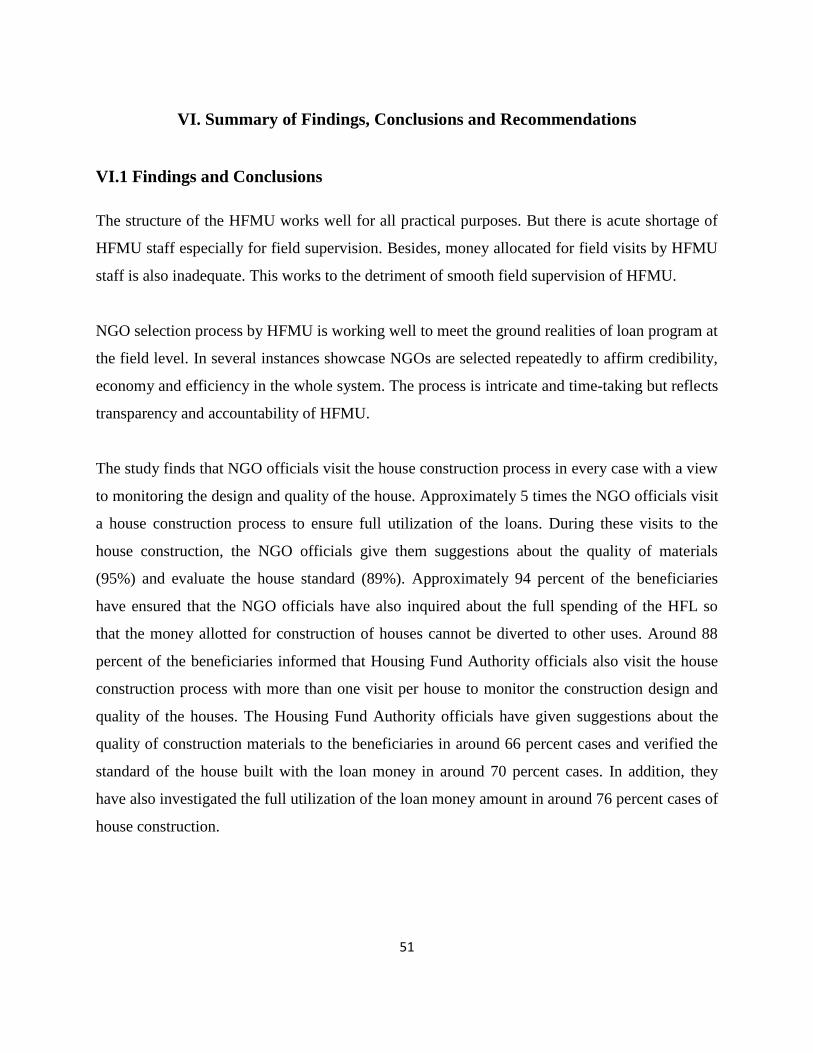
51
VI. Summary of Findings, Conclusions and Recommendations
VI.1 Findings and Conclusions
The structure of the HFMU works well for all practical purposes. But there is acute shortage of
HFMU staff especially for field supervision. Besides, money allocated for field visits by HFMU
staff is also inadequate. This works to the detriment of smooth field supervision of HFMU.
NGO selection process by HFMU is working well to meet the ground realities of loan program at
the field level. In several instances showcase NGOs are selected repeatedly to affirm credibility,
economy and efficiency in the whole system. The process is intricate and time-taking but reflects
transparency and accountability of HFMU.
The study finds that NGO officials visit the house construction process in every case with a view
to monitoring the design and quality of the house. Approximately 5 times the NGO officials visit
a house construction process to ensure full utilization of the loans. During these visits to the
house construction, the NGO officials give them suggestions about the quality of materials
(95%) and evaluate the house standard (89%). Approximately 94 percent of the beneficiaries
have ensured that the NGO officials have also inquired about the full spending of the HFL so
that the money allotted for construction of houses cannot be diverted to other uses. Around 88
percent of the beneficiaries informed that Housing Fund Authority officials also visit the house
construction process with more than one visit per house to monitor the construction design and
quality of the houses. The Housing Fund Authority officials have given suggestions about the
quality of construction materials to the beneficiaries in around 66 percent cases and verified the
standard of the house built with the loan money in around 70 percent cases. In addition, they
have also investigated the full utilization of the loan money amount in around 76 percent cases of
house construction.
52
The members of the beneficiary households have on average more than one different NGO
membership. NGO membership is the necessary condition for obtaining Housing Fund loan from
an NGO.
NGOs provide Housing Fund loan to the household head in 32 percent cases and to the prime
breadwinner of the households in approximately 31 percent cases. The NGOs do not seem to
bother about whether there is an existing loan of the borrower from other sources since 26
percent of the borrowers of HFL has an average loan of Tk. 42528 during borrowing which is 60
percent higher than the HFL amount.
The borrowers on average received loan of Tk. 50,000 during 2014-15 and Tk.70, 000 during
2016-17. To receive the HFL 52 percent of the borrowers go to Upazila, while 39 percent of
them get loan from Union Office and 9 percent of them receive loan in their own villages.
A striking feature of the HFL disbursement is that 69.5 percent of the borrowers pay on average
Tk. 465 to the NGOs as processing fee for obtaining HFL. The monthly installment of loan
repayment works out to an average of Tk. 1,559 because 57 percent of the beneficiaries repay
loan weekly with installment amounting to Tk. 400 (i.e. a monthly total of Tk. 1,600) while 43
percent of them pay out loan installments monthly with average rate of Tk. 1,559.
However, NGO officials come to 98 percent of the borrowers‟ houses to collect the monthly
installments. The NGOs usually recover the HFL completely within 48 months from the
borrowers. Encouragingly, around 85 percent of the borrowers have always been successful to
repay the installments of the HFL.
The study finds that around 4 percent of the Housing Fund borrowers pay on average Tk. 623 as
any kind of transaction cost to the NGO officials for obtaining the HFL. The underlying causes
of this invisible cost of HFL charged by the NGO officials are the so-called excuses as
refreshment purpose from 74 percent of the borrowers and document purpose from 26 percent of
the borrowers.
53
The field survey also reveals that lobbying plays an important role in obtaining HFL. Around 65
percent of the borrowers mentioned that help or lobbying by any external person is needed to
obtain the loan. Around 85 percent of them reported that insider NGO activists help them grant
the HFL. Out of 65 percent of the borrowers who would seek help from others to obtain HFL,
only 0.45 percent of them pay anything in kind or cash. On average a HFL borrower pays Tk.
280 to the person (external from NGOs) who helps to obtain the HFL.
Around 57 percent of the beneficiaries repay loan weekly with installment amounting to Tk. 400
and 43 percent of them pay out installments at a monthly rate of Tk. 1508. It means that in a
month a beneficiary under weekly loan repayment scheme pays on average Tk. 92 more than
his/her counterpart under the monthly scheme.
The factors accountable for the attraction of the borrowers to apply for HFL vary widely. Most
important among them is lower interest rate (40%) followed by longer loan repayment time
(27%) and easiness to get. However, more than 16 percent of the beneficiaries have failed to
repay the monthly installments of HFL about four times.
The survey reveals that approximately 53 percent of the borrowers of the HFL have previously
received a loan averaging 5 times from the same NGO that provides them with HFL. It implies
that NGOs prefer to select the HFL borrowers from amongst the pool of people who have
already gained the trust of the NGOs.
Only 2 percent of the beneficiaries reported that NGOs do not select proper households to
provide them with HFL. Approximately 70 percent of them reported cases of corruption by the
NGO officials in selecting the borrowers of HFL. Besides, political party pressure (17%), non-
payment of commissions to the NGO officials (7%) and pressure from the local elite (3%) have
also been attributed to the causes of why NGOs do not select proper beneficiaries for a HFL.
Further, around 15 percent of the borrowers have alleged affiliation with the local elite who help
them to obtain the HFL.
54
One of the striking facts is that around 89 percent of the beneficiaries are satisfied with the
NGOs that provide HFL – around 11 percent of them are not satisfied with the current activities
of the NGOs. The reasons are rooted elsewhere. Charging high interest rate has been found to be
the major cause of dissatisfaction by around 32 percent of the beneficiaries. In addition, too strict
rules (24%) and prolonged process of granting the HFL (24%) have been reported to be reasons
for dissatisfaction of the beneficiaries with the NGOs. Besides, 15 percent of the beneficiaries
have also complained about rude behavior of the NGO officials.
The study also finds that majority of the house designs are instructed by NGOs (42%) followed
by Housing Fund authority (36%). Only 14 percent of these houses are designed by household
members.
Average size of the houses built with HFL is found to be around 264 sq. ft. which is fully
consistent with the Grihayan Tahobil approved specification of 220–300 sq. ft. and an attached
bathroom. All the houses have an attached bathroom and only 12 percent of them have an
attached kitchen. These houses have on average 2 doors and 3 windows. Around 4 persons live
in the house. Only 5 (29%) out of 17 houses have been rented out. These houses are expected to
sustain for around 30 years and all of them can withstand natural calamities.
The field survey reveals that around 5 percent of the beneficiary compared to 3 percent of non-
beneficiary houses are built on squatter land. This is not consistent with the existing laws of the
land. Further, it may be noted that 17 out of 1700 houses built with HFL are not used by the
beneficiaries as the main living house. While 94.12 percent of these houses are used for living
purposes 5.88 percent of them are used for economic activities. Around 71 percent of these
houses are in fairly good and 18 percent of them are in good condition, while around 12 percent
of them are found seriously dilapidated.
Majority of the beneficiaries (65%) have reported that there are no weak parts of the houses.
However, 18 percent of them have identified floor to be the weak part or inconsistent with the
standard of the house. Besides, 6 percent of them report door and another 6 percent of them
report bata (props) to be the weak parts of the house. In keeping with expectations, 29 percent of
55
them have repaired the floor, while 14 perrcent of them have repaired the roof, wall, and the door
of their houses. Money spent for repair purposes of the house averaged Tk. 19,457.
More than half of the beneficiaries are “satisfied” with respect to interest rates, documentation
procedure required to obtain the loan, sanctioning procedure and overall procedure of obtaining
housing fund loan from the NGOs. With respect to amount of loans 47 percent of them are fairly
satisfied. By and large, most of them are satisfied in various degrees on all aspects of NGO
activities related to HFL program. However, dissatisfaction of the beneficiaries primarily relates
to the amount of loan, interest rate and loan repayment installment period.
In the absence of HFL it would take more than 3 years to construct a similar standard house built
with the HFL. According to around 87 percent of the borrowers of HFL, current amount of loan
is insufficient to construct a standard house. The HFL beneficiaries expect to obtain a loan
amounting to Tk. 134,129 in order to build a standard house. They also consider 3 percent as the
appropriate interest rate with a loan repayment period of 5 years and 7.6 months. Moreover, they
prefer to get monthly installment not to exceed Tk. 1363 under both weekly and monthly
schemes.
The field survey reveals that the loan allocated by Housing Fund is being implemented
effectively. This is attributable to good governance of housing fund loan and inspection method
applied in supervising and monitoring the utilization of housing fund loan. However, inspection
by the HFMU is largely limited by the shortage of field staff of the HFMU coupled with shortage
of fund for regular and close field supervision.
Around 99 percent of the HFL beneficiaries spend the entire loan amount to construct the house
and according to around 87 percent of them, the amount of loan received is insufficient to build a
standard house. Consequently, approximately 94 percent of the beneficiaries have spent
additional money to construct the house and the amount of additional money spent on top of the
loan amount totals on average Tk. 67,611 per house.
56
Past savings of the beneficiaries accounts for the lion‟s share (around 58%) of the sources of
additional money spent on house construction followed by relatives or any other person (21.5%)
and loan from GO/NGO organizations (18.4%) and other sources.
However, a very negligible 2.6 percent of the beneficiaries have acknowledged diverting the use
of HFL to other purposes than building houses. Other uses of the HFL by the beneficiaries
include: medical expenses (36%), repayment of other loans (20%), marriage ceremonies (16%)
and food expenses (14%). From this scenario it is difficult to conclude that the HFL money is
being abused. Instead, this situation warrants consideration of tying up HFL program with other
social protection programs so that overall quality of life of the beneficiaries improves.
The strengths, weaknesses, opportunities and threats/constrains of the HFL program are as
follows:
Strengths Weaknesses Opportunities Threats/Constraints
Easy terms &
conditions of loans
Limited opportunity to build
house according to the
recipients‟ choice/design
Increase in housing fund
may increase loan
amount
Lengthy processing time
Relatively low
interest rate
Low loan amount to build a
standard house
Weekly/monthly loan
repayment flexibility
Repayments depends on
the income of the family
Relatively long
repayment period
Limited field supervision by
the HFMU
Opportunities exist for
greater coverage
Not complementary to
other social protection
Progress friendly The program is exclusive of
the ultra-poor
Housing opportunities
for the relatively poor
Limitations of HFMU
field staff and budget
The study finds that 93 percent of the program beneficiary households have experienced an
upward change in social status during the last 5 years as against 49 percent of the non-
beneficiary households. On the other hand, 47 percent of the non-beneficiary households think
that there have been no changes in their social status during the last 5 years as against only about
6 percent of the beneficiary group. The statistics also show that participation in social events
among program beneficiary households is higher than the non-beneficiary households. All these
results indicate that access to housing fund loan for a new but less expensive house is likely to
change the social status of a household.
57
The results indicate that the construction of a new house through housing fund loan leads to an
increase in the income of the beneficiary households by Tk. 560 per month. This difference in
income is statistically significant as confirmed by a significant t-test. And this increase in income
is perhaps due to the investment made by beneficiary by minimizing the maintenance cost of the
house. The results also show that per capita income and expenditure among program beneficiary
households are higher than non-program households.
The results show that a new house lowers the number of households becoming ill in a year from
2.7 to 1.7. The difference between a program and non-program households on this indicator is
also about 1. The similar findings are observed in the case of the number of times household
members becoming ill in a year. A new house through HF loan reduces the frequency of illness
from 4.30 to 2.53 and the difference between a program and non-program households are also
visible. All these differences are statistically significant as confirmed by t-test. This result is not
surprising because a new house improves the living condition of a household and therefore the
health status of a household improves.
The results further show that women in the program households are more empowered than the
non-program households. The indicators of women empowerment that are better in program
households are women going outside the village; women going to public places like market,
school, health care center; women visiting her own or relatives home; spending on children
education; selecting NGOs for membership; attending the NGO meeting. The differences are
statistically significant as confirmed by a low p-value.
The response results show that on average 97 percent of the program beneficiary households see
improvement in healthy environment, children‟s education, peace of mind, and social status
because of the new house financed by housing fund loan. Moreover, the construction of the new
house has contributed to the marriage happenings in 100 percent of cases. These findings on the
development indicators of household socioeconomic life indicate housing fund loan is likely to
improve the lifestyle of a household.
58
Of the total survey beneficiaries, about 30 percent said that access to housing fund loan improved
several socioeconomic indicators significantly. These are food standard, income, health services,
children‟s education, and cleanliness of household. About 50-70 percent said that the changes of
these indicators with housing loan are somewhat better than without housing loan or new house.
Only about 6-10 percent beneficiaries said that access to housing loan had no impact on their
living standard. The findings indicating a new house through housing fund loan create a positive
impact on their socioeconomic life.
The respondents said that a new house through housing fund loan was highly beneficial to them.
Of the total survey beneficiary about 80 percent said that housing fund loan was very beneficial
followed by 16 percent and 5 percent beneficiary households who said the loan was beneficial
and somewhat beneficial respectively. Overall, the findings show that the construction of a new
house through housing fund loan leads to significant improvement in the socioeconomic
development indicators of program households.
Of the total beneficiaries surveyed, about 46 percent mentioned that they were very satisfied with
the way the house was being built. About 33 percent beneficiary said that they were satisfied,
followed by 21 percent beneficiary who said that they were somewhat satisfied. On the process
of distribution of NGO loan, about 32 percent said that they were highly satisfied, followed by
49 percent and 21 percent of the total beneficiaries who said that they were satisfied and
somewhat satisfied respectively. On the process of receiving HF loan, almost 100 percent
respondents said that they were satisfied. The overall findings indicate that the level of
satisfaction of the beneficiaries at each step of the loan process to the house being built was
good.
The key informants said that about 45 percent of selected beneficiaries were poor and had the
ability to repay the loan. About 26 percent were poor with no house. These indicate that majority
of the recipients of HF loan are poor. However, only 31 percent of the beneficiaries have been
selected through discussing with beneficiaries. Among them, only about 38 percent were selected
59
through a direct discussion with beneficiaries. The most positive side of the beneficiary selection
was that in 91 percent cases recommendation was not required in selecting them.
About 27 percent of them said that social status was the key indicator that had changed after
getting a new house; followed by income, quality of the house, work ability etc. About 85
percent of key informants said that HF loan played a role in reducing poverty. The key factors
that helped in reducing poverty are an increase in income, work ability, and educational
attainment. This finding is reinforced by other findings which show that unemployment rate
among the program beneficiary households is much less than one percent compared to national
average of 5 percent. Similarly, more than 94 percent of their children and 12 percent of their
working age members are currently studying.
The most important positive issues of HF loan are the lower interest rate, quality house, and loan
without collateral, including many others. The main weaknesses of the HF are a smaller amount
of loan, quick repayment of the loan, no specific design of the house built, and so forth. Thus,
there are scope of opportunities to improve HF loan program. Improvement of loan repayment
system, increase the coverage of loan without collateral, and increase the amount of loan are key
the areas that were suggested by key informants.
The threats that can make the sustainability of HF loan program questionable include: a smaller
amount of loan, lack of monitoring, the problem in the design of the house, slow loan processing
etc.
In sum, the social program of the Grihayan Tahobil (Housing Fund) is working smoothly. Its
contribution to the improvement of economic and social status of the targeted beneficiaries is
remarkable. The economic and social benefits accruing from the Housing Fund greatly outweigh
its negative externalities.
60
VI.2 Recommendations
The existing housing fund loan program may be improved along the following areas:
1. Amount of loan may be enhanced to Tk. 100,000 for the present.
2. Loan repayment period may be extended to 15 years subject to intergenerational transfer of
housing fund loan.
3. Coverage of loan without collateral may be increased.
4. Other social protection programs may be combined with HFL program.
5. Field supervisory staff of HFMU may be increased along with budget for field supervision for
closer monitoring and supervision of HFL program.
6. Housing fund loan program may be continued on a regular basis to ensure affordable housing
for the poorer people of the society.
61
References
Adriaanse, C. C. M. (2007). Measuring residential satisfaction: a residential environmental
satisfaction scale (RESS). Journal of Housing Build Environment, 22, 287-304.
Apparicio, P. and Seguin, A. (2006). Measuring the Accessibility of Services and Facilities for
Residents of Public Housing in Montreal. Urban Studies 43(1), 187-211.
Ajanlekoko, J.S. (2001). Sustainable Housing Development in Nigeria – The Financial and
Infrastructural Implication. International Conference on Spatial Information for
Sustainable Development Nairobi, Kenya retrieved on 6th June, 2011 from http:// www.
fig.net/ pub/ proceedings/ nairobi/erguden-CMTS1-1.pdf
Arimah, B. C. (1999). Housing Policy Outcomes in Global Perspective: An Application of
Discriminate Analysis Netherlands. Journal of Housing and the Built Environment. Vol.
12, 257– 280.
Bangladesh Bureau of Statistics. (2017). Preliminary Report on Household Income and
Expenditure Survey 2016. Dhaka: BBS.
Eziyi, O. I, Akunnaya, P.O., Albert, B. A. and Dolapo, A. (2013).Performance evaluation of
residential buildings in public housing estates in Ogun State, Nigeria: User‟s satisfaction
perspective. Frontiers of Architectural Research 2, 178-190.
Grihayan Tahobil. (2010). 33rd Steering Committee Meeting Minutes. Dhaka: Grihayan Tahobil,
Bangladesh Bank.
Grihayan Tahobil. (2017). 48th Steering Committee Meeting Minutes. Dhaka: Grihayan Tahobil,
Bangladesh Bank.
Grihayan Tahobil. (2017). Draft Grihayan Tahobil Nitimala. Dhaka: Grihayan Tahobil,
Bangladesh Bank.
Hendrickson, C. (2009). Economic Benefits of Sadowski Act State and Local Housing Trust
Fund Monies. Sadowski Workforce Housing Coalition. An Evaluation of the Impact of
Government Assisted… www.theijes.com The IJES Page 13
Hsieh, H.R. (2008). Issues and Proposed Improvements Regarding Condominium Management
in Taiwan. Habitat International 33, 73-80.
62
Ibem E.O. and Amole O.O. (2010). Evaluation of Public Housing Programmes in Nigeria: A
Theoritical and Conceptual Approach. Journal of the Built and Human
Environment.Vol.3, pp 90-110.
Kantrowitz, M. & Nordhaus, R. (1980). The Impact of Post Occupancy Evaluation Research: A
Case Study. Environment and Behavior 12 (4), 508-519.
Ogu, Y.I. (2002). Urban residential satisfaction and the planning implications in a developing
world context: the example of Benin City, Nigeria. International Planning Studies, 7, 37-
53.
Olotuah, A. O. and Bobadoye, S. A. (2009).Sustainable Housing Provision for the Urban Poor: A
Review of Public Sector Intervention in Nigeria. Journal The Built & Human
Environment Review, Volume 2, 52-60.
Paris, D. E. and Kangari, R. (2005). Multifamily affordable housing: residential satisfaction.
Journal of Performance and Constructed facilities, 19, 138-145.
Steven, D. (2008). Housing and Economic Development: Moving Forward Together, Housing
corporation. London: Centre For Research and Market Intelligence.
Sengupta, U. and Tipple, A.G. (2007). The Performance of Public –Sector Housing in Kolkata,
India in the Post – Reform Milieu. Urban Studies 44(10), 2009-2027.
Wardrip, K., Williams, L., Hague, S. (2011). The Role of Affordable Housing in Creating Jobs
and Stimulating Local Economic Development: A Review of the Literature. Oakland,
U.S.A: Centre Housing and Policy Macarthur foundation.