Embed Size (px)
Citation preview

Please cite as follows: Kevin Curran, Eoghan Furey, Tom Lunney, Jose Santos, Derek Woods and Aiden Mc Caughey (2011) An Evaluation of
Indoor Location Determination Technologies, Journal of Location Based Services, Vol. 5, No. 2, pp:, June 2011, ISSN: 1748-9725, Taylor & Francis
An Evaluation of Indoor Location
Determination Technologies
Kevin Curran, Eoghan Furey, Tom Lunney, Jose Santos, Derek Woods, Aiden Mc Caughey
Intelligent Systems Research Centre
Faculty of Computing and Engineering,
University of Ulster, Northern Ireland, UK
Email: [email protected]
Abstract
The development of Real Time Locating Systems (RTLS) has become an important add-on to many
existing location aware systems. While GPS has solved most of the outdoor RTLS problems, it fails to
repeat this success indoors. A number of technologies have been used to address the indoor tracking
problem. The ability to accurately track the location of people indoors has many applications ranging
from medical, military and logistical to entertainment. However, current systems cannot provide
continuous real time tracking of a moving target or lose capability when coverage is poor.
The deployment of a real time location determination system however is fraught with problems. To date
there has been little research into comparing commercial systems on the market with regards to
informing IT departments as to their performance in various aspects which are important to tracking
devices and people in relatively confined areas. This paper attempts to provide such a useful comparison
by providing a review of the practicalities of installing certain location sensing systems. We also
comment on the accuracies achieved and problems encountered using the position-sensing systems.
1 Introduction
Mobile devices are associated with network technologies that have the potential to provide user location
and context cues to the services they offer. Location data alone has little value, but when it is used to
expand the variety of mobile applications through timely, personalised content reactive to dynamic
environments, it offers great return for very little additional bandwidth use. The ability to track and check
the location of people or equipment in real time has a large number of application areas such as child
safety, prisoner tracking and supply chain to name but a few (Krzysztof & Hjelm, 2006; Cooper et al.,
2010). Over the past two decades a large number of commercial and research positioning systems have
been developed (Hazas et al., 2004). Generally, these systems have the constraint of providing lower
accuracy over a wide coverage area or providing high accuracy (<30 cm) in a small area. Accuracy
systems often require extensive infrastructure, many sensors and time consuming calibration. AT&T
Cambridge’s Active Bats system (Addlesee et al., 2001) used ultrasonic badges and required one
ultrasound receiver to be installed every square meter.

Please cite as follows: Kevin Curran, Eoghan Furey, Tom Lunney, Jose Santos, Derek Woods and Aiden Mc Caughey (2011) An Evaluation of
Indoor Location Determination Technologies, Journal of Location Based Services, Vol. 5, No. 2, pp:, June 2011, ISSN: 1748-9725, Taylor & Francis
Radio Frequency Identification, is a technology used for the automatic identification and tracking of
goods, animals and people. It requires each person or piece of equipment that is to be tracked to have a
RFID tag attached and RFID tag readers to be installed in the mobile device. There are two types of RFID
tags, active and passive. Active tags have a small power supply used to send out a signal that gives them a
range of up to 100 meters while the passive tags have no power supply and are activated by a scanning
signal which means they typically have a range of detection of less than a meter. A typical system
consists of three parts – a transponder, a reader, and a controlling application. Transponders hold data on
the person or object they are attached to, usually containing a unique code used for identification, such as
a serial number. When within an appropriate range of a reader, the transponders transmit this data to the
reader using radio. The reader decodes this radio signal into digital information, which is then relayed to a
computer application that makes use of it. RFID technology is extremely widespread, used in many
different applications such as security systems, public transport payment systems, the tracking of
commercial goods, and livestock identification.
Wi-Fi location determination is a technology that has been developed in recent years to offer existing Wi-
Fi enabled devices a positioning service. The technology uses modulated Wi-Fi transmission signals to
detect the presence of a device: the system is able to triangulate the position of the device based on the
signals received from the other Access Points (AP). One of the first examples of using Wi-Fi1 for
location fixing was RADAR (Bahl & Padmanabhan, 2000; Krzysztof et al., 2006) developed at
Microsoft. Microsoft also developed RightSPOT, which used a ranking system of available Frequency
Modulation (FM) radio stations rather than their relative signal strengths to determine location. With
eight radio stations they were able to get an accuracy rate of approximately eighty percent (Krumm et al.,
2003). Indoor positioning is especially useful in large buildings like hospitals, university campuses and
various business premises. Systems have been based on a range of 'signals of opportunity' such as
ultrasound or Wi-Fi signals. These can be standalone signals that are not used for communication such as
Ubisense which uses Ultra Wide Band (UWB) radio signals, or they can be based on existing
communication signals like Ekahau which uses Wi-Fi signals (Steggles & Gschwind, 2005). An
advantage of indoor positioning is that because of the short range of these technologies, power
consumption is usually fairly low. Also, accuracy levels can be quite high, but this depends on the system
used. On the downside, these systems cannot compete with GPS or Cellular positioning systems in terms
of universal coverage and they often need to be calibrated, leading to larger roll-out costs in terms of time.
This paper attempts to provide an overview of key features in a number of commercial indoor location
tracking systems. The systems use a variety of underlying wireless standards such as RFID and WiFi. The
paper provides an overview of the systems tested and also provides insights learned from installing them
on a university campus with the intention of evaluating them against criteria such as ease of use and
accuracy.
2 Indoor Positioning Systems
The following sections give an overview of a number of currently used indoor positioning systems.
The LA200 is a Wi-Fi network based system which uses the existing network hardware and devices
already deployed. Trapeze claims that all the calibration can be done from a central point but this only
gives RSS fingerprints at the access point locations. Like many commercial systems, much manual

Please cite as follows: Kevin Curran, Eoghan Furey, Tom Lunney, Jose Santos, Derek Woods and Aiden Mc Caughey (2011) An Evaluation of
Indoor Location Determination Technologies, Journal of Location Based Services, Vol. 5, No. 2, pp:, June 2011, ISSN: 1748-9725, Taylor & Francis
tweaking is necessary to get satisfactory levels of accuracy. The underlying methods of positioning are
also based on fingerprinting. The LA200 contains an API for further development. The LA200 has a
granularity of five minutes without additional network load and then stores all this data for each device
for a maximum of thirty days at a ten meter precision level so it can attempt to locate all devices to a
room level.
Ubisense1 is a real time location system (RTLS) built on Ultra Wide Band (UWB) radio technology. The
system is composed of UWB active tags (ubitags), sensors and a software platform. Active battery
powered Ubisense tags enable positioning by transmitting UWB pulses. Sensors receive these pulses
from the tags which must be positioned around the test area in a way that gives complete directional
coverage of the test area. A software platform carries out the positioning calculations on the data received
from the sensors. Each area to be tested must have its own network of sensors, i.e. each room. These
areas can be integrated to give continuous positioning information even when the target moves from one
area to another. This works in a similar manner to mobile phone cells transferring control from one to the
next. Each sensor determines the Angle of Arrival (AoA) of the signal from the tag. If two or more
sensors are connected in the test area it is possible to include Time Delay of Arrival (TDoA) along with
AoA measurements. This gives a 3D location estimate with accuracy levels of 15 cm (Steggles &
Gschwind, 2005). The tags can respond to an event in less than 100 ms and the battery life is claimed to
last up to 5 years. The Ubisense system also contains a .Net 2.0 API for custom application development.
Ekahau's2 Java based system contains of a number of main parts which include: (1) The Ekahau
Positioning Engine (EPE), (2) the Ekahau Site Survey and (3) the Ekahau Client. The Client
communicates with the mobile device’s Wi-Fi chip and retrieves the RSSI information and passes this
along to the EPE. The EPE is a positioning server that provides the location coordinates (x, y, and floor)
of the mobile terminal or Wi-Fi tag. The Ekahau manager merges information from the EPE and the
Client and also provides applications for site calibration (Ekahau Site Survey) and live tracking. A
noteworthy element of the Ekahau systems is their proprietary “Rails” software which allows for tracking
to be carried out in a way that replicates human movement and eliminates the “jumping through walls
effect”. The Rails are added by an administrator to “teach” the solution where devices are able to travel.
The software views the area where the rails are placed as a higher probability of true location. Ekahau can
use a network, terminal or terminal assisted approach. It also comes with an Application Programming
Interface (API) to enable custom applications to be developed.
Trolley Scan’s RFID-radar3 system is an example of an indoor RFID based location determination system
that has the accuracy capability of less than fifty centimetres in an area up to one hundred meters deep,
however this depends on the tags used and may be as little as ten meters. The system can track up to fifty
tags and locate their position within a few seconds. The system has three main components, the reader,
the antenna array and the tags. The reader measures the distance of the signals from the tags, the antenna
array for energising the tags and finally the tags themselves.
1 http://www.ubisense.net/
2 http://www.ekahau.com/
3 http://www.rfid-radar.com/

Please cite as follows: Kevin Curran, Eoghan Furey, Tom Lunney, Jose Santos, Derek Woods and Aiden Mc Caughey (2011) An Evaluation of
Indoor Location Determination Technologies, Journal of Location Based Services, Vol. 5, No. 2, pp:, June 2011, ISSN: 1748-9725, Taylor & Francis
3 Evaluation of Location Determination Systems
RSSI is the most crucial parameter in the localization of WLAN devices. One of the most important
factors in the measurement of RSSI is the power attenuation due to distance; however absorption gradient
also affects the RSSI measurement. Sudden changes in signal absorption, due to walls for example,
introduce discontinuities into the dependence between RSSI and distance that is normally considered a
smooth function (Nafarieh & How, 2008). In addition to walls, the presence of humans, the direction of
the antenna, and the types of WLAN cards have an effect on the absorption of the RF signal energy.
Throughout our study, we attempted to recreate environments as close to the real world conditions as
possible. The RSSI values can be reported by the device driver as a non-dimensional number or
percentage and sometimes is converted to dBm through some nonlinear mapping process (Bardwell,
2005). Since the RSSI measurements are dependent on different laptop / antenna positioning (e.g., height
of the mobile card), antenna orientations were controlled. The average of all data in all directions was
used to create the vector for the particular measurement point. We found that the antenna orientation
could cause a variation in RSS level of up to 10 dBm. This effect cannot be ignored when considering the
impact different orientations have on RSSI measurements reliability and eventually on the localization
accuracy documented here (Li et al., 2005), relating to: (1) Trapeze Networks LA-200 (2) Ubisense
Precise RTLS (3) Ekahau RTLS and (4) Trolley Scan RFID-radar.
3.1 Trapeze Networks LA-200
The Trapeze LA200 is a location appliance from Newbury Networks. Physically it is a rack server and
was slotted into the central IT services server room. The LA200 can sense any wifi device in the
environment and these devices do not need to be associated with an access point. This allows a device
with a weak signal which otherwise would not be allowed to connect to be tracked. It also allows devices
to connect which do not need to be running client software. However the LA200 is also compatible with
any 802.11 compatible active tags from Newbury Networks, Pango, AeroScout or Ekahau.
Figure 1: LA200 Locales visible in Dashboard application

Please cite as follows: Kevin Curran, Eoghan Furey, Tom Lunney, Jose Santos, Derek Woods and Aiden Mc Caughey (2011) An Evaluation of
Indoor Location Determination Technologies, Journal of Location Based Services, Vol. 5, No. 2, pp:, June 2011, ISSN: 1748-9725, Taylor & Francis
Once setup was complete, the fingerprinting began. This involved the uploading of maps for each floor to
be mapped. Locales are defined so as to define regions for clarity (see Figure 1). For instance, a corridor
may be irregularly shaped but the locale allows this type of region to be defined such as for instance
‘second floor hallway’. Fingerprinting was done holding a Newbury tag whilst selecting current locations
on the map and defining locales. Graphical bars in the dashboard application show the strength levels of
the signal for each locale.
Figure 2: Device view
Devices can be tracked and viewed using the dashboard application. For instance, Figure 2 shows a laptop
associated with an access point and located in an academic office. Views may be created which allow
searching for particular devices, groups of devices, devices in particular locales and more. Historical
movement of devices can also be viewed and downloaded. The LA200 can also be queried through its
API. Applications can be built on top and Trapeze supply a new application called Active Asset (See
Figure 3) which allows the system to immediately respond with the location of a device on the map.
Figure 3: Active asset showing all devices on MS first floor

Please cite as follows: Kevin Curran, Eoghan Furey, Tom Lunney, Jose Santos, Derek Woods and Aiden Mc Caughey (2011) An Evaluation of
Indoor Location Determination Technologies, Journal of Location Based Services, Vol. 5, No. 2, pp:, June 2011, ISSN: 1748-9725, Taylor & Francis
Figure 4: Asset Tag History from Active Asset Application
The active asset software also allows the querying of history from any device that has been tracked.
Figure 4 shows the locations which a tag with mac address 00:18:8E:20:1A:85 has visited. It shows the
start time and end time and duration in that locale.
3.2 Ubisense
The Ubisense RTLS solution utilizes battery-operated radio tags and a cellular locating system to detect
the presence and location of the tags. The locating system is usually deployed as a matrix of sensors that
are installed at a spacing of anywhere from 50 to 1000 feet depending on the site layout. These sensors
determine the locations of the radio tags. Ubisense consists of Tags - designed to be mounted on assets or
to be worn by a person; Location Engine software to install and tune a Ubisense sensor network and track
tags in real time, through a series of configuration wizards and the Location Platform software which
provides persistent storage and distribution of real-time location events for multiple clients in conjunction
with real-time monitoring and notification of user-specified spatial interactions between objects. The
Ubisense Series 7000 sensor is a precision measuring instrument containing an array of antennas and
ultra-wideband (UWB) radio receivers. The sensors calculate the location of the tags based on reception
of the detected UWB signals transmitted from Ubitags. Each sensor independently determines both the
azimuth and elevation Angle of Arrival (AOA) of the UWB signal, providing a bearing to each tag. The
Time Difference of Arrival (TDOA) information is determined between pairs of sensors connected with a
timing cable. Sensors are administered remotely using standard Ethernet protocols for their
communication and configuration. They work in standard wired and wireless environments, using
networking infrastructures, such as 802.11 access points, Ethernet switches and CAT5 structured network
cabling for communication between sensors and servers.
The tests were carried out in the same room used for the RFID-radar tests along with the same calibrated
locations shown in Figure 5. Each of the four sensors were mounted high in the corners of the Lab and
pointed towards the floor in the middle of the room. Each sensor network cable was connected to an 8
port Ethernet switch. The sensor in the top-left of the map (near location (0,5)) was chosen as Master and
Please cite as follows: Kevin Curran, Eoghan Furey, Tom Lunney, Jose Santos, Derek Woods and Aiden Mc Caughey (2011) An Evaluation of
Indoor Location Determination Technologies, Journal of Location Based Services, Vol. 5, No. 2, pp:, June 2011, ISSN: 1748-9725, Taylor & Francis
we connected a timing cable (unshielded CAT5 Ethernet straight-through cable) from each slave to a
timing socket on the back of the Master case. Ubisense recommend that the timing cables be shielded and
rated as CAT5e or better and that preferably be factory made.
Figure 5: Room MG281where locations for experiments are spotted in red
A coordination system must be defined. We choose the origin (0,0,0) near the column in the centre of the
room with a right-handed co-ordinate system. Calibration was done with a slim-tag in five uniformly
distributed points in the room. It is important to avoid those points that were not in LoS with the four
sensors and in each location we waited 10s before moving to the next one. In the actual testing, the tag
was left for 30s at each location before we read the measurement. The slim tag was also placed one meter
above the floor. Overall the error distance for static tags was on average 0.89 meters.
Location Tag ID Ubisense
location(m)
Real
location(m)
Range accuracy(m)
(1,0) 010-000-015-099 -3,25 from B
-0,62 from A
-2,60 from B
-0,10 from A
-0,65 from B
-0,52 from A
(1,1) 010-000-015-248 -3,25 from B
-2,17 from A
-2,60 from B
-2,00 from A
-0,65 from B
-0,17 from A
(1,2) 010-000-015-115 -3,89 from A
-3,69 from B
-4,30 from A
-2,60 from B
-0,44 from A
-1,09 from B
(0,0) 010-000-015-248 -1,30 from B
-0,56 from A
-0,10 from B
-0,10 from A
-1,20 from B
-0,46 from A
Table 1: Results of experiments with low range accuracy due to the presence of obstacles
Table 1 reports the results for those locations where the range accuracy was low due to the presence of
obstacles in the path. For instance, Figure 6 shows the Ubisense Location Engine results for position (1,0)
where location reported is not accurate.

Please cite as follows: Kevin Curran, Eoghan Furey, Tom Lunney, Jose Santos, Derek Woods and Aiden Mc Caughey (2011) An Evaluation of
Indoor Location Determination Technologies, Journal of Location Based Services, Vol. 5, No. 2, pp:, June 2011, ISSN: 1748-9725, Taylor & Francis
Figure 6: Poor results obtained by Ubisense Location Engine for position (1.0)
Table 2 illustrates some locations where the system reported good accuracy. Figure 7 shows the actual
Ubisense Location Engine results for position (2,0) where location reported is accurate.
Location Tag ID Ubisense location(m) Real location(m) Range accuracy(m)
(0,4) 010-000-015-115 -0,66 from B
-4,02 from C
-0,10 from B
-2,60 from C
-0,56 from B
-1,42 from C
(1,3) 010-000-015-099 -3,63 from B
-3,69 from C
-2,60 from B
-4,30 from C
-1,03 from B
-0,61 from C
(2,0) 010-000-015-115 -5,18 from D
0,66 from A
-4,30 from D
-0,10 from A
-0,88 from D
-0,76 from A
(2,1) 010-000-015-099 -4,68 from D
-2,57 from A
-4,30 from D
-2,00 from A
-0,38 from D
-0,57 from A
(2,2) 010-000-015-115 -4,30 from D
-4,30 from A
-4,55 from A
-3,63 from B
-0,25 from A
-0,97 from B
(2,4) 010-000-015-099 4,68 from D
-2,31 from C
-4,30 from D
-2,60 from C
-0,38 from D
0,31 from C
Table 2: Some selected locations with good accuracy measurements
Figure 7: A good result obtained by Ubisense Location Engine for position (2,0)

Please cite as follows: Kevin Curran, Eoghan Furey, Tom Lunney, Jose Santos, Derek Woods and Aiden Mc Caughey (2011) An Evaluation of
Indoor Location Determination Technologies, Journal of Location Based Services, Vol. 5, No. 2, pp:, June 2011, ISSN: 1748-9725, Taylor & Francis
3.3 Ekahau
The Ekahau Real Time Location System is a software suite that uses an existing WLAN network without
the need for additional special network hardware to determine the location of a Wi-Fi equipped device.
The suite has three main components namely the Ekahau Site Survey (ESS), the Ekahau Positioning
Engine (EPE) and the Ekahau API that utilises the EPE system to create custom applications. The EPE
uses software-based algorithms to calculate the position of a tag. However before the EPE can determine
the location work it needs the site survey calibration information from the ESS. The ESS collects the
information on the coverage and RSSI of each AP in the network across the area to be covered. The ESS
gathers the calibration information by a person carrying the system and walking around the area to be
covered. The Ekahau Positioning Engine allows the pinpointing of items such as Wi-Fi laptops, PDAs,
tablet PCs, barcode scanners, hospital telemetry devices, wireless VOIP phones or people wearing tags or
carrying these devices.
The Ekahau client runs on a client device such as a PC laptop or PDA. The Ekahau Positioning Engine
service runs on a desktop PC or (PC/Unix) server and calculates the client device x,y co-ordinates and
area name. The Ekahau Manager is an application for recording the field data for a positioning model
(Ekahau Site Calibration), tracking client devices on a map, and analyzing the positioning accuracy.
Finally, the Ekahau Application Framework and SDK is a set of helpful tools and easy programming
interface for authorized applications to quickly utilize EPE location information. EPE supports both a
zone based tracking, to report the device location by zone name, and also a continuous real-time
positioning of precise (x, y, floor) location coordinates. The Ekahau client is fully IEEE 802.11 a/b/g
compliant and runs in the background while still leveraging the Wi-Fi data and voice capabilities for other
applications.
Figure 8: Calibration Quality (Red = Low quality, Green = High quality)
Ekahau Site survey records RSSI data of the test area with all observable aspects of the WLAN being
considered. RF characteristics e.g. multipath and reflection are recorded and do not harm location
accuracy or signal measurement. This survey data then facilitates building tracking models. The observed
client data is recorded and each recorded location is assigned a probability based on this data. Figure 8
illustrates the calibration quality for one floor. Red indicates locales of poor fingerprinting quality whilst
areas of green indicate high quality calibration information. Ekahau Site Survey (ESS) is their software
tool for Wi-Fi network planning and administration. ESS gives a ground-level view of coverage and

Please cite as follows: Kevin Curran, Eoghan Furey, Tom Lunney, Jose Santos, Derek Woods and Aiden Mc Caughey (2011) An Evaluation of
Indoor Location Determination Technologies, Journal of Location Based Services, Vol. 5, No. 2, pp:, June 2011, ISSN: 1748-9725, Taylor & Francis
performance for creating, improving and troubleshooting Wi-Fi networks. ESS can provide tools for
network deployment and troubleshooting that are not provided by the centrally managed Wi-FI systems.
Network issues that are invisible to the wireless management systems may indeed by more easily
identified and resolved with ESS.
Figure 9: Rails and free space
Before you can calibrate an area, you have to draw "rails" in the Ekahau Manager program. Rails are
walking paths where it is assumed people will walk (see Figure 9).
Figure 10: Signal Strength
Ekahau uses its own probabilistic location detection algorithms giving 1-3 metres accuracy in ~ 5
seconds. A process of normalization is applied which allows for the use of hardware from different
vendors. Figure 9 illustrates how each dot represents a fingerprint. RSSI fingerprinting facilitates creating
radio maps and pin-pointing device locations (see Figure 10). All tags in the systems may be monitored at
all times and detailed information is given on each one through the Vision application. Various rules may
be set up and applied to control the movement of tags and devices for instance rules can be setup to
trigger alarms when tags enter certain zones (e.g. Lab B, outer perimeter) and this information may also
be output in report form.
3.4 RFID
Please cite as follows: Kevin Curran, Eoghan Furey, Tom Lunney, Jose Santos, Derek Woods and Aiden Mc Caughey (2011) An Evaluation of
Indoor Location Determination Technologies, Journal of Location Based Services, Vol. 5, No. 2, pp:, June 2011, ISSN: 1748-9725, Taylor & Francis
RFID has seen widespread use across many different applications. The vast majority of these applications,
however only use the data contained in tags within the reader’s zone, rather than the location of the tag at
any given time. Radio Frequency Identification tags can be easily added into most everyday objects.
Trolley Scan’s RFID-radar (rfid-radar.com, 2007) is an example of an indoor RFID based location
determination system that has the accuracy capability of less than fifty centimetres in an area up to one
hundred meters deep, however this depends on the tags used and may be as little as ten meters. The
system can track up to fifty tags and locate their location within a few seconds. The system has three main
components, the reader, the antenna array and the tags. The reader measures the distance of the signals
from the tags, the antenna array for energising the tags and finally the tags themselves.
The RFID-radar reader measures the distance of signals travelling from transponders and provides an
energy field to power them. The processing module can report the identity, position in 2D or 3D space,
and movement at one-second intervals of any tags in the reader zone. Its location accuracy is within 50
centimetres and its pointing accuracy is to within one degree. The antenna array contains one transmit
antenna for energising the passive transponders and one antenna for each receiver, giving a total of three
antennas in the array. By comparing the ranges on both receivers, the angle of arrival can be calculated,
allowing the system to show the range and direction of a tag at the time of reading. By measuring the
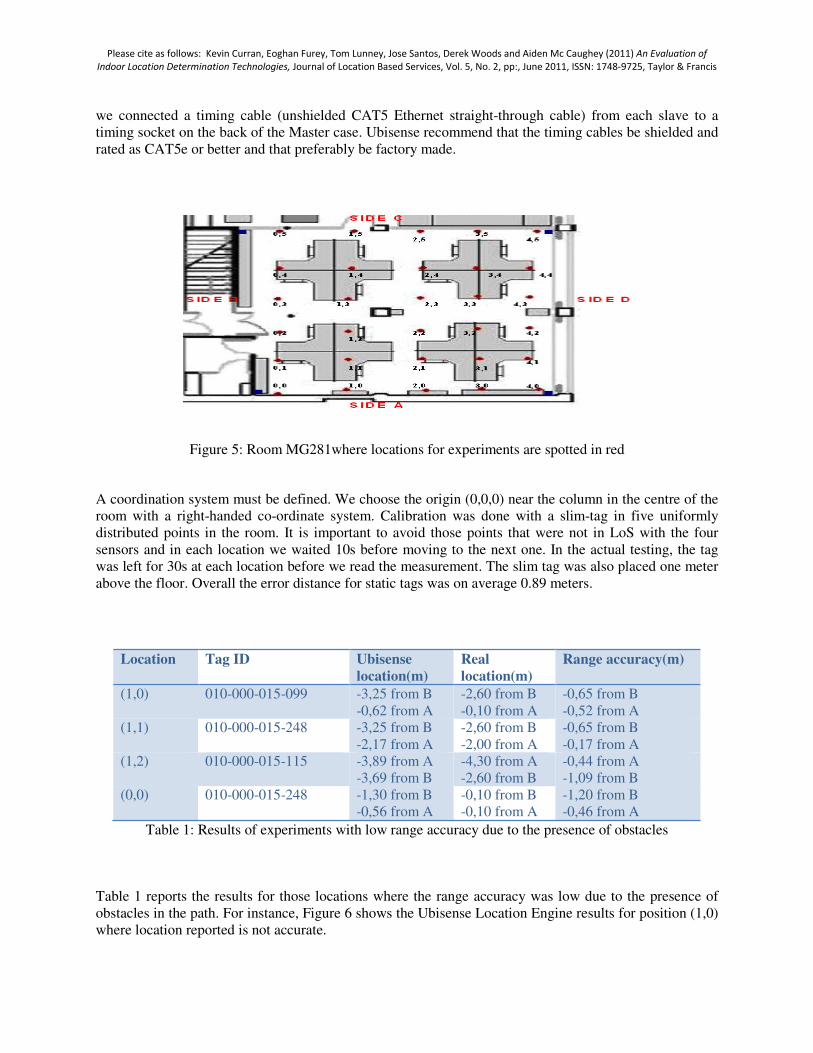
range many times per seconds, the system can plot the path of moving transponders. An example stream,
showing data for multiple tags, is shown in Figure 11.
22:45:08 BCBBB0005 21.78 -19.2 -
22:45:08 BCBBB5002 23.53 -0.5 -
22:45:08 BCBBB0026 24.09 31.6 -
22:45:09 BCBBB0004 39.43 -15.5 -
22:45:09 BCBBB0002 11.73 -3.1 -
22:45:09 BBBBB0000 47.88 8.8 -
22:45:09 BCBBB0027 27.01 -22.1 -
22:45:09 BCBBB0026 24.10 32.4 -
22:45:09 BCBBB0002 11.73 -3.0 -
22:45:09 BCBBB0004 39.43 -16.0 -
22:45:09 BCBBB5002 23.53 -2.1 -
22:45:09 BCBBB0005 21.78 -21.5 -
Figure 11: RFID Radar Screen Output: the columns, from left to right indicate the time of the tag report,
the tag ID, the range of tag in meters and angle of the tag from the reader’s centre-line
We evaluated the base performance of the RFID-radar by comparing the estimated location with the true
location of tags in an indoor scenario. Tags with two orthogonal or nearly-orthogonal antennas, often
known as dual-dipole tags, are much less dependent on orientation and polarization of the reader antenna,
but are larger and more expensive than single-dipole tags. We tested just single-dipole tags, so the
measurements were strictly dependent on their polarization. The antenna was horizontal to the ground and
also the tags had to be horizontal to the ground.
To minimise multipath problems an appropriate indoor test scenario was chosen to test the systems
accuracy and we also verified the performance of the system through the following characteristics. With
regards to the location estimates, we looked for sufficient precision so that the reported position should be
within the range accuracy stated by the maker and systems operation should not interfere with other
systems nor crash in active environments. With regard to tracking performance the tracking system

Please cite as follows: Kevin Curran, Eoghan Furey, Tom Lunney, Jose Santos, Derek Woods and Aiden Mc Caughey (2011) An Evaluation of
Indoor Location Determination Technologies, Journal of Location Based Services, Vol. 5, No. 2, pp:, June 2011, ISSN: 1748-9725, Taylor & Francis
should not make jumps that the tracked object would never perform and the trace of the target on screen
(or in database) should resemble the actual motion of the target. To respect all these constraints, the
experiments were carried out in the first floor of MG building in the Magee Campus of the University of
Ulster, in a room without people but containing office furniture (desks, chairs, bookcases and similar). All
experiments for the RFID radar were carried out in the same lab as the system could not penetrate walls.
Dots on the map in Figure 12 are the calibrated locations.
(2,1)
(0,0)
(2,0)
(0,1) (0,2) (0,3) (0,4) (0,5)
(1,0) (1,3)
(2,2) (2,3)
(1,5) (1,4) (1,1)
(2,4)
(1,2)
(4,0)
(3,0) (3,1)
(4,2) (4,1)
(3,3) (3,2)
(2,5)
(3,4)
(4,4) (4,5)
(3,5)
(4,3)
RADAR
ANTENNA
READER Obstacle1
Obstacle2
Obstacle3 Obstacle4
Obstacle5
Figure 12: Room MG281 with all calibrated locations
One design consideration for the evaluation was how the system would translate positional data from the
RFID-Radar system to a graphical representation shown on our prototype map. The system was
“calibrated” for the area to be monitored by placing a transponder at the far edge of the area and storing
its range information. This “total range,” shown in Figure 13 was then used in calculations to depict the
relative position of transponders to the equipment on the on-screen map. Figure 13 shows the layout of a
simple room to be monitored using the RFID-Radar system.
Total Range / Centre Line
Monitored Area
Transponder
Angle
Range Reading
John Smith
On-Screen Map
Real-World
Tracker
RFID Radar Antenna
Original
Transponder
position for
calibration

Please cite as follows: Kevin Curran, Eoghan Furey, Tom Lunney, Jose Santos, Derek Woods and Aiden Mc Caughey (2011) An Evaluation of
Indoor Location Determination Technologies, Journal of Location Based Services, Vol. 5, No. 2, pp:, June 2011, ISSN: 1748-9725, Taylor & Francis
Figure 13: Tracking a Transponder after Calibration
Figure 14 shows how we translated location data from a transponder onto the map in the GUI. It can be
seen that a transponder’s range and angle reading, together with the centre line, defines a right-angled
triangle. With trigonometric calculations, and the known total range, the triangle could be scaled down so
that the icon depicting the tag will appear on the map in the location corresponding to the real tag’s
location.
6m (Range of Tag)
15°
.
Person with Tag
On-Screen Map
Antenna
Radar System Tag Tracked On Screen
Centre-Line
Figure 14: Overview of System
Each object (person) to be tracked in the tests was assigned an RFID tag containing a unique ID. The
reader in the RFID-Radar system retrieves this ID and calculates the location of the tag. After an unstable
setup phase the tag’s range reports settled on a value near 4m. Once the tag was moved, the “RANGE”
command had to be submitted to the equipment to recalculate the new range, which took an average of 30
seconds. Sometimes the newly-calculated range was inaccurate, e.g. increasing from 4m to 9m when
moving the tag closer to the antenna. The main problem unearthed was that the reader was not able to
report a correct range or a Tag ID for those locations that were not in line of sight (LoS) with the
antennas. LoS is a restrictive requirement since in a typical indoor environment there are lots of obstacles
between the tags and the Antennas. In the room there are some metal obstacles drawn in grey in Figure
12. For static measurements (i.e. objects were not moving), the average error distance of RFID-radar was
found to be 4.19m.
( 2 ,1 )
( 0 ,0 )
( 2 ,0 )
( 0 ,1 ) ( 0 ,2 ) ( 0 ,3 ) ( 0 ,4 ) ( 0 ,5 )
(1 ,0 ) ( 1 ,3 )
( 2 ,2 ) ( 2 ,3 )
( 1 ,5 ) ( 1 ,4 ) ( 1 ,1 )
( 2 ,4 )
( 1 ,2 )
( 4 ,0 )
( 3 ,0 ) ( 3 ,1 )
( 4 ,2 ) ( 4 ,1 )
( 3 ,3 ) ( 3 ,2 )
( 2 ,5 )
( 3 ,4 )
( 4 ,4 ) ( 4 ,5 )
( 3 ,5 )
( 4 ,3 )
A N T E N N A
R E A D E R O b s t a c l e1
O b s t a c l e 2
O b s t a c l e3 O b s t a c l e4
O b s t a c l e5
Figure 15: Locations where RFID-radar failed to locate tags in red (Good spots are in bold green)
Please cite as follows: Kevin Curran, Eoghan Furey, Tom Lunney, Jose Santos, Derek Woods and Aiden Mc Caughey (2011) An Evaluation of
Indoor Location Determination Technologies, Journal of Location Based Services, Vol. 5, No. 2, pp:, June 2011, ISSN: 1748-9725, Taylor & Francis
Figure 15 shows the locations in red where the radar failed to log the tag. The bold lines in green
highlight locations (2,0), (2,1), (2,2), (2,4) and (2,5) where the Radar had good measurements from the
tags. Finally, we tested the ability to track relatively fast moving objects. When the distance of the Tags to
the antenna is small, the accuracy should be high, however when the read range starts increasing, then
uncertainty is introduced into the system. Here we used the single speed Claymore tag.
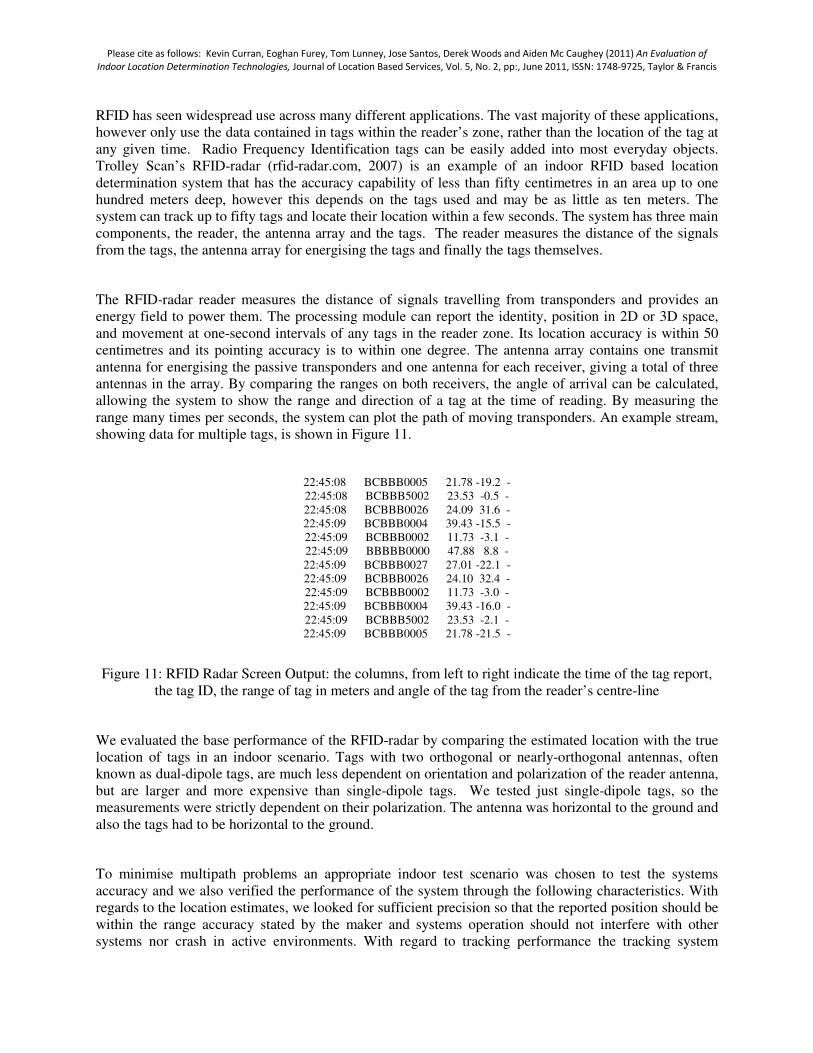
Figure 16: Room MG281 with the test navigation path
The path navigated for tests shown in Figure 16 was traversed at a very slow walking pace. The average
length of each walk was 2 minutes and the sampling rate was 30s. Obstacles caused the reader to lose the
tag thus the accuracy of measurements was poor. We found the radar to require~10-20s to determine the
exact position of tags. We found this seriously limiting and would only recommend for static situations
where transponders are relatively stationary. However, in reality devices to be tracked are not fixed to a
location21
. Here we found the average error distance for slowly moving devices was 10m.
4 Findings
To assess the applicability of the positioning systems evaluated here, a number of metrics were applied
including accuracy and precision, yield and consistency, latency and roll out and operating costs.
Accuracy is concerned with the closeness of position fix to the true position. Precision deals with the
closeness of position fixes to their mean value. Yield is the ability to get position fixes in all environments
and consistency is the stability of the accuracy in different environments. Latency is the time delay
between each position fix and Time To First Fix (TTFF) depends on the type of System used. Indeed, a
high TTFF is often a factor in the popularity of positioning systems with everyday users. Roll out and
operating costs are the costs involved with setting up the infrastructure whilst operating costs depend on
the complexity of the infrastructure (Stantchev et al., 2008).

Please cite as follows: Kevin Curran, Eoghan Furey, Tom Lunney, Jose Santos, Derek Woods and Aiden Mc Caughey (2011) An Evaluation of
Indoor Location Determination Technologies, Journal of Location Based Services, Vol. 5, No. 2, pp:, June 2011, ISSN: 1748-9725, Taylor & Francis
We found that the LA200 system easily allowed logging of time associated with individuals in various
locales over a period. The LA200 also integrated with a smartpass system from Trapeze that allowed
location to be used to control network access. The system was tested in two buildings over a 9 month
period. Straightforward ‘can you see me now’ trail runs were conducted and on average the system could
detect devices to room level 70% of the time. The accuracy was measured at approximately 25 meters.
Overall, the system produced accurate traces provided the initial fingerprints were good. There are a
number of limitations including cost and specialist knowledge needed to integrate the LA200 into existing
enterprise systems, and the system needed rebooting on average every eight weeks.
The ultra wideband based Ubisense system was non-trivial to install. Cables circulated the lab in most
directions along the exterior walls and simply were ‘messy’ and almost a hazard. Of course, if a building
can be developed from the ‘ground up’ then cables can be hidden but there are many scenarios which seek
a location sensing system (e.g. museum, library) where cables have simply got to run along the wall. We
also found that the Ubisense sensors needed to be adjusted using a spirit level to have no roll as sensors
with non-zero roll will exhibit poor performance tracking those tags that are near the edge of their visible
field. We had to recalibrate a number of times as readings were ad hoc on occasions. The associated
software installation was a little more complex than similar systems tested. Obstacles in the room were
also found to interfere with the readings. Latency was low while roll out costs were high.
It was found that the RFID Radar system, even with accurate tag location data, had a delay of nearly a
minute when calculating the location of a new tag that has entered the radar’s field of view, and a similar
delay when updating tag data when the tag had moved. These delays would mean that RFID-Radar would
be impractical for applications that require accurate real-time locations of moving objects or people over
large areas. The RFID-Radar equipment would function best in a large, open environment, with few
obstacles and no interference from other RF devices. Suitable applications may include locating stock in
an open-plan warehouse, or the location of a parked car in a car park. Delays in updating tag positions
would not be critical in these situations, as the tags would most likely be stationary when using the
system.
Ekahau provided the good results for position-sensing using standard WLAN technology. The Ekahau
system was easy to set up and required little work in the fingerprinting phase. It also mapped quite
accurately throughout. The RFID Radar prevailed in some scenarios in which a tag was moving fast but
with good line of sight. The strength of the LA200 lay in the fact that it did not need software on the
clients and it did not require devices to associate with each access point. Only the appearance of a device
in range of an AP was sufficient for detection. Ubisense whilst accurate when in a good line of sight is
cumbersome with the mandatory cabling between sensors and the switch/hub. The installation of a DHCP
server and software was also non-trivial at one particular location. Ubisense we feel is more tailored
towards large open spaces where line of sight is guaranteed and fine-grained location determination is a
necessity. One example would be a factory line. The RFID Radar had a limited range and here again it
would be more suitable to open spaces or niche markets such as tracking items that pass through an
archway.
Finally, it is worth noting that to successfully deploy a positioning systems based on 802.11 WLAN,
some aspects must be considered and planned carefully (Zhou, 2004) such as the number of access points.
At least 3 access points are needed but 5 to 6 access points would be ideal. It is important to note that
more access points do not enhance coverage. In relation to this, the locations of access points should be
strategic. The distance between two adjacent calibrated locations should not be too large ~ 1-2 meters is

Please cite as follows: Kevin Curran, Eoghan Furey, Tom Lunney, Jose Santos, Derek Woods and Aiden Mc Caughey (2011) An Evaluation of
Indoor Location Determination Technologies, Journal of Location Based Services, Vol. 5, No. 2, pp:, June 2011, ISSN: 1748-9725, Taylor & Francis
fine and each location should have enough calibration samples (e.g. 200 to 300 samples). It can be
important to give denser calibration locations to the areas which may be confused with other areas and
finally to ensure that during the calibration/fingerprinting process that one walks slowly, stopping
regularly for up to 30 seconds for increased accuracy (Zhou, 2005).
5 Conclusion
Every location determination technology has its advantages and disadvantages in a number of areas
namely; if they are designed to operate inside or outside, how they determine their position internally or
via a network connection, their cost, their susceptibility to interference and their location determination
accuracy. There is much potential for applying position-sensing technology, for example to enhance
security such as perhaps enforcing limited access areas by alerting security when an unauthorized person
enters a restricted area. It can also monitor and protect objects that should not move without proper
authorization, such as expensive spectrum analyzers or laptops.
In our evaluation, we considered technologies already in use to track PDAs and mobile computers that are
also compatible with the existing standard WLAN infrastructure. We recorded the various stages of a
case study that investigated the use of location determination applications. It presented a comprehensive
investigation into the various RFID, Ultra wideband and Wi-Fi location determination methods and
technologies and their uses and seeks to provide a review of available position- sensing technologies. It
could also be stated that the non-802.11 location tracking systems include ones such as ultra-wideband,
active RFID, ultrasound and other RF-based systems for the most part require installation of proprietary
and single-purpose antennas, and dedicated staff to deploy, manage and maintain. Some of these
technologies such as active RFID, are problematic in certain scenarios because they can introduce
possible interference with Wi-Fi networks and critical patient care equipment. 125 kHz chokepoints have
been banned by many hospitals around the world because they can interfere with clinical equipment in
hospitals and ZigBee can adversely impact a customer’s existing Wi-Fi network that is used for primary
voice and data communications. These aspects are not to be underestimated and may indeed strengthen
the hand of the 802.11 location tracking systems in the future.
Acknowledgements
This research was supported by funding from JA.NET UK. We would like to acknowledge the following individuals
who also performed experiments on the various location tracking systems providing useful data. These individuals
are Annie Cadau, Carmelo Giuffri, Stephen Norrby, Jude McGlinchey, Colm McMenamin, William McDevitt, James
Knox and Robert Woolmore.
References

Please cite as follows: Kevin Curran, Eoghan Furey, Tom Lunney, Jose Santos, Derek Woods and Aiden Mc Caughey (2011) An Evaluation of
Indoor Location Determination Technologies, Journal of Location Based Services, Vol. 5, No. 2, pp:, June 2011, ISSN: 1748-9725, Taylor & Francis
Addlesee, M., Curwen, R., Hodges, S. (2001) Implementing a Sentient Computing System. Computer,
Vol. 34, No. 1, pp: 50-56
Bahl, P., Padmanabhan, V. (2000) RADAR: An In-Building RF-Based User Location and Tracking
System’ Proceedings of IEEE INFOCOM, pp. 775-784 (Tel-Aviv, Israel)
Cooper, A., Mulligan, D., Schulzrinne, H. and Wilde, E. (2010). Challenges for the Location-Aware Web,
Web Science Conference 2010, April 26-27, 2010, Raleigh, NC, USA.
Curran, K., Furey, E. (2007) Pinpointing Users with Location Estimation Techniques and Wi-Fi Hotspot
Technology, International Journal of Network Management, Vol. 16, No. 5, Sept/Oct 2007, pp: , ISSN:
1055-7148, John Wiley & Sons, Ltd.
Curran, K. Hubrich, S. (2009) Optimizing Mobile Phone Self-Location Estimates by Introducing Beacon
Characteristics to the Algorithm. Journal of Location Based Services, Vol. 3, No. 1, pp: , March 2009,
ISSN: 1748-9725, Taylor & Francis
Hazas, M., Scott, J., Krumm, J. (2004) Location-Aware Computing Comes of Age. Computer, 37 (2004)
95-97
Krumm, J., Cermak, G. & Horvitz, E. (2003) ‘RightSPOT: A Novel Sense of Location for a Smart
Personal Object’, Paper presented at the UbiComp 2003. [Available Online at:
http://research.microsoft.com/~jckrumm/Publications%202003/rightSPOT%20publish.pdf]
Krzysztof, K., Hjelm, J. (2006) LBS Applications and Services, CRC Press, ISBN: 0849333490
Li, B., Wang, Y., Lee, H., Dempster, A., Rizos, C. (2005) Method for yielding a database of location
fingerprints in WLAN, IEE Proc.-Commun., Vol. 152, No. 5, pp. 580-586, Oct. 2005.
Nafarieh, A., How, J. (2008) A Testbed for Localizing Wireless LAN Devices Using Received Signal
Strength, Communication Networks and Services Research Conference, 2008. CNSR 2008. 6th Annual ,
vol., no., pp.481-487, 5-8 May 2008
RFID-Radar.com (2007) http://www.rfid-radar.com
Stantchev, V., Schulz, T., Hoang, T., and Ratchinski, I. (2008) Optimizing Clinical Processes with
Position-Sensing, IT Pro, March/April 2008
Steggles, P., & Gschwind, S. (2005) The Ubisense Smart Space Platform. Proceedings of the Third
International Conference on Pervasive Computing, Munich, Germany, May 8-13, 2005, Proceedings
Series: Lecture Notes in Computer Science, Vol. 3468 Gellersen, Hans W.; Want, Roy; Schmidt, Albrecht
(Eds.) 2005, XIII, ISBN: 3-540-26008-0
Zhou, R. (2004): Architecture and Implementation of Indoor Wireless Positioning System (RZ-IWPS),
Master thesis, University of Freiburg, Germany, 2004
Zhou, R. (2005) Final report of Karl-Steinbuch-Scholarship project: Wireless Indoor Tracking System
(WITS). Germany, 2005