Embed Size (px)
Citation preview

Air Force Institute of Technology Air Force Institute of Technology
AFIT Scholar AFIT Scholar
Theses and Dissertations Student Graduate Works
3-2002
An Evaluation of GeoBEST Contingency Beddown Planning An Evaluation of GeoBEST Contingency Beddown Planning
Software Using the Technology Acceptance Model Software Using the Technology Acceptance Model
Shawn J. Jensen
Follow this and additional works at: https://scholar.afit.edu/etd
Part of the Civil Engineering Commons
Recommended Citation Recommended Citation Jensen, Shawn J., "An Evaluation of GeoBEST Contingency Beddown Planning Software Using the Technology Acceptance Model" (2002). Theses and Dissertations. 4426. https://scholar.afit.edu/etd/4426
This Thesis is brought to you for free and open access by the Student Graduate Works at AFIT Scholar. It has been accepted for inclusion in Theses and Dissertations by an authorized administrator of AFIT Scholar. For more information, please contact [email protected].

AN EVALUATION OF GEOBEST CONTINGENCY BEDDOWN PLANNING SOFTWARE USING THE TECHNOLOGY
ACCEPTANCE MODEL
THESIS
Shawn J. Jensen, Captain, USAF
AFIT/GEE/ENV/02M-04
DEPARTMENT OF THE AIR FORCE AIR UNIVERSITY
AIR FORCE INSTITUTE OF TECHNOLOGY
Wright-Patterson Air Force Base, Ohio
APPROVED FOR PUBLIC RELEASE; DISTRIBUTION UNLIMITED.

The views expressed in this thesis are those of the author and do not reflect the official policy or position of the United States Air Force, Department of Defense, or the U. S. Government.

AFIT/GEE/ENV/02M-04
AN EVALUATION OF GEOBEST CONTINGENCY BEDDOWN PLANNING
SOFTWARE USING THE TECHNOLOGY ACCEPTANCE MODEL
THESIS
Presented to the Faculty
Department of Systems and Engineering Management
Graduate School of Engineering and Management
Air Force Institute of Technology
Air University
Air Education and Training Command
In Partial Fulfillment of the Requirements for the
Degree of Master of Science in Engineering and Environmental Management
Shawn J. Jensen, B.S.
Captain, USAF
March 2002
APPROVED FOR PUBLIC RELEASE; DISTRIBUTION UNLIMITED.

AFIT/GEE/ENV/02M-04
AN EVALUATION OF GEOBEST CONTINGENCY BEDDOWN PLANNING
SOFTWARE USING THE TECHNOLOGY ACCEPTANCE MODEL
Shawn J. Jensen, BS Captain, USAF
Approved:
X jtu*z£u^ Heidi S. Brothers, Lt Col, Ph.D., P.E. (Chairman) date
7m 'JX^L. David P. Biros, Lt Col, Ph.D. (Member) date
John D. Schuliger, Capt, M.S. (Member)
Q> MA*. 02-
date

Acknowledgements
I would like to express my sincere appreciation to my faculty advisor, Lt Col
Heidi S. Brothers, for her guidance and support throughout the course of this thesis effort.
Her insight and patience was certainly appreciated. I would also like to thank my
committee members, Lt Col David P. Biros and Capt John D. Schuliger, for their time
and effort in reviewing my thesis work.
I also express my sincere appreciation to my sponsors (Detachment 1, 823 RED
HORSE Squadron; Air Force Civil Engineer Support Agency; and Col Brian Cullis, HAF
Geo Integration Office). I would also like to thank the members of the 325
Communications Squadron for providing me with computer systems and the ACC
GeoBase office for providing me with software and other materials needed to complete
this thesis effort.
Finally, I would like to thank my wife and children. I am incredibly blessed to
have such a wonderful family whose patience, support, and encouragement were essential
throughout this endeavor.
Shawn J. Jensen
IV

Table of Contents
Page
Acknowledgements iv
List of Figures ix
List of Tables xi
Abstract xiiii
I. Introduction 1-1
1.0 Background 1-1 1.1 Problem Statement and Context 1-4 1.2 Research Objectives 1-6 1.3 Methodology 1-6 1.4 Relevance 1-7 1.5 Thesis Overview 1-8
II. Literature Review 2-1
2.0 Introduction 2-1 2.1 Civil Engineer Mission and Responsibilities 2-1 2.2 Beddown Planning 2-2
2.2.1 Beddown Planning Process 2-4 2.2.1.1 Gather the Facts 2-4 2.2.1.2 Draft and Implement the Plan 2-5
2.2.2 Bare Base Deployable Assets 2-6 2.2.3 Beddown Planning Automation 2-8
2.2.3.1 Automated Airbase Contingency Estimator 2-9 2.2.3.2 PlanMaster 2-11
2.3 Geographic Science and Applications 2-13 2.3.1 Gbbal Positioning System 2-13 2.3.2 Remote Sensing 2-14 2.3.3 Geographic Information Systems 2-15 2.3.4 DoD Application of Geographic Information Technology 2-15 2.3.5 GeoBase 2-19 2.3.6 GeoBEST 2-21
2.4 Summary 2-29

Page
III. Methodology 3-1
3.0 Introduction 3-1 3.1 Software Evaluation 3-1
3.1.1 Acceptance Theory 3-2 3.1.1.1 Theory of Reasoned Action 3-2 3.1.1.2 Technology Acceptance Model 3-3 3.1.1.3 Theory of Planned Behavior 3-5 3.1.1.4 Evaluation Method Selection. 3-6
3.2 TAM Implementation. 3-7 3.2.1 Identify Study Group 3-7 3.2.2 Develop Evaluation Plan. 3-9 3.2.3 Design Survey Instruments 3-12
3.2.3.1 Student Initial Survey 3-14 3.2.3.2 Student Follow-Up Survey 3-15 3.2.3.3 Cadre Survey 3-16
3.2.4 Test the Plan 3-17 3.2.5 Overview of Analysis 3-18
3.2.5.1 Reliability Analysis 3-19 3.2.5.2 Factor Analysis 3-19 3.2.5.3 Regression 3-21 3.2.5.4 Analysis of Variance 3-23
3.3 Limitations and Concerns 3-24 3.4 Summary 3-25
IV. Results and Analysis 4-1
4.0 Introduction 4-1 4.1 Researcher's Evaluation of GeoBEST 4-1
4.1.1 Asset Inventory Tracking 4-2 4.1.2 Desktop vs. Laptop 4-2 4.1.3 Resolution 4-3 4.1.4 3D Viewer 4-4 4.1.5 Online Help Files 4-5 4.1.6 Copying and Pasting Assets 4-5 4.1.7 GPS Files 4-6 4.1.8 Map and Report Format 4-7 4.1.9 Pre-Built Scenario Templates 4-7 4.1.10 Closing Scenarios 4-7 4.1.11 Low Inventory Notification 4-8 4.1.12 Scaling Imagery 4-8 4.1.13 Summary of Researcher's Evaluation. 4-9
4.2 Results from Silver Flag 4-9
VI
Page
4.2.1 16Sep01 4-10 4.2.2 14Oct01 4-11 4.2.3 24 Oct 01 4-11 4.2.4 4Nov01 4-11 4.2.5 7Nov01 4-12
4.3 Silver Flag Demographics 4-12 4.4 TAM Analysis 4-15
4.4.1 Reliability Analysis 4-17 4.4.2 Factor Analysis 4-18 4.4.3 Regression 4-19
4.4.3.1 Behavioral Intention 4-20 4.4.3.2 Attitude Towards Using 4-21 4.4.3.3 Perceived Usefulness 4-21 4.4.3.4 Actual Usage 4-21
4.4.4 Analysis of Variance 4-22 4.4.4.1 Air Force Specialty Code 4-22 4.4.4.2 Attitude Towards Computers 4-23 4.4.4.3 Beddown Planning Frequency 4-24 4.4.4.4 Beddown Planning Skill 4-26 4.4.4.5 Introductory Training Quality. 4-27
4.5 Qualitative Feedback 4-31 4.5.1 "Do you have any recommendations for improving the training?" 4-31 4.5.2 "What features of GeoBEST do you like the most?" 4-32 4.5.3 "What features of GeoBEST do you like the least?" 4-32 4.5.4 "What suggestions do you have for future improvements of GeoBEST?" 4-33 4.5.5 "Do you have any additional comments?" 4-33
4.6 Summary 4-34
V. Conclusions 5-1
5.0 Introduction 5-1 5.1 Summary of Research 5-1
5.1.2 Implications for GeoBEST Implementation 5-3 5.1.3 Implications for future use of the TAM 5-4
5.2 Limitations 5-4 5.3 Opportunities for Future Research 5-6 5.4 Final Comments 5-6
Appendix A: Surveys A-l
Appendix B: Student Survey Qualitative Feedback B-1
Appendix C: Cadre Survey Qualitative Feedback C-1
vn

Page
Appendix D: GeoBEST Quick Reference Handout D-l
Appendix E: Silver Flag Student Handout E-l
Bibliography BIB-1
Vita VIT-1
vni

List of Figures
Page
Figure 2-1: Shaikh Isa Air Base, Bahrain 2-2
Figure 2-2: 9-1 Deployable Feeding Facility 2-7
Figure 2-3: TEMPER Tent Erection 2-8
Figure 2-4: Auto ACE 2-10
Figure 2-5: PlanMaster 2-11
Figure 2-6: Global Positioning System 2-14
Figure 2-7: Examples of GIS Application 2-16
Figure 2-8: Pre-CIP Base Information Sharing 2-18
Figure 2-9: Common Installation Picture (CIP) 2-19
Figure 2-10: GeoBase Emergency Response Tool 2-21
Figure 2-11: GeoBEST User Interface 2-22
Figure 2-12: Open GeoBEST Scenario 2-24
Figure 2-13: Metadata Text and Image for MEP-012 Generator 2-26
Figure 2-14: Scenario 3D Viewer 2-27
Figure 2-15: Scheduler 2-29
Figure 3-1: Theory of Reasoned Action 3-3
Figure 3-2: Technology Acceptance Model 3-4
Figure 3-3: Theory of Planned Behavior 3-6
Figure 3-4: Silver Flag Weekly Schedule 3-10
IX

Page
Figure 3-5: Simple Regression. 3-21
Figure 3-6: TAM Relationships 3-23
Figure 4-1: Screen Resolution Problems 4-4
Figure 4-2: 3D Viewer Problems 4-5
Figure 4-3: Service Branch Composition 4-13
Figure 4-4: Enlisted Rank Distribution (USAF only) 4-13
Figure 4-5: Officer Rank Distribution (USAF only) 4-14
Figure 4-6: Student AFSC 4-15
Figure 4-7: Perceived Beddown Planning Frequency 4-25
Figure 4-8: Perceived Personal Beddown Planning Skill 4-26
Figure 4-9: Perceived Quality of GeoBEST Training 4-28
Figure 4-10: Student Preparedness to Use GeoBEST 4-30

List of Tables
Page
Table 4-1: TAM Construct Items 4-16
Table 4-2: TAM Item and Construct Scores 4-17
Table 4-3: Reliability Analysis 4-18
Table 4-4: Factor Analysis Results 4-19
Table 4-5: Multiple Regression Results 4-20
Table 4-6: AFSC Significant Differences 4-23
Table 4-7: Student's attitude towards computers 4-24
Table 4-8: Beddown Planning Frequency Significant Differences 4-25
Table 4-9: Beddown Planning Skill Significant Differences 4-27
Table 4-10: Training Quality Significant Differences 4-29
Table 4-11: Preparedness Significant Differences 4-30
XI

AFIT/GEE/ENV/02M-04
Abstract
GeoBEST (Base Engineer Survey Toolkit) is a software program built under
contract with the USAF. It is designed to simplify the contingency beddown planning
process through application of geographic information technology. The purpose of this
thesis was to thoroughly evaluate GeoBEST using prospective GeoBEST users in a
realistic beddown planning scenario. The Technology Acceptance Model (TAM) was
applied, which measures a prospective user's perceptions of the technology's usefulness
and ease-of-use and predicts their intentions to use the software in the future. The
evaluation also included a qualitative evaluation of specific software features.
The test group for this thesis was seventy-one Civil Engineering students
attending contingency skills training at the Silver Flag training site, Tyndall AFB, FL.
The students were given a one-hour interactive demonstration of GeoBEST after which
they completed a survey. The students were given the option of using the program for
preparation of their assigned beddown plan. Some Silver Flag instructors also completed
a separate survey.
The results from the TAM predict that the students were only slightly likely to use
GeoBEST for beddown planning in the future. Throughout the course of the research,
several features of GeoBEST were identified that limit the program's effectiveness.
Some of these were minor irritants, while others were serious design flaws.
Recommendations are made for implementation of GeoBEST and creation of training
programs for prospective users.
Xll

AN EVALUATION OF GEOBEST CONTINGENCY BEDDOWN PLANNING
SOFTWARE USING THE TECHNOLOGY ACCEPTANCE MODEL
I. Introduction
1.0 Background
The primary mission of the Air Force Civil Engineer (CE) community is to
"provide, operate, maintain, restore, and protect the installations, infrastructure, facilities,
housing, and environment necessary to support air and space forces having global reach
and power, across the range of military operations." (18) CE duties can be divided into
two main categories: peacetime and contingency. Peacetime duties encompass routine,
day-to-day tasks required to construct and maintain facilities and infrastructure of
established USAF permanent installations. When CE personnel are required to deploy
for combat or humanitarian reasons, the contingency skills are utilized. Deployment to
underdeveloped foreign countries or other austere locations under less than ideal
conditions is the norm. Often, the deployment location is a "bare base."
With growing reluctance on the part of many third world nations to allow establishment of foreign military bases on their soil, a 'bare base' concept has emerged as a viable solution to a difficult problem - peacetime planning for contingency situations. A bare base, by definition, is a site with a usable runway, taxiway, parking areas and a source of water that can be made potable. It must be capable of supporting assigned aircraft, and providing other mission essential resources such as logistical support and services infrastructure composed of people, facilities, equipment, and supplies. This bare base concept requires mobile facilities, utilities, and support equipment that can be rapidly depbyed and installed, and be
1-1

available to transform - virtually overnight - undeveloped real estate into an operational air base. (15)
This ambitious mobility concept presents problems and challenges to engineers
and planners who have the ultimate responsibility of bare base development (17). Prior
to actually deploying, CE planners, with input from other functional experts, produce a
plan for "beddown" of the deploying personnel and equipment. Beddown is a highly
complex process that includes numerous tasks such as erecting facilities for housing and
feeding personnel, providing access to utilities, and construction of work areas. The level
of complexity is dependent on many things including the availability and accuracy of
information on existing facilities or utilities at the site. As stated previously, the only
requirements to meet the criteria of a bare base are a useable airfield and access to a
water source that can be made potable. The remaining requirements must be met using
either locally available materials and services or packaged deployable equipment
(discussed in detail in section 2.2.2). When planning for beddown, the planner must
consider numerous factors such as the bare base location, the physical and cultural
climate, threat levels, and the needs of the deploying units. The beddown plan is a
comprehensive package that includes maps of facility and utility locations, logistics
details, preliminary construction schedules, and other pertinent information about the
location. It contains the who, what, when, where, and how of the transition from home
station to the deployment site. Beddown planning can occur at two levels. Base level
planners develop plans that accommodate their own organization (typically a wing) for
locations that they are deploying to or expect to deploy to in the future. Higher
headquarters planners (typically a Major Command or Unified Command air component)
1-2

develop more generic plans for multiple sites within their Area of Responsibility (AOR).
Planning is classified as either contingency (for imminent deployment) or deliberate (for
possible future deployment).
The primary guidance for beddown planning is found in Air Force Pamphlet 10-
219 Vol. 5, and the Air Force Handbook 10-222 series. These publications contain
detailed information about deployable equipment and facilities, planning factors (ie.
requirement estimates based on number of personnel or aircraft such as gallons of water
per person), and steps to guide the beddown planning process. Historically, beddown
planners have used calculators and drafting tools to develop a plan to accommodate
deploying assets and personnel in accordance with the planning factors and siting
standards (requirements for facility locations). As new technologies matured,
innovations such as Computer Aided Drafting (CAD) and satellite photography have
increased the accuracy and consistency in beddown plans. In recent years, computer
programmers have taken advantage of spreadsheet and database software to produce
programs that automate the beddown planning process. A software program called
GeoBEST (Base Engineering Survey Toolkit) is being prepared for employment Air
Force wide. GeoBEST is a software program designed to facilitate the contingency
beddown planning process through the application of geographic information technology.
According to the manufacturer, BTG Delta Research Division (BTG-DRD), GeoBEST
allows the planner to actually "build a base" with a computer before deploying. This
concept of pre-building a base is claimed by BTG-DRD to provide faster response time in
the development of base layout plans for the deployment personnel, equipment, and
support facilities. GeoBEST is designed to give the user the ability to view the spatial
1-3
(physical) domain of a real-world site using available photos, maps or digital images.
The planner can then site and match the resources to be deployed with appropriate
locations in a configuration that conforms to established standards (10).
GeoBEST is an integral part of the GeoBase concept (see section 2.3.5). In the
early 1990's, a thorough study was conducted to examine the use of Geographic
Information Systems on DoD installations. Two conclusions were drawn from this study:
(a) all users within the "battlespace infosphere" have a need for geographic information
resources to accomplish their mission effectively and efficiently, and (b) the optimal
solution would be to establish a common geographic information framework to improve
intercommunication and to maximize the return on its geographic investment (9:12).
This common geographic information framework is referred to as the Common
Installation Picture, or CIP (see section 2.3.4). In 1998, representatives from the
Communications and Civil Engineering community met to discuss methods for better
sharing of geographic information resources to make the CIP a reality. The outcome of
this and many other meetings was the GeoBase initiative (see section 2.3.5) (39).
GeoBase represents a bold paradigm shift in the way the Air Force shares information.
When the Air Force deploys, a portion of GeoBase deploys with it in a package called
GeoReach. GeoReach is a virtual toolkit of geographic analysis and development tools
that includes GeoBEST.
1.1 Problem Statement and Context
GeoBEST is currently in the re-engineering phase. A final version is expected to
be released in 2002. When GeoBEST is fielded, how will it be received? Is GeoBEST
1-4

easy to use? Is it useful? Will contingency beddown planners see increased capability
and productivity through use of GeoBEST? Will deploying organizations see improved
mission capability when using plans created using GeoBEST? Prior to implementation, a
rigorous evaluation of GeoBEST in a realistic beddown scenario is needed.
In September 2000, the Joint Expeditionary Forces Experiment (JEFX 2000) was
held "to provide the Air Force a vehicle for experimentation with operational concepts
and attendant technologies for enhancing capabilities of the 21st century Expeditionary
Aerospace Force." (1) The primary focus of the experiment was 45 initiatives (36
technologies and 9 processes) selected for critical assessment. The CE participants
employed two technology packages, JWARN and GeoReach. The JWARN (Joint
Warning and Reporting Network) suite of software provides deployed forces with an
integrated, comprehensive analysis and reporting tool designed to mitigate the effects of
Nuclear, Biological, or Chemical attacks. The GeoReach suite of software is built on
ESRI™ Arc View 3.2, a widely used, commercial off-the-shelf Geographic Information
System, or GIS (see section 2.3.3). It includes the Contingency Aircraft Parking Planner
(CAPP) and GeoBEST. During the experiment, several simulated contingency locations
were "built" using GeoBEST and CAPP in scenarios similar to what might be seen at the
higher headquarters planning level. The evaluation team consisted of five CE personnel,
three officers and two NCO's. Their rank and experience were typical of what is
expected at the higher headquarters planning level (50). Overall, GeoBEST was well
received by the users and received high marks for its value, validity, and capabilities.
Users also provided some recommendations focused on specific design features they felt
were deficient. Some major areas of concern were the ability to share files between
1-5

different workstations, the lack of pre-fabricated standard facility layout templates, some
specific software problems, and inadequate Help sections (1). BTG-DRD was provided
these results and plans have been made to address deficiencies in the next release of
GeoBEST, due in early 2002 (51).
GeoBEST is now ready for further analysis and evaluation before it is
implemented Air Force wide. JEFX provided a thorough analysis of GeoBEST, but was
insufficient for a complete analysis. The reasons for this are threefold: (a) the sample
size of CE planners, five personnel, is very small compared to standard sample sizes
needed for thorough experimentation, (b) the level of experience of the JEFX team,
higher-headquarters staff, is representative of only one side of the two bodies of beddown
planners expected to use GeoReach tools, and (c) the JEFX evaluation, though valuable,
did not include consideration of acceptance theory.
1.2 Research Objectives
The objective of this research effort is to conduct a thorough analysis of
GeoBEST in a realistic contingency beddown planning scenario using a large sample of
base level CE officers and EA's. The results will be in the form of statistical output
derived from a proven theoretical model used to predict future usage of new information
technology, as well as specific user-provided recommendations for improvements.
1.3 Methodology
The first step in evaluating a software package such as GeoBEST is to gain a full
and complete understanding of its capabilities and limitations. Through available training
1-6

and trial and error, the researcher must become an expert GeoBEST user. A study group
is then identified who meet the criteria for the evaluation. The Silver Flag training site on
Tyndall AFB, FL provides week-long contingency training courses for base level CE
personnel. The managing personnel (Detachment 1, 823rd RED HORSE Squadron)
agreed to allow four separate classes to participate in this research, with additional
support provided by the Air Force Civil Engineer Support Agency (AFCESA).
Standardized surveys based on a conceptual model called the Technology Acceptance
Model (13) will be used to gauge the participant's reaction to the software via a series of
questions designed to measure the user's perceived ease of use and perceived usefulness
of new information technology (IT). These two variables are have been found to be an
accurate predictor of intentions to actually use new IT systems (13). Additional questions
in the surveys will call for further suggestions and recommendations on specific problems
encountered while using the program. These results will then be compiled and forwarded
to the contractor and the appropriate AF offices for future integration and modification of
GeoBEST. The Silver Flag leadership, AFCESA, and the HAF Geo Integration Office
will be provided copies of the results to aid in future integration of GeoBEST into
training programs and CE operations.
1.4 Relevance
Air Force Vision 2020 states "We will continue exploring both science and
technology and operational concepts, identifying those ideas that offer potential for
evolutionary or revolutionary increases in capability. We'll test those ideas rigorously
through experimentation to determine which have practical application worthy of
1-7
development." (43:6) GeoBEST is one of these revolutionary concepts. The initial
beneficiaries of GeoBEST improvement will be the Civil Engineer beddown planners.
Improvement of GeoBEST leads to added strength of the GeoReach program, which in
turn adds strength and validity to the overall GeoBase concept. Although GeoBase is
now primarily a USAF initiative, considerable interest has been expressed for DoD-wide
integration (9). All military organizations, regardless of their function, can reap the
benefits of consolidated geospatial information sharing.
1.5 Thesis Overview
The remainder of this thesis is divided into the following four chapters: literature
review, methodology, results and analysis, and conclusions. Chapter 2 presents
information on beddown planning methods and procedures, beddown planning software,
geographic information systems, and the GeoBase technologies, including GeoReach and
GeoBEST. Chapter 3 outlines methods for evaluating IT, a review of acceptance theory,
and the procedures used to create and then implement the data-gathering plan for this
research effort. Chapter 4 contains the results of the surveys and output from the
Technology Acceptance Model. Chapter 5 provides a summary, outlines
recommendations for the future of GeoBEST, lists the shortcomings and limitations of
this work, and describes areas for future research.
1-S

II. Literature Review
2.0 Introduction
The literature review contains detailed information on topics that are relevant to
this research effort. The following subjects are discussed: Civil Engineer mission and
responsibilities; beddown planning; geographic science and applications; DOD
application of geographic science; the GeoBase concept; and a thorough description of
GeoBEST.
2.1 Civil Engineer Mission and Responsibilities
The Air Force Civil Engineer community is guided by the CE mission statement:
"Provide, operate, maintain, restore, and protect the installations, infrastructure, facilities,
housing, and environment necessary to support air and space forces having global reach
and power, across the range of military operations." (18) Civil engineers have always
played an integral role in preparing and maintaining air bases. Over the years, civil
engineers have:
Developed, sustained, and recovered wartime air bases Planned, designed, and constructed air bases Operated and maintained the air base infrastructure Protected the environment Rescued aircrews and protected resources from fire Acquired and fielded new systems and equipment Developed and maintained housing communities Assisted local communities through civic action programs (42)
The civil engineering skill of interest in this research is contingency air base
planning and deve lopment, also know as "beddown" planning. The following section
will discuss this concept in more detail.
2-1

2.2 Beddown Planning
During war or other contingencies, U.S. forces may be required to operate from
several types of installations. These could include main operating bases, collocated
operating bases, standby bases, forward operating locations, and bare bases. Some of
these types, such as the main operating base, may be substantially developed, whereas
others, such as bare bases, may be quite austere from an infrastructure perspective.
Figure 2-1 is an example of a bare base developed with expedient deployable assets at
Shaikh Isa Air Base, Bahrain during Operation Desert Storm. The rows of facilities are
standard 8-10 man fabric-wall shelters used primarily to house deployed troops called
TEMPER tents.
■-c - * ♦■•
L3L*~-!
Figure 2-1: Shaikh Isa Air Base, Bahrain (48)
The development of such a bare base is a highly complex process requiring
extensive planning.
2-2

Since facilities for use by US forces are limited to non-existent at bare bases, beddown of deploying forces requires a more extensive effort from civil engineers. With the exception of the runway, parking areas, and a nearby source of water, civil engineers may have to start from scratch to provide basic services. A tent city, or suitable substitute, must be erected to shelter deployed forces. Basic utilities (including water, electricity, heat, sanitation) and other services must be established. Aircraft parking areas may need to be expanded, revetments constructed, POL [Petroleum Oil Lubricant] facilities developed, aircraft shelters and maintenance shops erected, and the runway modified or repaired. (16:34)
Planning for deployment can span a range of complexity, from a simple unit-level
field exercise, to the enormous logistical and support requirements of Desert Storm.
Regardless of how extensively any location has been developed, it must meet one basic
criterion—can it support the wartime and contingency missions adequately? Beddown
planning addresses a process, which can be used to determine base infrastructure
requirements predicated on these wartime mission needs. This serves as a way of
ensuring all facility and utility requirements are identified, major siting considerations are
considered early, and key survivability and operational features are addressed (17:13).
Under ideal conditions, beddown plans which support operations plans (OPLANs)
are accomplished in peacetime by the gaining major command (MAJCOM) or a
subordinate unit and documented in the OPLAN, a base support plan (BSP), or a joint
support plan (JSP). The level of detail and quality in these plans varies. For short notice
deployments and post-disaster support, there may be no time for advance planning. Civil
engineers are faced with making an existing plan work or developing a new plan
expediently. Whether a plan exists or not, on-site civil engineers must provide site
information sufficient to begin the beddown process. They must be able to develop
requirements, sort out beddown priorities to get the critical efforts started quickly, and
then site, layout, and erect or modify the facilities and utility systems (16:33). Regardless
2-3

of the level of detail needed for any particular plan, the process of developing it remains
the same.
2.2.1 Beddown Planning Process
Beddown planning includes understanding what facilities and utility services
incoming units need to perform their mission, finding out what resources are available to
satisfy those needs, and then using common sense and available AF guidance to site the
facilities and develop solutions to the inevitable problems. The following steps for
thorough beddown planning are presented in a logical order, but in situations where time
is limited, many events will occur simultaneously. The basic steps are (a) gather the
facts, and (b) draft and implement the plan (16:35). Several iterations of the plan may be
required before final approval is given. These steps are discussed in more detail in the
following sections.
2.2.1.1 Gather the Facts
Beddown planners need to gather and digest a large quantity of information in a
short amount of time to develop a good plan. At a minimum, an effective planner should:
• Understand the mission and OPLAN requirements. Find out exactly who is deploying along with their physical and functional requirements. Planning factors (e.g. 50 gallons of water per person per day; see section 2.2.3) will work for most typical deployments, but always be aware of and plan to accommodate special needs.
• Know the threat conditions. Understand the capabilities and as much of the enemy's intentions as possible. For example, if the enemy has the capability of attacking with chemical or biological weapons, there are special facility and personnel requirements to meet these threats.
• Learn the details of any previous planning. There is a high probability that plans have been developed for deployment to the same location at a previous time. Some level of planning may have already been accomplished. Take immediate advantage of any opportunity to save time.
2-4

• Gather site geographic data including maps, weather, flood data, etc. Be aware that actual conditions at the site may be drastically different from what is represented in the materials. One of the keys to successful beddown planning is flexibility.
• Find out what facilities and utilities are currently available at the site and their condition. Again, information is only as good as its currency. Facilities that may have been in "good" condition two years ago maybe unusable now.
• Determine sources for materials and equipment. The Air Force's inventory of deployable assets (see section 2.2.2) can accommodate most facility and utility requirements for short-notice deployments. Determine which of these assets are available and when they will be transported to the site.
• Learn the commander's priorities. The planners are the functional beddown experts, but prioritization must be coordinated with and approved by higher leadership. Often other branches of service are involved with deployments for contingencies. If this is the case, coordination with the other unit commander(s) must be included in the planning process (16:35).
2.2.1.2 Draft and Implement the Plan
A beddown plan should tell where the deploying units will be located and what
must be done to make existing or expedient facilities ready for them. The plan should
include a detailed task list and a prioritized scheduled for completing them. Essential to a
quality plan is detailed site maps and facility layouts. The decision makers (typically
wing or group commanders) must be able to "see" what is being presented. After
approval of the final draft, the plan is distributed to all interested parties for
implementation (16:36).
Once the plan is finalized, the actual deployment phase begins. Typically, a small
AD VON (advance echelon) team is sent to the deployment location ahead of the main
body to ensure the site is secure and to note any existing conditions that may not have
been accounted for in the plan. This team will also begin preparing the site for the large
quantities of personnel and equipment scheduled to arrive soon. Deployment to austere
locations with limited resources is the norm. This requires the use of mobile facilities,
2-5

Utilities, and support equipment that can be rapidly deployed and installed to transform
the site into an operational air base.
2.2.2 Bare Base Deployable Assets
In the 1950's, military planners developed techniques to prepackage base support
equipment. This consisted mainly of tents, field kitchens, medical facilities, power
generators, cots, desks, and other equipment. The equipment was bulky, heavy, and
required excessive manhours to position and erect. In the 1960's, more equipment was
added to the package and some of it was redesigned to make it air-transportable. A new
concept for mobility was later developed under which all facilities and equipment would
be lightweight, modular, and transportable on a C-130 Hercules cargo aircraft. In the
early 1980's, the Air Force purchased a mixture of soft and hard-wall shelters, and
eliminated several types of facilities from the inventory that had proven to be
maintenance intensive. This new mobile equipment package included several new
components including vehicles, engineer equipment, communications gear, medical
facilities, unique tactical shelters, and flightline maintenance equipment (17:9).
These new mobile equipment packages were divided into two main groups.
Harvest Falcon and Harvest Eagle are the Air Force's primary bare base equipment
programs. Harvest Falcon provides complete facilities for long-duration bare base flying
and support operations. They are intended for use in Southwest Asia, but may be
deployed to any theater if required. The Harvest Falcon assets may be deployed
individually or in one of four pre-packaged equipment sets. The 1100-person
Housekeeping Set contains all of the assets necessary to beddown a deploying unit of up
2-6

to 1100 personnel. It contains living quarters, air conditioning units, generators, a
kitchen, field laundry, latrines and showers, and some work facilities. The Industrial
Operations Set contains base support facilities that enable the base to support itself. It
includes additional facilities such as hard wall shelters for use by engineering, supply,
maintenance, and several other functions. The Initial Flightline set provides maintenance
and operational support facilities with associated utilities for one aircraft squadron. The
Follow-on Flightline Set is required for each additional aircraft squadron that is deployed
to the same location. Figure 2-2 shows personnel from Ellsworth AFB, South Dakota
preparing meals for deployed troops supporting a multi-nation exercise in Egypt. The
facility is the Harvest Falcon 9-1 deployable dining facility. The food services team fed
1,100 military personnel three hot meals daily (23).
Figure 2-2: 9-1 Deployable Feeding Facility (23)
Harvest Eagle mobile equipment packages provide facilities for bare base living
and working or for supporting additional personnel at an existing location, but do not
provide many flightline support assets. They are intended for use in Europe or the
2-7

Pacific, but may be deployed to any theater if required. Harvest Eagle assets may also be
deployed individually or in one of three sets. The 550-person Housekeeping Set, a
Utilities Set, and a Cold Weather Set. (47:3) Figure 2-3 shows personnel from RAF
Lakenheath, United Kingdom erecting Harvest Eagle TEMPER tents (personnel housing)
in preparation for a NATO operation in Yugoslavia (3).
Figure 2-3: TEMPER Tent Erection (3)
With the acquisition and integration of the Harvest Falcon and Eagle mobile
equipment sets, the beddown planning process has evolved to accommodate these
changes. The following section discusses some recent applications of information
technology that have helped to automate the beddown planning process.
2.2.3 Beddown Planning Automation
The beddown planning process is heavily dependent on calculations and estimates
derived from planning factors. For example, when estimating electrical requirements, the
2-8

planner multiplies the number of personnel at the location by the planning factor, 2.7
kilowatts per person (17:191). This lets the electricians know the number and type of
generators needed to meet the requirement and it will also drive other requirements such
as fuel and personnel to set up and maintain the equipment. Similar planning factors are
available for other utility estimates, facility square footage, aircraft parking, covered
storage, and many others. Historically, the beddown plan was created using these basic
planning factors, drafting tools, and whatever paper maps or photographs were available.
This has become known as the "stubby-pencil" method. The advent of electronic
calculators, computers, and Computer Aided Drafting (CAD) software allowed for faster
calculations and more accurate maps. In recent years, computer programmers have taken
advantage of spreadsheet and database software to produce programs that automate the
beddown planning process. Two examples discussed here are the Automated Airbase
Contingency Estimator (AutoACE), and Air Force Bare Base PlanMaster. The focus of
this research, GeoBEST, will be discussed in section 2.3.6.
2.2.3.1 Automated Airbase Contingency Estimator
In the mid-1990's, five CE officers from Barksdale AFB, Louisiana and
Holloman AFB, New Mexico combined their knowledge of beddown planning methods
and spreadsheet software to produce the Automated Airbase Contingency Estimator, or
AutoACE (33). Figure 2-4 is a Screenshot of AutoACE in use. This screen is used to
calculate the number of CE personnel required to complete the beddown tasks indicated
in other parts of the program. Other screens are used to enter basic information about the
2-9

location, the number and type of aircraft expected at the location, materials required to
complete necessary construction, and several others.
i If .if i Ibijijrt Kfei
I m-j
I I.--I llil .;
til
It -1
1nä-«f«t£if*y AmmlmU i id >i. iJ ■ . k 'j. i ■ ,i
Figure 2-4: AutoACE
Created in Microsoft™ Excel, AutoACE is based on planning factors and other
guidance found in AFPAM 10-219 and AFH 10-222. It consists of thirteen formatted
worksheets for calculating airfield, facility, utility, and personnel requirements. It also
contains information about deployable assets (Harvest Falcon and Harvest Eagle) and Air
Force aircraft (dimensions, weight, etc.). AutoACE allows the user to interactively select
desired facilities and utilities. If the requirements entered into AutoACE cannot be met
using indicated personnel and equipment, the program notifies the user to order more
assets and recalculates the timeline. To enhance user-friendliness, the program uses a
standardized color scheme. All user input areas are shaded yellow. AutoACE is a
2-10

capable program for performing calculations and determining requirements, but it
currently has no capability for viewing, creating, or modifying maps or drawings.
2.2.3.2 PlanMaster
In 1997, under contract with the USAF, Decision Dynamics, Inc. released a beta
version of their bare base planning program called PlanMaster (14). Figure 2-5 shows a
Screenshot of PlanMaster in use. This particular screen is used to calculate the effects of
climate factors, fatigue, and morale on personnel effectiveness. Other screens are used to
input specific beddown information and to calculate required personnel and equipment.
_t_ ; !
Plan Edit Tabs Help
i; Pioductivity Formula
E:-äf-rE:-aT-r LOiVH'.irNüri .b'TllviN-r: rri-äy br -bd vrt.-rl',' alle'l'ed t",'hal.l'i diriia'ir ditM'l'.il1'ettaifi ];.-.•• n\r H'ilrb'' bhd "Ol prl" Ofifi-rl rnOI blr F1.1Hh.rl la'igue ■:-3'.i.'rd by lor ig hour: 'Ian trd'Xr pro- ductivity to a percentage of equivalent manhours. i
; Foin-iiilö :
F-l-äi.r ,ed ■■■■.:.rl ■.-■-■eel Hi ffl MH
"".-■.•■"oil [.'-avAveel K [fJC'-ay:
\ Thieat Factoi Productivity Loss: \0 [wH
Threat Level: jNone Factor: |1
Climate Factor
Prod. Loss: jQ
Factor: |1 Lliriial-r
C'iv Heat
"S* Tenain Factoi
Prod. Loss: !Q
Factor: 11
\ Trliaiii
®
Fatigue Factoi F'lodiKll-ily li
w 1201
Pl-jflflMi
Moiale Factoi Productivity:
2Ü-- _ 1::- 5 1.6 ü 1 4-
ID 1.0 Tn 'i:': ". '.", X '.4 "-
0.0
™ -n
F'läiiiieiJ '.'.'.:.it [' iy
IJ-.-^fvnr^ F-r.;..jii.: h--it-.- o
HW. F,r.:.d..i(ir--iiyF.b.:l.:.r n:;:::
Figure 2-5: PlanMaster
2-11

The PlanMaster user interface is designed to appear and function like a notebook.
To create a new bare base plan, the user makes selections to define mission and location
profiles. The user identifies the number and type of aircraft to be supported by the base.
Development of a location is enhanced by the selection of built-in climate and terrain
options. Settings for the anticipated threat level are used to assess construction priorities
and facility hardening requirements. PlanMaster allows the user to select facilities
required for the bare base site from pre-defined deployable asset sets. Using the
planner's input, the program uploads the relevant database information and generates a
customized construction management plan. The program includes three generic base
layout maps with basic facility and utility locations, but does not allow for modification
of these maps or creation of new maps. Literature accompanying the program indicates
that future versions of PlanMaster will include this capability. As of this writing, no
follow-on funding has been provided to the contractor for further development of
PlanMaster (14).
As exhibited by AutoACE and PlanMaster, the ability to make calculations and
develop timelines for beddown planning has been aided by use of computer information
technology. However, neither program includes the ability to create or view maps of the
beddown location. This must be accomplished using other means. The methods range
from "stubby pencil" drawing of assets on a paper map to the use of more sophisticated
drafting software programs and geographic technologies. The following section
discusses basic geographic science, some specific innovations in the field, and how these
advances have been applied to the military in general and more specifically to the field of
beddown planning.
2-12

2.3 Geographie Science and Applications
The geographic discipline focuses on emphasizing the "where" in describing
events or conditions. Roughly 80% of all information has a geographic basis. The earth
offers a single frame of reference allowing the geographer to fix any given occurrence to
a single location and then study spatial (physical) relationships. The surge in modern
computing capabilities has catapulted the geographic discipline forward by enabling rapid
collection and analysis of massive data stores to reveal hidden patterns. Three specific
innovations have together served as the key components of this geographic revolution:
the Global Positioning System (GPS), remote sensing, and Geographic Information
Systems (GIS) (9:4).
2.3.1 Global Positioning System
Trying to figure out where you are and where you're going is one of man's oldest
pastimes. Navigation and positioning are crucial to so many activities and yet the process
has always been quite cumbersome. As the need for greater and greater weapons
delivery accuracy increased, the U.S. Department of Defense recognized the need for a
global targeting system. The result is the Global Positioning System (GPS) (41). GPS is
made possible by a system of 24 orbiting satellites and earth-bound receiving devices
used to compute positions on the earth (24). Figure 2-6 is a diagram of how three
satellites are used to "triangulate" a location on the earth's surface and some of the gear
used to receive signals from the satellites and process GPS data.
2-13

\S.
"€"
Figure 2-6: Global Positioning System (41)
With commercially available hand-held receivers, users worldwide can now
easily pinpoint locations on the earth's surface to within a few meters (latitude, longitude,
and altitude). GPS receivers have been miniaturized to just a few integrated circuits and
are becoming very economical, making the technology available to virtually everyone.
The value of GPS, however, is enhanced greatly when used together with high-resolution
imagery now provided by advances in the field of remote sensing (9:4).
2.3.2 Remote Sensing
Remote sensing, in its most basic form, is acquiring information about an object
without contacting it physically (24). The human eye is a perfect example. It continually
gathers information from surroundings objects with any physical contact. To the
geographer, remote sensing usually refers to the technology of acquiring information
about the earth's surface (land and ocean) and atmosphere using sensors onboard airborne
(aircraft, balloons) or spaceborne (satellites, spacecraft) platforms (34). Commercially
available imaging technology has now replaced analog photography with a digital
2-14

process permitting discrete analysis of images acquired at incredible distances. Today,
airborne commercial sensors collect imagery with less than one-meter resolution across
the visible, infrared, and microwave regions of the electromagnetic spectrum. The recent
advances in both GPS and remote sensing are put to their most effective use when
integrated with modern Geographic Information Systems (9:5).
2.3.3 Geographic Information Systems
"GIS is a system of computer software, hardware, data, and personnel to help
manipulate, analyze, and present information that is tied to a spatial (physical) location."
(49) In the strictest sense, GIS is a computer system capable of assembling, storing,
manipulating, and displaying geographically referenced information, i.e. data identified
according to their locations. Many also regard the total GIS as including operating
personnel and the data that go into the system (23). Figure 2-7 contains two simple
graphical representations of a Geographic Information System and some of its
applications. The real world is divided into meaningful "layers" to sort and organize
spatial information.
2.3.4 DoD Application of Geographic Information Technology
Within the DoD, the initial wave of GPS, remote sensing, and GIS investment
came from the ranks of civil engineers and environmental managers for use in creating
base maps, managing weapons ranges, plotting groundwater pollution contours, and
several other applications. The promise of tremendous mission benefits from geospatial
information technology spurred countless defense installations to invest heavily in these
2-15

technologies in the late 1980's. However, virtually no attention was given to sharing this
information across the installation (9:10).
< f * p v ..gef* ^5'
an
it«"1
I!* ill Is
^"^^t^^^*^ ^^^^C
fc^i ,-_. f. -'.!. '■ ._".
y^jjsitgpjts
River
i« -i ^~ . Discharge Sand and Gravel Sanrfstone Point Water Table Aquifer
Shale I
Figure 2-7: Examples of GIS Application (49)
Sharing geographic information across the installation has many potential
benefits. At the base level, reports of information mishaps are plentiful. For example, a
civil engineering unit spends thousands of dollars building a new parking lot, but before
the stripes are painted, a communications contractor trenches through the asphalt to lay
fiber optic cable. At another site, four separate GIS initiatives are pursued within the
same wing to support environmental, natural resources, civil engineer, and weapons
safety missions. At another site, a contracted backhoe operator discovers too late where a
new natural gas line was laid due to a lack of accurate maps (9:11).
2-16

In 1992, the DoD sponsored a three-year study of geographic information
technology adoption on defense installations, visiting over 50 sites. The following are
two of the conclusions resulting from this study: (a) all users within the "battlespace
infosphere" have a need for georeferenced information to accomplish their tasks in the
most efficient and effective manner; and (b) the optimum solution would be to establish a
common geospatial framework for all warfighters so the defense department can improve
intercommunication and maximize the return on its GIS investment (9:12). The common
geospatial framework would result in a concept called the Common Installation Picture,
or CIP. The CIP is proposed to be an effective means of abating the situational confusion
at the base level. Currently, each functional unit collects data relevant to its mission
tasks. They filter their data through their individual geographic reference framework, and
commanders are left with a poor understanding of the aggregated mission situation. This
situation is illustrated in Figure 2-8. The eleven organizations shown represent the
dozens of functional areas found at any given installation. Information is filtered through
independent reference frameworks, resulting in situational knowledge significant to that
particular organization. When the filtered information is funneled up the chain of
command, the result is a conglomeration of inputs that produces a usable, although
obscure and limited decision environment.
2-17

Individual Reference Framework
Functional Situational Knowledge
Lack of Integrated Situational Knowledge
Obscure Decision
Environment
Civil Engineering
Security Forces
Services :
Munitions
Mobility
Maintenance iss
Legal ■
Transportation :
Environmental c
Safety
Communications
Figure 2-8: Pre-CIP Base Information Sharing (9:17)
A common reference framework consolidates the various functional data and
provides this essential aggregated mission situation thereby producing the Common
Installation Picture, as illustrated in Figure 2-9. Decision makers are provided with a
clear, aggregated view of the decision environment (9:17).
Thanks to the Air Force's investment in installation-wide communications
infrastructure, virtually all nodes on the base network could gain access to the CIP. All
that is needed is the common geospatial framework, or what has become known as
"GeoBase."
2-li

Common Reference Framework
Aggregated Situational Knowledge
Civil Engineering ™1
Security Forces ■■
Services SEE
Munitions
Mobility
Maintenance
Legal
Transportation
Environmental
Safety
Communications
c o M M O N
D A T U M
Integrated Decision
Environment
Figure 2-9: Common Installation Picture (CIP) (9:18)
2.3.5 GeoBase
In the fall of 1998, representatives from the communications and information
management communities met with civil engineer agencies to explore how the two
functional missions could better share geospatial information resources. The technology
and the infrastructure were available to implement the CIP to make collaborative
geospatial information sharing a reality. The desired outcome of the GeoBase effort is to
ensure each USAF installation has the organic capacity to access, exploit, and maintain
one geospatial information infrastructure supporting multiple mission needs (39).
Using available commercial-off-the-shelf (COTS) computer hardware and
software, GeoBase is designed to make the CIP a reality. It is not a "system" in the sense
of a software package such as Microsoft™ Office, but is more of a concept based on
2-19

integrating multiple data sets into a common architecture using proven geospatial
technology. The potential applications of GeoBase are numerous. It can be used to
provide daily mission support for facility management, airfield operations, explosive
safety siting, and communications maintenance. Emergency services can use built- in
tools to plot cordons around emergency sites and reroute traffic flow. Airfield
obstructions can be managed to a higher degree of accuracy providing aircrews with a
better visualization of the airfield. Communications cables and utility lines can be
located to a higher degree of accuracy when performing construction or maintenance,
preventing costly damage and unscheduled outages. All base users would be working
from the same data sets, ensuring that the current information is up-to-date and accurate.
Figure 2-10 is an example of a GeoBase emergency response tool in use at Moody AFB,
Georgia. Automated screens prompt users for information about facility numbers, size of
cordon needed, traffic rerouting, and several other features.
With FY02 funding, it is expected that GeoBase foundation data and core
applications can be acquired and implemented at all USAF installations within two years
(10:13). The next step will be DoD-wide implementation and further development of the
GeoReach concept, which takes the functionality of GeoBase and adds a virtual toolkit of
planning, analysis, and communications software for use at a bare base or forward
operating locations. GeoReach is essentially a deployable version of GeoBase and
includes the Contingency Aircraft Parking Planner (CAPP) and a bare base planning tool
called GeoBEST, which is the focus of this research effort. The following section
describes GeoBEST in detail.
2-20

- ■ • r-n',. ."i. i "rr
Figure 2-10: GeoBase Emergency Response Tool
2.3.6 GeoBEST
GeoBEST (Base Engineering Survey Toolkit) is a PC-based GIS application
designed to give users the ability to view the spatial extent of a selected location. The
user can match the resources to be deployed with the appropriate locations in a spatial
configuration that conforms to established siting standards. GeoBEST was created by
BTG Delta Research Division of Niceville, Florida under the name Bare Base Conceptual
Planning System (BBCPS). It was later renamed GeoBEST to help identify it as a part of
the GeoReach program. Initially developed for use in the Pacific Air Force (PACAF)
theater of operations, GeoBEST provides deployment planners with an automated,
interactive, computer-based tool for rapid development of base layout plans. This can be
applied to any location for which imagery is available. The application allows the user to
2-21

import various types of imagery and locate each of the facilities required at the location
in response to a defined scenario. The following is a more detailed description of the
program including some images of GeoBEST in use.
Like GeoBase and GeoReach, GeoBEST is based on commercial-off-the-shelf
software. The user interface, created with Microsoft™ Visual Basic, interacts with
ESRI™ Arc View and a Microsoft™ Access database. The GeoBEST interface consists
of a split screen, with the Visual Basic window on the left and the Arc View window on
the right, as shown in Figure 2-11. Both windows are opened by running the GeoBEST
executable file and both are closed by closing the GeoBEST window.
V* flHHMPMHSäGi Ä^^^^^^^^^^^^^^^^^^^^^B ..J.c .s| | |> L-i' V^w I1.STC
"rriT" " öiit SlSffiMJtir-ÄJß; 1ffllSH;Sfi BUH i Cold Weather Set, Hardest Eae
IE- follow- em HJpriNn« %eftt MMW
ir Housekeeping Set, 3S8 fereo
HI rarasjFRjsra I®Iö!FS5C "I-: PSW' ....m**:^:.:?..... HwalllllllliBlllil IHV BLDDUWM ^^i^^tTisira
^ :i:-:t L-;
Et ¥ H»ysffii;e*:fMftä Set, Ilir«! V --«H-fFlupT.*.- \ \ £ui Kfetsentiiapoa-:.son-
■ --AicMnlsfe-aÜbn: f aßit'f, TEMPE /■'" ri:^|B s',1,
-H^ng.TEI/JPERTsnl: ügrvi.M :■■.■.-:<
&ie1iHa,I»PB?:Tfe^ ^'"<1r ■Jl L-1
■■■■■■öüasEÄge^Psie Pulste
|! II; lllilllÄMÄiÄIli^lssi ■ ■ -ErrvirorKTfc^ääl Conüröl lfei£8i --fi&lsl DifllSV^Ä Lilrint & Tm •-■■Ssnera? Ilse,. ÖP Siele« V^ - Jit. l-lfir/s-fl.i pr. .--.
| rGsner^cir;1iOkWMF-00?' ; 'r-ommmiimmm^'4m v' ■- i.. : .. i ■ .
\ I -mmmo.Lj&3mf mP-mm ■£^A" ^■■IOMC:
Ln «dry. TEMPER Tent
\ \ »rtiafy, filMPgR lest 0:I^D»^' \ f:-PDw^Äiiä.,€iCPDCJS&£fl " !■_ L-L iCI-
PriiiWjrCdsllftSkMs I III: mB^^SSSS^I^lXlm ) \ PrbTiafyßsinhLlhmCeffeCP
; o "i, -,i -:o \ \--<--&mftäe M&:L\0ki$(ß&Ly$
1 ; ä--»ffeerseGsrTOsisVV!t»P4Ji?l 1 1; :|lll^™p^^^(ill
rd^L-'M-V'1
j ^AI^rPliirtJEMPERTent gp$ i
Er'$MSgfc««pl(10 Sü(s Pfl€AF SSTä 11 ■iiiii^§ip^8ÄBl!l ii:- S lodmalirlajOperations &et5 11 1 llll^BlilSlllllllll Ii-* MEOE FJipMiise Susi, Harsss ■ fi :BS^B^ÄBBllliS IB- w imWeöi Water SSÄ^ffif Barsr* 9H HI- «itchem 5e<, PifliCÄF 2?5 J^FSG
l*i'":Ü l%9** Water Sfcierc© UFUS, HS —i!. ...J(,':'.,
■IüI ■ ■■ :I ► ;
;-r:.i -, l-nj-
|Sfc«*;=F——JlM» MS» I ivii-r - F .-, IIB^^^^^^^^^K
Figure 2-11: GeoBEST User Interface
2-22
When working with GeoBEST, the user's work is saved as a "scenario." Each
scenario stores the data sets (imagery, assets, etc.), inventory and number of allocated
assets, and any maps or reports created and saved by the user. Users initially have the
option of either opening an existing scenario or creating a new one. The current version
of GeoBEST comes with eighteen pre-made scenarios (without background imagery)
based on the dispersed facility layouts shown in the Bare Base Conceptual Planning
Guide, AFP AM 10-219, Vol. 5, Attachment 15 (17:274). These can be used as a separate
scenario or imported as templates into other scenarios. When creating a new scenario,
the user may elect to create a blank scenario (inventory and deployment packages set to
zero) or use the scenario wizard. Blank scenarios are primarily intended for creation of
new templates. The scenario wizard walks the user through the development of a
scenario that will generate the recommended Harvest Falcon or Harvest Eagle asset kits
based on the entry of a base population and/or selected aircraft types and quantities. The
user has the option of accepting the recommended quantities or modifying them if the
exact quantities are known. If the scenario wizard is used, GeoBEST automatically
calculates the number of individual assets needed based on the population. Again, the
user may accept these quantities or modify them as needed.
Scenarios in GeoBEST may include site drawings and/or imagery, or the user
may create layouts consisting only of the Harvest Falcon/Eagle assets. GeoBEST has the
capability of integrating a variety of different data sets, including AutoCAD files, shape
files, Intergraph Design files, image formats (jpg, bmp, tif, sid, gif, etc.), GPS data sets,
and many more. Each data file is added as a "theme," which could be thought of as a
layer. The different themes may be displayed or hidden as needed (see section 2.3.3).
2-23

The GeoBEST database stores the dimensions of each deployable asset (length,
width, and height) in terms of its footprint (ie. the rectangular space it occupies as
opposed to its actual shape). Linear assets (eg. water pipe, electrical cable, etc.) are
drawn using unique line colors, types, and weights. Figure 2-12 shows an open scenario
with allocated assets and a bitmap image as the background theme. The groups of assets
shown are billeting (housing) TEMPER tents and the large asset on the right is a Harvest
Falcon 9-1 Kitchen.
■;■■ * " fl- ' »"" \
'II * ..... ' I
[ HBP"« ■ ̂̂̂ ^^^^1 i. _ i
+ — — ■•* .»
. -\- ,. o *■ F. ■-■ TR f H
■■'Lwundrtt IHWIiirl:
■ i i - ■ -i :
■Pfkrmrt DMxbMm Cmi:me
Hj~"4V/k<£'£\>t *, S.d. "ftLftt £(
:■- bald Ri^ltaffiSiilL.ilif'äwsJ; B" r iiiiiiifiiiÄiiiiisiif;
:*feW'iÄlH'ÄfifE* . ill ' 1J v. . Ihr»-i*.- . -I ■irhivA-. I-.-i
.. V .', A .
Figure 2-12: Open GeoBEST Scenario
In order to ensure the allocated assets are scaled correctly, the user must specify
the map units. GeoBEST is capable of working in meters or feet. ArcView has the
2-24

capability of scaling image files based on the image resolution or the dimensions of an
object displayed in the image (dimensions of a building or runway). Feature data, such as
AutoCAD drawings, are displayed using whatever units they were created in. GeoBEST
allows the user to overlay multiple data sets in a process called image registration. For
example, an AutoCAD drawing could be overlaid onto a photograph. The image file will
be rescaled to match the feature data. Arc View does not have the ability to rotate the
imagery or data sets. The user must therefore ensure that each file has the same
orientation when attempting image registration.
Once the Harvest Falcon/Eagle assets have been added to a scenario, they may be
copied, grouped, rotated, or deleted. The GeoBEST inventory tracker monitors the
quantities of each asset as they are modified. GeoBEST Constraints Analysis tool has the
ability to analyze groups of facilities to determine if they meet the distance requirements
for non-dispersed and dispersed layouts. For example, there should be at least 12 feet
between individual billeting TEMPER tents in a non-dispersed layout. The Area
Analysis tool is used to determine the quantity of a particular asset that will fit within a
designated area.
GeoBEST has the ability to store and display four types of metadata (multimedia
information) for each of the individual assets: text, image, video, and audio. About 100
text files and 100 images of various assets are included with the current version of the
program. GeoBEST allows the user to add these files for individual assets if they are
available. Figure 2-13 is an example of text and image metadata for a Harvest Falcon
MEP-012 generator. These are included with the current version of GeoBEST.
2-25

in: xj
G erierstc, 7E0I* MEP-']12w: 750f A' 143ü''41E0.' 3 old t ce t-p n/ttrj IBe^ic GPiie'aioi fr-r i^riP-rBiippov.^! pant is= °^^i£iLl=''"""'' i/"" * ="*' =
jbefcjnd in H UP/cJ E sc'c enc srnpTicn' if rupale . .1 I:.- I. '. .tu -■■-I -t .1 jl. jk. i'.-. .'I . -i i -". .
■ If-l :■■=:'."'rC A !"■"'.■■ - r * I: ..'-I-If- I : t :'-. ■ V I a ^_ |prpvr|p -ii^dp to increase generator efficiency. „ ' |j»#!&? **■
Jeonhol and surviwsbilily. For hkjhethrsst at
Figure 2-13: Metadata Text and Image for MEP-012 Generator
GeoBEST has the ability to display scenarios in a three-dimensional format. The
user can pan, zoom, or rotate the 3D image to view particular areas or select a continuous
"fly-around" view. The current view can be saved as a jpeg or bitmap image for
importing into documents or presentations. Figure 2-14 is an example of a 3D view,
showing the scenario displayed in Figure 2-12.
The GeoBEST report generator allows the user to create custom reports.
Currently, five types of reports are offered. These include All Scenarios,
Facilities/Equipment Inventory, Deployment Package Inventory, Labor Requirements,
and Power Requirements (7).
2-26

\t&\ :i- "I!*--'"! * ~! <**>> !**
» % -'■pßlA^
|§||||§'i i^f^u VkrifläHlf
1 1 *
^ .■.'.jSSjJ'ä1 tag' J%,
B§k! % ^s
Figure 2-14: Scenario 3D Viewer
All Scenarios: This report lists all scenarios that have been created and their general information, which includes the scenario ID, name, population, directory location, date, created, date modified, and the user who created it.
Facilities/Equipment Inventory: This report contains information regarding the current scenario assets, to include asset name, number inventoried, number allocated, and number recommended. The report can display all assets in the selected deployment packages or just the currently allocated assets in the view.
Deployment Package Inventory: This report contains information regarding the deployment packages related to scenarios that were selected during the initial creation of the scenario. The report includes the asset name and which deployment package it belongs to. This report can only display all assets in the selected scenario.
Labor Requirements: This report contains information regarding the labor hours required to assemble or erect each asset. The report includes asset name, number allocated, required labor hours, total required labor hours, and a description of the
2-27

type of labor required. This report can display all assets in the selected deployment packages or just the currently allocated assets in the view.
Power Requirements: This report contains information regarding the power required per asset in kilowatt-amperes. This report includes asset name, number allocated, normal power voltage, total normal power voltage, air conditioning voltage, and total air conditioning voltage. This report can display all assets in the selected deployment packages or just the currently allocated assets in the view (7).
All of the information used by GeoBEST is contained in a Microsoft™ Access
database. GeoBEST includes the ability to manage this database. Users can modify
information about the deployment kits, modify or add/delete individual assets, adjust the
number of personnel associated with each type of aircraft, and correct any deficiencies or
inaccurate information.
Built into GeoBEST is a generic thirty-day timeline called Scheduler. Using a
color-coded priority scheme, assets are divided into task disciplines. For a particular
task, the work is broken down by Air Force Specialty Code (AFSC). For instance,
installation of a mobile aircraft arresting system is a first priority, it requires at least four
Power Production personnel (3EX02) to install, and it should be completed by day three.
Figure 2-15 shows Scheduler in use.
GeoBEST takes some of the functionality of previous beddown planning
programs such as AutoACE and adds the capability of integrating multiple image and
data formats. Whether or not the program will be perceived by its intended users as
useful or user- friendly is the subject of this research effort. The evaluation accomplished
by the Joint Expeditionary Forces Experiment 2000 (see section 1.2) and results from this
research effort will be used to streamline the product and prepare it for Air-Force-wide
employment beginning in 2002, including the creation of essential training programs.
2-28

JEFX 2000 provided a thorough evaluation of GeoBEST, concentrating on eight separate
factors: maturity/viability, interoperability, availability, human factors, interaction,
accuracy, completeness, and value added (1). Design features of the software were
examined as well as how the program fit into the Air Force's plan for advancement of the
GeoBase concept (sec. 2.3.5). The primary focus of this research will be an examination
of GeoBEST using an information technology evaluation approach called Acceptance
Theory (see section 3.1.1). The secondary focus will be to gather additional feedback
from users on specific design features.
: AFSHfesTT^
(.»
Figure 2-15: Scheduler
2.4 Summary
This chapter presented a background of CE mission and responsibilities, beddown
planning methods and procedures, and two examples of how IT has been applied to the
beddown planning process. Geographic science and its components and applications
2-29

were presented to provide an understanding of the GeoBase concept and its subprogram,
GeoReach. Finally, a thorough description was provided for GeoBEST and the JEFX
evaluation. The following chapter describes in greater detail methods for applying
Acceptance Theory and the plan for implementing this theory in an evaluation of
GeoBEST.
2-30

III. Methodology
3.0 Introduction
The purpose of the methodology chapter is to outline the process used to conduct
the GeoBEST evaluatio n. Three evaluation methods are discussed and the Technology
Acceptance Model (TAM) (13) is found to be the most appropriate for this research.
Implementation of the TAM requires seven steps: (a) identify an appropriate study group,
(b) develop an evaluation plan, (c) design surveys, (d) test the plan, (e) implement the
plan and gather data, (f) analyze the data, and (g) draw conclusions. Each of these steps
is discussed in greater detail.
3.1 Software Evaluation
Software evaluation in its most basic fo rm asks one simple question: "Does the
software meet the needs of the intended user?" With the complexity of modern computer
programs, a yes/no response to this question does not provide any meaningful
information that programmers could use to refine their products. More detailed questions
are needed. How well does the software meet the user's needs? Is the software easy to
use? Is the software useful? Is using the software a pleasant experience? How well does
the software interact with other programs? The potential list of questions is endless.
JEFX 2000 (see section 1.2) provided answers to many of these questions for GeoBEST.
This research will take the evaluation of GeoBEST one step further and apply an IT
evaluation approach called Technology Acceptance Theory.
3-1

3.1.1 Acceptance Theory
The ultimate goal of any information technology is to increase the performance
level of the user through the use of this technology. With the rising cost of new
technology development and reengineering, there is a need for a way to predict future
usage of information technology by its intended users. Technology acceptance modeling
provides methods for predicting user behavior. Three models have been developed and
successfully used to predict actual system use by measuring the user's perceptions toward
that system. These are the Theory of Reasoned Action (TRA), the Technology
Acceptance Model (TAM), and the Theory of Planned Behavior (TPB). Following is a
discussion of these models and rationale for selection of the Technology Acceptance
Model for use in this research.
3.1.1.1 Theory of Reasoned Action
In social psychological research, theorists seek to identify the determinants of
behavior within the individual rather than the technology under review. Fishbein and
Ajzen's Theory of Reasoned Action (TRA), shown in Figure 3-1, has been used to more
fully develop how user beliefs and attitudes are related to individual intentions to perform
(22). The different text blocks in the diagram represent the model variables and arrows
between the blocks can be interpreted as "influences..." or "leads to..." For example, the
Subjective Norm influences Behavioral Intention, which leads to the actual Behavior
(21:9).
3-2

Beliefs re: Consequences
liiiiiiiii^—H Attitude Evaluation of Beliefs
,-' \
Stimulus Conditions
Normative Beliefs
^ *) Motivation to Comply
Subjective Norm
Behavior Intention
Behavior
Figure 3-1: Theory of Reasoned Action (45) (29)
The Theory of Reasoned Action is a model used to predict people's behavior.
Stimulus Conditions includes all environmental factors that are beyond the direct control
of the individual. According to TRA, an individual's behavioral intention is affected by
two factors. One is the attitude toward the behavior, or the person's beliefs that the
behavior leads to certain outcomes and his evaluations of these outcomes. The second is
the subjective norm, or the person's beliefs that specific individuals or groups think he
should or should not perform the behavior and his motivation to comply with the social
pressures. The TRA forms the basis for the Technology Acceptance Model ultimately
selected for use in this study.
3.1.1.2 Technology Acceptance Model
The Theory of Reasoned Action is useful for predicting behavior in general but
the Technology Acceptance Model (12) has shown to be more useful for predicting user
3-3
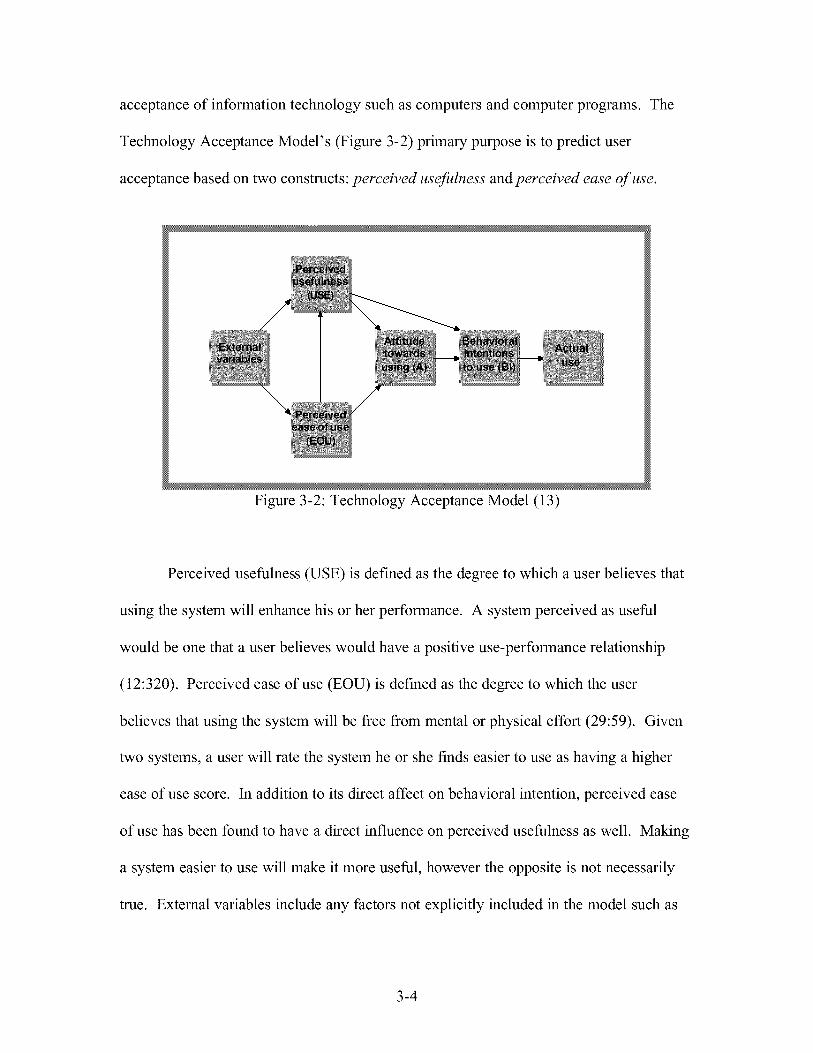
acceptance of information technology such as computers and computer programs. The
Technology Acceptance Model's (Figure 3-2) primary purpose is to predict user
acceptance based on two constructs: perceived usefulness and perceived ease of use.
Perceived usefulness
,_ . . Attitude Behavioral Externa . , ...... Actua ' towards intentions «i.m.ii
using (A) to use (Bl) U!>e
\ / * Perceived ease of use
(EOU)
Figure 3-2: Technology Acceptance Model (13)
Perceived usefulness (USE) is defined as the degree to which a user believes that
using the system will enhance his or her performance. A system perceived as useful
would be one that a user believes would have a positive use-performance relationship
(12:320). Perceived ease of use (EOU) is defined as the degree to which the user
believes that using the system will be free from mental or physical effort (29:59). Given
two systems, a user will rate the system he or she finds easier to use as having a higher
ease of use score. In addition to its direct affect on behavioral intention, perceived ease
of use has been found to have a direct influence on perceived usefulness as well. Making
a system easier to use will make it more useful, however the opposite is not necessarily
true. External variables include any factors not explicitly included in the model such as
3-4

specific system design features (13). The Technology Acceptance Model has been used
successfully in numerous studies. Davis, Bagozzi, and Warshaw successfully predicted
use of a word processing program using a class of MBA students. (13) Dillon and Morris
predicted use of a web browser program using a university computer science class. (29)
For additional examples and discussion see Davis, 1989 (12), Davis, 1993 (11),
Venkatesh and Davis, 1996 (44), Venkatesh and Davis, 2000 (45), Szajna, 1996 (37),
Jackson and others, 1997 (26), Lucas and Spitler, 1999 (27), and Venkatesh and Morris,
2000 (46).
3.1.1.3 Theory of Planned Behavior
The Theory of Planned Behavior (TPB) was adapted from the Theory of
Reasoned Action by leek Ajzen in 1985 (2). The TRA (sec. 3.1.1.1) includes two
variables which lead to behavioral intention, evaluation of beliefs and motivation to
comply. The TPB model (Figure 3-3) adds a third antecedent of intention to the TRA
model, perceived behavioral control.
Perceived behavioral control is a person's belief in the availability of assets
needed to complete the behavior (38). The literature provides comparisons of the TAM
and TPB, though the results are mixed. In one instance, both the TAM and TPB were
tested and it was found that although TPB predicted user intention, it did not provide as
complete an explanation of intention as did TAM. It was also noted that TAM was easier
to apply (28). Taylor and Todd (1995) conducted a study concluding that TAM was a
slightly better predictor of usage but that TPB provided a more complete (albeit slight)
understanding of the determinants of intention (R2 = 0.57 for TPB and 0.52 for TAM)
3-5
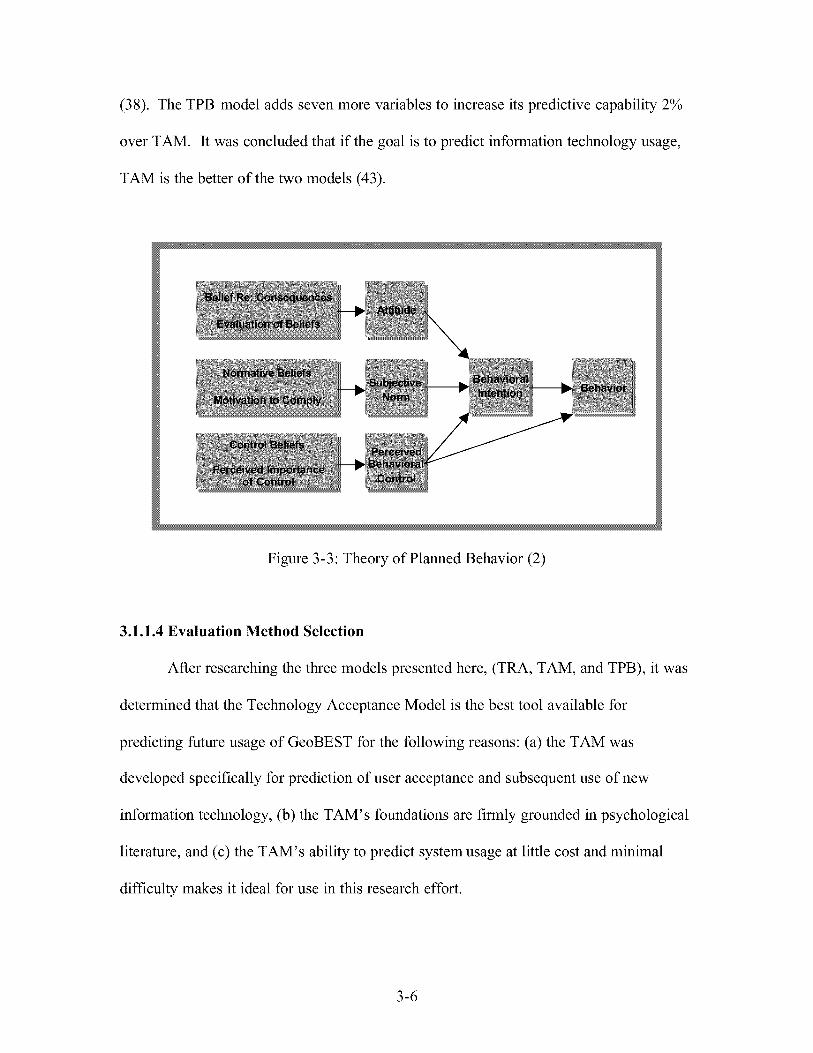
(38). The TPB model adds seven more variables to increase its predictive capability 2%
over TAM. It was concluded that if the goal is to predict information technology usage,
TAM is the better of the two models (43).
Belief Re: Consequences —^ Attitucli:
\ Normative Beliefs
Subjective ^
Motivation to Comply Norm
Behavioral Intention ► Bfilmvlor
/ Control Beliefs /
Pi'ir.civctl /_^^~
P,:r<:Hv,tl Import.-»!«.- ""► Bi-h.iviornl-^ of Control Control
Figure 3-3: Theory of Planned Behavior (2)
3.1.1.4 Evaluation Method Selection
After researching the three models presented here, (TRA, TAM, and TPB), it was
determined that the Technology Acceptance Model is the best tool available for
predicting future usage of GeoBEST for the following reasons: (a) the TAM was
developed specifically for prediction of user acceptance and subsequent use of new
information technology, (b) the TAM's foundations are firmly grounded in psychological
literature, and (c) the TAM's ability to predict system usage at little cost and minimal
difficulty makes it ideal for use in this research effort.
3-6

3.2 TAM Implementation
A review of applicable literature did not reveal any specific criteria for using the
TAM. The following steps were derived from the previous TAM studies (13) (29) in
order to implement the TAM: (a) identify an appropriate study group, (b) develop an
evaluation plan, (c) design surveys, (d) test the plan, (e) implement the plan and gather
data, (f) analyze the data, and (g) draw conclusions. The following sections discuss how
this implementation was carried out.
3.2.1 Identify Study Group
A prospective study group for this research effort must meet the following
criteria: (a) the subjects must be prospective future users of GeoBEST, preferably a mix
of CE officers and Engineering Assistants, (b) there must be an opportunity for the
subjects to use GeoBEST for a realistic beddown planning scenario, and (c) the sample
size must be sufficient for statistical analysis. Generally, at least 10 individuals are
required per construct in the model (35). To implement the TAM, this requires that the
sample be at least 40 individuals.
Several options were considered for prospective study groups, including the Civil
Engineer and Services School, the Air Force Institute of Technology graduate education
program, base level CE organizations, and Silver Flag. The Civil Engineer and Services
School at Wright-Patterson AFB, Ohio conducts an eight-week course entitled
Management 101. Its purpose is to provide initial indoctrination training for CE junior
officers. A typical class size is 50-60 students, consisting primarily of 2nd Lieutenants,
3-7

with some 1st Lieutenants and Captains. The students receive training on beddown
planning, which culminates with a 1-day beddown planning group exercise. The course
presents a sufficient sample size of CE officers, however there is no representation by
Engineering Assistants. Also, there is insufficient time for the students to use the
software.
The Air Force Institute of Technology, also at Wright-Patterson AFB, Ohio offers
a Master's degree in Engineering and Environmental Management (GEEM). Students in
this program are primarily Air Force CE junior officers. Occasionally the class will
include one or two US Marine Corps engineering officers. When the junior and senior
classes are in session, the combined class size is 35-40 students. Again, this meets the
sample size criteria, but there is no EA representation. Also, the GEEM program
curriculum does not include beddown planning, nor is there time to create and execute a
planning scenario sufficient for the goals of this research.
A typical base-level CE squadron contains 7-10 officers and 4-6 EA's. These
organizations routinely create beddown plans for field exercises, readiness exercises and
inspections, and actual deployments. Meeting the sample size criteria would require
coordination with several different organizations at different locations. This assumes that
they would be engaged in a beddown planning activity within the time frame for data
gathering. These logistical requirements make this option undesirable.
Detachment 1 of the 823rd RED HORSE Squadron at Tyndall AFB, Florida
conducts weekly contingency skills training classes for base level CE personnel under the
name Silver Flag. Approximately 35 Silver Flag classes are conducted each year for
active duty, guard, and reserve units within the continental U.S. A typical Silver Flag
3-8

class is composed of CE personnel teams from several different units, regardless of their
duty status (AD, guard, reserve). These teams arrive at the site on Sunday of their
assigned week and their instruction begins the following morning. The students are
divided according to their specialty and they receive training on various contingency
skills. The students are tasked to develop and execute a beddown plan for a contingency
deployment scenario. The plan is presented to the instructors on Wednesday afternoon.
The intermediate time (Mon - Wed) is used for classroom instruction during normal
training hours and for development of the beddown plan after hours or during specified
planning time. On Thursday, the students put this plan into action as they develop a
simulated beddown site in accordance with the plan that was briefed and critiqued the day
before. A typical Silver Flag class contains approximately ten officers and eight EA's.
Using several of these classes would produce a sufficient sample size for this research
plan. The time for preparation of the beddown plan is less than three days, which
appropriately imitates the real-world time constraints for producing a usable plan. These
factors make Silver Flag the most desirable option for a survey group for this research.
Four Silver Flag classes were selected for participation in this research in the fall
of 2001. These classes were conducted on the weeks of 16 Sep, 14 Oct, 24 Oct, and 4
Nov. The anticipated final sample size was 65-80 students.
3.2.2 Develop Evaluation Plan
Implementation of the Technology Acceptance Model for this research follows
the procedure called prototype testing or system selection. This involves presenting the
system under evaluation to a group of prospective users involving about an hour of
3-9
interacting with the system, which could include a training program and hands-on
exercises. After the initial presentation, prospective users are asked to rate, by
completing a survey, the future usefulness and ease of use they would expect based on
relatively little experience with the system being rated. Managers can use these methods
to examine a system for possible future implementation or to decide between two or more
competing systems (12:330). The literature provides examples (e.g. 13, 29) of how
follow-up surveys, administered after a defined system usage period, could be used to
validate the initial TAM results. Though this is not required for TAM implementation, it
was attempted for this research to validate the initial results and to solicit qualitative user
feedback on system design features after the students had an opportunity to use the
system.
The weekly schedule for a typical Silver Flag class is shown in Figure 3-4. It is
within this time frame that the TAM was implemented to evaluate GeoBEST.
Classes begin
Students Plan preparation depart
u f 1 + i
Sunday Monday Tuesday Wednesday Thursday Friday Saturday A t i k + f
Students arrive
GeoBEST briefing,
initial survey
Beddown briefing,
follow-up
Beddown exercise
survf sy
Figure 3-4: Silver Flag Weekly Schedule
Class schedules for the weeks selected were modified to allow for a one-hour
presentation of GeoBEST on Monday at noon. To allow the students some hands-on
3-10
experience with the system during the presentation, arrangements were made for
borrowing up to four computers from the base communications support flight for the
students to use during the briefing. Students took turns using these computers or they
elected to simply observe the demonstration. These computers were available after the
presentation for preparing their beddown plan after hours and during scheduled planning
time. The students were provided with a handout summarizing the capabilities of
GeoBEST as well as a quick-reference sheet showing a Screenshot of GeoBEST and
callout boxes with descriptions. These handouts can be found in appendices D and E.
The student presentation was designed to maximize the student's exposure to the
capabilities of GeoBEST, through demonstration, while at the same time minimizing
their exposure to its known flaws. The time allowed for the presentation was one hour,
with an additional 10 or 15 minutes if necessary. To ensure that all GeoBEST features
were demonstrated, a copy of a training presentation given to the JEFX (see section 1.1)
participants was obtained from the GeoBEST contractor. Where possible, each feature
was demonstrated, with the exception of those that had apparent flaws that could not be
avoided. Because the presentation was intended to be entirely composed of a real-time
demonstration, no PowerPoint™ slides were prepared. The following is an outline of the
subject areas covered during the lesson:
GeoBase: description of the GeoBase Initiative and how GeoBEST fits into the GeoReach concept of operations Program description: GIS program built on ESRI™ Arc View; database of information found in AF beddown planning publications Scenarios: create new or edit existing scenarios; add data files or imagery to scenarios; allocate and manipulate Harvest Falcon/Eagle assets within scenario s; import and export scenarios Map generator: create, display, and print pre- formatted maps
3-11

Area analysis: determine number of assets that can fit within a defined geographic space 3D viewer: display scenarios in three dimensional format Labeling: display various types of labels for description of assets or features Constraints analysis: find spacing conflicts between individual assets or groups of assets Image registration: merge data file and imagery GPS data: import and define Global Positioning System data Asset metadata: display and add/delete multimedia asset information Report generator: create customized reports based on scenario information Scheduler: view generic thirty day calendar of prioritized beddown tasks Database management: view and edit the database of beddown and asset information
Following the briefing, the students completed the first of two surveys, which are
discussed in detail in section 3.2.3. In order to maximize the potential for productive use
of GeoBEST, the researcher was present after hours and during scheduled planning time
to provide user assistance if needed. On Wednesday, all students who completed the
initial survey completed the follow-up survey to allow for validation of the initial survey
results. A separate survey was also administered to cadre instructors after the final class
date to gather qualitative feedback on the training presentation and on the program itself.
3.2.3 Design Survey Instruments
Implementing the TAM requires the design of at least the initial survey, and an
optional follow-up survey for validation purposes. The initial survey contains a series of
questions that measure the TAM variables, perceived ease of use, perceived usefulness,
attitude towards using, and behavioral intentions to use relative to the IT of interest.
Davis developed appropriate survey scales to measure these variables (13:991). These
scales were validated and have been adapted for use in this study of GeoBEST.
3-12

Evaluation tools, such as the TAM, give researchers the ability to apply scales that have
been developed and empirically validated in previous research, thus avoiding potentially
time-consuming and costly effort required to develop new measurement instruments
(29:61).
Three surveys were designed for this research. They include two student surveys
and one cadre survey. The cadre survey was developed to gather qualitative feedback.
The cadre consists of the Silver Flag instructors and staff members. The initial student
survey consisted of three sections of questions; demographic information; feedback
regarding the quality of the training presentation; and, a series of questions that were
adapted from previous research to measure the TAM variables. The student follow-up
survey asks the students to document how much the students used the system and the
TAM questions again to see if their perceptions of the system changed after using the
program. Because the cadre members were not active GeoBEST users, they did not
answer TAM questions, but instead only answered questio ns regarding the perceived
quality of the system and also any perceived differences in the performance of students
who use GeoBEST versus those that elected not to use it.
Because the surveys for this research were administered to personnel units outside
of AFIT, approval was required by the Air Force Personnel Center (AFPC) in accordance
with Air Force Instruction (AFI) 36-2601. An approval package was prepared and
submitted to AFPC on 15 Aug 01 and it was approved on 22 Aug 01. The survey control
number is SCN 01-086, and the expiration date is 31 Dec 01. Each of the surveys used in
this study can be found in appendix A. Each of the three surveys is described in detail in
the following sections.
3-13

3.2.3.1 Student Initial Survey
The student initial survey was distributed immediately following the GeoBEST
presentation on Monday for each Silver Flag class and collected when they were
complete. The survey consists of two main parts, demographics and TAM questions.
The first five questions gather demographic information such as rank, duty status, and job
title. These questions allow for verification that the students meet the criteria for this
study, as described in section 3.2.
Two questions ask for feedback on the quality of the briefing and how well they
feel it prepared them to begin using the system. One aspect of TAM implementation that
was not found in the literature was a user's evaluation of the quality of the introductory
presentation. Responses to these questions will be used to determine whether the
perceived quality of the initial user training affected their perceptions of the software's
ease of use and usefulness.
The student initial and follow-up surveys each contain twelve questions to
measure the four TAM variables based on a 7-point scale known as the Likert scale. An
example of this type of question is "The computer program is easy to use," with the seven
available responses being "strongly disagree, disagree, slightly disagree, neutral, slightly
agree, agree, and strongly agree." Multiple questions are used to measure single
variables to allow for variation in how individuals respond to questions with particular
word structures. For example, one person may feel that the statements "I am happy" and
"I am satisfied" are essentially identical, while another person may perceive that they are
slightly, or perhaps greatly different. The process of determining which sets of questions
3-14
produce the least variance when measuring a particular variable is called Reliability
Analysis. Cronbach's Alpha reliability analysis (see section 3.2.5.2) is a statistical
procedure used to determine whether or not survey respondents answer questions
consistently when those questions measure the same variable. Davis performed this
procedure for each of the TAM variables after an initial introduction and after a defined
usage period for his study (13). Cronbach's Alpha values range from 0 to 1, where
higher values are preferred. An Alpha value of .7 or greater is considered sufficient for
social research (8). Davis found that the four item perceived usefulness scale achieved a
reliability of 0.95 and 0.92 for the initial and follow-up surveys. The four item perceived
ease of use scale obtained reliability coefficients of 0.91 and 0.90. The four item attitude
towards using scale obtained reliabilities of 0.85 and 0.82. The two item behavioral
intentions to use scale obtained reliabilities of 0.84 and 0.90 (13:991). This analysis was
repeated on data gathered for this research to ensure consistency.
The Silver Flag students did not supply their names or any other identifying
information on the surveys. Therefore it was necessary to have a way of linking their
responses on the initial survey to those on the follow-up survey. The last question on
each survey asks the students to write in the first two letters of their mother's and father's
first name.
3.2.3.2 Student FoIIov^Up Survey
On Wednesday, the student follow-up survey was administered to all students that
completed an initial survey. This purpose of this survey is to gather additional feedback
from the students after they had an opportunity to use the software and to validate the
3-15

TAM results from the initial survey. The first two questions determined whether or not
the individual participated in the beddown planning, and if they did participate, whether
they used GeoBEST to help prepare the plan. If so, they continue to the next question.
Otherwise, they are directed to skip over the TAM questions, which are only valid if
there was actual system usage.
This survey contains three questions designed to measure the fifth TAM variable
of actual system usage. The first question presents a list of GeoBEST features and asks
the student to indicate which features of GeoBEST they used. Two other questions are
the second measure of actual usage. The student is asked to indicate how many hours
they actually used the system, both personally and as part of a group. The remaining
questions request feedback on the student's most liked and most disliked features of
GeoBEST. Again, the students are asked for feedback on the quality of the introductory
training they received. The final question is open-ended for general comments. Finally,
the students are again asked to write in the first two letters of their parent's names to link
their responses to the initial survey.
3.2.3.3 Cadre Survey
The cadre survey was given to any cadre member who is either an instructor for
the officer or EA classes, or if they viewed at least one of the four GeoBEST
presentations. Each participating cadre member completed only one survey. Therefore,
if a cadre member was present for all four of the scheduled classes, they completed the
survey after the last class in order to maximize their exposure to the system and/or
students using the system.
3-16

The survey consists often questions. The first question asks for their current
position at Silver Flag. The second question asks how long they have been working at
the site. Questions 3 and 4 asks them to compare the performance of students who used
GeoBEST to those that don't, and to elaborate on some of the major perceived
differences in the student's performance. The instructors were then asked to provide
feedback on the introductory GeoBEST briefings if they viewed any. The remaining
questions request feedback on the cadre member's most liked and most disliked
GeoBEST features, suggestions for improvement, and any additional comments they may
have.
3.2.4 Test the Plan
The purpose of testing the evaluation plan is to help identify any problems in the
proposed methodology, to ensure the presentation is adequately timed, and to gather
feedback from test subjects on the quality and clarity of the presentation. Ideally, the test
case would mirror the conditions expected for the actually evaluation. Due to time and
personnel constraints, this was not possible. It was decided to give the GeoBEST
presentation to a small number of AFIT students after which they would complete the
initial student survey.
This evaluation plan was tested on 27 Aug 01. Approximately thirty AFIT
students (about half CE and half Communications officers) were invited to hear a one-
hour interactive briefing on GeoBEST after which they would complete a survey. Ten
students agreed to participate and six students actually showed up, five CE and one
Comm officer. One laptop was used for the GeoBEST presentation and the program was
3-17

loaded onto three other laptops for the students to use. All of the student laptops
experienced different errors that prevented use of GeoBEST, even though two of them
were identical to the laptop being used for the presentation, which operated without any
apparent problems. Time constraints prevented acquiring other laptops, so a Screenshot
of GeoBEST in use was displayed on the three laptop screens so the students would have
something to reference while viewing the presentation. After the presentation, the
student initial surveys were distributed, completed and collected. Most students
commented that the process could have been more meaningful had they been able to
follow along on their machines. The presentation time was 50 minutes due to other
classes needing the room. At least 10 to 15 more minutes were needed to adequately
cover all GeoBEST features.
A second trial run was scheduled for the week prior to the first Silver Flag visit
using approximately 25 AFIT students from the Graduate Engineering and
Environmental Management program. Due to heightened security as a result of the
September 11th terrorist attacks, the second trial run was canceled. Very little
information was gained from the initial trial run, other than the assurance that the
presentation could be adequately covered in the allotted time frame, and that problems
should be anticipated when loading GeoBEST on laptop computers.
3.2.5 Overview of Analysis
After data were collected from the four Silver Flag classes, statistical analysis
packages SPSS™ and JMP IN™ were used to analyze the results. Following is a brief
3-18

description of the analysis methods that were used. These are reliability analysis, factor
analysis, multiple regression, and analysis of variance.
3.2.5.1 Reliability Analysis
When giving an evaluation survey, the survey instrument should elicit consistent
and reliable responses even if questions were replaced with other similar questions.
When a variable is measured from a set of questions that return a stable response, then
the variable is said to be reliable. Cronbachs Alpha is an index of reliability associated
with the variation accounted for by the true score of the construct. A construct is the
hypothetical variable that is being measured. For the TAM, USE, EOU, A, and BI are all
constructs. Alpha coefficients range in value from 0 to 1 and may be used to describe the
reliability of constructs extracted from questions measuring the same construct. The
higher the score, the more reliable the generated scale is for measuring the construct of
interest. An alpha score of 0.7 or higher is generally regarded as acceptable in
psychology-based research (8). Removing questions or adding other questions could
improve alpha scores of less than 0.7.
Previous TAM research has indicated that the scales designed to measure the
TAM constructs are highly reliable, often with alpha values in excess of 0.8. Reliability
analysis was conducted for this research to ensure consistency.
3.2.5.2 Factor Analysis
Factor analysis is a statistical approach that can be used to analyze
interrelationships among a large number of variables and to explain these variables in
3-19

terms of their common underlying dimensions (called factors). The statistical approach
involves finding a way of condensing the information contained in a number of original
variables into a smaller set of dimensions (factors) with a minimum loss of information
(31).
There are two types of factor analysis, exploratory and confirmatory. For
exploratory, the researcher essentially ignores what he or she knows about the factors
being measured. Survey data is analyzed as a whole and the procedure extracts factors,
indicated by a statistic called an eigenvalue. According to Kaiser's Criterion, eigenvalues
greater than one is the criteria for numerically identifying a factor (35). If a survey was
designed to measure five factors and only two are identified, then it may be necessary to
redesign the scales used to measure the factors. It is also useful to observe how each of
the survey questions "load" on the extracted factors. A loading indicates how much
variance is explained by a particular question for a specific factor, with values ranging
from 0 to 1. When questions load significantly on two or more of the identified factors,
this question may need to be removed from the analysis.
In confirmatory factor analysis, the researcher instructs the statistical computer
software to extract a specific number of factors. Again, the resulting eigenvalues and
loadings gauge the relative strength of the extracted factors. For this research,
exploratory factor analysis was used in order to see the number of factors the software
was able to extract instead of forcing it to extract a specific number.
3-20
3.2.5.3 Regression
In regression, the objective is to build a model that relates a dependent (or
response) variable to one or more independent (or predictor) variables (20:573).
Modeling using one independent variable is called simple regression while modeling with
two or more independent variables is called multiple regression. Figure 3-5 is a graphical
representation of simple regression.
1 y
-t—* s~-^ . y^
nder
ile
(Y
jr^\ Linear j/: \ Approximation
CD J3 Q. CO : jK Y = mX + b (D -C ■jT
■a ro ^r £ > '■- jr\ ~*%^^
jf ^~^~ Data Points
■ i i i i
Predictor Variable (X)
Figure 3-5: Simple Regression
An example of a predictor variable could be average freeway speed for a certain
geographic area. The independent variable could be the number of fatal auto accidents at
locations where that speed is observed. The data points are plotted on the x-y graph, and
through a series of mathematical calculations, a linear approximation is determined for
the relationship between speed and number of fatal accidents. This is also known as
curve fitting.
3-21

Two statistics are primarily used to describe the "quality" of the relationship
between the variables. These are the coefficient of determination (R2) and the regression
coefficient (Beta). R2 values ranges from 0 to 1 and they represent the percentage of
variance explained by the variable tested in the hypothesized relationship. In other
words, how closely are the data points grouped around the fitted line? For example,
within the TAM, an individual's perceived usefulness of a computer system and their
attitude towards using the system are hypothesized to have a positive influence on that
individual's behavioral intention to use the system. This is represented as BI = A + USE.
After data is gathered and analyzed, R2 and Beta values are determined for this
relationship to describe its "quality." An R2 value of 0.5 would indicate that the TAM
explained 50% of the variance in behavioral intentions. Graphically, the data points
would appear to follow the line fairly well. An R2 of 1.0 would indicate that A and USE
completely explain the variance in BI. Graphically, all data points would lie directly on
the fitted line. A Beta value is determined for each of the independent variables in the
equation. This value is the correlation between the independent variable and the
dependent variable. Using the previous example, if A had a Beta value of 0.02 and USE
had a Beta value of 0.75, then it would be correct to say that USE is highly correlated
with BI, whereas A has very little correlation with BI.
For this research, multiple regression is used to examine each of the TAM
relationships that ultimately leads to a prediction of the Silver Flag students' intention to
use GeoBEST in the future. Three proposed relationships are examined using regression:
(1) perceived usefulness and attitude towards using have a significant positive influence
on behavioral intentions to use (BI = USE + A); (2) perceived usefulness and perceived
3-22

ease of use have a significant positive influence on attitude towards using (A = USE +
EOU); and (3) perceived ease of use has a significant positive influence on perceived
usefulness (USE = EOU). These three relationships are shown on the TAM diagram in
Figure 3-5.
i
USE
S» '^^S* ^-^. ir> External Variables 3—► V A Tj BI —► Actual
Use
N* EOU
Figure 3-6: TAM Relationships
3.2.5.4 Analysis of Variance
This evaluation of GeoBEST was conducted using individuals from a wide
variety of backgrounds and experience levels. For example, although the primary
intended audience was CE officers and EA's, the results in Chapter 4 indicate that a
significant number of the participants did not meet this criterion, even though their
responses were included in the research. It would be useful to know if the responses
provided by these other individuals were significantly different from the officers and
EA's. The technique used to make this determination is called analysis of variance
(ANOVA). ANOVA is used to test the hypothesis that several means are equal. For
example, if the average score (on the 7-point Likert scale) for perceived ease of use for
the officers and EA's was 5.0, and the average for all others was 4.3, ANOVA indicates
3-23

whether this 0.7 point difference is significant, and to what degree it is significant. The
statistical indicator of significance is the p value, which can range from 0 to 1. The
difference of means is significant if the p value is less than 0.05. Two other levels of
increasing significance are/? values less than 0.01 and 0.001 (35). This research includes
several ANOVA tests to determine if students responses to the TAM questions could
have been affected by other variables such as their individual attitude towards using
computers or their experience with beddown planning. These results give additional
insight into the TAM regression results and could also be used to plan for future
GeoBEST training programs by indicating which factors affect individual perceptions.
3.3 Limitations and Concerns
Several items were seen as limitations as the plan was prepared for
implementation. First, GeoBEST had not been loaded on any of the computers that
would be used for the student presentation. Given the unpredictable nature of installing
GeoBEST (see sec. 3.2.4), a lack of working computers a major concern. Second, as the
researcher was preparing the evaluation plan and learning to use GeoBEST, several
system flaws were identified. Some were minor while others seriously impacted the
program's advertised capabilities. These flaws are discussed in detail in section 4.2. The
majority of GeoBEST's features can be demonstrated without exposure to the serious
flaws. Regardless, the result is an incomplete presentation and the students would very
likely discover the flaws after minimal system use. Third, the Silver Flag training is very
time intensive and students typically find it difficult to complete the beddown plan using
3-24

current methods in the time allotted. Whether the students would be willing to learn and
effectively use a new system, regardless of their perceptions, was a major concern.
3.4 Summary
This chapter has focused on the process used to conduct an evaluation of
GeoBEST. Several alternatives were proposed for this evaluation and the Technology
Acceptance Model was selected. An appropriate study group was defined and identified.
The three surveys to be used were described as well as the statistical methods that will be
used to analyze the collected data. Finally, limitations and concerns for this research
were identified. The following chapter presents an analysis of the results.
3-25

IV. Results and Analysis
4.0 Introduction
The purpose of the analysis chapter is to report the outcome of the procedures
outlined in the methodology chapter. Included are the researcher's experiences with
GeoBEST in preparation for conducting this study. This chapter also discusses how the
Technology Acceptance Model was implemented using the CE students at Silver Flag,
including a presentation of demographics, some qualitative feedback on GeoBEST, and
statistical analysis of the TAM data.
4.1 Researcher's Evaluation of GeoBEST
A copy of the latest version of GeoBEST (including copies of ESRI™ Arc View
and 3D Analyst) was initially obtained from the Air Combat Command Geo Integration
Office, Langley AFB, VA (ACC/CEOG), in the Spring of 2001. Soon thereafter, the
primary GeoBEST programmer at BTG Delta Research Division of Niceville, FL was
contacted to inquire concerning any training for GeoBEST that may have been used in
preparation for JEFX 2000. The programmer provided several PowerPoint presentations
that were used for initial training of the CE personnel who participated in JEFX 2000.
These presentations along with the built- in GeoBEST help files (and trial and error) were
used to gain familiarization with the program. After the first few attempts to use
GeoBEST, it became apparent that initial familiarity with Arc View would be very
helpful. GeoBEST is essentially an add-on program to Arc View. Several problems were
4-1

encountered while using GeoBEST. These are discussed below along with other features
that need attention.
4.1.1 Asset Inventory Tracking
GeoBest is designed to maintain an accurate inventory of all assets in the
database. As these assets are allocated within scenarios, GeoBEST tracks the numbers
and uses them to make calculations for reports and other analysis. If assets are copied,
deleted, or imported from other scenarios, the inventory feature is designed to maintain
an accurate count. Frequently this inventory accounting function does not work. The
inventory seems to work correctly when dealing with a small number of assets (<10).
But as the complexity of operations increases, erroneous numbers begin to appear. This
problem is particularly prevalent when copying or deleting groups of assets. It appears
the only way to correct this problem is to recreate the scenario and try again, though it is
likely the same problem will be encountered. The program is still usable despite this
problem, though any calculations or analysis based on the inventory numbers would be
useless.
4.1.2 Desktop vs. Laptop
When the GeoBEST program file is executed, Arc View is opened and the
program determines the computer's screen resolution, allowing for proper sizing of the
Arc View and GeoBEST windows. Throughout the course of this study, GeoBEST was
installed on approximately 15 different desktop computers and about the same number of
laptop computers. These computers were representative of a wide range of
4-2

manufacturers and performance specifications. On each of the desktops, GeoBEST
didn't seem to have any problem determining the correct window dimensions and sizing
requirements. When running on the laptops however, nearly all of them had improperly
sized windows, which could be fixed, but was irritating nonetheless. The reader is
referred to section 3.2.4, which details the researcher's experience of trying to test the
evaluation plan. Three separate laptop computers experienced errors trying to run
GeoBEST. Because GeoBEST is designed to be used in the field at forward locations,
problems associated with using it on laptop computers should be given higher priority.
4.1.3 Resolution
GeoBEST has apparently been optimized to run at screen resolutions greater than
800 X 600. At this resolution or lower, many of the GeoBEST and Arc View tools are
covered by other screen features. Examples of this are shown in Figure 4-1. Arrow #1
indicates the radio buttons for selecting new or existing assets, with the labels covered.
Arrow #2 indicates the location for the button needed to scale imagery. The features can
be uncovered by stretching the windows left or right, but again this is an irritating
inconvenience.
4-3

V- H ■■ ■Mim llli||§l|i • - J'¥j l = ■fl Mll5»liill:' i l : i\ *■ •. .j
■ ■ tfe 1 • » !klik-J ̂ P^^^^^H J*J - '(s
|l- ÜI . -ilU-MIWH -auf* Mm'Sm&M<rj - ™Wf1 .&
*B=*,&
# +
wBg\
Figure 4-1: Screen Resolution Problems
4.1.4 3D Viewer
The 3D scenario viewer feature is very useful for visualization of the beddown
location. However, some problems were occasionally encountered when using it. The
first problem, shown in Figure 4-2, involves the background imagery getting "sliced" in
half diagonally. The image on the left shows a normal 3D view with the entire image
theme and allocated assets (arrow 1) visible. The image on the right is the same view
showing the "sliced" theme. Any assets that were placed on the sliced portion of the
theme are still visible. This image also shows a black rectangular region on the right side
(arrow 2), which sometimes appears when using the 3D viewer. These problems
occurred randomly and there is no indication in the help files for how to remedy the
situation.
4-4

-.* - o • • w ' .' ■••• .w. ;: r| |. i j L K- :
Figure 4-2: 3D Viewer Problems
4.1.5 Online Help Files
The online help files that accompany GeoBEST are a general overview of the
program's features with some basic instructions. Interspersed with the text are images of
some of the program tools and occasionally some Screenshots. The image quality is very
poor. This may have been done to minimize file size, but it is often more distracting than
helpful. GeoBEST is very dissimilar from the day-to-day software used by the personnel
intended to employ the program. Detailed step-by-step instructions for some of the tasks
and clear images would be very helpful.
4.1.6 Copying and Pasting Assets
When creating scenarios in GeoBEST, the user has the option of creating a blank
scenario (asset inventories set to zero), or use the scenario wizard to determine the
appropriate numbers of assets. The primary purpose of the blank scenario option is to
create templates, which can then be imported into multiple scenarios. When generating a
bare-base layout, the personnel housing area is often composed of multiple rows of
4-5

identical facilities, such as TEMPER tents. A standard block of these facilities is a
perfect candidate for creation of a template. A single set of facilities could be laid out
then copied and pasted as many times as necessary. Problems arise when trying to paste
multiple assets. First, the pasted objects appear directly on top of the objects that were
copied, making it difficult to distinguish between the two. Most users would be familiar
with Microsoft Office programs, which paste the objects near the copied objects, but not
directly on top of them. Also, when trying to click and drag the pasted objects, there are
several seconds of lag time (typically 10 to 15) before the moved objects re-appear in
their new location. There is no indication during this time whether the program is busy
or if it is stalled. This problem was experienced on computers considered high-end (850
MHz, 128 MB RAM) as well as older machines.
4.1.7 GPS Files
GeoBEST includes the ability to import data files from GPS systems. The data
can be added to the scenario in the form of points, lines, or polygons. In order to
demonstrate this feature to the Silver Flag classes, sample GPS data files were obtained
from BTG Several attempts were made to import the files into a scenario without
success. BTG was contacted but the problem could not be resolved. Therefore this
feature was mentioned in the Silver Flag presentations but was not demonstrated. The
Silver Flag beddown plan scenarios did not require the use of GPS data.
4-6
4.1.8 Map and Report Format
GeoBEST produces preformatted maps and reports, which can be customized to
some degree by the user. One map and report feature that cannot be modified is
organizational titles and shields. GeoBEST was initially developed for use by units under
PACAF. The current version of GeoBEST has PACAF organizational shields and titles
on the maps and reports with no option of changing them. BTG has indicated that this
capability will be added to future versions (51).
4.1.9 Pre-Built Scenario Templates
The current version of GeoBEST comes with eighteen pre-made scenario
templates (minus any background themes) based on the dispersed facility layouts shown
in the Bare Base Conceptual Planning Guide, AFP AM 10-219, Vol. 5, Attachment 15
(17). Contemporary beddown planning rarely (if ever) involves using dispersed facility
arrangements. The needs of beddown planners would be much better suited by providing
non-dispersed arrangements. Throughout the course of this research, the most common
problem users had with GeoBEST is the lack of non-dispersed facility templates,
particularly personnel housing.
4.1.10 Closing Scenarios
When closing scenarios in GeoBEST, a box appears on the screen giving the user
the option of saving the current scenario, closing the scenario without saving, or keeping
the scenario open. This feature is not unusual, however, the box appears regardless if the
scenario has been changed or not. Most programs only present this option when changes
4-7

have been made to the object (document, session, spreadsheet, etc.). This is only a minor
inconvenience.
4.1.11 Low Inventory Notification
When allocating assets, GeoBEST checks the current asset inventory and
compares it to the amount allocated in the scenario. If the allocated amount is greater
than or equal to the inventory number for the selected asset, a dialog box appears
reminding the user to increase the inventory. The box must be closed before continuing
with any operations. Normal use of GeoBEST involves frequently switching between
various assets. Having to close this box every time a fully allocated asset is selected is
tedious. Also, the box sometimes appeared even when there was inventory available for
allocation. The low- inventory notification is necessary, however the best time for it to
appear is only when the user attempts to allocate an asset with zero inventory.
4.1.12 Scaling Imagery
GeoBEST includes the ability to scale imagery themes (e.g. Mr. SID, JPEG,
BMP, etc.). The user first selects which units to work in (GeoBEST works with feet and
meters) and then scales the image based the known dimensions of an object in the image.
This could be a building, a runway, or even a single image pixel (if the resolution is
known). Scaling is accomplished by first clicking the "Scale Image" button on the
Arc View screen. This button only appears if the image theme is selected. After clicking
the button, the user defines a rectangle on the image for which the dimensions are known
by first selecting one corner, for instance the northwest corner of a building. A dialog
4-8
box then appears indicating that the first point has been selected. The user then selects
the next point to define the rectangle, in this case the southeast corner of the building. A
dialog box then appears prompting the user to enter the dimensions of the rectangle.
GeoBEST then uses this information to rescale the image. This feature works very well,
however when the "Scale Image" button is clicked, there is nothing to indicate what the
user should do. A dialog box with basic instructions would be helpful.
4.1.13 Summary of Researcher's Evaluation
Some of the GeoBEST problems indicated above are minor irritants while others
seriously affect the usefulness and ease of use of the program. On 11 Jan 02, the primary
GeoBEST programmer was contacted again to see what changes were planned for the
next release of GeoBEST, scheduled for the end of January, 2002. Although the basic
function and appearance remains the same, several changes have been made to the
program. The most significant change is the replacement of Arc View 3.2 with another
GIS program from ESRI called ArcGIS. According to the programmer, this change has
resulted in dramatic improvement of the GeoBEST functions and elimination or
significant improvement of most of the aforementioned problems (51). A copy of the
updated version could not be obtained in sufficient time for a more detailed description
for this research.
4.2 Results from Silver Flag
Four separate Silver Flag classes were used to implement the TAM for this
research. The classes began on 16 Sep 01, 14 Oct 01, 24 Oct 01, and 4 Nov 01. The
4-9

following sections will discuss pertinent details from each of these classes followed by a
presentation of the study group demographics.
4.2.1 16 Sep 01
Due to travel restrictions imposed after the September 11th terrorist attacks,
several teams scheduled for Silver Flag this week were forced to cancel their attendance.
The class size for the GeoBEST presentation was anticipated to be 15-20 students. This
week's class size was 9. Two desktop computers were provided by the Tyndall AFB
Communications Squadron. GeoBEST was loaded on these machines and they were
prepared for the students to use during the presentation. GeoBEST was also loaded onto
the computer used by the cadre for their lessons. The GeoBEST presentation duration
was approximately 65 minutes, followed by the students completing the initial survey.
Five Silver Flag instructors and the commander were present for the presentation. During
the beddown planning periods (Mon night, Tues afternoon and night, and Wed
afternoon), the researcher was present to offer assistance to students using GeoBEST.
Two students attempted to use GeoBEST, but by Tuesday night, they had not made
significant progress and decided to abandon the program in favor of AutoCAD, which all
of the EA's and some of the officers were familiar with. The student's beddown plan
was briefed on Wednesday afternoon but it did not contain any GeoBEST products (e.g.
maps, imagery, reports, etc.). All nine students completed the follow-up survey and the
researcher departed the following morning. No cadre surveys were administered during
this class. The borrowed computers were disassembled and returned.
4-10

4.2.2 14 Oct 01
This week GeoBEST was presented to 18 students. Three desktop computers
were provided by base communications squadron. One of the students attempted to use
the program. No GeoBEST products were used for the beddown plan. All 18 students
completed the follow-up survey and there were no cadre surveys administered.
4.2.3 24 Oct 01
This week's class size was 19 students. The desktop computers used previously
were not available, so three laptops were borrowed from the cadre. Unlike previous
attempts to use laptops, GeoBEST was fully operational on these machines, despite two
of them being significantly older (Windows 95 OS). One of the students attempted to use
GeoBEST. Again, no GeoBEST products were used for the beddown plan. All students
completed the follow-up survey and no cadre surveys were administered.
4.2.4 4 Nov 01
For the first three classes, no meaningful information was obtained from the
follow-up surveys because of the very low usage of GeoBEST by the students. The
evaluation plan for the final class was modified, removing the follow-up survey entirely.
The presentation and initial survey were given as planned. Three questions that were on
the follow-up survey were added to the initial survey. These are "What features of
GeoBEST do you like the most?", "What features of GeoBEST do you like the least?",
and "What suggestions do you have for future improvement of GeoBEST?"
4-11

This week's class size was 25 students. Two of the laptops used in the previous
class were used this week. The cadre survey was administered to the four instructors who
attended the presentation at least once and to the commander who attended the first
presentation. Four of the cadre surveys were returned. The researcher departed
following the initial survey. The cadre instructors decided to leave the GeoBEST laptops
in place for any students that desired to use them.
4.2.5 7 Nov 01
Following the last Silver Flag class, there was an opportunity to give the
GeoBEST presentation to the Management 101 class at the AFIT Civil Engineer and
Services School, Wright-Patterson AFB, OH. The class consisted of 45 company-grade
CE officers. Due to time constraints and problems with the presentation computer (errors
not encountered before), only about 50% of the GeoBEST features normally presented
could be shown to this class. The students completed the initial survey, but none of the
data were used for this research.
4.3 Silver Flag Demographics
The final Silver Flag sample size was 71 students and 4 cadre members. Half of
the students were on active duty, with 20% reserve and 30% Air National Guard. The
service branch composition for the students is shown in Figure 4-3, with USAF
comprising 90% of the total.
4-12

70-
60-
64
50- t/>
1 40-
3 30- w
20-
10- 3 4 1 1 o -l
USAF USMC
Service Branch
Canadian
Figure 4-3: Service Branch Composition
The original intent for this research was to focus on the perceptions of base level
beddown planners, which is typically Company Grade Officers and NCO's/Airmen.
Figures 4-4 and 4-5 show the USAF enlisted and officer rank distribution of the sample.
Amn A1C SrA SSgt TSgt MSgt SMSgt CMSgt
Enlisted Rank
Figure 4-4: Enlisted Rank Distribution (USAF only)
4-13

A large percentage of the enlisted sample was composed of Senior NCO's
because many of the students were from Guard or Reserve units, which typically have
higher ranks than Active Duty units. Also these numbers include enlisted students who
are grouped with the officers in the Command and Control classes (e.g. First Sergeant,
Fire Chief, etc.), which are typically higher ranking students.
Figure 4-5 shows the Silver Flag AF officer rank distribution. The sample
included a higher percentage of Field Grade officers than originally intended. This was
largely due to the percentage of Guard and Reserve units attending.
10 I
9- 9
8- 7 ■
» K ■*-» D ' C
■a ö
5 4. CO *
3-
6
3
I 1
5 5
2 -
1 - u 2Lt 1Lt Capt
Officer Rank
Maj Lt Col
Figure 4-5: Officer Rank Distribution (USAF only)
The primary intended users of GeoBEST are AF CE officers and Engineering
Assistants. Figure 4-6 shows that 39% of the 64 USAF students were officers and 33%
were EA's. The remaining 28% was composed of 10 enlisted Operations Controllers and
8 others, primarily Senior NCO managers.
4-14

30 -|
25-
„ 20- c o ■a 15- 3
55 10-
5"
25
21
10 a
o -I Officer Eng Assist Ops Cntrl Other
AFSC (AF only)
Figure 4-6: Student AFSC
The Silver Flag student demographics do not represent the ideal situation
originally desired for this research. First, the rank distributions were significantly heavier
in the higher ranks than the desired company-grade officers and NCOs/Airmen. Second,
a significant percentage of the students were not either a CE officer or Engineering
Assistant. For these differences, it is anticipated that the AFSC difference will have a
significant effect on the TAM results. Analysis of variance (section 4.7) will provide
these answers. At the very least, it is profitable to get the perspective of seasoned officers
and Senior NCO's on new systems and ideas.
4.4 TAM Analysis
The student surveys contained fourteen questions developed and validated by
Davis for measurement of the four TAM variables (Table 4-1) (13). The questions are
answered on a 7-point Likert-scale, with a score of 7 being the most positive response.
Table 4-1 summarizes the twelve TAM questions, sorted by the construct they are
designed to measure.
4-15

Table 4-1: TAM Construct Items Construct ";V:#;;; 1 AM Slalcmciil
Perceived Ease of Use
15 Learning to operate GeoBEST would be easy for me. 19 I would find it easy to get GeoBEST to do what I want it to do. 23 It would be easy for me to become skillful at using GeoBEST 25 I would find GeoBEST easy to use.
Perceived Usefulness
16 Using GeoBEST would improve my performance as a beddown planner. 20 Using GeoBEST would increase my productivity as a beddown planner. 24 Using GeoBEST would enhance my effectiveness in beddown planning. 26 I would find GeoBEST useful for beddown planning.
Attitude Towards Using
13 Using GeoBEST is a (good/bad) idea. 17 Using GeoBEST is a (wise/foolish) idea. 21 I (like/dislike) the idea of using GeoBEST. 22 Using GeoBEST would be (pleasant/unpleasant).
Behavioral Intentions to Use
14 I intend to use GeoBEST for beddown planning. 18 I intend to use GeoBEST frequently for beddown planning.
Table 4-2 displays the average score for each of the items and then for each
construct. The item scores are the average student response to the statements in Table 4-
1 on the 7-point Likert Scale. For example, the average student response to item 14, "I
intend to use GeoBEST for beddown planning," was 5.09. The possible responses for
this item ranged from Strongly Disagree (score = 1) to Strongly Agree (score = 7). The
construct score is the average of the item scores for that construct. For example, the
construct "Perceived Usefulness" had item scores of 5.90, 5.55, 5.80, and 6.00, which
average to 5.81.
Scores higher than 1.00 and lower than 4.00 are considered negative responses,
scores higher than 4.00 but less than 5.00 are considered neutral, and scores higher than
5.00 are considered positive. EOU, USE and A all scored well within the positive region,
while BI scored technically neutral, but was very close to the positive region. Reliability
analysis will determine the consistency of the student responses. Exploratory Factor
Analysis will examine the data for factors, or constructs, as a means of verifying the
4-16

structure of the TAM. Multiple Regression will be done to examine the quality of the
variable inter-relationships. Analysis of variance will then be conducted to see if these
score were influenced by certain external variables such as AFSC and perception of the
training program quality.
Table 4-2: TAM Item and Construct Scores
Construct ";#" Item Score (onslriict Score
Perceived Ease of Use
15 5.39 5.32 19 5.03
23 5.51 25 5.35
Perceived Usefulness
16 5.90 5.81 20 5.55
24 5.80 26 6.00
Attitude Towards Using
13 6.39
6.03 17 6.15 21 6.15 22 5.44
Behavioral Intentions to Use
14 5.09 4.97 18 4.84
4.4.1 Reliability Analysis
Reliability analysis (see section 3.2.5.1) was performed on the TAM data as a
check for internal consistency. The results of this analysis are shown in Table 4-3. Each
construct received a score greater than 0.85, which is well above the minimum of 0.7
recommended for psychology-based research (8). It is concluded that the questions
shown in Table 4-1 are internally consistent, and therefore reliable.
4-17

Table 4-3: Reliability Analysis Construct C'ronhach's Alpha
Perceived Ease of Use (EOU) 0.92 Perceived Usefulness (USE) 0.89 Attitude Towards Using (A) 0.86 Behavioral Intentions to Use (BI) 0.87
4.4.2 Factor Analysis
The next portion of the analysis was done using exploratory factor analysis in
SPSS (see section 3.2.5.2). The twelve items for perceived ease of use (EOU), perceived
usefulness (USE), and attitude towards using (A) were analyzed. Items measuring
behavioral intention (BI) were not included because it is the dependent variable in the
TAM and including it in this analysis would not yield useful information because it is
highly correlated with each of the other constructs. Ideally, factor analysis would
identify three distinct factors having eigenvalues greater than one with strong loadings
(greater than 0.4) on their respective constructs. The results of this analysis are shown in
Table 4-4.
Two factors were extracted with eigenvalues greater than 1, meeting the Kaiser
Criterion (35). The EOU items all loaded on the second factor, while all but one of the
USE and A items loaded significantly on the first factor. Item 22, "Using GeoBEST
would be (pleasant/unpleasant)," was found to cross load on both factors, which was also
observed in the literature (29:62). It is noted that the USE item loadings range from
0.435 to 0.762, while the A item loadings (excluding 22) ranged from 0.933 to 0.96,
indicating a significant grouping with the construct A within the extracted factor.
4-18

Table 4-4: Factor Analysis Results
Construct Item
# Factor 1
Eigenvalue ==7.15 1-actor 2
l-!iticn\iiluc 1 .SS
Perceived Ease of Use
15 -0.15 ()})(•>
19 0.11 0.S2 23 0.00 O.SS 25 0.00 ().l>4
Perceived Usefulness
16 0.71 0.23 20 0.62 0.32 24 0.44 0.54
26 0.76 0.17
Attitude Towards Using
13 ().l>3 -0.12 17 ().l>4 0.00 21 ().% 0.00 22 0.3 1 0.55
Extraction methoc : Principal Component Analysi s Rotation method: Oblimin with Kaiser Normalization (8 interations)
The purpose of this research was to implement the TAM as opposed to analyzing
the model for improvement. Therefore, even though this analysis could not clearly
distinguish between USE and A, this study will continue to make a distinction and treat
them as two separate constructs. The results of this factor analysis are not ideal, however
they are not skewed to the point that one would question the validity of the model either.
The way the items loaded against one factor or the other could be due to the small sample
size.
4.4.3 Regression
Multiple regression (see section 3.2.5.3) was used to examine relationships within
TAM. The three hypothesized relationships from the model are (1) BI = A + USE, (2)
4-19

A = USE + EOU, and (3) USE = EOU. Table 4-5 displays the regression results and is
followed by a discussion of each relationship.
Table 4-5: Multiple Regression Results
R2 Beta 1. BI = A + USE 0.39
A 0.29 USE 0.38
2. A = USE + EOU 0.61 USE 0.77
EOU 0.03 3. USE = EOU 0.44
EOU 0.67
4.4.3.1 Behavioral Intention
TAM explained a very significant proportion of the variance in BI (R2 = 0.39). In
other words, a manager faced with the decision of whether or not to implement this
software could look at the score for BI (from Table 4-2 = 4.97) and be very comfortable
in saying this number reflects the true intentions of the test subjects. USE had a strong
effect (Beta = 0.38) while A had a slightly smaller effect (Beta = 0.29). With a score of
4.97 (rounded to 5.0 = "slightly agree" on the Likert scale) these results support a strong
prediction of marginal usage of GeoBEST by the Silver Flag students. Analysis of
variance is conducted to check for external variable effects (section 4.5.4).
4-20

4.4.3.2 Attitude Towards Using
Regression analysis of A and USE is done to examine the internal workings of the
TAM. TAM explained a large proportion of the variance in A (R2 = 0.61). It is
interesting to note that USE was found to be highly correlated with A (Beta = 0.77) while
EOU had an insignificant relationship (Beta = 0.03). This observation was also made by
Davis, Bagozzi, and Warshaw in their comparison of TRA and TAM (USE Beta = 0.61,
EOU Beta = 0.02) (13:992).
4.4.3.3 Perceived Usefulness
When examining the relationship between USE and EOU, a very significant
difference was found between the results found in this research and those found in the
literature. Davis, Bagozzi, and Warshaw found that the TAM explained only 1% of the
variance in USE (Beta = 0.10) (13:992), and Morris and Dillon found that the TAM
explained only 4.7% of the variance (Beta = 0.098) (29:63). This research found a much
stronger relationship between USE and EOU, with the TAM explaining 42% of the
variance in USE (Beta = 0.65). The cause of this difference in unknown.
4.4.3.4 Actual Usage
The original intention for this research was to validate the TAM results from the
initial surveys by administering a follow-up survey after the beddown planning period to
again measure the TAM variables and to measure actual system usage. This was not
possible because so few students actually tried to use the system. This does not
4-21

invalidate the initial TAM results, although much information could be gained from
TAM results following actual usage of the system.
4.4.4 Analysis of Variance
Several questions in the student surveys were intended to elicit responses that
could be used to determine whether their perceptions of GeoBEST could be related to
other variables external to the TAM. These include the following: (1) Air Force
Specialty Code, (2) attitude towards using computers, (3) past or current beddown
planning frequency, (4) perceived personal beddown planning skill, (5) qualitative
assessment of the introductory training, and (6) level of preparedness to begin using
GeoBEST. The student's responses to the TAM questions are examined to see if there is
a significant difference between student perceptions of GeoBEST when grouped by these
external variables.
4.4.4.1 Air Force Specialty Code
The primary intended audience for this research was base level CE officers (32E)
and EA's (3E5). However, 28% of the sample did not meet this criterion. These were
enlisted CE operations controllers (3E6) and various senior enlisted CE managers
(Operations Superintendent, First Sergeant, Fire Chief, etc.). Table 4-6 shows the
analysis of variance for students grouped by Officer/EA, and other AFSC's.
4-22
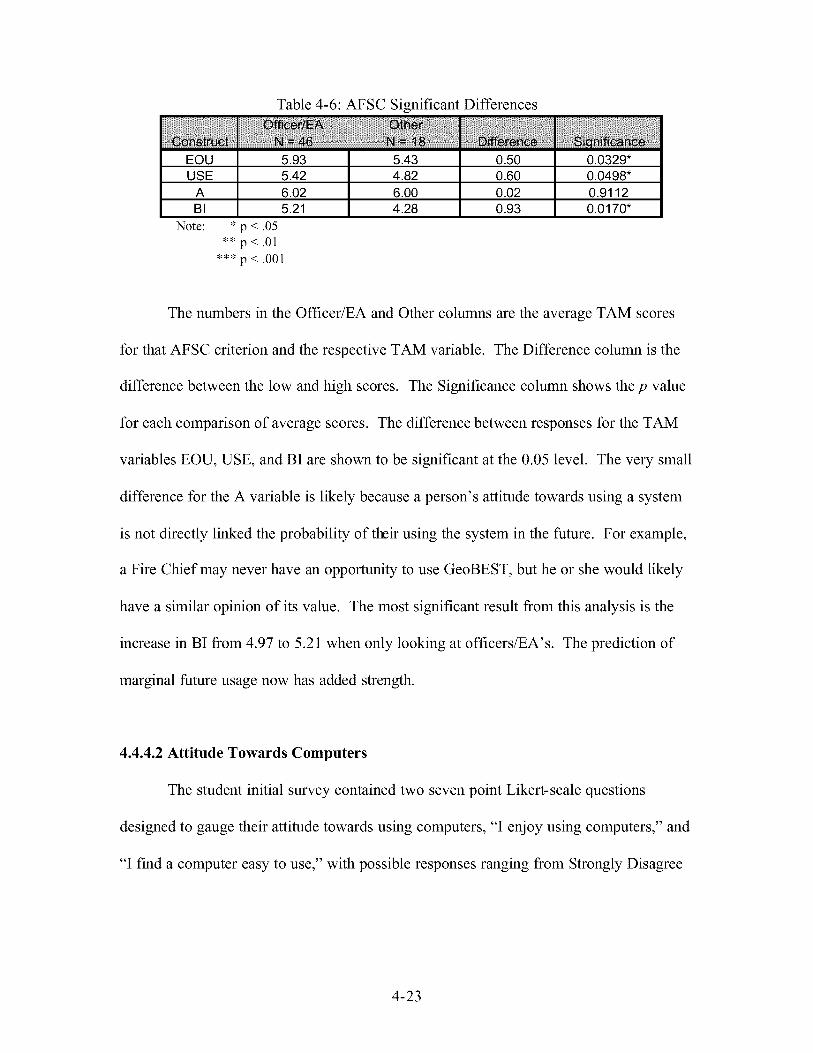
Table 4-6: AFSC Significant Differences
Construct Officer/EA Other
N = 46 N = 18 Difference Significance EOU 5.93 5.43 0.50 0.0329* USE 5.42 4.82 0.60 0.0498*
A 6.02 6.00 0.02 0.9112 Bl 5.21 4.28 0.93 0.0170*
Note: * p < .05 ** p<.01
***p<.001
The numbers in the Officer/EA and Other columns are the average TAM scores
for that AFSC criterion and the respective TAM variable. The Difference column is the
difference between the low and high scores. The Significance column shows the p value
for each comparison of average scores. The difference between responses for the TAM
variables EOU, USE, and BI are shown to be significant at the 0.05 level. The very small
difference for the A variable is likely because a person's attitude towards using a system
is not directly linked the probability of their using the system in the future. For example,
a Fire Chief may never have an opportunity to use GeoBEST, but he or she would likely
have a similar opinion of its value. The most significant result from this analysis is the
increase in BI from 4.97 to 5.21 when only looking at officers/EA's. The prediction of
marginal future usage now has added strength.
4.4.4.2 Attitude Towards Computers
The student initial survey contained two seven point Likert-scale questions
designed to gauge their attitude towards using computers, "I enjoy using computers," and
"I find a computer easy to use," with possible responses ranging from Strongly Disagree
4-23

to Strongly Agree. Table 4-7 summarizes the number of student responses to these
questions.
Table 4-7: Student's attitude towards computers.
Response
"1 enjoy using
computers."
"I find a computer
easy to use."
Stronqly Aqree 25 21 Aqree 37 37 Sliqhtlv Aqree 5 9 Neutral 4 2 Sliqhtlv Disaqree 1 2 Disaqree 0 0 Strongly Disagree 0 0
The responses were examined to identify two or more distinct grouping of
responses for comparison. The responses could be divided into three groups, high (st.
agree, agree, and si. agree), neutral (neutral), and low (si. disagree, disagree, and st.
disagree). As a rule of thumb, this type of analysis requires at least five responses in each
group. As seen in Table 4-7, both of the lowest categories on both questions received
zero responses, making it impossible to meet the size requirement. Therefore, it is
concluded that the entire student sample has similar attitudes towards using computers,
with variance being insignificant.
4.4.4.3 Beddown Planning Frequency
The next area for analysis is the frequency with which the students are required to
produce or contribute to portions of a beddown plan. The students were asked, "In
general, how often are you required to produce beddown plans (or contribute to portions
of a plan)," with responses Never, Rarely, Occasionally, and Frequently. In retrospect,
4-24

the researcher believes that defining the categories (e.g. Rarely = 1 plan/3 years) would
have made for a more meaningful analysis. Figure 4-7 summarizes the responses to this
question.
40 -1
35-
30-
<2 25-
■g 20- 3
55 15-
34
28
10-
5- 5
I I 4
1 1 0 -I i i i
Never Rarely Occaisionally
Beddown Planning Frequency
Frequently
Figure 4-7: Perceived Beddown Planning Frequency
The responses are divided into two broad frequency categories, Low (Never and
Rarely) and High (Occasionally and Frequently). The results are shown in Table 4-8.
Table 4-8: Beddown Planning Frequency Significant Differences
Construct Low High
N = 31 N = 33 Difference Significance EOU 5.15 5.36 -0.21 0.4528 USE 5.72 5.86 -0.14 0.5180
A 6.09 5.95 0.14 0.4177 Bl 4.79 5.09 -0.3 0.3999
Note: * p < .05 ** p < .01
*** p < .001
4-25

Each of the significance levels in Table 4-6 is greater than 0.05. Therefore, an
individual's beddown planning frequency does not have a significant effect on their
perceptions of GeoBEST, relative to the TAM constructs.
4.4.4.4 Beddown Planning Skill
To measure a students perceived personal beddown planning skill level, they were
asked "How would you describe your personal level of beddown planning ability," with
responses No ability, Novice, Intermediate, and Expert. Figure 4-8 summarizes
responses to this question.
40 n 38
35"
30- 26
| 25" 0) -o 20- 3
55 15-
10-
5"
7
0 u ' ■ i 1
No Ability
E
Movice Intermediate
Jeddown Planning Skill
Expert
Figure 4-8: Perceived Personal Beddown Planning Skill
Again, the responses are divided into two broad skill categories, Low (No Ability
and Novice) and High (Intermediate and Expert). The results are shown in Table 4-9.
4-26

Table 4-9: Beddown Planning Skill Significant Differences
Construct Low High
N = 45 N = 26 Difference Significance EOU 5.23 5.47 -0.24 0.3817 USE 5.74 5.93 -0.19 0.3603
A 6.07 5.96 0.11 0.5183 Bl 4.78 5.31 -0.53 0.1221
Note: * p < .05 ** p < .01
*** p < .001
As indicated by the significance levels in Table 4-9, an individual's perceived
personal beddown planning skill does not have a significant effect on their perceptions of
GeoBEST.
4.4.4.5 Introductory Training Quality
A review of the available literature regarding information system acceptance
reveals little concerning the quality of the training given to the prospective users, on
which their perceptions are partially based. This is especially significant considering the
TAM is designed to be a parsimonious tool for managers, requiring only a short (one
hour) introductory presentation and questionnaires (13:1000). Torkzadeh and Dwyer
suggest, on the basis of their data, that user training influences acceptance by affecting
satisfaction and user confidence (39). Their study, however, was conducted outside of
the TAM, TRA, and TPB frameworks (21:14). It is hypothesized here that the user's
perceived quality of the training program used to implement the TAM has a significant
effect on that user's responses to the TAM variables.
The Silver Flag students were asked two questions on the initial survey to gauge
their perceptions of the introductory GeoBEST presentation. The first was "How would
4-27

you describe the introductory training you just received on GeoBEST?", with responses
Useless, Insufficient, Adequate, Useful, and Very Useful. Figure 4-9 shows the student's
responses to this question.
30-
25"
28
Stu
dents
O
Ul
o
16 15
11
5- 1
0 H ■ i i 1 ■
Useless Insufficient Adequate Useful Very Useful
Perceived Quality
Figure 4-9: Perceived Quality of GeoBEST Training
Analysis was done to determine whether a student's qualitative perception of the
GeoBEST training program affected how they perceive the software itself. The
responses in Figure 4-9 are arranged in three quality groups, Poor (Useless and
Insufficient), Adequate (Adequate), and High (Useful and Very Useful). Oneway
ANOVA results are shown in Table 4-10.
4-28

Table 4-10: Training Quality Significant Differences
Construct Poor
N = 17 Adequate High
N = 15 N = 39 Difference Significance
EOU 5.00 5.40 -0.40 0.2515 5.00 5.43 -0.43 0.1889
5.40 5.43 -0.03 0.9330
USE 5.49 5.83 -0.34 0.2385 5.49 5.95 -0.46 0.0526
5.83 5.95 -0.12 0.6505
A 5.69 5.95 -0.26 0.3476 5.69 6.21 -0.52 0.0087**
5.95 6.21 -0.26 0.1587
Bl 4.21 5.07 -0.86 0.1078 4.21 5.27 -1.06 0.0071**
5.07 5.27 -0.20 0.6061 Note: *p<.05
** p < .01 ***p<.001
The ANOVA results in indicate very significant differences for Attitude Towards
Using (A) between the Poor and High groups (p = 0.0087) and for Behavioral Intention
to Use (BI) between the Poor and High groups (p = 0.0071). These results support the
hypothesized relationship between perceived training quality and TAM responses.
However, it is inappropriate to conclude that training quality is the only factor affecting
the user's perceptions.
The second question used to gauge qualitative perception of the training program
is "How would describe you personal level of preparedness to begin using GeoBEST?",
with six available responses ranging from Very Unprepared to Very Prepared. The
student responses are summarized in Figure 4-10.
4-29

35
30
25 in
I 20
I15
10
5
0
32
17
Very Unprepared Slightly Slightly Prepared Very Unprepared Unprepared Prepared Prepared
Perceived Preparedness
Figure 4-10: Student Preparedness to Use GeoBEST
Analysis was done to determine whether a student's perceived preparedness to
begin using the software could affect how they perceive the software itself, with regard to
the TAM variables. The responses in Figure 4-10 are arranged in three preparedness
groups, Low (Very Unprepared and Unprepared), Medium (Slightly Unprepared and
Slightly Prepared), and High (Prepared and Very Prepared). ANOVA results are shown
in Table 4-11.
Table 4-11: Pr sparedness Signifi cant Diff srences
Construct N = 23 Med
N = 35 High
N = 12 Difference Significance
EOU 4.51 5.54 -1.03 0.0002*** 4.51 6.19 -1.68 0.0001***
5.54 6.19 -0.65 0.0161*
USE 5.3 5.93 -0.63 0.004** 5.3 6.49 -1.19 0.0003***
5.93 6.49 -0.56 0.0175*
A 5.83 5.98 -0.15 0.4133 5.83 6.58 -0.75 0.0044**
5.98 6.58 -0.60 0.0026**
Bl 3.87 5.23 -1.36 <.0001*** 3.87 6.33 -2.46 <.0001***
5.23 6.33 -1.10 0.0024** Note: 1 p < .05
1 p<.01 1 p < .001
4-30
Preparedness means comparison shows by far the most significant results. All but
one of the tested differences is at least significant at the 0.05 level, with five of the twelve
being significant at the 0.001 level. The reasons for this are unknown. It is sufficient to
conclude in this research that user's who do not feel confident in their ability to begin
using a system will have significantly lower intentions to use the system in the future.
4.5 Qualitative Feedback
The Silver Flag surveys contained several questions requesting qualitative
feedback on the training program and on GeoBEST. Following are a sampling of the
responses to these questions. A complete list of responses can be found in Appendices B
and C. Responses from the students are followed by cadre responses.
4.5.1 "Do you have any recommendations for improving the training?"
STUDENT Allow a longer block of time. One hour was not enough. If it is to be used Air Force wide, more than one hour of training is needed. Deploy to Air National Guard sites for use/feedback. Demonstrate where the database data is located within the Technical Orders. Prove to the audience that the numbers are accurate. Increase the time to four hours minimum. Good presentation. Individual access to the program for each candidate would be nice. Formalize into required training. I believe that a background in GIS would be necessary to fully appreciate this software. Could have a representative from the contractor present for questions.
CADRE GeoBEST is very similar to AutoCAD and there's just not enough time for the student hands-on required to learn the system. Recommend this be primarily a home station training requirement, but that we include GeoBEST orientation at Silver Flag.
4-31

Familiarization training is good for "gee whiz" info...I can imagine that training held for actual usage of software would be quite entailed. Need more in-depth training and practice time for students. Really, the only thing I would change would be switching the "fly- by" command to an "undo" command. Fly-by is a nice visual to have, but undo would get a lot more use.
4.5.2 "What features of GeoBEST do you like the most?"
STUDENT 3D and programming. With 3D you can see it in a cool way. Programming is good for those who start OJT. It has everything you need to know for starters there. The ability to put down the number of aircraft you need to support and the program producing all the assets needed for the deployment. The siting and rotational capability. I like the overall capability of GeoBEST because it has a lot of range on layouts and scenarios. Less complicated to work with than AutoCAD.
- Not familiar with program. Only saw the introduction to it. Seems like an excellent tool though. The intelligence and user friendly controls of the program The program works with you tracking your design and assisting in correct beddown planning procedures. Without actually trying GeoBEST I find it hard to provide an accurate description of what I would use it for and how easy it would be to use.
CADRE It is a very USEFUL tool - once you know how to use it. It makes beddown planning faster/easier. Tracking of assets and ensuring proper distances between facilities/groups. Automatic tracking of placed assets. 3D is always nice when presenting presentation to be briefed.
4.5.3 "What features of GeoBEST do you like the least?"
STUDENT Due to being unfamiliar with GeoBEST it was more time consuming than the traditional methods for the exercise. Functions. Unlike AutoCAD, you can't type in what you want to do. You have to drag/click. That takes up too much time. Requirements of putting drawings to scale in feet or meters. Using AutoCAD drawings in different units would allow for use during this exercise. Would not correct siting mistakes [referring to constraints analysis].
4-32
3D fly-by feature is one-speed, making this feature useless. - Not able to generate any limfacs/shortages.
It seems like it would take a lot of training to get efficient with the program. One would need to master Arc View to properly use this program.
CADRE The menus and icons are difficult to navigate because they're not "standard" (like other operating systems). It takes too many "clicks" to open a file to work in.
- No preset facility groups (such as 24-tent non-dispersed layout)
4.5.4 "What suggestions do you have for future improvements of GeoBEST?"
STUDENT When copying an object, allow the user to paste the object where they would like to, not on top of the old one. Adapt it to the different services. Add aircraft templates and dimensions (wingspan, height, etc.). Hope to get full-blown training before this gets implemented. Make it much more user- friendly prior to fielding. Also make sure that Harvest asset packages are not modified/obsolete prior to fielding this software. Be able to integrate with AutoCAD more easily and effectively. After notifying you of spacing conflicts, it should automatically resolve the problem, or ask you if you want to solve them. I would like to see some capabilities expanded. Ease of conversion of units, importing AutoCAD and Microstation smart maps and any associated information.
CADRE Move more towards point-and-click options instead of all the pull down menu options. PLEASE give me an "undo" button.
- Need groups of structures in non-dispersed layout. Have a command of an option that will let you place entire Temper Tent and Alaskan Small Shelter block (I don't recall there being one.)
4.5.5 "Do you have any additional comments?"
STUDENT Extremely useful program for more than just beddown planning. It would take some time, but I would learn to use this program.
4-33

Will be very useful when some of the glitches are worked out. The lesson was good for the amount of time slated. Send a trial copy to EA's at the bases. They are the ones that will be using it the most. If we (the base level engineers) are to use this program, then an all- inclusive software package should be sent. Based on the short intro I think it will be an excellent tool, as long as adequate training is available along with the software. It's difficult to say how easy it will be to learn based on such a short intro. Capt Jensen was a great teacher for such a short time period. Thanks!
CADRE I think this system will prove very useful once it's implemented. Officers/EA's in the field just need a good solid week of training on it before they can use it effectively. Great beddown tool once all units get incorporated. The entire class was great! Capt Jensen did an outstanding job!
After examining the student and cadre responses, several themes became evident.
These are summarized below:
The one-hour introductory training was insufficient if the students were expected to use GeoBEST for their beddown plan.
- Not only does the training need to be much longer, there needs to be more opportunity for hands-on experience, with a separate computer for each student. GeoBEST contains many tools that have more gee-whiz potential than actual usefulness. GeoBEST is an assortment of possibly useful tools, provided that the program errors are corrected and the users are provided with adequate training. The conditions for using GeoBEST at Silver Flag made other planning options more appealing and feasible (eg. "stubby-pencil," AutoCAD, etc.).
4.6 Summary
GeoBEST was thoroughly explored prior to presentation at Silver Flag and was
found to have some serious internal problems. The student presentation was modified in
order to avoid these known problems, which likely skewed the results in favor of
GeoBEST. Installing GeoBEST on various computers was often problematic. Errors
4-34

were encountered that prevented any kind of use of the program, even after reinstalling.
The TAM was implemented and the result was a strong prediction of slightly likely future
usage of the tested version of GeoBEST by CE officers and Engineering Assistants.
However, these results are very likely inaccurate because the students did not have much
time to actually use the program, during which they would have encountered the known
problems. The qualitative feedback indicates that the students and cadre value the tools
and capabilities provided by GeoBEST, but they also have many problems they would
like to see resolved first. The current version of GeoBEST is broken, but it does provide
a good view of capabilities that CE beddown planners will hopefully see in future
versions of the software. The implications of these and other findings will be discussed
in greater detail in the following chapter.
4-35

V. Conclusions
5.0 Introduction
The purpose of the conclusions chapter is to summarize the research, to examine
the implications of significant findings, to address the research limitations, and to identify
opportunities for future research. The TAM results are summarized as well as some
implications for future use of the TAM. Also discussed are implications for future
implementation of GeoBEST.
5.1 Summary of Research
Base level Civil Engineering officers and Engineering Assistants have
responsibilities in development of contingency beddown plans that could be assisted by
products that include geographic information technology, such as GeoBEST. Prior to its
implementation Air Force-wide, GeoBEST needs to be thoroughly evaluated under
realistic beddown planning conditions, using subjects that are prospective future users of
the program.
These conditions were met through implementation of the Technology
Acceptance Model at the Silver Flag contingency skills training site. Seventy-one CE
personnel were given a one-hour interactive presentation of GeoBEST and were then
given a survey to measure their perceptions of the software using the TAM and
qualitative feedback. These results were analyzed and the TAM provides a strong
prediction of marginal future usage of GeoBEST by officers and EA's. This result is
especially significant considering the fact that the majority of the students did not
5-1
actually use the program, and their perceptions were based solely on the initial
presentation. It is anticipated that the TAM would have predicted a much lower
likelihood of future usage had more students been exposed to the program's flaws.
This research attempted to validate the prediction made by the TAM data from the
initial survey by defining a system usage period and administering a follow-up survey.
This attempt failed for primarily one reason—task saturation. Producing a detailed
beddown plan is an intensive, laborious, time-consuming process. The Silver Flag
schedule requires this to be done within a couple of days, minus classroom instruction
time. A more realistic usage period for evaluation of GeoBEST would be on the order of
a year, after the students have had an opportunity to use GeoBEST for multiple plans
such as base exercises and/or real-world deployments. Nevertheless, the failure of the
validation attempt does not invalidate the initial TAM results, which are based entirely on
initial perceptions and the brief introduction to the system. However, much more
realistic data could have been gathered if the student's perceptions would have been
based on their own use instead of someone showing them what the program can do.
Analysis of variance tests were conducted to determine whether certain variables
external to the TAM had any significant effects on the user's responses to the TAM
questions. It was found that individuals who were not CE officers or EA's had
significantly different responses to the TAM questions. This result is predictable. The
students who were not officers or EA's would not likely have opportunity nor reason to
use GeoBEST in the future, therefore their perceptions of the program should be
somewhat different. Also, it was found that the perceived quality of the introductory
presentation had a significant effect on the TAM results while perceived preparedness to
5-2

begin using GeoBEST following the presentation had a very significant effect. These
results are in agreement with the qualitative feedback provided by the students and cadre
which focus heavily on the need for longer and more hands-on training before student's
could be expected to make productive use of GeoBEST.
The Joint Expeditionary Forces Experiment (JEFX) (see section 1.1) provided a
thorough analysis of GeoBEST under realistic usage conditions, although the analysis
was not complete due to the limited number of users, the lack of participation by base-
level planners, and the absence of acceptance theory testing. This research effort
addressed these limitations and the results act as a compliment to the JEFX results in
providing the necessary rigorous evaluation of GeoBEST.
5.1.2 Implications for GeoBEST Implementation
Several problems were encountered while using GeoBEST (see section 4.2).
Some of these were simply irritants while others were outright defects (bugs). Every
effort was made to avoid these bugs during the demonstrations, though some were
occasionally seen. This resulted in a limited presentation of the program, and for some
features, a failed presentation. Also, on several occasions, GeoBEST experienced errors
that caused the program to crash, and in some instances, prevented any use of the
program at all. This problem was particularly prevalent on laptop computers. The cause
of these errors and the other identified system flaws must be corrected if future users are
to have any confidence in the software.
A large percentage of the qualitative responses to this research mentioned the
need for more time and more hands-on training. Many of the students commented that
5-3

the GeoBEST presentation was a good introduction to the program, but they did not
consider it to be "training." Silver Flag sites at Tyndall AFB and overseas, as well as the
Air Force Academy, are in the process of developing a curriculum for GeoBEST
instruction. These sites would do well to allow at least one to two days minimum for
interactive lessons and hands-on experience with the system. Some of the Silver Flag
cadre members envision Silver Flag serving as introductory and refresher GeoBEST
training with primary training taking place at home station.
5.1.3 Implications for future use of the TAM
Most software programs available for evaluation using TAM are commercial off-
the-shelf and have already been rigorously de-bugged by the manufacturers. When
applying the TAM to software that is still being modified or tested, it is extremely
important to consider the effect on the TAM variables when users encounter system
flaws.
The user's perception of the training program quality does have a significant
effect on how they rate the TAM variables. Every effort should be made to make the
presentation clear, concise, and appropriate for the given audience. A computer for every
student would be ideal, though this is often not possible.
5.2 Limitations
Several factors were seen as limitations for this research. The time constraints of
the Silver Flag curriculum was a major limitation. The average presentation time was
approximately seventy minutes. While this met the requirements for implementing the
5-4

TAM, it was far too little exposure if the intention was to have the students use GeoBEST
for their beddown plan within the allotted preparation time. This short time frame also
prevented validation of the initial TAM results using the follow-up survey. The lack of
student usage also limited the amount of feedback they were able to provide on system
features. Most comments were based solely on what was seen during the initial
presentation.
The sample size of 71 was sufficient to accomplish the TAM analysis, however
only 46 of these were the primary intended audience of CE officers and EA's. Again,
this number meets the sample size criteria (35), however the reliability of the TAM
results, as with any statistical model, decreases as the sample size decreases. Also, the
perceptions of the non-officer/EA students were shown to have significant differences
(see section 4.7.1).
A third limitation was computer availability and computer problems. Ideally
every student would have had a computer to use during the presentation, whether it was a
PC or a laptop. As for computer problems, the initial trial run, where all three laptops
experienced different errors (discussed in section 3.2.4), was an example of the often
unpredictable behavior of GeoBEST when installed on laptops. Problems were certainly
not limited to laptops. While presenting GeoBEST to the AFIT CESS Mgt 101 class (see
section 4.3.5) on 8 Nov 01 using a desktop computer, errors occurred which did not allow
several of the program features to be demonstrated. Although these students completed
the initial survey, the data was not included in this research.
5-5

5.3 Opportunities for Future Research
As the problems addressed in this research are corrected and GeoBEST continues
to mature using the new ArcGIS technology (see section 4.2.13), the program should be
evaluated again to examine its new capabilities and features. The TAM is an effective
tool for performing this evaluation, though a longer usage period is recommended to take
advantage of feedback that can be provided only after first-hand use of the system. It is
possible that a bug-free version of GeoBEST would score low on behavioral intentions.
The lessons learned from this research certainly require that this follow-on analysis take
place for the latest version of GeoBEST.
GeoBEST is a small piece of the GeoBase initiative. New technologies are
continually being introduced that could benefit from acceptance theory testing. Outside
the realm of evaluating software, implementing the GeoBase initiative presents a
multitude of information management issues that could be addressed through scientific
research.
5.4 Final Comments
The purpose of this research was to provide a thorough evaluation of GeoBEST
using base level CE officers and EA's in a realistic beddown planning scenario. This
plan was accomplished, though not as originally intended. Several problems were
identified with the program that limited the researcher's ability to fully present it to the
Silver Flag students. Perhaps the most significant problems were the GeoBEST
program's inability to consistently track assets within the scenarios, and the unpredictable
behavior of the program on different computers. The Technology Acceptance Model was
5-6

implemented using the initial presentation and survey. Despite current problems with
GeoBEST, the model was able to provide a strong prediction of the student's behavioral
intentions to use program in the future. The original intention was to validate the TAM
results using a follow-up survey and a measure of actual usage. This was not possible
due to the lack of time for the student's to become familiar with the program.
Beddown planning is a complex series of tasks. Recent advances in computer
technology have produced several tools that have potential for application to the beddown
planning process. However, these tools must be carefully designed to function properly
and more importantly to meet the needs of prospective users. The creators of GeoBEST
claim that it has many applications that simplify and streamline the beddown planning
process. GeoBEST does in fact incorporate many tools that could be useful to CE
planners. However, it also includes numerous design flaws that seriously impair its
effectiveness. A new and reportedly improved version of GeoBEST is due for release
soon. Are all of the identified design flaws corrected? Does the program load
predictably on multiple types and configurations of computers? Does it have the
flexibility to be useful for a broad range of beddown requirements? Does the Air Force
have a plan to provide the users with adequate training? Finally, will the intended users
accept the technology and put it to productive use? All of these questions must be
answered in the affirmative before the Air Force employs GeoBEST.
5-7
Appendix A: Surveys
This appendix includes each of the surveys used to gather data for this research.
Each survey is described briefly below:
Silver Flag Student Initial: Administered to students immediately following
the GeoBEST introductory training on Monday.
Silver Flag Student Follow-Up: Administered to students after the beddown
briefing on Wednesday for the first three classes.
Silver Flag cadre: Administered to Silver Flag cadre members who had
observed the GeoBEST briefing.
CE Student: Administered to the Silver Flag students after the final training
class on 4 Nov 01 and to the AFIT CESS Mgt 101 students on 8 Nov 01.
A-l

Silver Flag Student Initial Survey
*£*•
GeoBEST
Software Evaluation Survey
(Student Initial)
Purpose: This research is focused on evaluating a beddown planning software program.
Confidentiality: You are a part of a group of Silver Flag students selected to represent the views of base level beddown planners. Your answers are important. ALL ANSWERS ARE STRICTLY CONFIDENTIAL and, unless you wish to tell me your identity, all answers are anonymous. No identification of individual responses will occur. I ask for some demographic and other information in order to interpret results more accurately.
Time Required: It will probably take you about 10 to 15 minutes to complete this questionnaire.
Approval: This study has been approved by AFPC with a control number of SCN 01- 086. Survey expiration date is 31 Dec 01.
Sponsor: This study is being sponsored by Det 1, 823rd RED HORSE, and the Air Force Civil Engineer Support Agency (AFCESA), Tyndall AFB, FL.
Contact Information: If you have any questions or comment regarding this survey, you may contact either me or my advisor. Thank you very much for your participation.
Sincerely,
//signed//
Capt Shawn Jensen Air Force Institute of Technology/ENV Technology/ENV 2950 P. Street, Bldg 640 WPAFB, OH 45433-7765 [email protected] Comm: (937) 429-9855
Lt Col Heidi Brothers, Ph.D., P.E. Air Force Institute of
2950 P. Street, Bldg 640 WPAFB, OH 45433-7765 [email protected] DSN 785-3636 x4800
A-2
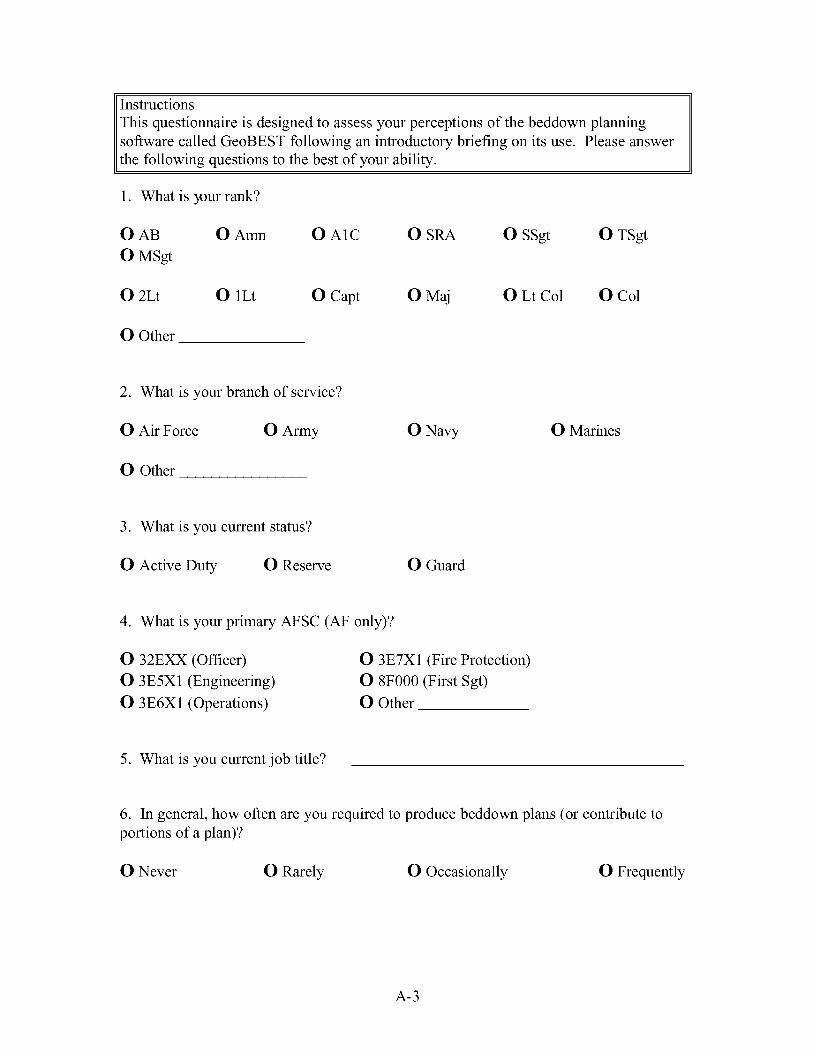
Instructions This questionnaire is designed to assess your perceptions of the beddown planning software called GeoBEST following an introductory briefing on its use. Please answer the following questions to the best of your ability.
1. What is your rank?
O Amn OAB OMSgt
0 2Lt
O Other
O lLt
OA1C
OCapt
OSRA
OMaj
OSSgt OTSgt
O Lt Col O Col
2. What is your branch of service?
O Air Force O Army
O Other
ONavy O Marines
3. What is you current status?
O Active Duty O Reserve O Guard
4. What is your primary AFSC (AF only)1:
O 32EXX (Officer) O 3E5X1 (Engineering)
O 3E6X1 (Operations)
O 3E7X1 (Fire Protection) O 8F000 (First Sgt) O Other
5. What is you current job title?
6. In general, how often are you required to produce beddown plans (or contribute to portions of a plan)?
O Never O Rarely O Occasionally O Frequently
A-3

7. How would you describe your personal level of beddown planning ability?
O No ability O Novice O Intermediate O Expert
8. How would you describe the introductory training you just received on GeoBEST?
O Useless O Insufficient O Adequate O Useful O Very useful
9. Do you have any recommendations for improving the training?
10. How would you describe your personal level of preparedness to begin using GeoBEST?
O Very O Unprepared O Slightly O Slightly O Prepared O Very Unprepared Unprepared Prepared Prepared
For questions 11 through 26, please circle the response that you feel is most appropriate.
11. I enjoy using computers.
Strongly Agree Slightly Agree Agree
Neutral Slightly Disagree
Disagree Strongly Disagree
12. I find a computer easy to use.
Strongly Agree Slightly Agree Agree
Neutral Slightly Disagree
Disagree Strongly Disagree
13. Using GeoBEST is a(n) idea.
Extremely Quite Slightly Good Good Good
Neither good
nor bad Slightly
bad Quite Bad
Extremely Bad
14. I intend to use GeoBEST for beddown planning.
Strongly Agree Slightly Agree Agree
Neutral Slightly Disagree
Disagree Strongly Disagree
A-4

15. Learning to operate GeoBEST would be easy for me.
Extremely Quite Likely Likely
Slightly Neutral Slightly Likely Unlikely
Quite Extremely Unlikely Unlikely
16. Using GeoBEST would improve my performance as a beddown planner.
Extremely Quite Likely Likely
Slightly Neutral Slightly Likely Unlikely
Quite Extremely Unlikely Unlikely
17. Using GeoBEST is a idea.
Extremely
Wise
Wise Slightly
Wise
Neither Wise Nor
Foolish
Slightly
Foolish
Foolish Extremely
Foolish
18. I intend to use GeoBEST frequently for beddown planning.
Strongly Agree Agree
Slightly Neutral Slightly Disagree Strongly Agree Disagree Disagree
19. I would find it easy to get GeoBEST to do what I want it to do.
Extremely Quite Likely Likely
Slightly Neutral Slightly Quite Extremely Likely Unlikely Unlikely Unlikely
20. Using GeoBEST would increase my productivity as a beddown planner.
Extremely Quite Likely Likely
Slightly Neutral Slightly Quite Extremely Likely Unlikely Unlikely Unlikely
21. I the idea of using GeoBEST
Strongly Like
Like Slightly Don't care Slightly
Like about Dislike
Dislike Strongly Dislike
22. Using GeoBEST would be
Extremely Quite Slightly
Pleasant Pleasant Pleasant
Slightly Quite Extremely Neither Pleasant
Nor Unpleasant Unpleasant Unpleasant Unpleasant _ _ _
A-5

23. It would be easy for me to become skillful at using GeoBEST.
Extremely Quite Slightly Neutral Likely Likely Likely
Slightly Unlikely
Quite Unlikely
Extremely Unlikely
24. Using GeoBEST would enhance my effectiveness in beddown planning.
Extremely Quite Slightly Neutral Likely Likely Likely
Slightly Unlikely
Quite Unlikely
Extremely Unlikely
25. I would find GeoBEST easy to use.
Extremely Quite Slightly Neutral Likely Likely Likely
Slightly Unlikely
Quite Unlikely
Extremely Unlikely
26. I would find GeoBEST useful for beddown planning.
Extremely Quite Slightly Neither Likely Likely Likely
Slightly Unlikely
Quite Unlikely
Extremely Unlikely
27. Do you have any additional comments?
This completes this portion of the survey. Prior to the beddown briefing on Wednesday, a follow-up survey will be administered. In order to match your
responses on this survey to those on the follow-up survey, please enter the following information:
First two letters of mother's first name:
First two letters of father's first name:
Privacy Notice In accordance with AFI37-132, Paragraph 3.2, the following information is provided as required by the Privacy Act of 1974: Authority: 10U.S.C. 8012, Secretary of the Air Force; powers and duties; delegation by; implemented by AFI 36-2601, Air Force Personnel Survey Program. Purpose: To obtain information regarding user perceptions of a beddown planning software program. Surveys will be administered to students attending training at the Silver Flag training site, Tyndall AFB, FL. Routine Use: No analysis of individual responses will be conducted and only members of the research team will be permitted access to the raw data. A final report will be provided to Silver Flag Exercise Site, Detachment 1, RED HORSE Squadron, and the Air Force Civil Engineer Support Agency, Tyndall AFB, Florida. Participation: Participation is VOLUNTARY. No adverse action will be taken against any member who does not particip ate in this survey or who does not complete any part of the survey.
A-6

Silver Flag Student Follow-Up Survey
GeoBEST
Software Evaluation Survey
(Student Follow-Up)
Purpose: This research is focused on evaluating a beddown planning software program
Confidentiality: You are a part of a group of Silver Flag students selected to represent the views of base level beddown planners. Your answers are important. ALL ANSWERS ARE STRICTLY CONFIDENTIAL and, unless you wish to tell me your identity, all answers are anonymous. No identification of individual responses will occur. I ask for some demographic and other information in order to interpret results more accurately.
Time Required: It will probably take you about 10 to 15 minutes to complete this questionnaire.
Approval: This study has been approved by AFPC with a control number of SCN 01- 086. Survey expiration date is 31 Dec 01.
Sponsor: This study is being sponsored by Det 1, 823rd RED HORSE, and the Air Force Civil Engineer Support Agency (AFCESA), Tyndall AFB, FL.
Contact Information: If you have any questions or comment regarding this survey, you may contact either me or my advisor. Thank you very much for your participation.
Sincerely,
//signed//
Capt Shawn Jensen Air Force Institute of Technology/ENV Technology/ENV 2950 P. Street, Bldg 640 WPAFB, OH 45433-7765 [email protected] Comm: (937) 429-9855
Lt Col Heidi S. Brothers, Ph.D., P.E. Air Force Institute of
2950 P. Street, Bldg 640 WPAFB, OH 45433-7765 [email protected] DSN 785-3636 x4800
A-7

This portion of the survey is to be completed after the beddown planning exercise.
1. Did you contribute to the preparation of the beddown plan?
O Yes (please continue)
O No (please skip to question 20)
2. Did you use GeoBEST to assist in preparation of the beddown plan?
O Yes (please continue)
O No (please skip to question 20)
3. Indicate which GeoBEST features you used (mark all that apply).
O Calculate asset requirements based on number of aircraft or population O Import imagery as a theme
O Area analysis (number of assets that will fit within a defined area) O Allocate assets within a scenario O 3D viewer O Constraints analysis (dispersed/non-dispersed facility distances) O Map generator
O Import saved scenario into the current scenario O Rescale image (based on image resolution or object size) O Image registration (merge image file with data file) O Metadata (asset information such as text or pictures) O Report generator
O All Scenarios report O Facilities/Equipment Inventory report O Deployment Package Inventory report
O Labor Requirements report O Power Requirements report
O Scheduler (ad-hoc 30 day schedule) O Asset labeling O Drawing tools (lines, circles, etc.) O Database Editor O Import GPS data files O On-line Help (GeoBEST or Arc View) O Other
A-8

For questions 4 through 17, please circle the answer that you feel is most appropriate.
4. Using GeoBEST is a(n) idea.
Extremely Quite Slightly Good Good Good
Neither good
nor bad Slightly
Bad Quite Bad
Extremely Bad
5. I intend to use GeoBEST for beddown planning.
Strongly Agree
Agree Slightly Agree
Neutral Slightly Disagree
Disagree Strongly Disagree
6. Learning to operate GeoBEST is easy for me.
Agree Strongly Agree
Slightly Agree
Neutral Slightly Disagree
Disagree Strongly Disagree
7. Using GeoBEST improves my performance as a beddown planner.
Agree Slightly Neutral Slightly Disagree Strongly Agree
Slightly Neutral Agree
Slightly Disagree
Strongly Disagree
8. Using GeoBEST is a(n)
Wise Extremely Wise
Slightly Wise
. idea.
Neither Wise
Nor Foolish Slightly Foolish
Foolish Extremely Foolish
9. I intend to use GeoBEST frequently for beddown planning.
Strongly Agree Agree
Slightly Neutral Slightly Agree Disagree
Disagree Strongly Disagree
10. I find it easy to get GeoBEST to do what I want it to do.
Strongly Agree Slightly Neutral Slightly Agree Agree Disagree
Disagree Strongly Disagree
11. Using GeoBEST increases my productivity as a beddown planner.
Strongly Agree Slightly Neutral Slightly Disagree Strongly Agree Agree Disagree Disagree
12. I the idea of using GeoBEST
Strongly Like
Like Slightly Don't care Like about
Slightly Dislike
Dislike Strongly Dislike
A-9

13. Using GeoBEST is
Extremely Quite Slightly Neither Slightly Quite Extremely
Pleasant Pleasant Pleasant Nor Unpleasant Unpleasant
Unpleasant Unpleasant
14. It is easy for me to become skillful at using GeoBEST.
Strongly Agree Slightly Neutral Slightly Disagree Strongly Agree Agree Disagree Disagree
15. Using GeoBEST enhances my effectiveness in beddown planning.
Strongly Agree Slightly Neutral Slightly Disagree Strongly Agree Agree Disagree Disagree
16. 1 find GeoBEST easy to use.
Strongly Agree Slightly Neutral Slightly Disagree Strongly Agree Agree Disagree Disagree
17. I find GeoBEST useful for beddown planning.
Strongly Agree Slightly Neutral Slightly Disagree Strongly Agree Agree Disagree Disagree
18. Approximately how much time did you spend PERSONALLY using GeoBEST (ie. you were the one operating the system)?
O Less than one hour O One to two hours O Two to three hours O Three to four hours O More than four hours (estimate: ____ hrs.)
19. Approximately how much time did you spend as part of a group using GeoBEST?
O Less than one hour O One to two hours O Two to three hours O Three to four hours O More than four hours (estimate: ____ hrs.)
A-10

20. What features of GeoBEST do you like the most? Why?
21. What features of GeoBEST do you like the least? Why?
22. What suggestions do you have for future improvements of GeoBEST?
23. Now that you have used GeoBEST, how would you describe the introductory training you received?
O Useless O Insufficient O Adequate O Useful O Very useful
A-ll
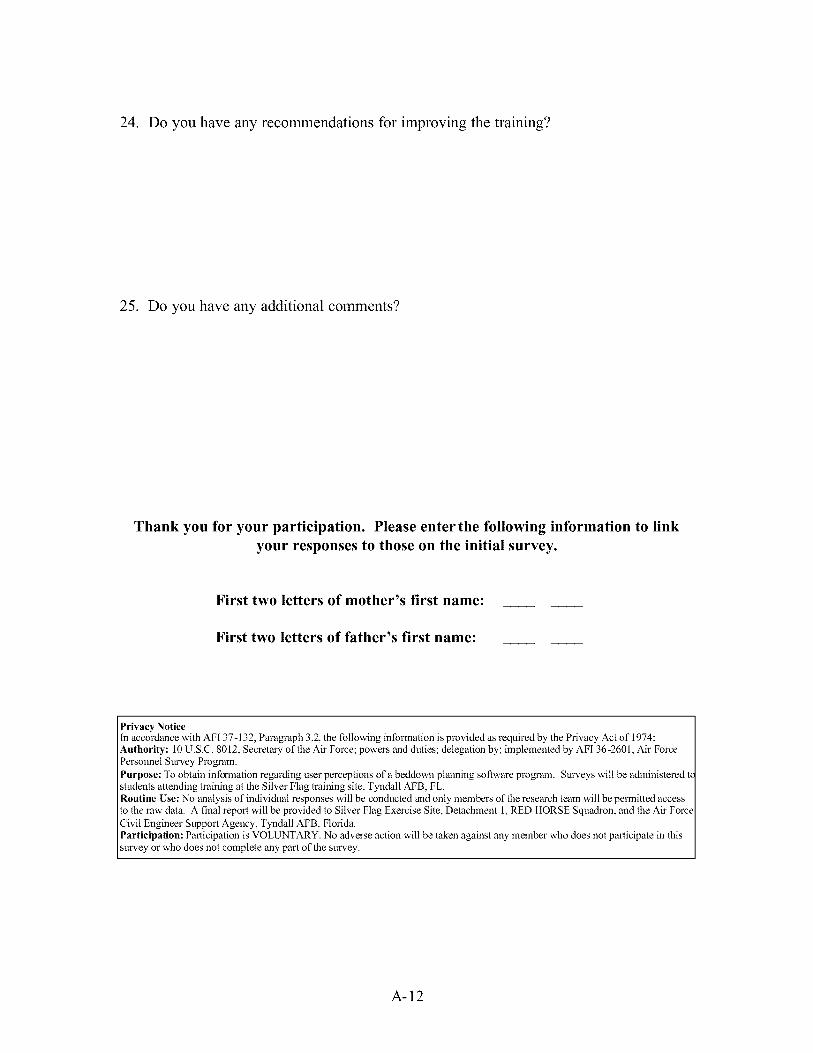
24. Do you have any recommendations for improving the training?
25. Do you have any additional comments?
Thank you for your participation. Please enter the following information to link your responses to those on the initial survey.
First two letters of mother's first name:
First two letters of father's first name:
Privacy Notice In accordance with AFI37-132, Paragraph 3.2, the following information is provided as required by the Privacy Act of 1974: Authority: 10U.S.C. 8012, Secretary of the Air Force; powers and duties; delegation by; implemented by AFI 36-2601, Air Force Personnel Survey Program. Purpose: To obtain information regarding user perceptions of a beddown planning software program. Surveys will be administered tc students attending training at the Silver Flag training site, Tyndall AFB, FL. Routine Use: No analysis of individual responses will be conducted and only members of the research team will be permitted access to the raw data. A final report will be provided to Silver Flag Exercise Site, Detachment 1, RED HORSE Squadron, and the Air Force Civil Engineer Support Agency, Tyndall AFB, Florida. Participation: Participation is VOLUNTARY. No adverse action will be taken against any member who does not participate in this survey or who does not complete any part of the survey.
A-12

Silver Flag Cadre Survey
*£*•
GeoBEST
Software Evaluation Survey (Silver Flag Cadre)
Purpose: This research is focused on evaluating a beddown planning software program.
Confidentiality: You are a part of a group of Silver Flag instructors or staff members selected to represent the views of beddown planning experts. Your answers are important. ALL ANSWERS ARE STRICTLY CONFIDENTIAL and, unless you wish to tell me your identity, all answers are anonymous. No identification of individual responses will occur. I ask for some demographic and other information in order to interpret results more accurately.
Time Required: It will probably take you about 10 minutes to complete this questionnaire.
Approval: This study has been approved by AFPC with a control number of SCN 01- 086. Survey expiration date is 31 Dec 01.
Sponsor: This study is being sponsored by Det 1, 823rd RED HORSE, and the Air Force Civil Engineer Support Agency (AFCESA), Tyndall AFB, FL.
Contact Information: If you have any questions or comment regarding this survey, you may contact either me or my advisor. Thank you very much for your participation.
Sincerely,
//signed//
Capt Shawn Jensen Air Force Institute of Technology/ENV Technology/ENV 2950 P. Street, Bldg 640 WPAFB, OH 45433-7765 [email protected] Comm: (937) 429-9855
Lt Col S. Heidi Brothers, Ph.D., P.E. Air Force Institute of
2950 P. Street, Bldg 640 WPAFB, OH 45433-7765 [email protected] DSN 785-3636 x4800
A-13

Note: Each participating cadre member should complete this survey only once.
1. What is your current position at Silver Flag?
O Instructor O Command & Control O Engineering O Fire Protection O Other ______^_^_
O Other
2. How long have you been assigned to Silver Flag?
O Less than one year O One to two years O Two to three years O More than three years
3. Based on your experience, how would you rate the performance (with regard to beddown planning) of Silver Flag students who use GeoBEST versus students using traditional methods?
O Much worse O Worse O About the same O Better O Much better
4. What are the major differences (if any) between plans produced using GeoBEST and those produced with traditional methods?
A-14
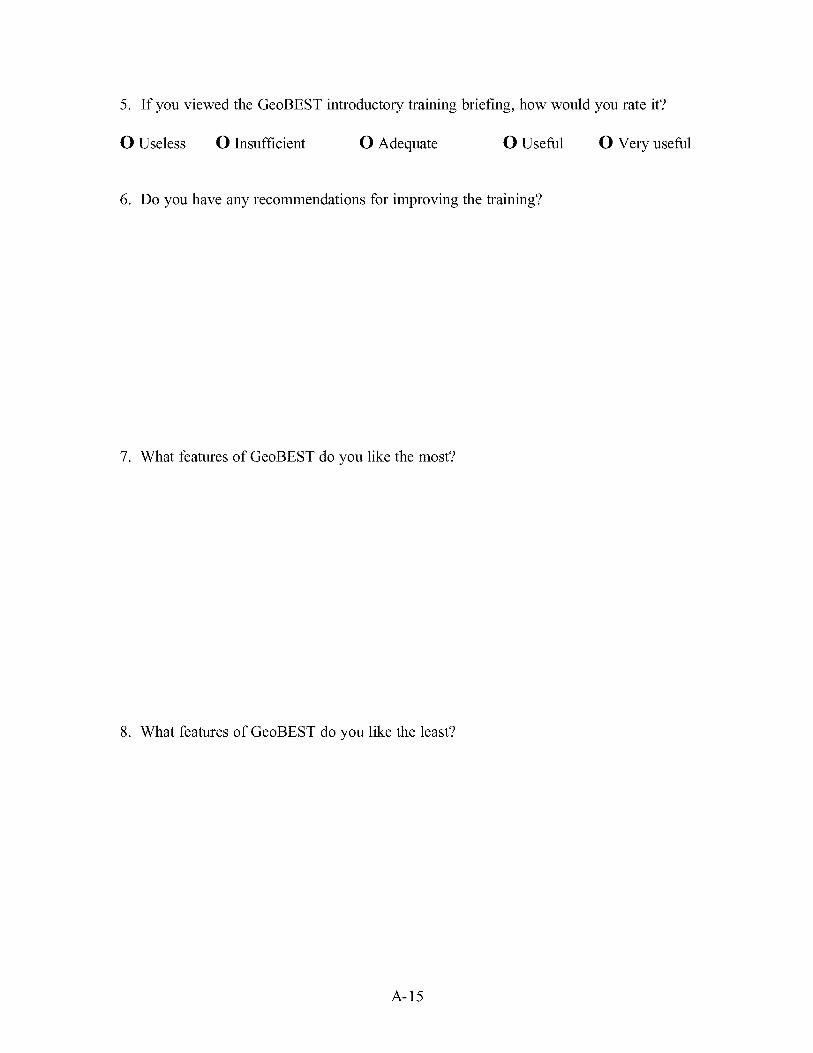
5. If you viewed the GeoBEST introductory training briefing, how would you rate it?
O Useless O Insufficient O Adequate O Useful O Very useful
6. Do you have any recommendations for improving the training?
7. What features of GeoBEST do you like the most?
8. What features of GeoBEST do you like the least?
A-15

9. What suggestions do you have for future improvements of GeoBEST?
10. Do you have any additional comments?
Thanks for your participation!
Privacy Notice In accordance with AFI37-132, Paragraph 3.2, the following information is provided as required by the Privacy Act of 1974: Authority: 10U.S.C. 8012, Secretary of the Air Force; powers and duties; delegation by; implemented by AFI 36-2601, Air Force Personnel Survey Program. Purpose: To obtain information regarding user perceptions of a beddown planning software program. Surveys will be administered to students and instructors at the Silver Flag training site, Tyndall AFB, FL. Routine Use: No analysis of individual responses will be conducted and only members of the research team will be permitted access to the raw data. A final report will be provided to Silver Flag Exercise Site, Detachment 1, RED HORSE Squadron, and the Air Force Civil Engineer Support Agency, Tyndall AFB, Florida. Participation: Participation is VOLUNTARY. No adverse action will be taken against any member who does not participate in this survey or who does not complete any part of the survey.
A-16

Silver Flag Student Survey (revised for 4 Nov 01)
*£*•
GeoBEST
Software Evaluation Survey (Student)
Purpose: This research is focused on evaluating a beddown planning software program.
Confidentiality: You are a part of a group of Civil Engineering students selected to represent the views of base level beddown planners. Your answers are important. ALL ANSWERS ARE STRICTLY CONFIDENTIAL and, unless you wish to tell me your identity, all answers are anonymous. No identification of individual responses will occur. I ask for some demographic and other information in order to interpret results more accurately.
Time Required: It will probably take you about 10 minutes to complete this questionnaire.
Approval: This study has been approved by AFPC with a control number of SCN 01- 086. Survey expiration date is 31 Dec 01.
Sponsor: This study is being sponsored by Det 1, 823rd RED HORSE, and the Air Force Civil Engineer Support Agency (AFCESA), Tyndall AFB, FL.
Contact Information: If you have any questions or comment regarding this survey, you may contact either me or my advisor. Thank you very much for your participation.
Sincerely,
//signed//
Capt Shawn Jensen Air Force Institute of Technology/ENV Technology/ENV 2950 P. Street, Bldg 640 WPAFB, OH 45433-7765 [email protected] Comm: (937) 429-9855
Lt Col Heidi Brothers, Ph.D., P.E. Air Force Institute of
2950 P. Street, Bldg 640 WPAFB, OH 45433-7765 [email protected] DSN 785-3636 x4800
A-17

Instructions This questionnaire is designed to assess your perceptions of the beddown planning software called GeoBEST following an introductory briefing on its use. Please answer the following questions to the best of your ability.
1. What is your rank?
O Amn OAB OMSgt
0 2Lt
O Other
O lLt
OA1C
OCapt
OSRA
OMaj
OSSgt OTSgt
O Lt Col O Col
2. What is your branch of service?
O Air Force O Army
O Other
ONavy O Marines
3. What is you current status?
O Active Duty O Reserve O Guard
4. What is your primary AFSC (AF only)?
O 32EXX (Officer) O 3E5X1 (Engineering) O 3E6X1 (Operations)
O 3E7X1 (Fire Protection) O 8F000 (First Sgt) O Other
5. What is you current job title?
6. In general, how often are you required to produce beddown plans (or contribute to portions of a plan)?
O Never O Rarely O Occasionally O Frequently
A-18
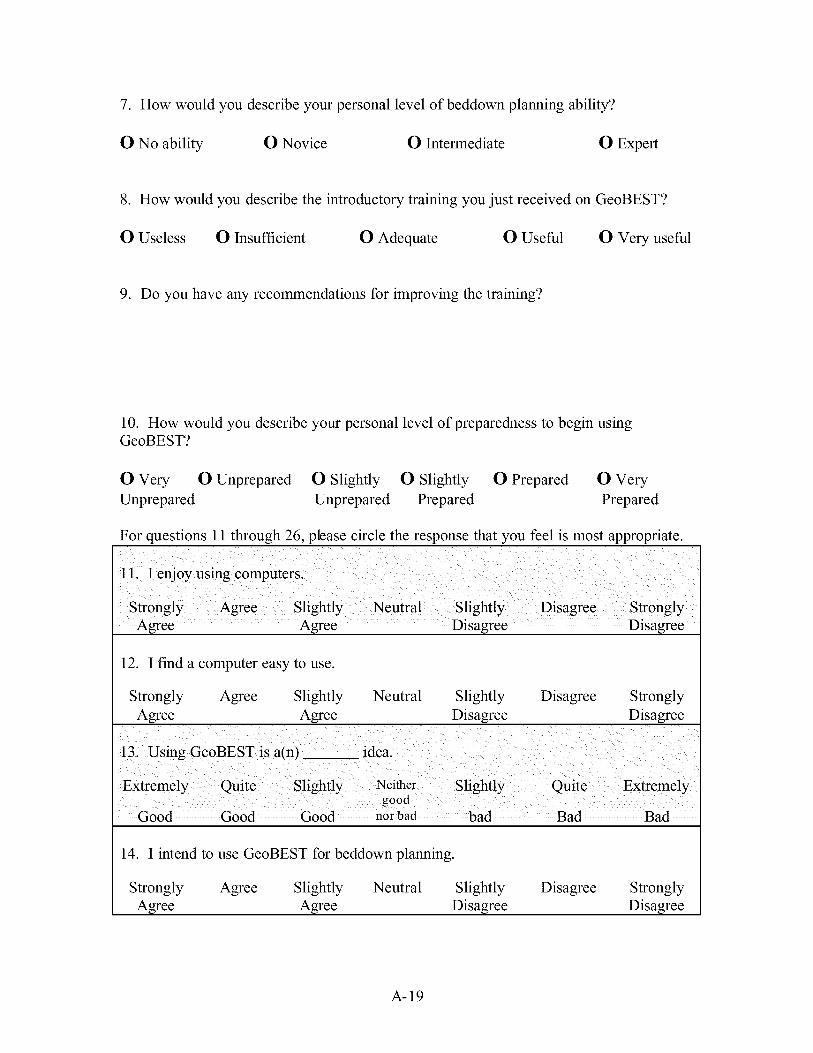
7. How would you describe your personal level of beddown planning ability?
O No ability O Novice O Intermediate O Expert
8. How would you describe the introductory training you just received on GeoBEST?
O Useless O Insufficient O Adequate O Useful O Very useful
9. Do you have any recommendations for improving the training?
10. How would you describe your personal level of preparedness to begin using GeoBEST?
O Very O Unprepared O Slightly O Slightly O Prepared O Very Unprepared Unprepared Prepared Prepared
For questions 11 through 26, please circle the response that you feel is most appropriate.
11.1 enjoy using computers.
Strongly Agree Slightly Agree Agree
Neutral Slightly Disagree
Disagree Strongly Disagree
12. I find a computer easy to use.
Strongly Agree Slightly Agree Agree
Neutral Slightly Disagree
Disagree Strongly Disagree
13. Using GeoBEST is a(n) idea.
Extremely Quite Slightly
Good Good Good
Neither good
nor bad
Slightly
bad
Quite
Bad
Extremely
Bad
14. I intend to use GeoBEST for beddown planning.
Strongly Agree Slightly Agree Agree
Neutral Slightly Disagree
Disagree Strongly Disagree
A-19

15. Learning to operate GeoBEST would be easy for me.
Extremely Quite Slightly Neutral Likely Likely Likely
Slightly Unlikely
Quite Unlikely
Extremely Unlikely
16. Using GeoBEST would improve my performance as a beddown planner.
Extremely Quite Slightly Neutral Likely Likely Likely
Slightly Unlikely
Quite Unlikely
Extremely Unlikely
17. Using GeoBEST is a idea.
Extremely Wise Slightly Neither Slightly Foolish Extremely
Wise Wise Nor Foolish
Foolish Foolish
18. I intend to use GeoBEST frequently for beddown planning.
Strongly Agree Slightly Neutral Agree Agree
Slightly Disagree
Disagree Strongly Disagree
19. I would find it easy to get GeoBEST to do what I want it to do.
Extremely Quite Slightly Neutral Likely Likely Likely
Slightly Unlikely
Quite Unlikely
Extremely Unlikely
20. Using GeoBEST would increase my productivity as a beddown planner.
Extremely Quite Slightly Neutral Likely Likely Likely
Slightly Unlikely
Quite Unlikely
Extremely Unlikely
21. I the idea of using GeoBEST
Strongly Like Slightly Don't care Like Like about
Slightly Dislike
Dislike Strongly Dislike
22. Using GeoBEST would be Slightly Quite Extremely Extremely Quite Slightly Neither
Pleasant Pleasant Pleasant Nor
Unpleasant Unpleasant Unpleasant Unpleasant
23. It would be easy for me to become skillful at using GeoBEST.
Extremely Quite Slightly Neutral Likely Likely Likely
Slightly Unlikely
Quite Unlikely
Extremely Unlikely
A-20

24. Using GeoBEST would enhance my effectiveness in beddown planning.
Extremely Quite Slightly Neutral Likely Likely Likely
Slightly Unlikely
Quite Unlikely
Extremely Unlikely
25. I would find GeoBEST easy to use.
Extremely Quite Slightly Neutral Likely Likely Likely
Slightly Unlikely
Quite Unlikely
Extremely Unlikely
26. I would find GeoBEST useful for beddown planning.
Extremely Quite Slightly Neither Likely Likely Likely
Slightly Unlikely
Quite Unlikely
Extremely Unlikely
27. What features of GeoBEST do you like the most? Why?
28. What features of GeoBEST do you like the least? Why?
29. What suggestions do you have for future improvements of GeoBEST?
A-21

30. Do you have any additional comments?
Privacy Notice In accordance with AFI37-132, Paragraph 3.2, the following information is provided as required by the Privacy Act of 1974: Authority: 10U.S.C. 8012, Secretary of the Air Force; powers and duties; delegation by; implemented by AFI 36-2601, Air Force Personnel Survey Program. Purpose: To obtain information regarding user perceptions of a beddown planning software program. Surveys will be administered tc students attending training at the Silver Flag training site, Tyndall AFB, FL. Routine Use: No analysis of individual responses will be conducted and only members of the research team will be permitted access to the raw data. A final report will be provided to Silver Flag Exercise Site, Detachment 1, RED HORSE Squadron, and the Air Force Civil Engineer Support Agency, Tyndall AFB, Florida. Participation: Participation is VOLUNTARY. No adverse action will be taken against any member who does not participate in this survey or who does not complete any part of the survey.
A-22

Appendix B: Student Survey Qualitative Feedback
This appendix contains the qualitative feedback provided on the Silver Flag
student surveys. Students provided responses to the following questions:
Do you have any recommendations for improving the training?
What features of GeoBEST do you like the most? Why?
What features of GeoBEST do you like the least? Why?
What suggestions do you have for future improvement of GeoBEST?
Do you have any additional comments?
B-l

Student Survey Qualitative Feedback
"Do vou have anv recommendations for improving the training?' Allow a longer block of time. One hour was not enough. More Time Need a detailed hand-out. Allow for automatic corrections of spacing More hands on for all participants If it is to be used Air Force wide more than 1 hour of training is needed. Allow a little more time and a "play around with it" period. Too fast- More time and hands on training. Deploy to AirNG sites for use/feedback. Demonstrate where database data location in T.O.s. Prove to audience that numbers are accurate. The easy answer is more time. The schedule just doesn't allow for it. More computers- More time allotted for training. Better quality software with more capability. Then more instruction and benefit. I attended 1 hour of training. Obviously need more time to learn capabilities and experiment before making an evaluation. Additional "hands-on" training. Fire hose course. Use units on data tables. Ie. KW, amps, etc. More flexibility when correcting errors. Not always having to start over. Longer, hands on. Needs an undo command that works correctly. Too much starting over. Nice to have some similar commands from AutoCAD ie. Array, snap. Increase the time to 4 hr min. More time and more hands on. Provide a longer training period with more hands on. Obviously, time constraints dictate. However, a more in depth training class specific to the program would be beneficial. Formal training class, two weeks, to get familiar with the system- More practical. More hands on. Need 2-3 days of step by step hands-on. None at this time without using the program. Good presentation. Individual access to the program for each candidate would be nice. More time needed for demonstration/instruction. Longer with hands on. More time. Was more overview than training. Actual training should include some hands on practice. More time on training. None. It was well explained. Add vehic le beddown for force protection measures. Possible bitburg and sandbag barriers.
B-2

Very good overview and introduction. More hands-on training. Lengthen training- More hands-on training would be useful. More time, computers to use during training- Formalize into req'd training- More computers/hands-on. Specific tasks/homework. Not enough time. Need a computer at every seat. It's hard to really understand the tool without actually using it. Hands on training would be very beneficial. Allocate more time and hands-on training- There was no hands-on training. It was strictly a point and click show. I believe that a background in GIS would be necessary to fully appreciate this software- Could have representative from the contractor present for questions. More time. Hands on. Technical and instructional data must be disseminated among students to become familiar with features and its capabilities. It looks like a very promising tool because it has the capability of growing at a proportionate rate with the user's capabilities and available information. It can minimize greatly the amount of time spent in preparing a beddown plan, provided it can assimilate all the required information.
'What features of GeoBEST do von like the most? Whv' Database and that layout can be done over drawing or aerial photo. With some additional training and familiarization GeoBEST will be a great tool for beddown planning. Analysis, allocate assets, and map generator. 3D and programming. With 3D you can see it in a cool way. Programming is good for those who start OJT. It has everything you need to know for starters there. The ability to put down the number of aircraft you need to support and the program producing all the assets needed for the deployment. Database and construction times, specs on equipment, etc. The system using layers allows you to put just the information you need- Visualization of the plans. 3D views. Being able to use picture overlay. The siting and rotational capability. I liked the overall capability of GeoBEST because it has a lot of range on layouts and scenarios. Less complicated to work with than AutoCAD. The program is all-encompassing. The lay over feature of drawings and pictures [image registration]. Tie in of 10-219, 10-222 asset info into scaled map with intelligent points. Will allow to have picture vs. endless paragraphs of text and tables. It will be a great tool eventually, but it's not quite there yet. I'm sure the updated version will be improved. Most of its features/capabilities I liked. Good tool.
B-3

3D. Asset availability. Mapping image files- Looked good in the demonstration. Concept is good. 3D plots. Better impression of camp layout. 3D Features. Pre-packaged info on assets (access database info) Didn't use it. Nice because it has the beddown criteria. Overall I think it will be very helpful. I like the fact that you can move info from AutoCAD to Picture. Better visual. Tracing of facilities, 3D. 3D imaging. You can see all the directions you don't on CAD. Importing an aerial view jpg, and using it to work off of 3D and panning features. All aspects of GeoBEST program appear useful. All the information is there and can be extracted from one software package- Using fly over photos. Realistic. Not familiar with program, only saw the introduction to it. Seems like an excellent tool though. Information data processing. Effective and time saving. 3D effects. Photo and template integration. It simplifies the process of laying out the beddown process. It interacts with AutoCAD. I liked the ability of the software to use GIS and AutoCAD. Automation. Any tool that helps with a simplified way of creating a beddown plan I'm in favor of. Picture access. The ability to rotate and 3D. Once you have learned how to use GeoBEST, I am pretty sure it can be very effective. It is flexible. It can be modified to fit any scenario. Keeping track of asset counts. Pre loaded database. Seems to have a lot of features and flexibility. The intelligence and user- friendly controls of the program. The program works with you tracking your design and assisting in correct beddown planning procedures. 3D graphics. Closeness of pictures. Very realistic. Number crunching. Built- in calculations.
Asset placement, spacing and management of assets placed. Ability to import real world imagery or mapping details Keeps up with asset allocation. It has a lot of items already in its database- Spacing analysis for assets because spacing is a tricky thing to get around. How easy it is to use, it wouldn't take much time to learn and apply it to do beddown planning or even on other projects.
B-4

The use of real-time photo imagery and automatic calculations based on a database. 3D Graphical presentation of base layout. Without actually trying GeoBEST I find it hard to provide an accurate description of what I would use if for and how easy it would be to use. Pictures, images. Being able to plot the assets and the program calculating man-hours, inventory, etc. The relational database is quite appealing- How easy it is. The inventory, because you then know how many you've used. All (nearly) assets are already programmed in. The scenario wizard. Ease of importing images and dwg's. GIS capabilities, real world inputs can be added, 3D features, ease of use to do presentations.
'What features of GeoBEST do vou like the least? Whv?' Not easy to layout lines to keep facility layout placement in line- Line commands. Need to be able to draw a line to a specific length. Due to being unfamiliar with GeoBEST it was more time consuming than the traditional methods for the exercise. Functions. Unlike AutoCAD you can't type in what you want to do. You have to drag/click. That takes up to much time. None Didn't get to use it enough to say- Being able to site facilities with the distance criteria. Requirements of putting drawings to scale in feet or meters. Using AutoCAD files in different units would allow for use during this exercise. Would not correct siting mistakes. I would like to see more unique or recognizable icons to simplify its use. At present, it is limited to two bases. The scales put in it. Should be more expanded. Not developed enough to adequately test use. Too many little (simple) issues create more questions than progress. Needs an undo feature. Not enough aircraft specific data (ie. Dimensions, dimensions with revetments, etc.) Not familiar enough with the product to comment- Not able to move around very easily. 3D fly-by feature is single speed (too fast to view), which renders this feature useless. Scale. Don't have enough info to evaluate Not as user friendly as it needs to be. Labor intensive. "start overs" rather than "go back to previous saved"
B-5

Drawing portion. Takes longer than AutoCAD due to commands. Didn't track inventory- Not able to generate any limfacs/shortages. That you can't match orientations [image registration]. The unavailability to have AutoCAD files updated from the original, when brought into GeoBEST. [xref] Have not used program enough to dislike any features. Use of dispersed assets. Should include non-dispersed. Too complicated. Should be use assistance. Not able to cut and paste everything or do copy on everything. All features are outstanding. Haven't used it enough to know. It seems like it would take a lot of training to get efficient with the program. The inability for the program to import DWG files in a 1 to 1 scale. 3D. Must set up dwq files prior to using this software. Accuracy for mapping purposes and surveying. Lack of force-protection measures. Will not insert a dispersed or nondispersed layout into a selected area [area analysis]. Icons Not enough time to evaluate. I don't see any drawbacks at this introductory level. The inability to auto plot an area once the limits have been defined. The CRASH feature. Did not receive enough info to answer this question. One would need to invest the time to properly learn Arc View in advance to master this software. Scaling, because I didn't get it. Scaling. I had a hard time- None so far, provided it can grow with this troop's needs.
"What suggestions do you have for future improvement of GeoBEST?" More instruction on how to use it. See question above. When "copying an object allow user to "paste" the copied object where they would like it. Not on top of the old one. More user friendly. Great tool. Need more time to learn. If a class is given, give some more time space for learning- Adapt it to the different services. Didn't get to use it enough to say.
B-6

Incorporate the GPS ability into the briefing. Add aircraft templates and information (ie. Wingspan, dimensions). Add hardening assets such as B-l. Add CCD assets. Correct siting mistakes. A self-help program, after a more in-depth class- Need more time to play with it to answer this. Hope to get a full blown training before or if even it gets implemented. Undo, variable birds eye speed, sample beddown plans of at least 1100 person team, one with joint forces, combined aircraft (for entire area, not just individual assets) Same as #21. Move toward AutoCAD function. Make it much more user- friendly prior to fielding. Also ensure that Harvest asset packages are not modified/obsolete prior to fielding this software. Develop a more user friendly system. Incorporate basic electrical, utilities, etc. that can determine layout options based on information you input. More flexible with correcting mistakes without rebooting. More features to eliminate repetitive tasks or having it build base line packages. Time is a constraint. Improve drawing options. Object snaps. Undo instead of Redo. Track inventory shortfalls. From above, have capability for updates from CAD files to be effective in GeoBEST. It is difficult to use GeoBEST under the very short time allotted to plan beddown. Once the system is implemented force wide, the use at Silver Flag would be beneficial. Most of the individuals I spoke with felt that given the time constraints, GeoBEST was not the program to use. Spin up time would take too long. Make it simple. Interact with total station. Get it out to the users. Be able to integrate with AutoCAD more easily and effectively. Didn't use it, so I'm not completely familiar w/ capabilities or weaknesses. Does it have a built-in self-help window? That would be helpful. Have the ability to meld with AutoCAD- Ensure flexibility to add vehicles, equipment, and other features relatively easily. After notifying you of conflicts is should automatically resolve the spacing issues, or ask if you want it to resolve them. These surveys are not good. Their questions are alike. Repetitive. Add vehicles/equipment/barriers. Integration with a base's GeoBase system or TBMCS. Needs to work more effectively with AutoCAD. It seems that it would be better run with AutoCAD. I think it's a great program, but more people AF-wide need to properly know how to use it. If that doesn't happen than this program will not receive its maximum usage. Allow to export DWG files- Obtaining a copy for homestation for tag. Include modules for vehicles and equipment.
B-7

Get a better scaling feature- When an analysis is performed - it completes the drawing. I would like to see some capabilities expanded. Ease of conversion of units, importing AutoCAD and Microstation smart maps and any associated information. Vast distribution among the AF community.
'Do vou have anv additional comments?" Great idea/tool! Add breaks in your lesson to keep attention of students. Make it adaptable to USMC gear- Need more training or exercises using GeoBEST to make a true and accurate evaluation Hard to tell at this time. Too new. Extremely useful program for more than just beddown planning. It would take some time, but I could learn to use this program. Need some better features involving undo options and ability of movement for objects within the scenario. If more user friendly would be a good tool. Add ability to place multiple assets at a time vs. having to place each one individually. On conflict option add "fix" step to correct identified conflicts. Would be very useful when some of the glitches are worked out. Changes to maps should update base plan. Need auto save feature. Common files import/export should be with coordinates. Excellent presentation. The lesson was good for the amount of time slated. Adapt it to USMC gear. Make sure it will run on Win 98, NT, & 2000. Did not get enough hands-on in class to get a fair estimate of the capabilities of the product. The idea of the program is a good idea. Send a trial copy to EA's at bases for them to decide, they are the ones that will be using it the most. I am very interested in seeing this product. Unfortunately unable to use system due to lack of time to learn system. If used AF wide this may be a good tool. Do not suggest use unless standardized across the AF. Thanks! Very useful program if some little glitches were fixed. If we (the base level engineers) use this program then an all inclusive software package should be sent. As an operations technician, I feel I would never use GeoBEST. But I am sure the Engineering section would find it very useful. Based on the short intro I think it will be an excellent tool, as long as adequate training in available along with the software. It's difficult to say how easy it will be to learn based on such a short intro.
B-8

I like the program and would like the chance to become more familiar with it. GeoBEST seems as though it could be a useful tool in beddown planning. I would have to see more of this program before I could make a real informed decision. The Capt was a great teacher for such a short time period. Thanks. Good presentation!
B-9
Appendix C: Cadre Survey Qualitative Feedback
This appendix contains the qualitative feedback provided on the Silver Flag cadre
surveys. These surveys were administered after the final Silver Flag class on 4 Nov 01.
Cadre members provided responses to the following questions:
Do you have any recommendatio ns for improving the training?
What features of GeoBEST do you like the most?
What features of GeoBEST do you like the least?
What suggestions do you have for future improvement of GeoBEST?
Do you have any additional comments?
C-l

Cadre Survey Qualitative Feedback
"Do you have any recommendations for improving the training?" GeoBEST is very similar to AutoCAD and there's just not enough time for the student hands-on required to learn the system. Recommend this be primarily a home station training requirement, but that we include GeoBEST orientation at Silver Flag. Familiarization training is good for "gee whiz" info...I can imagine that training held for actual usage of software would be quite entailed. Need more in-depth training and practice time for students. Really, the only thing I would change would be switching the "fly-by"command to an "undo" command. Fly-by is a nice visual to have, but undo would get a lot more use.
'What features of GeoBEST do you like the most?' It is a very USEFUL tool - once you know how to use it. It makes beddown planning faster/easier.
Tracking of assets and ensuring proper distances between facilities/groups. Automatic tracking of placed assets.
3D is always nice when presenting presentation to be briefed.
"What features of CeoBEST do vou like the least?' The menus and icons are difficult to navigate because they're not "standard" (like other operating systems). It takes too many "clicks" to open a file to work in. No preset facility groups (such as 24-tent non-dispersed layout)
What suggestions do you have for future improvements of GeoBEST?' Move more towards point-and-click options instead of all the pull down menu options T-*T T~> A CM~> * _-. I! J_!!1 ü PLEASE give me an "undo" button. Need groups of structures in non-dispersed layout. Have a command of an option that will let you place entire Temper Tent and Alaskan Small Shelter block (I don't recall there being one.)
LIU VOU Have HIIV allUllIUIlal CUiniilClll».
I think this system will prove very useful once it's implemented. Officers/EA's in the field just need a good solid week of training on it before they can use it effectively. Great beddown tool once all units get incorporated.
The entire class was great! Capt Jensen did an outstanding job!
C-2

Appendix D: GeoBEST Quick Reference Handout
This appendix contains the GeoBEST quick-reference handout that was provided
to of the Silver Flag students. Two laminated copies of the handout were left with the
students for the duration of the beddown planning period between the introductory
training on Monday and the beddown briefing on Wednesday.
D-l
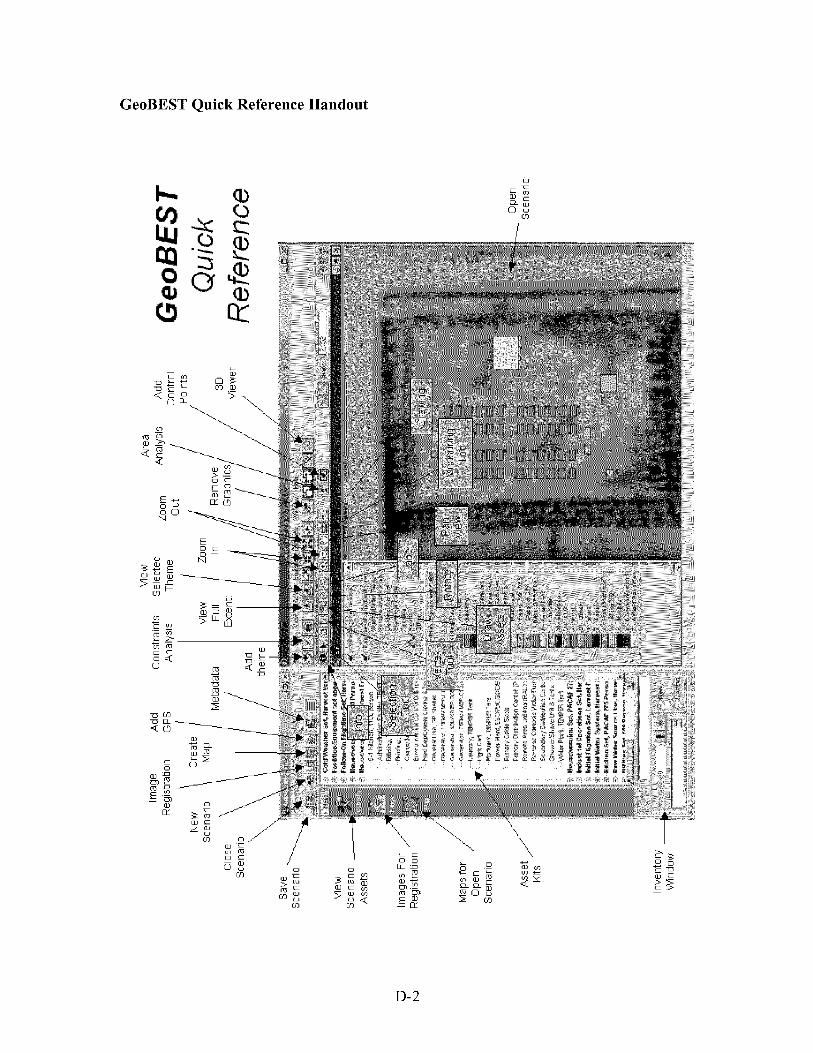
GeoBEST Quick Reference Handout
. .„ ... ^*,mr"- ». —- s,-«#>™
'11 -'iJUJ LVU.. J!| j i.i .' ■ ,!". Ij... J IJ ■
J.L !.! , J.i.'ii. .! ;i ;, -
IP: i
■:■ i' s,« to OJ ™ to v
,T-. ._., »oo E <" S CO
D-2
Appendix E: Silver Flag Student Handout
This appendix contains the GeoBase informational handout that was provided to
each of the Silver Flag students. GeoBase is introduced followed by a thorough
description of GeoBEST. Distribution of this handout was not part of the original
evaluation plan, but was recommended by the cadre members.
E-l

Silver Flag Student Handout
The GeoBase Concept Presentatio n by Capt Shawn Jensen, AFIT/GEEM
In the fall of 1998 representatives from the communications and information management community met with civil engineer agencies to explore how the two functional missions could better share geospatial information resources. The desired outcome of the GeoBase effort is to ensure each USAF installation has the organic capacity to access, exploit, and maintain one geospatial information infrastructure supporting multiple mission needs.
Based on proven, commercial off-the-shelf (COTS) computer hardware and software (ESRI™ Arc View), GeoBase provides a Common Installation Picture. It is not a "system" in the sense of a software package such as Microsoft™ Office, but is more of a concept based on integrating multiple data sets into a common architecture using proven geospatial technology. The applications of GeoBase are numerous. It can be used to provide daily mission support for facility management, airfield operations, explosive safety siting, and communications maintenance. Emergency services can use the tool to plot cordons around emergency sites and reroute traffic flow. Airfield obstructions can be managed to a higher degree of accuracy providing aircrews with a better visualization of the airfield. Communications cables and utility lines can be located to a higher degree of accuracy when performing construction, preventing unscheduled outages. All base users would be working from the same data sets, ensuring that the current information is up-to-date and accurate. Figure 1 is an example of a GeoBase emergency response tool in use at Moody AFB, Georgia. Automated screens prompt users for information about facility numbers, size of cordon needed, traffic rerouting, and several other features.
With FY02 AF funding, it is expected that GeoBase foundation data and core applications can be acquired and implemented at all USAF installations within two years. The next step will be DoD-wide implementation and further development of the GeoReach concept, which takes the functionality of GeoBase and adds a virtual toolkit of planning, analysis, and communications software for use at a bare base or other forward operating locations. GeoReach is essentially a deployable version of GeoBase and includes a Contingency Aircraft Parking Planner (CAPP) and a bare base planning tool called GeoBEST. The following section describes this program in detail.
E-2

*-'.*(; O ■ : ;
.-V ,v
*/•' , * •'/• ^*j *-»- «Ä*
17 "7 ■•■•»■'■■
. .ft JJL - fj
i %:, T ^*tJ " m
1
Figure 1: GeoBase Emergency Response Tool
GeoBEST
GeoBEST (Base Engineering Survey Toolkit) is a PC-based GIS application designed to give the user the ability to view the spatial extent of a selected location. They can then match the resources to be deployed with the appropriate locations in a spatial configuration that conforms to established siting standards. GeoBEST was created by BTG Delta Research Division, Niceville, FL under the name Bare Base Conceptual Planning System (BBCPS). It was later renamed GeoBEST to help identify it as a part of the GeoReach program. Initially developed for use in the Pacific Air Force (PACAF) theater of operations, GeoBEST provides the deployment planners with an automated, interactive, computer-based tool for rapid development of base layout plans. This can be applied to any location for which imagery is available. The application allows the user to import various types of imagery and locate each of the facilities required at the identified location in response to a defined scenario. Following is a more detailed description of the program including some images of GeoBEST in use.
Like GeoBase and GeoReach, GeoBEST is based on commercially available off- the-shelf software. The user interface, created with Microsoft™ Visual Basic, interacts with ESRI™ Arc View and a Microsoft™ Access database. The GeoBEST interface consists of a split screen, with the Visual Basic window on the left and the Arc View window on the right, as shown in Figure 2.
E-3

I* ; L'L-'--- .■ -■ ■■ \". .
Figure 2: GeoBEST user interface
When working with GeoBEST, the user's work will be saved as a "scenario." Each scenario stores the data sets (imagery, assets, etc.), inventory and number of allocated assets, and map layouts. Users initially have the option of either opening an existing scenario or creating a new one. GeoBEST comes with eighteen pre-made scenarios (without imagery) based on the dispersed facility layouts shown in AFP AM 10- 219, Vol. 5, Attachment 15. These can be used on their own or imported into other scenarios. When creating a new scenario, the user may elect to create a blank scenario (inventory and depbyment packages set to zero) or use the scenario wizard. Blank scenarios are primarily intended for creation of new templates. The scenario wizard walks the user through the development of a scenario that will generate the recommended asset kits based on the entry of a base population and/or selected aircraft types and quantities. The user has the option of accepting the recommended asset quantities or modifying them if the exact quantities are known. Once a new scenario is created, the user may display the individual asset inventories within each kit. If the wizard was used, GeoBEST automatically calculates the number of individual assets needed based on the aircraft number or population. Again, the user may accept these quantities or modify them as needed.
Scenarios in GeoBEST may consist of only the allocated assets or the user may add additional data sets depending on what is available and what information is needed about the site. Arc View has the capability of integrating a variety of different data sets, including AutoCAD files, shape files, Intergraph Design files, image formats (jpg, bmp, tif, sid, gif, etc.), GPS data sets, and many more. Each data set is added as a "theme," which could be thought of as a layer. The different themes may be displayed or hidden as needed. The GeoBEST database stores the dimensions of each deployable asset (length, width, and height) in terms of its footprint (ie. the space it occupies as opposed to its actual shape). In order to ensure the allocated assets are scaled correctly, the user must
E-4

specify the map units. This is obviously dependent on the data sets that are being used as background themes. GeoBEST is capable of working in meters or feet. Arc View has the capability of re-scaling image files based on the image resolution or the dimensions of an object displayed in the image (size of a building or width of a runway). Arc View 3.2 does not have the ability to rotate the images. Figure 3 below shows an open scenario with allocated assets and a bitmap image as the background theme.
^ ;.... 46
'tSfiiip ■:
ii'.. •
r
■ -. . i si'waia
"/ ... ,',. t|t jfS -
mm
t.-mm~. +. u ►
■■■■III^^H
* .. • « .
f +
Figure 3: Open GeoBEST Scenario
Once assets have been added to a scenario, they may be rotated or grouped with other assets. GeoBEST Constraints Analysis tool has the ability to analyze groups of facilities to determine if they meet the distance requirements for non-dispersed and dispersed layouts. For example, there should be at least 12 feet between billeting TEMPER tents in a non-dispersed layout. Areas within the scenario can be analyzed to determine the number of a particular asset that will fit within the designated area (dispersed and non-dispersed).
GeoBEST includes metadata (additional information) for many of the individual assets. Most assets have a text description and many also have an image. GeoBEST allows the user to add text, image, audio and video files for individual assets if they are available. Figure 4 below is an example of metadata for a Harvest Falcon MEP-012 generator, which is included with the current version of GeoBEST.
E-5

Generate, 7KH.K ME=-'312rt: 75C f /■/ ^40C "41EU.' IBe^ic GPiie'aioi frr f^r-je-camp power pfant u.'= '•-*- bcff.indinHiP.'cJEsc'cencsrapTicn' if rupale
j! !rrLU| I, u.ed Co11 j|_tuttr dum. JI Lülibr . hichoapac tu pove! pants Derate to 625 kW d
jprpvrlp si«tde h rf\f^<= gm<?Rta pft*?i»r-) cüütiol jnd mrvivabilily. For hkjhcthrfcSt SM
joyctem.
Figure 4: Metadata text and image for MEP-012
GeoBEST has the ability to display scenarios in a three-dimensional format. The user can pan, zoom, or rotate the 3D image to view particular areas or even select a continuous "fly- around" view. The current view can be saved as a JPEG or BMP image for importing into documents or presentations. Figure 5 below is an example of a 3D view, showing the scenario displayed in Figure 11.
«■>!' 1 1 'lJ:
1\.V
Figure 5: Scenario 3D View
The GeoBEST report generator allows the user to create custom reports relating to all assets or currently allocated assets in the active scenario. Currently, GeoBEST offers five types of reports. These include All Scenarios, Facilities/Equipment Inventory, Deployment Package Inventory, Labor Requirements, and Power Requirements.
E-6

- All Scenarios: This report lists all scenarios that have been created and their general information, which includes the scenario ID, name, population, directory location, date, created, date modified, and the user who created it.
- Facilities/Equipment Inventory: This report contains information regarding the current scenario assets. This report includes general information about the current scenario as described above (asset name, number inventoried, number allocated, and number recommended). The report can display all assets in the selected deployment packages or just the currently allocated assets in the view.
- Deployment Package Inventory: This report contains information regarding the deployment packages related to scenarios that were selected during the initial creation of the scenario. The report includes general information about the current scenario as described above (the asset name and which deployment package it belongs to). This report can only display all assets in the selected deployment.
- Labor Requirements: This report contains information regarding the labor hours required per asset. The report includes information pertaining to the current scenario (asset name, number allocated, required labor hours, total required labor hours, and a description of the type of labor required). This report can display all assets in the selected deployment packages or just the currently allocated assets in the view.
- Power Requirements: This report contains information regarding the power required per asset in kilowatt-amperes. This report includes general information for the current scenario (asset name, number allocated, normal power voltage, total normal power voltage, air conditioning voltage, and total air conditioning voltage). This report can display all assets in the selected deployment packages or just the currently allocated assets in the view.
GeoBEST includes the ability to manage the database. Users can modify information about the deployment kits, modify or add/delete individual assets, adjust the number of personnel associated with each type of aircraft, or correct any deficiencies or inaccurate information.
E-7

Bibliography
1. Aerospace C2 & ISR Center, JEFX Final Report, https://jefxlink.langley.af.mil/ fmal2000/reportl .asp. March 2001.
2. Ajzen, leek. "From Intentions to Actions: A Theory of Planned Behavior," in Action Control: From Cognition to Behavior. Ed. J. Kuhl and J. Beckerman. New York: Springer Verlag, 1985.
3. Aviano, Ramstein teams prepare to house troops. United States Air Force news website. http://www.af.mil/news/Feb 1999/nl9990220_990276.html. February 1999.
4. Bare Base Camp, Just Add Water. United States Air Force news website. http://www.af.mil/news/Octl997/nl9971023_971337.html. October 1997.
5. BTG Delta Research Division. "Bare Base Contingency Planning System (CPS)." Excerpt from fact Sheet, http://www.btggis.com/pdfs/bbl.pdf 1998.
6. BTG Delta Research Division. "Latest News - BTG Geographic Information Systems (GIS)." Excerpt from web site, http://www.btggis.com/news.html. 2000.
7. BTG Delta Research Division. "Report Generator." Excerpt from GeoBEST software on- line help file. Date unknown.
8. Cronbach's Alpha: A Tool for Assessing the Reliability of Scales. Journal of Extension web site, http://www.joe.org/joe/1999april/tt3.html. 37:2. April 1999.
9. Cullis, Brian J. "Installation Geospatial Information & Services: New Situational Awareness For Commanders." Air War College, Maxwell AFB, AL. October 2000.
10. Cullis, Brian J. "USAF GeoBase." Presentation given at Corona GeoBase meeting. US Air Force Academy, CO. 5 October 2000.
11. Davis, Fred D. "User acceptance of information technology: system characteristics, user perceptions and behavioral impacts." International journal of Man-Machine Studies (1993), Vol. 38, pg. 475-487.
12. Davis, Fred D. "Perceived Usefulness, Perceived Ease of Use, and User Acceptance of Information Technology," MIS Quarterly, 13: 319-340 (September 1989).
BIB-1

13. Davis, Fred D., Richard P. Bagozzi, and Paul R. Warshaw. "User acceptance of computer technology: A comparison of two theoretical models." Management Science, 35:8 (August 1989).
14. Decision Dynamics, Inc. "PlanMaster. U.S. Air Force BareBase. Final Report." Waldorf, MD. November 1996.
15. Department of the Air Force. Bare Base Conceptual Planning Guide. AFP 93-12 Volume III. Washington DC: HQ USAF, (date unknown).
16. Department of the Air Force. Bare Base Conceptual Planning Guide. AFPAM 10-219 Volume 2. Washington DC: HQ USAF, November 1996.
17. Department of the Air Force. Bare Base Conceptual Planning Guide. AFPAM 10-219 Volume 5. Washington DC: HQ USAF, December 1996.
18. Department of the Air Force. Air Force Doctrine Document 42: Civil Engineer. AFDD 42. Washington DC: HQ USAF, December 1994.
19. Department of the Air Force. Silver Flag Exercise Site: FY00 Predeployment Information for Civil Engineers. Tyndall AFB, FL: Detachment 1, 823 RED HORSE Squadron, October 1999.
20. Devore, Jay L. Probability and Statistics for Engineering and the Sciences. Pacific Grove, CA. Duxbury, 2000.
21. Dillon, Andrew and Michael G Morris. "User Acceptance of Information Technology: Theories and Models," Annual Review of Information Science and Technology (ARIST), 31, 1996.
22. Fishbein, Martin and leek Ajzen. Belief Attitude, Intention, and Behavior: An Introduction to Theory and Research. Reading MA: Addison-Wesley, 1975.
23. Geographic Information Systems - GIS. United States Geological Survey website, http://info.er.usgs.gov/research/gis/title.html.
24. "GIS Glossary." Environmental Systems Research Institute website. http://www.esri.com/library/glossary/glossary.html.
25. Henry, Pradeep. "Software Usability Via Usability Testing." Quality Assurance Institute's 1st Annual International Software Testing Conference. India: 1999. http://www.tech-bridge.com/qai-paper.html.
BIB-2

26. Jackson, Cynthia M., Simeon Chow and Robert A. Leitch. "Toward an Understanding of the Behavioral Intention to Use an Information System," Decision Sciences, 28:357-389 (Spring 1997).
27. Lucas, Henry C, Jr. and V. K. Spitler. "Technology Use and Performance: A Field Study of Broker Workstations," Decision Sciences, 30:291-311 (Spring 1999).
28. Mathiason, Kieran. 1991. Predicting User Intentions: Comparing the Technology Acceptance Model with the Theory of Planned Behavior. Information Systems Research, 1991; 2(3): 173-191.
29. Morris, Michael G. and Andrew Dillon. "How User Perceptions Influence Software Use," IEEE Software, 14: 58-65 (July/August 1997).
30. Multiple Regression. New Mexico State University Psychology Department web site. Created by Rainer Link, Chuck Harrison, and Elaine Gilman. http://www- psych.nmsu.edu/regression/home.html. December 1995.
31. Multivariate Statistics: Factor Analysis. Cornell University web site. http://trochim.human.cornell.edu/tutorial/flynn/factor.htm. August 2001.
32. PA 765: ANOVA. North Carolina State University web site. http://www2.chass.ncsu.edu/garson/pa765/anova.htm. August 2001.
33. Ramsey, Robert, Capt. 20th Civil Engineer Squadron. Shaw Air Force Base, SC. Personal interview. June 1999.
34. Remote Sensing Principles. Center for Remote Imaging, Sensing, and Processing; National University of Singapore website, http://www.sci- ctr.edu. sg/.
35. Roscoe, John T. Fundamental Research Statistics for the Behavioral Sciences, 2nd Edition. New York. Holt, Reinhart, & Winston, 1975.
36. Sail, John, Ann Lehman and Lee Creighton. JMP Start Statistics. Pacific Grove, CA. Duxbury,2001.
37. Szajna, Bernadette. "Empirical Evaluation of the Revised Technology Acceptance Model," Management Science, 42:85-92 (January 1996).
38. Taylor, Shirley and Peter A. Todd. "Understanding Information Technology Usage: A Test of Competing Models." Information Systems Research. 1995; 6(2): 144-176.
BIB-3

39. The USAF GeoBase Advances. GeoBase Forum newsletter. Institute for Information Technology Applications (UTA). US Air Force Academy, CO. Jan/Mar 2000. http://www.geobase.org.
40. Torkzadeh, Gholamreza and D. J. Dwyer. "A Path Analytic Study of Determinants of Information System Usage," International Journal of Management Science, 22(4):339-348 (1994).
41. Trimble - Why GPS? Trimble Navigation Limited website, http ://www.trimble. com.
42. United States Air Force Museum. "Civil Engineering During the Vietnam War." http://www.wpafb.af.mil/museum/history/vietnam/ce.htm.
43. United States Air Force. Air Force Vision 2020. http://www.af.mil/vision. May 2000.
44. Venkatesh, Viswanath and Fred D. Davis. "A Model of the Antecedents of Perceived Ease of Use: Development and Test," Decision Sciences, 27:451-481 (Summer 1996).
45. Venkatesh, Viswanath and Fred D. Davis. "A Theoretical Extension of the Technology Acceptance Model: Four Longitudinal Field Studies." Management Science, 46: 186-204 (February 2000).
46. Venkatesh, Viswanath and Michael G Morris. "Why Don't Men Ever Stop to Ask for Directions? Gender, Social Influence, and Their Role in Technology Acceptance and User Behavior," MIS Quarterly, 24: 115-139 (March 2000).
47. Vinson, Dean and Smith, Joe. Guide to Bare Base Assets. Civil Engineer and Services School, Wright-Patterson AFB, Ohio. October 1996.
48. Walker, Lois. "Gulf War Retrospective." Air Force Civil Engineer. Air Force Civil Engineer Support Agency (Spring 2001).
49. "What is GIS?" Environmental Systems Research Institute website. http://www.gis.com/whatisgis/whatisgis.pdf
50. Williams, Jeffrey. BTG Delta Research Division. Niceville, FL. Personal interview. 11 Jan 02.
51. Williams, Jeffrey. BTG Delta Research Division. Niceville, FL. Personal interview. 18 June 01.
BIB-4

Vita
Captain Shawn J. Jensen was born in Safford, Arizona. He graduated from
Dexter High School in Dexter, New Mexico in 1990. He attended New Mexico State
University the same year and graduated with a Bachelor of Science Degree in Mechanical
Engineering in December 1996. He was also commissioned through the New Mexico
State University ROTC detachment in December 1996.
His first assignment was at Shaw AFB in South Carolina where he was the
Deputy Chief of the Resources Flight and Project Design Manager until June 1999. Then
he was assigned to Headquarters Central Command Air Forces (USCENTAF) at Shaw
AFB where he was Chief of Plans and Exercises. In August 2000, he entered the Air
Force Institute of Technology at Wright Patterson AFB, Ohio. Upon graduation, he will
be assigned to Headquarters Air Combat Command, Langley AFB, Virginia.
VIT-1

REPORT DOCUMENTATION PAGE Form Approved OMB No. 074-0188
The public reporting burden for this collection of information is estimated to average 1 hour per response, including the time for reviewing instructions, searching existing data sources, gathering and maintaining the data needed, and completing and reviewing the collection of information. Send comments regarding this burden estimate or any other aspect of the collection of information, including suggestions for reducing this burden to Department of Defense, Washington Headquarters Services, Directorate for Information Operations and Reports (0704-0188), 1215 Jefferson Davis Highway, Suite 1204, Arlington, VA 22202-4302. Respondents should be aware that notwithstanding any other provision of law, no person shall be subject to an penalty for failing to comply with a collection of information if it does not display a currently valid OMB control number. PLEASE DO NOT RETURN YOUR FORM TO THE ABOVE ADDRESS.
1. REPORT DATE (DD-MM-YYYY) 26-03-2002
2. REPORT TYPE Master's Thesis
3. DATES COVERED (From - To) Aug 2000 - Mar 2002
4. TITLE AND SUBTITLE
AN EVALUATION OF GEOBEST CONTINGENCY BEDDOWN PLANNING SOFTWARE USING THE TECHNOLOGY ACCEPTANCE MODEL
5a. CONTRACT NUMBER
5b. GRANT NUMBER
5c. PROGRAM ELEMENT NUMBER
6. AUTHOR(S)
Jensen, Shawn J., Captain, USAF
5d. PROJECT NUMBER
5e. TASK NUMBER
5f. WORK UNIT NUMBER
7. PERFORMING ORGANIZATION NAMES(S) AND ADDRESS(S)
Air Force Institute of Technology Graduate School of Engineering and Management (AFIT/EN) 2950 P Street, Building 640 WPAFB OH 45433-7765
8. PERFORMING ORGANIZATION REPORT NUMBER
AFIT/GEE/ENV/02M -04
9. SPONSORING/MONITORING AGENCY NAME(S) AND ADDRESS(ES) 10. SPONSOR/MONITOR'S ACRONYM(S) Maj. Jani McCreary Det1,823RHS/CC 264 Strange Pt Loop Tyndall AFB, FL 32403 DSN 523-8700 MAJCOM: ACC
Air Force Civil Engineer ATTN: Col Brian Cullis, USAF Crystal Gateway One, Ste 1000 1235 Jefferson Davis Hwy Arlington, VA 22202-3276 DSN 664-3632; MAJCOM: DRU
Lt Col Josuelito Worrell HQ AFCESA/CEX 139 Barnes Dr. Ste 1 Tyndall AFB, FL 32403-5319 DSN 523-6124 MAJCOM: DRU
11. SPONSOR/MONITOR'S REPORT NUMBER(S)
12. DISTRIBUTION/AVAILABILITY STATEMENT
APPROVED FOR PUBLIC RELEASE; DISTRIBUTION UNLIMITED.
13. SUPPLEMENTARY NOTES
14. ABSTRACT GeoBEST is a software program designed to simplify the contingency beddown planning process through application of geographic information technology. The purpose of this thesis was to thoroughly evaluate GeoBEST using prospective GeoBEST users in a realistic beddown planning scenario. The Technology Acceptance Model (TAM) was applied, which measures a prospective user's perceptions of the technology's usefulness and ease-of-use and predicts their intentions to use the software in the future. The evaluation also included a qualitative evaluation of specific software features. The test group for this thesis was seventy-one Civil Engineering students attending contingency skills training at the Silver Flag training site, Tyndall AFB, FL. The students were given a one-hour interactive demonstration of GeoBEST after which they completed a survey. The students were given the option of using the program for preparation of their assigned beddown plan. The results from the TAM predict that the students were only slightly likely to use GeoBEST for beddown planning in the future. Throughout the course of the research, several features of GeoBEST were identified that limit the program's effectiveness. Some of these were minor irritants, while others were serious design flaws. Recommendations are made for implementation of GeoBEST and creation of training programs. 15. SUBJECT TERMS Civil Engineering; Geographic Information Systems; Technology Acceptance Model; Beddown Planning; Information Systems; Software Tools; Global Positioning System
16. SECURITY CLASSIFICATION OF:
b. ABSTRACT
u c. THIS PAGE
u
17. LIMITATION OF ABSTRACT
UU
18. NUMBER OF PAGES
167
19a. NAME OF RESPONSIBLE PERSON Lt Col Heidi S. Brothers, AFIT/ENV
19b. TELEPHONE NUMBER (Include area code) (937) 255-3636, ext 4800 email: [email protected]
Standard Form 298 (Rev. 8-98) Prescribed by ANSI Std. Z39-18


![Winter Contingency Plan 2019 - PDMA Contingency... · 2020. 12. 24. · [KHYBER PAKHTUNKHWA WINTER CONTINGENCY PLAN 2019-20] Winter Contingency Plan 5 | Page utilizing PAF strategic](https://img.pdfslide.us/doc/110x75/611400065caf3c03a80f7591/winter-contingency-plan-2019-pdma-contingency-2020-12-24-khyber-pakhtunkhwa.jpg)