Embed Size (px)
Citation preview

AN EVALUATION OF CONCERNS OF EXTENSION FIELD FACULTY
IN WESTERN STATES REGARDING RENEWABLE ENERGY
EDUCATION AS IT PERTAINS TO PROGRAMMATIC
DESIGN AND IMPLEMENTATION
by
Sarah Ann Hamlen
A thesis submitted in partial fulfillment of the requirements for the degree
of
Master of Science
in
Agricultural Education
MONTANA STATE UNIVERSITY Bozeman, Montana
April 2012

©COPYRIGHT
by
Sarah Ann Hamlen
2012
All Rights Reserved

ii
APPROVAL
of a thesis submitted by
Sarah Ann Hamlen
This thesis has been read by each member of the thesis committee and has been found to be satisfactory regarding content, English usage, format, citation, bibliographic style, and consistency and is ready for submission to The Graduate School.
Dr. Shannon Arnold
Approved for the Agricultural Education Division
Dr. Jeff Jacobsen
Approved for The Graduate School
Dr. Carl A. Fox
iii
STATEMENT OF PERMISSION TO USE
In presenting this thesis in partial fulfillment of the requirements for a master’s
degree at Montana State University, I agree that the Library shall make it available to
borrowers under rules of the Library.
If I have indicated my intention to copyright this thesis by including a copyright
notice page, copying is allowable only for scholarly purposes, consistent with “fair use”
as prescribed in the U.S. Copyright Law. Requests for permission for extended quotation
from or reproduction of this thesis in whole or in parts may be granted only by the
copyright holder.
Sarah Ann Hamlen April 2012
iv
TABLE OF CONTENTS 1. INTRODUCTION AND STATEMENT OF THE PROBLEM ......................................1
Background and Setting ...................................................................................................1 Research Question ...........................................................................................................7
Purpose .....................................................................................................................7 Objectives ................................................................................................................8 Definition of Terms..................................................................................................8 Limitations of the Study...........................................................................................9 Basic Assumptions of the Study ..............................................................................9
Significance of the Study .................................................................................................9 2. THEORETICAL FRAMEWORK AND REVIEW OF THE LITERATURE .............13
Introduction ....................................................................................................................13 Theoretical Framework ..................................................................................................13
History of Change Theory .....................................................................................14 Change Theory in Education .................................................................................17
Review of the Literature ...............................................................................................22 Personal Concerns and Extension Change .............................................................22
Adoption of Sustainable Agriculture .........................................................23 Personal Concerns Related to Designing Curriculum and Training ..........................................................25
Analysis of Organizational Context .......................................................................27 Perceptions Related to Extension Theories................................................27 Extension as a Learning Organization .......................................................30 Extension’s Role in Renewable Energy .....................................................33 Personal Concerns Assessment In Addressing Organizational Change .......................................................36
Historical Development of the SoCQ ....................................................................39 Reliability of the Stages of Concern Questionnaire ...................................39 Applications of SoCQ Research ................................................................42
3. METHODOLOGY .......................................................................................................43
Methodology ..................................................................................................................43 Research Design.............................................................................................................43 Procedures ......................................................................................................................45
Permission and Validation of Use for Extension Faculty .................................................................................45
Research Design............................................................................................................46 Demographic Survey .............................................................................................46 Stages of Concern Questionnaire ...........................................................................46

v
TABLE OF CONTENTS - CONTINUED Data Collection ......................................................................................................48 Data Processing and Analysis ................................................................................51 Use of ANOVA and Post Hoc t-Test Analysis ......................................................52
4. RESULTS .....................................................................................................................53
Introduction ....................................................................................................................53 Questionnaire Respondent Demographics .............................................................54 Response and Non-Response Analysis ..................................................................58 Data Analysis of SoCQ Constructs ........................................................................61
Data Analysis of the Research Objectives ....................................................................66 Research Objective 1 Present Level of Engagement ................................................................................67 Research Objective 2 Concerns of Educators by State .............................................................................72 Research Objective 3 Concerns of Educators by Job Function ................................................................82 Research Objective 4 Concerns of Educators by Subgroups ....................................................................89
Subgroup A: Time in Extension ...............................................................89 Subgroup B: Age of Faculty Member .......................................................94 Subgroup C: Work History .......................................................................97
5. CONCLUSIONS, IMPLICATIONS, AND RECOMMENDATIONS .......................102
Representative Nature of the Sample ...........................................................................102 Understanding the “Nonuser” ......................................................................................103 Implications of Findings for Each Subgroup ...............................................................109
Total Respondents ................................................................................................109 Respondent Concerns by State .............................................................................110 Respondent Concerns by Primary Job Function ..................................................111 Respondent Concerns by Time in Extension .......................................................112 Respondent Concerns by Age of Faculty Member ..............................................117 Respondent Concerns by Work History ..............................................................117
Analysis of Findings Relative to the Principles of Change .........................................117 Change Principle 1: Change is Learning ............................................................118 Change Principle 2: Change is a Process, Not an Event .......................................................................121 Change Principle 3: The Local Organization is the Primary Unit for Change ......................................................125 Change Principle 4: Organizations Adopt Change – Individuals Implement Change ............................................................126
vi
TABLE OF CONTENTS - CONTINUED Change Principle 5: Interventions are the Key to Success of the Change Process ................................................................126 Change Principle 6: Appropriate Interventions Reduce Resistance to Change ..............................................................................131 Change Principle 7: Administrative Leadership Is Essential to Long-Term Change Success .........................................................134 Change Principle 8: Facilitating Change is a Team Effort .......................................................................................................136 Change Principle 9: Mandates Can Work ...........................................................139 Change Principle 10: The Context Influences the Process of Learning and Change ....................................................................141
Summary ..........................................................................................................................142 Suggestions for Further Research ....................................................................................145
REFERENCES CITED ....................................................................................................148 APPENDICES .................................................................................................................155
APPENDIX A: IRB Training Certificate ............................................................156 APPENDIX B: Personal Correspondence ...........................................................158 APPENDIX C: Request for Involvement of WY and CO ...................................161 APPENDIX D: Survey Instrument ......................................................................164
vii
LIST OF TABLES
Table Page
1. Coefficients of Internal Reliability and Test-Retest Correlations (1974) ................................................40
2. Coefficients of Internal Reliability for Various Studies ....................................41 3. SoCQ Survey Respondents by State ..................................................................51 4. SoCQ Survey Participation as a Percentage of State Population ..........................................................................54
5. Sex of Respondent by State ...............................................................................55 6. SoCQ Survey Respondents by Age and State....................................................56
7. SoCQ Survey Respondents by Position Type ....................................................58 8. Comparisons of Responders and Non-Responders on Randomly Selected SoCQ.................................................................................60
9. SoCQ Descriptive Statistics, Skewness, Kurtosis and Normality ....................................................................62 10. Descriptive Statistics of Present Engagement in Energy Education ....................................................................68
11. ANOVA Analysis of Respondents by Hours Spent in Energy Education ..............................................................72 12. Descriptive Statistics & ANOVA Analysis of Respondents by Concern Stage and State .............................................................................81
13. ANOVA Analysis of Respondents by Position Type ......................................88
14. ANOVA Analysis of Respondents by Time in Extension ............................................................................................93
15. ANOVA Analysis of Respondents by Age of Educator ...............................................................................................97
viii
LIST OF TABLES - CONTINTUED
Table Page 16. ANOVA Analysis of Respondents by Work History .................................................................................................101 17. Non-user Types and Descriptions .................................................................104

ix
LIST OF FIGURES
Figure Page
1. Adopter Categorizations by Innovativeness ......................................................15
2. Hypothesized Concerns Profile Using the SoCQ Instrument ...............................................................................37 3. Respondent Years in Extension .........................................................................56 4. Years in Current Extension Position ..................................................................57 5. Histogram and Normal Q-Q Plot of SoCQ Distribution Stage 0 ............................................................................63 6. Histogram and Normal Q-Q Plot of SoCQ Distribution Stage 1 ............................................................................63 7. Box Plot of SoCQ Stage 1 Including Outlier ....................................................64 8. Box Plot of SoCQ Stage 6 Including Outliers ..................................................65 9. Present Faculty Engagement in Energy Education ...........................................69 10. SoCQ Profile by Energy Involvement per Annum ...................................................................................71 11.Stages of Concern Profile (All Respondents) ..................................................73 12. High Stage Score (Total Respondents) ...........................................................76
13. Second High Stage Score (Total Respondents) ..............................................77 14. SoCQ Profiles by State ...................................................................................78 15. High Stage Score by State ...............................................................................79 16. Second High Stage Score by State ...................................................................79 17. SoCQ Profile for Educators by Position Type ................................................84 18. High Stage Score by Position Type ................................................................86

x
LIST OF FIGURES – CONTINUED
Figure Page
19. Second High Stage Score by Position Type ....................................................86 20. SoCQ Profile for Educators by Time in Extension ..........................................90 21. High Stage Score by Time in Extension .........................................................91 22. Second High Stage Score by Time in Extension ............................................92 23. SoCQ Profiles by Age .....................................................................................95
24. High Stage Score by Age ................................................................................95
25. Second High Stage Score by Age ....................................................................96
26. SoCQ Profiles by Work History .....................................................................98
27. High Stage Score by Work History .................................................................99 28. Second High Stage Score by Work History ..................................................100
xi
ABSTRACT
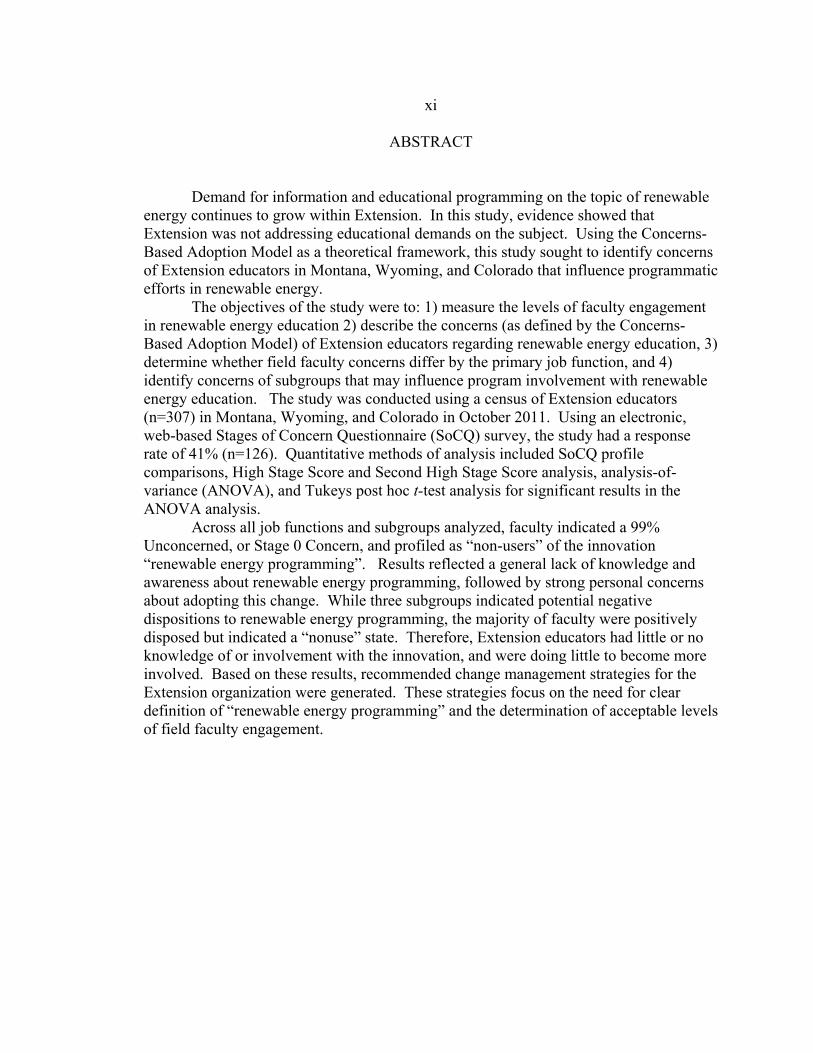
Demand for information and educational programming on the topic of renewable energy continues to grow within Extension. In this study, evidence showed that Extension was not addressing educational demands on the subject. Using the Concerns-Based Adoption Model as a theoretical framework, this study sought to identify concerns of Extension educators in Montana, Wyoming, and Colorado that influence programmatic efforts in renewable energy.
The objectives of the study were to: 1) measure the levels of faculty engagement in renewable energy education 2) describe the concerns (as defined by the Concerns-Based Adoption Model) of Extension educators regarding renewable energy education, 3) determine whether field faculty concerns differ by the primary job function, and 4) identify concerns of subgroups that may influence program involvement with renewable energy education. The study was conducted using a census of Extension educators (n=307) in Montana, Wyoming, and Colorado in October 2011. Using an electronic, web-based Stages of Concern Questionnaire (SoCQ) survey, the study had a response rate of 41% (n=126). Quantitative methods of analysis included SoCQ profile comparisons, High Stage Score and Second High Stage Score analysis, analysis-of-variance (ANOVA), and Tukeys post hoc t-test analysis for significant results in the ANOVA analysis.
Across all job functions and subgroups analyzed, faculty indicated a 99% Unconcerned, or Stage 0 Concern, and profiled as “non-users” of the innovation “renewable energy programming”. Results reflected a general lack of knowledge and awareness about renewable energy programming, followed by strong personal concerns about adopting this change. While three subgroups indicated potential negative dispositions to renewable energy programming, the majority of faculty were positively disposed but indicated a “nonuse” state. Therefore, Extension educators had little or no knowledge of or involvement with the innovation, and were doing little to become more involved. Based on these results, recommended change management strategies for the Extension organization were generated. These strategies focus on the need for clear definition of “renewable energy programming” and the determination of acceptable levels of field faculty engagement.
1
CHAPTER 1 – INTRODUCTION AND STATEMENT OF PROBLEM
Background and Setting The Morrill Act of 1862 created the land-grant universities in the United States (7
U.S.C. 301). The subsequent development of the Cooperative Extension Service (CES)
in the Smith-Lever Act of 1914 (7 U.S.C. 3103) established a partnership of localized
outreach from the land-grant universities between federal, state, and county governments.
This act resulted in the faculty of the universities being available in almost every county
in the United States. McDowell (2003) asserts that the principle of engaging citizens
with institutions of higher education in these acts was without precedent and “provided
access to new knowledge to those who would never qualify, nor want, to be in
classrooms” (p 33).
Linking the research and education functions of universities with society is a
primary tenet of Extension. Perspectives differ as to the relevance of this linkage. For
example, former president of Harvard University, Derek Bok, argues that without the
engagement of universities in society, the society is in peril (Bok, 1994); while the
Kellogg Commission suggests that unless universities engage in society, the universities
are in peril (Kellogg Commission on the Future of State and Land-Grant Universities,
1999). Notwithstanding differences of opinion on why this engagement is relevant, the
principle of engaging citizens with the universities through CES is a revolutionary
concept and its implementation has been a cornerstone of success in the history of land-
grant institutions. (McDowell, 2003)
2
However, authors of Universities and the Future of America, (Bok, 1994) and the
1999 Kellogg Commission report Returning to Our Roots: The Engaged Institution
(1999) argue that societal needs are changing and that universities must organize
themselves to engage more fully with citizens on relevant issues. The system risks peril
if it fails to engage as it may not be perceived as sufficiently relevant in society
(McDowell, 2003). The Kellogg President’s Commission summarizes this risk in stating,
We are convinced that unless our institutions respond to the challenges and opportunities before them they risk being consigned to a sort of academic Jurassic Park – of great historic interest, fascinating places to visit, but increasingly irrelevant in a world that has passed them by (McDowell G. , 2003, p. 32).
To mitigate the risk of becoming irrelevant, universities must continually
find new means of engaging with society on relevant issues.
The onus of responsibility for engagement on relevant issues is borne by CES, as
it was created to be the primary linkage between land-grant universities and society. By
examining CES’s response to one societal issue, it may be possible to both establish
whether CES (and by extension, the land-grant institutions) are responsive to changing
societal needs and the extent to which prior practices continue to meet the needs of
constituents.
Examination of the Cooperative Extension Services’ ability to engage can be
conducted on the relevant societal issue of renewable energy. Evidence of renewable
energy as a relevant societal issue is presented in the 2011 State of the Union Address
(White House, 2011), the US Farm Bill (USDA, 2006), and the Western Extension
Director’s Association (WEDA) reports from 2006 to present. Federal and state partners
3
in the CES model recognize renewable energy as a relevant topic. Research suggests that
Extension professionals have a “growing responsibility to provide research-based data
about these emerging [renewable energy] opportunities” (Fortson, 2006). Additionally,
the United States Department of Agriculture’s (USDA) National Institute of Food and
Agriculture (NIFA) established a national plan of work to identified areas of focus for all
USDA-NIFA agencies, of which Extension is one. Of five NIFA national priorities,
sustainable energy is number three (NIFA, 2010). In the February 2, 2010, State Plans of
Work Newsletter, NIFA identifies that USDA has developed these priorities “to properly
address solving these [sustainable energy] agricultural issues, not just working on them”
(NIFA, 2010). The Association of Public and Land-Grant Universities (APLU) provides
additional evidence of the recognized need for Extension involvement in renewable
energy education. Energy is one of the APLU’s ten Major Initiatives (APLU, 2011).
There are five subcategories within the APLU Energy Initiative. The subcategories
include: 1) Energy Technology Successes; 2) Improving Energy Efficiency of Existing
Energy Sources; 3) Renewable Energy; 4) Energy Policy and On-Campus
Demonstration, Development and Outreach; and 5) Utilizing Cooperative Extension to
Bring Warmth Home. CES is not referenced in the first four subcategories, where the
2011 APLU Initiative identifies specific examples of university engagement in energy.
As an example, in the subcategory of Renewable Energy, the initiative identifies,
Examples of universities’ promising research in biomass and biofuels abound. [The] Georgia Institute of Technology, working with industry partners and other universities, is working on turning softwoods and algae into biofuels. Micro-organisms developed by Oklahoma State and the University of Oklahoma have been licensed and are used to convert biomass to ethanol (p. 2)

4
This description indicates an awareness by APLU of specific activities and efforts of
universities in addressing renewable energy.
In contrast, the subcategory entitled Utilizing Cooperative Extension to Bring
Warmth Home indicates potential for Extension involvement in energy, but lists no
specific or current action (APLU, 2011). APLU indicates that Extension has worked to
provide information to constituents on energy issues. “There is much more, however,
that may be achieved as national priorities for energy goals are set, if CES [Cooperative
Extension Service] is used to its full capacity” (p 2). The initiative goes on to state,
…while Cooperative Extension exists in every state and territory of the country and has a presence in almost every county, the level of ‘energy’ expertise varies greatly. Utilization of the Cooperative Extension Systems’ network of educators at the land-grant universities and distributed throughout the local environment could be a primary element on strategy for engaging individuals, businesses, and communities in energy efficiency and conservation education (p 3).
APLU then suggests a “draft” list of activities and suggested impacts in which
Cooperative Extension could provide education and assistance (p 3). An example of a
proposed activity is to educate and provide technical assistance to multiple publics on
issues of energy efficiency. For the example activities suggested by APLU, there are also
expected outcomes, such as increasing the awareness of consumers on energy issues
related to purchasing decisions (APLU, 2011). The lack of specific examples and the
suggestion of outcomes that are very basic to CES programming indicates that APLU
does not perceive the current engagement of Extension in the types of activities listed.
As early as 1978, authors of articles in the Journal of Extension argued that
energy is an important topic and that Extension should provide education that will affect
5
societal change on energy consumption and production (Born, 1980;Liles, 1978).
Stephen Born (former chairman of the Department of Urban and Regional Planning at the
University of Wisconsin-Madison) argued in 1980 that Extension should “find new
educational delivery methods, strengthen relationships within Extension and other
government entities, and develop problem-solving tool kits to address technical,
economic, and regulatory educational needs” (p. 7). However, the WEDA February
2009 report of energy-related programs and outreach in the Extension systems of the
Western states reveals that implementation of energy programming is sporadic and,
where implemented, does not tend to include Extension field faculty educators in
renewable energy outreach.
To say that CES is not involved in energy education would be inaccurate. A few
examples of CES energy programs include the Montana State University Weatherization
Training Center (Montana State University, 2011), the Consumer Education Program for
Residential Energy Efficiency that is operated in cooperation between Cornell
Cooperative Extension and the New York State Energy Research and Development
Authority (Laquatra J. M., 2009), and the Washington State University Extension Energy
Program (WSU Extension, 2011). Other examples of CES involvement in energy can be
found on eXtension. eXtension is an Internet-based collaborative environment where
Land Grant University content providers exchange objective, research-based knowledge
on a variety of topics (eXtension, 2012). The most robust CES-produced materials on
eXtension are found in Home Energy, but some resources are available in Farm and
Wood Energy categories as well (eXtension, 2011). In 2009, WEDA developed a more
6
specific inventory of energy programming taking place in the Western States (WEDA,
2009). The inventory provides a listing of activities in the various Western States, but no
summarized strategies on how CES might leverage these activities into tangible actions
that result in field faculty or societal engagement.
The perception that CES is not involved in energy may stem from a failure of
current programs to consistently engage field faculty and society in education and
outreach efforts in renewable energy, especially in the Western States. Evidence of this
perceived lack of CES engagement on energy issues can be found in the 2008 WEDA
Energy Survey (WEDA, 2008). The survey included responses from 443 constituents in
13 Western Extension Region states. The survey researchers found that 72% of
constituents surveyed perceived that CES provides “some or very little” assistance on
energy-related issues. The researchers also found that 60% of respondents perceived the
universities or colleges to be providing “some or very little” assistance on energy-related
issues. The research found a clear public interest in renewable energy and energy
efficiency and respondents indicated that they believed Extension can and should provide
information to the public on energy issues. Respondents stated that there is a need for
energy expertise within Extension and that an expanded role of Extension in energy
would benefit them (the constituents) in their work, showing clear societal demand and
relevance for education on energy issues (WEDA, 2008).
Given both the WEDA survey results (WEDA, 2008) and the APLU Initiatives
(APLU, 2011), there is a perception that CES is not effectively engaging with society in
the basic mission described by Seevers, Graham, Gamon, and Conklin (1997) as linking,
7
“research, science, and technology to the needs of the people where they live and work”
(p. 11). Although clear centers of excellence in energy education within the CES
network exist, those who measure the engagement at the county level find that CES has
not leveraged field faculty consistently in outreach and education efforts on energy
topics.
This research concerned itself with why Extension had not more effectively
engaged field faculty on the topic of renewable energy education, and more specifically,
whether Extension educator concerns contributed to the failure of Extension to meet this
relevant social need through its traditional outreach. Therefore, this research identified
what concerns currently exist regarding renewable energy education within Extension
field faculty of the Western States, and assessed how those concerns may influence the
engagement of field faculty in renewable energy Extension education and outreach
efforts.
Research Question
In what ways do Extension educators’ existing concerns regarding renewable
energy education influence the implementation of programmatic efforts?
Purpose
The purpose of this study was to determine what Extension field faculty concerns
exist regarding renewable energy programming.

8
Objectives The research objectives of this study were to:
1. Measure the present level of field faculty engagement in renewable energy
education in MT, WY, and CO.
2. Describe concerns (as defined by the Concerns-Based Adoption Model) of
Extension educators in MT, WY, and CO regarding renewable energy
education.
3. Determine whether MT, WY, and CO field faculty concerns differ by the
primary job function.
4. Identify CBAM (Concerns-Based Adoption Model) concerns of subgroups of
MT, WY, and CO Extension faculty that may influence program involvement
with renewable energy education, based on standardized user profiles
generated from the SoCQ (Stages of Concern Questionnaire).
Definition of Terms
For purposes of this research, the following definitions were used:
Extension educator (also referred to as field faculty) – professional
employees of the state Extension service of the land-grant universities and
the Extension Service-USDA (Seevers et al. 1997)
Renewable energy – energy that comes from resources that are
regenerative or for all practical purposes cannot be depleted (US DOE,
2011)
9
Programming – a planned sequence of educational experiences guided by
specific objectives (Seevers et al., 1997).
Limitations of the Study The following limitations were assumed:
The study did not attempt to assess the ability of Extension professionals
to implement education and outreach efforts.
The study did not address curricula and training design on topics other
than renewable energy.
The study was limited to Extension field faculty in MT, WY, and CO, and
therefore is limited in its generalizability.
Basic Assumptions of the Study
In this study, it was assumed that:
all survey participants completed the assessment tool to the best of their
abilities.
survey participants responded honestly to survey questions.
educator concerns were not impacted by differences in Extension structure
and/or position description by state.
Significance of the Study
Fiscal challenges exist for Extension systems throughout the United States. For
example, in March 2011, University of Nevada Extension was targeted for 72% reduction
10
in operating budget (University of Nevada Cooperative Extension, 2011). In April 2011,
South Dakota State University announced termination of all field faculty positions in
order to conduct a system-wide restructuring commensurate with a 10% budget reduction
(South Dakota State University Extension, 2011). Ongoing discussions of the need to
balance state and federal budgets result in Extension systems nationwide considering the
most effective means of meeting societal demands in the face of diminishing resources.
Failure to engage both field faculty and citizens on new and relevant societal issues may
add fuel to arguments that Extension and the land-grant model are dated and inflexible
(McDowell, 2003). Meeting societal needs from a state level, in a direct-to-consumer
approach that bypasses field faculty, may be a short-term solution. However, if faculty
members are not engaged in education and outreach in the medium to long term on
relevant societal issues, their lack of engagement may serve to validate arguments that
Extension presence at the local level is not necessary. Notes McDowell (1985),
Extension, as the outreach arm of the land grant university system, has a primarily educational mission. However, it is also expected to collect political support on behalf of the system….Cooperative Extension has a visibility problem and solving that problem is critical to eliciting public support for Extension… (p. 717) (McDowell G. R., 1985)
Extension engagement in energy education at the field faculty level is essential to
fostering public support and demonstrating Extension’s role in land-grant university
engagement with society.
Understanding the concerns of field faculty on relevant issues, such as renewable
energy, may aid Extension systems throughout the West in correctly identifying faculty
concern barriers that result in implementation of appropriate strategies for professional

11
development. Given the current political drive toward renewable energy and the
increasing pressures on Extension to meet societal needs, there can be little doubt that
Extension will be expected to engage on renewable energy issues. As an example of
public demand for energy information, the 2008 WEDA survey found that 60% of
respondents identified the level of public interest on renewable energy as “high” or “very
high”. This study assessed why the system has failed to incorporate renewable energy
education thus far, and more importantly, to determine optimized means of preparing
field faculty to meet the educational demand on the topic.
This study was also relevant in identifying any subgroups within CES that may be
more or less receptive to implementing energy education. CES positions typically
addressed topical categories of agriculture, family and consumer sciences, youth
development and community and economic development. At the time of the study, few
states had defined the responsibility for energy education. Analysis of subgroups within
CES may yield differences in receptiveness based on concerns. This information may
help CES to more effectively target subgroups willing to engage in renewable energy
programming.
Findings from this study will be used directly in the creation of renewable energy
programming to be made available to the Western states Extension field faculty. The
findings will identify the source of field faculty concerns. Concerns assessed in this
study will include: a) awareness of the issue; b) concerns over information access; c)
personal concerns; d) management concerns; e) consequence concerns; f) concerns
regarding collaboration; and g) concerns regarding refocusing efforts on the issue. This

12
will be accomplished using a standardized instrument of the Concerns Based Adoption
Model (CBAM) (Hall G. , 2003) known as the Stages of Concern Questionnaire. Once
understood, it is possible to determine professional development needs that can help to
resolve the concerns of field faculty. Findings will provide evidence of changes in the
Extension system that might be implemented to assist field faculty in effectively
engaging in renewable energy outreach and education.

13
CHAPTER II - THEORECTICAL FRAMEWORK
AND REVIEW OF THE LITERATURE
Introduction
Chapter I established that, although renewable energy is a relevant societal need,
CES has not consistently incorporated the subject in education and outreach efforts. The
concept of utilizing the Concerns-Based Adoption Model was proposed as a method for
assessing barriers to the change, specifically for implementing renewable energy
education.
Chapter II further discussed the Concerns-Based Adoption Model (CBAM) and
explained how these concepts were used to identify concerns of CES faculty. The
research used a proven survey instrument, the Stages of Concern Questionnaire (SoCQ),
to collect and analyze the data. Chapter II also explores fundamental change theory and
how the models upon which this study was based will assist Extension in correctly
identifying faculty concerns. This information will assist Extension in designing
programming and training that will effectively move CES into renewable energy
education venues utilizing field faculty.
Theoretical Framework
Essentially, this study sought to examine constraints to change and to identify
appropriate communications and change-agent strategies that will successfully move CES

14
into renewable energy education. Therefore, a theoretical framework based upon change
theory in education was appropriate for the study.
History of Change Theory
Scientists began to concern themselves with how and why innovations were
adopted by societies as early as the 1890s. The concept of diffusion theory emerged.
Diffusion theory is concerned with “the process by which an innovation is communicated
through certain channels over time among members of a social system. Diffusion is a
special type of communication concerned with the spread of messages that are new
ideas” (Seevers, 1997, p. 245). While interest in how and why people change their
behavior can be traced to ancient times, one of the earlier scientific models that sought to
explain the concept of the diffusion theory was developed by Garbriel Tarde, a French
sociologist, in 1903 (Hall G. E., 2006). Significant advancement of diffusion theory
occurred from 1928 to 1941 at Iowa State University. There, diffusion studies conducted
by Ryan and Gross, examined the rate of adoption of hybrid corn seeds by agricultural
producers (Stephenson, 2003). Lippit, Watson, and Westley furthered this research by
considered individual adoption within an organizational context adding the dynamics of
“change forces” or influences that may impact rates of adoption (Lippit, 1958).
In 1962, Everett Rogers published Diffusion of Innovations (Rogers, 2003) which
synthesized over 500 studies on diffusion theory and resulted in the model of Adopter
Categorization of Innovativeness seen in Figure 1.
Roger’s concluded that adoption innovation usually follows a non-symmetrical
bell-shaped distribution. The innovators, which make up about 2.5% of the population,

15
are risk-takers. They are eager to try new ideas and are the first to adopt innovations.
Early adopters comprise 10 to 15% of the population. They are opinion leaders and tend
to have great respect and position within the population. Early majority members tend to
adopt innovations just before the average member, but do so only after intense thought
and deliberation. They represent approximately one-third of the population. Late
majority members adopt new ideas shortly after the average member. They tend to adopt
innovation as a result of societal pressure or economic necessity. They also represent
approximately one-third of the population. Laggards, the remaining 15 percent of the
population, are the last to adopt innovation and tend to make decisions based on what has
been done in the past (Rogers, 2003).
Figure 1: Adopter Categorizations by Innovativeness
(Rogers, 2003) Rogers synthesized diffusion research into the adoption categories, but also
helped to articulate the research work of diffusion scholars in the analysis of the
innovation decision process, both in groups and individuals (Rogers, 2003). While the
adoption categories helped to profile innovation adopters, it did not address the individual
decision-making process. Ryan and Gross (1943) recognized that individuals considering
the use of hybrid corn transitioned through a process of awareness, seeking information,
experimenting or testing the corn seed, and ultimately making a decision. Other

16
researchers noted similar stages of decision-making. Rogers (2003) evaluated the stages
and (though modified through the years) summarized five stages of the innovation-
decision process as follows:
1. Knowledge – The decision-maker is exposed to an innovation and seeks to
gain an understanding of the innovation.
2. Persuasion – The decision-maker develops an attitudinal position regarding
the innovation. Some key variables considered at this point are relative
advantage - the degree to which an innovation is perceived as superior to the
idea it super cedes (p. 212), compatibility - the degree to which an innovation
is perceived as being consistent with existing values, past experiences, and the
needs of the potential adopter (p. 224), complexity – the degree to which an
innovation is perceived as relatively difficult to understand and use (p. 242),
triability – the degree to which an innovation can be successfully
experimented with on a limited basis (p. 243), and observability – the degree
to which the results of an innovation are visible to others (p. 244) (Rogers,
2003).
3. Decision – At this stage, the decision-maker rejects or adopts an innovation.
4. Implementation – Those who adopt put the innovation into practice.
5. Confirmation – The decision-maker then seeks reinforcement of the previous
decision. The decision may be reversed at this point if inconsistent or
negative messages are received regarding the innovation (p. 169).
17
The articulation of categories of adoption and of the individual’s decision process within
the categories provided a structure for further research on innovation adoption.
In 1971, Havelock built upon Rogers’ model and created the Research,
Development, and Diffusion Model, the Social Interaction Model, and the Problem
Solving Model, which sought to explain further individual acceptance of innovations,
especially as they related to group dynamics and organizational change (Havelock, 1973).
In the 1970s, Hall and Hord divided Havelock’s Social Interaction Model into five
phases, which were very similar to Rogers’ Innovation Decision Process model (Hall G. ,
2003). Again, this research sought to understand the dynamics of the individual decision-
making process in adoption of innovation. The work of Hall and Hord, however, was
also highly influenced by the work performed at the Research and Development Center
for Teacher Education (RDCTE), where specific attention was given to innovation
adoption of educators.
Change Theory in Education
Many perceived the 1957 Russian launch of Sputnik as a failure of the United
States in innovation and technology. In response, the U.S. Congress passed the National
Defense Education Act of 1958, which supported several large-scale curriculum
development programs, including efforts of new math, open education, individualized
instruction, and radical revisions of chemistry and physics (Hord, 1987). When these
efforts failed to result in the desired change, a national curriculum development
movement sought to develop “teacher-proof” curricula. In other words, the curricula
were very well defined and were not intended to be adapted or modified (Hord, 1987).

18
These efforts, which sought to control implementation by defining strict guidelines and
removing individualization by educators, also failed. In the late 1950s and 1960s,
researchers at the RDCTE began investigating these failures of national education
curriculum development. The Concerns-Based Adoption Model (CBAM) resulted from
the work of researchers, Hall, Wallace, and Dossett (Hall G. , 2003). These researchers
built upon change theories by Lewin (1951), Rogers (1971), Lippitt, Watson, and
Westley (1959) and Havelock (1971). They also included work from Frances Fuller, a
clinical psychologist, who in the 1960s identified stages of professional development in
educators as moving from concerns of “self,” to concerns of “pupils,” to concerns of
“impact” as teachers matured professionally (Fuller et. al, 1973). These research efforts
began to consider that the readiness of the teacher to implement change may be the
determining factor in adoption of new practices, rather than the practices themselves
being at issue. In other words, efforts to change the curriculum failed because they did
not address the human side of change.
From 1970 to present, the researchers of CBAM established an international
network of change-process researchers. The long-term collaborative research resulted in
the researchers being able to identify principles of change – patterns that occur when
people and organizations are involved in change (Hall G. E., 2011). While every
situation is unique, “enough is now known about the change process that we can state a
series of principles that will hold true for all cases” (p. 5). They are:
Change Principle 1: Change is Learning (p. 6). There is a process of learning
whenever a person tries to change behavior. Organizations need not only
19
notify people about a change, they also have to provide them the information
they need to change practices and modify behavior.
Change Principle 2: Change is a Process, Not an Event (p. 8). Change does
not occur with a one-time event or training. Change is a process that people
move through as they learn, come to understand, and then become competent
in new behaviors.
Change Principle 3: The Local Organization is the Primary Unit for Change
(p. 9). Although the individual decision-makers ultimately effect change, the
dynamics and leadership of the local organization set the tone for
implementation. However, it is essential that the local organization move in
concert with and be supported by other components of the system. In the case
of CES, this local organization is the state Extension office.
Change Principle 4: Organizations Adopt Change – Individuals Implement
Change (p. 9). While much work and research has focused on concepts like
organizational culture, policies, and systems, “successful change starts and
ends at the individual level” (p. 9). Change is not fully implemented until
each individual member has changed.
Change Principle 5: Interventions Are Key to the Success of the Change
Process (p. 11). Because learning is essential in the change process, it is
important for those implementing change to consider myriad ways to train
people and aid in the learning process.

20
Change Principle 6: Appropriate Interventions Reduce Resistance to Change
(p. 12). Interventions that address the needs of people involved in change
increase the comfort level and understanding and assist people in working
through the learning process.
Change Principle 7: Leadership is Essential to Long-Term Change Success
(p. 13) Bottom-up efforts can initiate change and can create short term
results, but the research has shown that if leaders, “do not engage in ongoing
active support, it is more than likely that the change effort will die” (p. 14).
Leadership must legitimize and support the effort for long-term change to take
effect.
Change Principle 8: Facilitating Change is a Team Effort (p. 14). Each
member of the organization contributes to the change process.
Change Principle 9: Mandates Can Work (p. 15) Mandates are often
criticized as being top-down and ineffective. The research has found that,
“mandate strategy fails when the only time the change process is supported is
at the initial announcement of the mandate” (p.15). Mandates that are
supported with appropriate learning interventions and leadership can be
successfully implemented.
Change Principle 10: The Context Influences the Process of Learning and
Change (p. 15). There are two primary factors that influence context – the
physical attributes of the institution and “people” factors (attitudes, beliefs,
and values of individuals). The amount of sharing and the cultural
21
expectation of continuous improvement and learning contributes to the
relative success of change implementation.
The principles of the Concerns-Based Adoption Models integrate diffusion theory and
individual decision-making process research, while also considering that people’s
emotions and concerns were fundamental to implementing change. The principles further
reminded those seeking to implement change that the content and technical elements of
change or innovation were less relevant to adoption than the human elements associated
with implementation. In other words, in our example of renewable energy programming,
CES could not resolve the entire issue of field faculty engagement simply by defining the
technical content and providing a workshop for faculty. Full adoption of change requires
understanding the human decision-making process of field faculty who are asked to adopt
renewable energy education programming, as well as understanding the organizational
context of CES.
To aid organizations in understanding the human elements of change, CBAM
researchers developed standardized methods of concern assessment. At the time of the
study, CBAM assessment was comprised of three parts: Stages of Concern, Levels of
Use, and Innovation Configuration (Hall G. , 2003). Stages of Concern Questionnaire
(SoCQ) deals with adopter concerns and issues related to his or her experience with, or
perception of, the innovation. This part analyzed the adaptor’s feelings, observations,
issues, and successes with regard to the innovation. Stages of Concern is typically the
first assessment conducted regarding an innovation. Levels of Concern relates to the
amount of utilization of an innovation through an organization and is usually evaluated

22
after an innovation has been recommended for adoption for a period of time. Innovation
Configuration documents changes and modifications of the innovation as it evolves
through an organization (Hord, 1987). This research began with use of the Stages of
Concern Questionnaire, which is explained in this chapter.
Review of the Literature
This research reviewed literature related to the context of CES, based on the
principles of change. This analysis consisted of a review of the personal elements
associated with change toward renewable energy. Second, a review of literature
regarding the organizational context was conducted. This information provided insight
into the environment in which change toward renewable energy education will be
conducted.
Personal Concerns and Extension Change
No research was found related to Extension field faculty concerns related to
energy or renewable energy education. Therefore, to understand the dynamics
contributing field faculty adopting renewable energy education, examination of the
innovation of sustainable agricultural education was conducted. Sustainable agriculture
was selected as a parallel concept for three primary reasons. At the time that sustainable
agriculture was introduced to Extension: a) it was highly politicized; b) it was supported
and promoted by advocates of “green” practices; and, c) there was an expectation and
push for Extension to engage in field-faculty-level education and outreach on the topic

23
(Arunga, 1995). These three elements were common between sustainable agriculture and
renewable energy.
Adoption of Sustainable Agriculture: In the case of sustainable agriculture
education, curricula were designed and educators were trained in the use of the curricula.
Research was conducted following these trainings to assess Extension’s adoption and
implementation of sustainable agriculture education. The sustainable agriculture research
found that adoption of the innovation (sustainable agriculture education) was highly
influenced by the perceptions Extension educators held prior to the introduction of the
training material (Arunga, 1995; Coffnner, 1997; Francis & Clive Edwards, 1995;
Grudens-Schuck, 2001). In training Extension educators on sustainable agriculture (SA),
for example, Coffnner and Kolodinsky (1997) concluded that, “different attitudes and
knowledge had a large effect on the usefulness and impact of the training,” and
recommended that curriculum and training materials should be modified to address
differences in perception and knowledge (p 5).
In the case of SA, training and curriculum designers were “aware of the
controversy and polarized opinions associated with SA” (p. 7) and found that differences
of opinion regarding social justice issues and political views on the topic greatly
influenced adoption of teaching materials and receptiveness to training (Coffnner, 1997).
A study of Ohio Extension agents found that the majority were skeptical of SA and that
Extension agents felt that they should not be expected to teach SA to producers because
doing so actually undermined their credibility (Arunga, 1995).

24
Coffnner (1997) recommended specific modifications to training and curriculum
design. It was further suggested that Extension should consider, in “situations of
controversial subject matter,” whether all educators should be trained, or whether
resources should be devoted to “those who express an interest and intent to apply the
knowledge” (p. 18). Similar findings were reported by Arunga (1995), who found that
educator understandings of sustainable agriculture both contributed to the comfort of the
educator in teaching the subjects, but also noted that agent perceptions and opinions
about the subject prior to training directly influenced the effectiveness and adoption of
training materials (Arunga, 1995). Other analyses of Extension adoption of sustainable
agricultural teaching indicated that Extension was slow to adopt sustainable agricultural
concepts, but ultimately incorporated many of the concepts as justification of the work
they were already doing (Francis & Clive Edwards, 1995; Grudens-Schuck, 2001). For
example, once educators were able to define “sustainable” from an economic standpoint,
they were better able to view any work that made producers more economically viable as
work in sustainable agriculture. Eventually, this logic melded into triple-bottom line
economic concepts of fiscal economy, social economy and natural economy.
Understanding preconceived notions of renewable energy and better assessing
educator concerns about renewable energy may well influence programming and training
design. In the case of sustainable agriculture, educator attitudes about the content led to
fragmented adoption of teaching sustainable agriculture concepts. Renewable energy
issues also had controversy and differing political views. In the Stages of Concern
Questionnaire, high levels of concern in Stage 4 (concern related to the content or
25
implications for learners) or Stage 6 (refocusing) would indicate that educators are
concerned with the content or methodology with which renewable energy programming
might be accomplished. In that instance, it could be argued that sustainable agriculture is
an appropriate parallel to renewable energy education. However, the research of faculty
concerns was necessary for it to be concluded whether concerns were consistent with SA
or unique to renewable energy education.
Personal Concerns Related to Designing Curriculum and Training: Once concerns of educators are better
understood, curriculum design and training strategies can be developed accordingly. The
literature review indicated several examples of educational programming adaptations that
were implemented effectively following the identification of an underlying issue.
Murphrey and Dooley (2000) offer an example of the importance of understanding
perceptions of educators using the innovation of distance education technology. They
state, “How people perceive and react to these technologies is far more important than the
technical obstacles in influencing implementation and use” (p. 465). Once the perception
issue was identified as a key factor, strategies for implementing training were adapted. A
Mississippi State University study of Extension perceptions of risk management found
that faculty “considered themselves to be deficient in terms of preparation in several
areas of risk management” (p. 20) (Stage 2 SoCQ Concern) and specific training needs of
educators were addressed. In contrast, a study by Texas A&M regarding the future of
family and consumer science agents found that the issues were organizational (a Stage 3
SoCQ Concern). The outcome of that study was best summarized by the statement that

26
the findings “…challenged the Extension organization to develop a mindset of potential
rather than survival, leadership rather than management, and doing the right programs
rather than doing the programs right” (Shinn, 1999, p. 399).
The idea of identifying the problem in order to apply an appropriate solution was
modeled by Calabrese’s (1982) problem identification matrix (PIM). To solve the
problem, it is necessary to understand the cause-and-effect relationship that naturally
exists and it is important that the process not assume simple solutions, unless the root
cause of this disconnect is fully understood (Calabrese, 1982). The inclination in
Extension may have been to assume that educators were too busy to accommodate new
programming (SoCQ Stage 3 Concern) or that educators were intimidated by energy
issues because they lacked specific training in energy (SoCQ Stage 2 Concern), or to
assume that the concerns were the same that were found in Sustainable Agriculture
programming (Stage 4 and Stage 6 Concerns). Thus, our “solutions” may be to remove
tasks from faculty calendars, to inundate faculty with new fact sheets and information, or
to structure education assuming a high level of controversy on the topic. However,
unless CES has identified those concerns correctly, the solutions may not address the
problems and may squander already scarce resources. Correctly identifying the concerns
will enable Extension to effectively address the perceptions limiting adoption, develop
appropriate training or implement organizational modifications that truly address the
barrier.

27
Analysis of Organizational Context
While this research focused on understanding the concerns of individuals related
to renewable energy education, the principles of change reflect that it was also important
to assess and understand the organization in which change will occur. Once individual
concerns are identified and understood, this analysis aided in identification of appropriate
interventions.
Perceptions Related to Extension Theories: In this research, it was important not
only to consider the concerns of the individual within CES as they make decisions about
change, but also to consider whether the organization (CES) itself was able to modify,
learn, and adapt to change as dictated by relevant societal needs. Murphrey and Dooley’s
(2002) study of innovation diffusion with regard to implementation of new technologies
within CES stated,
Land grant institutions have been in existence since 1862. Thus, a multitude of policies, procedures, and strategies have been established. As institutions enter and continue to move through the new paradigm[s] …, policies, procedures, and strategies must be reviewed and revised to ensure critical issues are addressed (p. 474)
When the issue of renewable energy programming was considered, the strategies and
policies of CES in connecting with society may be a limiting factor in adapting to change.
One strategy that may need to be overcome was Extension’s use of innovation
diffusion in outreach and education. As previously discussed, the introduction of hybrid
corn in Iowa in 1928 by the Iowa State University Experiment Station was significant in
diffusion theory research, where the work of Ryan and Gross (1943) contributed to the
framework for what Rogers would later define as the Diffusion Theory of Innovation

28
(Stephenson, 2003). However, this work also set precedence for the structure of the land-
grant University Extension system.
Using the concept of innovation diffusion, Extension systems have been
established worldwide under the premise of distilling best practices of university-based
research to agricultural producers. Especially in agriculture, CES has worked with the
universities to identify beneficial innovations and then to introduce innovators and early
adopters to those practices. In theory, those producers then become advocates of the new
practice, either by example (such as higher yields or livestock weights being viewed by
others) or by actively promoting the innovation to area producers. For more than thirty
years, the underlying fundamentals of university Extension work have revolved around
use of the innovation diffusion theory (Stephenson, 2003). It historically has been a
critical element in helping the United States to become the most agriculturally productive
nation in the world. In defense of the theory, Cash states that there was a,
…causal connection between [Extension] and effective production and use of scientific and technical information….[Extension] provides an institutionalized space in which long-term relationships can develop and evolve, two-way communication is fostered, tools for management are developed and utilized and the boundary of the issue itself is negotiated. As such, the organization is dynamic and changing, responding to the changing interests of actors… (Cash, 2001, p. 450).
The model has been effective not only in introducing new innovations to CES
constituents, but also in fostering the “two-way communications” whereby the changing
needs of constituents can be identified to university researchers and the results of
practical applications of innovations can be reported and analyzed. In theory, the land-
grant institution can then provide a dynamic response to localized needs.

29
Where renewable energy education was concerned, the issue was whether
Extension can be dynamic and respond to demands from society. Stephenson (2003)
argued that this reluctance of Extension to respond may be based on the use of innovation
diffusion theory for outreach and that perhaps, the theory should be reconsidered and
revised in terms of current issues faced by Extension constituents. For example, he
suggested the theory had a pro-innovation bias. There was an implication that
innovations should be diffused and adopted universally and rejecting the innovation was
considered a negative behavior (Stephenson, 2003). In the case of renewable energy,
there may be question as to whether Extension’s role was to educate versus promote
installation of the technologies. The concept of innovation diffusion may be influencing
Extension educators in that the economic returns on many renewable energy systems can
be long (10 to 40 years) and the costs of implementation can be high, perhaps making the
idea of promoting the innovation of renewable energy problematic for educators. This
may be especially true if educators perceive that the promotion of the innovation is more
politically aligned than it is economically sound.
Research also revealed that there may be some question as to whether the
traditional approaches of Extension, specifically the use of innovation diffusion in
agriculture, has created political barriers that limit the organization’s ability to change.
McDowell supported this concept (2003). McDowell built a compelling argument that
the innovation diffusion theory was partially responsible for Extension systems becoming
“hostages” of their traditional constituent base. He suggested that, “As the character of
the land-grant institutions changed in response to changes in society, the agenda of the

30
Extension services in the respective states did not follow suit” (p. 45). He went on to
argue that because the political support of Extension had come from the agricultural
sectors that have benefited from innovation diffusion theory, attempts to move Extension
services into less traditional models have been difficult and that “the carcasses” of
administrators who have attempted to shift traditional Extension dynamics can be found
around the country (p. 45). McDowell suggested that Extension had lost much of its
ability to adapt and change because it was captive to its own bureaucracy and history.
Research in change theory indicated that bureaucracy and history could be
overcome, especially if the organization was effective in organizational learning (Rowe,
2010). Therefore, a review of Extension as a learning organization was important in
assessing the institutional context.
Extension as a Learning Organization: This researcher was interested in how
organizational dynamics in Extension influence productivity and performance and on the
factors that contribute to continued improvement and positive change. Research and
work on organizational culture in the corporate sector has been taking place for decades -
Argyris (1982), Deal and Kennedy (1982), Likert (1967), McGregor (1960) and Schein
(1985) to name a few. In the early 1990s, similar research began regarding educational
institutions. The work of Senge (1990), though not the first work in this field, initiated
dynamic discussions regarding educational institution improvement. Continuous
improvement was predicated on organizational learning (Senge, 2000). Senge identified
five disciplines, or ways of thinking, that characterize effective organizational learning.
They were: 1) systems thinking – where there is a consideration for the whole system

31
and interrelationships within the system, 2) building a shared vision, where members of
the organization are focused on what the organization wants to create, 3) personal
mastery – which is the practice of continually clarifying personal vision and
understanding personal participation within the system, 4) mental modes – where
members are able to separate what has truly been observed and experienced versus
generalizations and assumptions and 5) team learning – individuals come together to
learn and discuss and to achieve collaborative decision making that benefits all (Hall,
G.E., 2011, p. 22-23). Implementation of change is most successful in learning
organizations, whereas in institutions where these characteristics are not present
organizational barriers may prohibit the change process.
As an example of an organization barrier, Lezotte and McKee (2002) suggested
that many organizations have a “single loop model” of educator engagement. In these
models, bureaucratic layers reinforced the status quo by restricting the free flow of
information and learning throughout the entire system by limiting opportunities to
question norms or paradigms. Such barriers limited an organization’s ability to respond
to change. Single loop models were often “top-down” where communications were
handed down through the ranks of an organization. In contrast, “double loop” or learning
organizations emphasized a core value of continuous improvement. Continuous
improvement required constant feedback from systems that were designed to monitor the
current situation and adjust future actions (Lezotte, 2002).
Another example of an organizational barrier was one that limits personal
mastery. Senge (2000) suggested that professionals were most motivated and successful
32
when they not only were able to produce results, but were also able to “master” the
principles underlying the accomplishment. The learning associated with implementing
change was associated with this concept. Personal mastery was a critical element in job
satisfaction and in implementation of innovative initiatives (Senge, 2000). Given low
levels of experience in energy education in the CES network, personal mastery concerns
may have existed for field faculty.
In assessing CES’s ability to change, Rowe (2010) offered research regarding the
ability of Extension to engage in organizational learning. Using work in educational
organization research (Kofman & Senge, 1993; Popper & Lipshitz, 1998; Watkins &
Marsick, 1993), Rowe examined whether Extension was a learning organization. As
Senge identified, the extent to which an organization "learns" was related to both
structural factors (mechanisms and procedures that allow organizations to systematically
collect, disseminate, and use information) and cultural factors (including shared
professional values, leadership, and vision) (Rowe, 2010). These factors contributed to
faculty perceptions and behaviors. Rowe found that, in Extension, many dynamics of
learning organizations were not present or were present at low levels, indicating that both
structural hierarchies and cultural practices would need to change in order to enable the
organization to adapt and respond to new needs. Rowe (2010) stated, “Building and
sculpting a learning organization will take deliberate action and monitoring of results” (p.
5) However, in favor of renewable energy education, she also noted that,
Environmental influences often stimulate organizational change. In order to maintain a competitive edge, Extension as an organization must realize and respond to sudden shifts in services for our customers. Change is a constant that must be considered for

33
survival in this rapidly changing environment. Extension must become a learning organization and be flexible (p. 5).
Evaluating change in the context of both individual faculty concerns and the dynamics of
organizational change required review of Extension’s role in renewable energy.
Extension’s Role in Renewable Energy: As discussed in Chapter I, the current
political environment promotes the concept of renewable energy. From Born in 1980 to
the 2010 USDA/AREERA/NIFA State Plans of Work (NIFA, 2010), the concept of
Extension in renewable energy education has been supported, yet implementation
remained a struggle.
The struggle of Extension to incorporate energy education was not new. Liles
(1978) discussed the need for Extension to become responsive to client needs in oil and
gas leasing in 1970, emphasizing that individuals within the system, and not the system
itself, responded to client needs (p. 9). Laquatra et. al (2009) reflected on the National
Extension Service Act of 1977, where a funded 10-state pilot project was implemented to
form a new energy outreach program utilizing Extension. McDowell (1985) identified
that the program encountered political problems with existing energy education programs
within Extension and ultimately failed (McDowell G. , 2003). Born (1980)
acknowledged that Extension was grappling with similar issues in the late 1970’s in his
article, “Extension and the Energy Crisis: Players or Spectators” (Born, 1980).
Extension outreach and education in energy has been highly variable and wrought with
challenges.

34
One challenge faced by CES was that few field faculty members had a specific
background or training in energy-related fields. APLU acknowledged this challenge by
stating that levels of energy expertise within CES vary greatly (APLU, 2011). Thus,
faculty members with experience in agriculture, family and consumer sciences,
horticulture, youth development or community development must re-tool in order to
address energy-programming needs. Emphasizing this challenge Forston (2006)
explained, “There is no simple track for learning the renewable energy ropes. Nor is
there a one-size-fits all option that will work for every willing [agricultural]
producer…There are countless variables to consider when learning about the viability of
renewables” (p. 2). Where, for example, information from a one-day workshop on a new
wheat variety or food preservation technique might be easily integrated into existing
knowledge base and programming efforts, there was little existing renewable energy
knowledge base in the current field faculty upon which to build. Faculty required
training from very basic levels in order to be competent in discussing renewable energy
technologies.
Fiscal resources presented another challenge. Frigden (1995) reported that
Extension had acknowledged a changing and shifting consumer base. Yet, questions
regarding capacity, collaborators, potential resources, constraints, and forward process
must all be examined in order to effectively implement new programming areas (Fridgen,
1995). The addition of renewable energy education to the slate of expectations of CES
programming was essentially an un-funded mandate, which required balancing existing
knowledge and resources with remaining relevant in society. However, Extension was
35
not unique in facing changes imposed from an external source. Many organizations
implemented change as a result of external forces. Some examples of externally imposed
changes were found in mandates required for schools, OSHA or EPA requirements for
businesses, or even Department of Homeland Security requirements that airline
passengers remove their shoes before boarding a plane ( (Hall G. E., 2011). In other
words, the changes required to address renewable energy education could not be
dismissed simply because of scarce resources or because external influences
recommended the change. Change is constant and adaptation is essential for long-term
support and funding of Extension work (McDowell G. R., 1985).
Although Extension faced many barriers in making change toward including
energy education, barriers could be overcome. Oregon State University provided an
example of incorporating some elements of renewable energy as part of natural resource
consumption education program using an ethics-based educational model (Simon-Brown,
2004). North Carolina’s E-Conservation Program (Kirby, 2009) and Cornell’s
Consumer Education Program for Residential Energy Efficiency (Laquatra J. M., 2009)
provided excellent examples of Extension work in energy efficiency and conservation.
Overcoming the barriers required changing status quo, however. Simon-Brown (2004)
emphasized that “Cooperative Extension is strategically situated to play a key role in
energy conservation and efficiency education”, (p. 2) but also noted that doing so
required the use of a variety of teaching methods. The authors of Sustainable Living
Education: A Call to All Extension (2003) pushed the issue further in stating that, “only
if Extension educators unite across the programming areas…will we reach our impact

36
potential. To effectively address the need…Extension must immediately refocus and
retool” (Elliot, 2008, p. 3). Refocusing and retooling would not only involve
development of programming efforts in renewable energy, but would also involve
addressing elements of becoming a learning organization if the status quo were to shift.
Personal Concerns Assessment in Addressing Organizational Change: The literature review provided insight into
organizational issues that CES may need to address to fully integrate renewable energy
programming. However, CBAM research pointed out, “Although everyone wants to talk
about such broad concepts as policy, systems, and organizational factors, successful
change starts and ends at the individual level” ( (Hall G. E., 2011, p. 9). The assessment
of individual concerns aids in identifying organizational change priorities and providing
clarity as to immediate intervention actions that address personal barriers.
Understanding concerns of educators is a multi-faceted process. Concerns are
influenced by the organizational dynamics, hierarchy, personal concerns, professional
concerns, and the extent to which the educator were engaged in or indifferent to an
innovation (in this case renewable energy) ( (Hall G. E., 2006)). The levels of concern
related to a change can be assessed using the Stages of Concern Questionnaire (Hord,
1987). This tool enabled the researcher to understand concerns through a SoCQ Profile.
The profile not only enabled an understanding of the primary and secondary levels of
concern, but also was able to help identify elements of the organization that may be
contributing to educator perceptions. Figure 2Figure illustrates a hypothesized concern
profile using the SoCQ instrument:
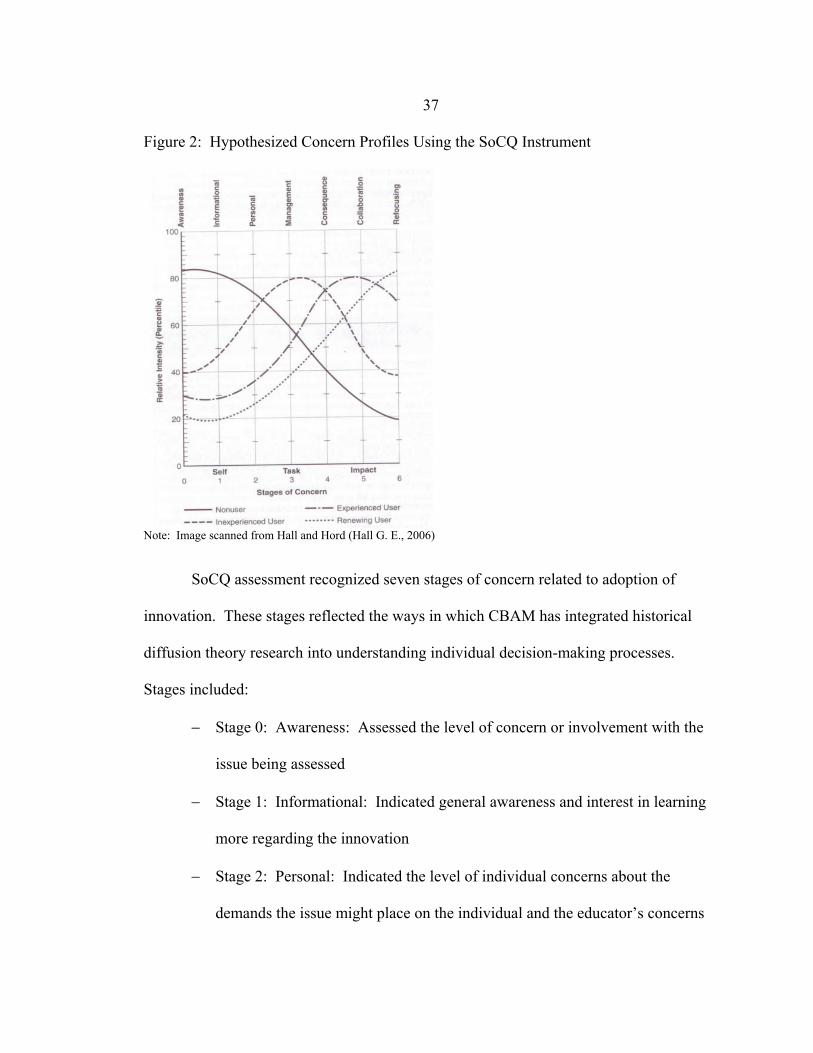
37
Figure 2: Hypothesized Concern Profiles Using the SoCQ Instrument
Note: Image scanned from Hall and Hord (Hall G. E., 2006)
SoCQ assessment recognized seven stages of concern related to adoption of
innovation. These stages reflected the ways in which CBAM has integrated historical
diffusion theory research into understanding individual decision-making processes.
Stages included:
Stage 0: Awareness: Assessed the level of concern or involvement with the
issue being assessed
Stage 1: Informational: Indicated general awareness and interest in learning
more regarding the innovation
Stage 2: Personal: Indicated the level of individual concerns about the
demands the issue might place on the individual and the educator’s concerns

38
regarding his/her adequacy to meet those demands, as well as concerns related
to his/her role with implementing an innovation
Stage 3: Management: Identified the level of concern regarding process and
tasks of implementation, such as, but not limited to, efficiency, organizing,
managing, scheduling, and time demands
Stage 4: Consequence: Indicated level of concern related to impact on the
clients in educator’s sphere of influence. The focus was on the relevance of
the innovation for clients, evaluation of the outcome including concerns
regarding the educator’s performance and competencies, and changes needed
to increase client outcomes or impacts.
Stage 5: Collaboration: Indicated the level of concern regarding cooperation
and coordination of efforts with others regarding the issue
Stage 6: Refocusing: Identified the level of concern of universal benefit from
the innovation or issue, including the possibility of major changes or
replacement of the suggested innovation with a more powerful innovation.
Measures extent to which individual had a definitive idea about the proposed
innovation (Hall G. E., 2006).
The 35-question Stages of Concern Questionnaire (SoCQ) instrument had strong
reliability estimates (test/retest reliabilities range from .64 to .86) and internal consistency
alpha-coefficients range from .64 to .83 (Hall G. E., 2006). The instrument had been
used for decades in educational institutions, including universities, to assess educator
concerns and continues to be seen as a reliable and valid measure (p. 148). The

39
instrument was utilized in this study to assess CES educator concerns and to address the
research objectives regarding renewable energy programming.
Historical Development of the Stages of Concern Questionnaire
The researchers at RDCTE engaged in a three-year development process of a
quick-scoring stages of concern instrument in the fall of 1973. The initial construction of
the standardized instrument began with researchers developing 544 potential items that
could indicate a stage of concern. These items were consolidated and edited for
redundancy, resulting in a 195-item pilot instrument reflecting the stages of concern
categories. This instrument was administered to elementary school teachers and college
faculty in May 1974. From the 363 returned questionnaires, item correlation and factor
analysis indicated 60% of the common variance among the 195-items correlated to the
hypothesized scales developed in CBAM (George, 2006).
Following additional testing, the data convinced RDCTE researchers that the
seven factors represented independent constructs, which could be correlated to the seven
stages of concern, proposed in the CBAM. The 195-item instrument was refined (based
on the five most heavily loaded items for each stage) and edited for redundancy, which
resulted in a 35-item instrument. The five items representing each stage were selected to
improve the likelihood of high internal reliability. This instrument was then tested
through pilot analysis and correlation matrixes for validity and reliability (George, 2006).
Reliability of Stages of Concern Questionnaire: In September 1974, the 35-item
SoCQ was administered to 830 professors and teachers to explore their concerns about

40
team teaching instruction models. Item analysis resulted in coefficients for each stage of
internal reliability from .64 to .83. Two weeks later, 132 respondents were retested and t-
test correlation analysis resulted in Pearsons r correlations of .65 to .86 with five stages
scoring above .75. The results of these two tests are presented in Table 1.
Table 1: Coefficients of Internal Reliability and Test-Retest Correlations (1974) Coefficients of Internal Reliablity for the SoCQ (n = 830, Fall 1974)
Stage 0 1 2 3 4 5 6
Alpha 0.64 0.78 0.83 0.75 0.76 0.82 0.71
Test-Retest Correlations on SoCQ (n = 132, Fall 1974)
Stage 0 1 2 3 4 5 6
Alpha 0.65 0.86 0.82 0.81 0.76 0.84 0.71
The statistics suggested satisfactory reliability of the SoCQ instrument (George, 2006).
Because other measures of concern did not exist for comparison to the SoCQ,
researchers used inter-correlation matrices, interview data and changes over time to
investigate the validity of the instrument. For example, subjective validity studies were
conducted in 1976 to measure the relationship between raw SoCQ stage scores and open-
ended questions or interviews. The instrument was found to be reliable (George, 2006),
Several longitudinal studies were conducted in the late 1970s. Further correlation
analysis was conducted on peak stage concerns. The instrument again was found to be
valid and reliable. (George, 2006).

41
Since the publication of the original SoCQ manual in 1978, the instrument has
been used in an extensive array of studies (George, 2006). Some of these studies
included non-teaching applications, but statistical analysis with regard to the internal
reliability of the instrument has been constant. A summary of the reliability analysis for
several of the studies is provided in Table 2.
Table 2: Coefficients of Internal Reliability for Various Studies (1979-1991)
AuthorsSample
Size 0 1 2 3 4 5 6Hall, George & Rutherford (1979) 830 0.64 0.78 0.83 0.75 0.76 0.82 0.71
Van den Berg & Vandenberghe (1981) 1585 0.77 0.79 0.86 0.80 0.84 0.80 .76/.73*
Kolb (1983) 718 0.75 0.87 0.72 0.84 0.79 0.81 0.82
Barucky (1984) 614 0.60 0.74 0.81 0.79 0.81 0.79 0.72
Jordan-Marsh (1985) 214 0.50 0.78 0.77 0.82 0.77 0.81 0.65
Martin (1989) 388 0.78 0.78 0.73 0.65 .71/.78* 0.83 0.76
Hall, Newlove, Rutherford & Hord (1991) 750 0.63 0.86 0.65 0.73 0.74 0.79 0.81*Note: In these studies, the authors proposed two subscales in place of the original SoCQ scale.
Stage of Concern
The subjects of the studies listed in Table 2 were: Hall, George, and Rutherford
(1979) - the original study of 830 teachers, Van den Berg and Vandenberghe (1981) – 25
schools in the Netherlands and 52 schools in Belgium, Kolb (1983) – assessed nurse’s
concerns about the nursing career, Barucky (1984) – measured concerns about leadership
development in the US Air Force, Jordan-March (1985) – measured concerns about
exercise, Martin (1989) – measured concerns of people learning computer programming,
Hall, Newlove, Rutherford & Hord (1991) – retesting of the instrument following
modifications of the questionnaire (George, 2006). The instrument measurement guide
cited at least 27 studies (of various subjects) that have been monitored for validity and

42
reliability by the instrument authors, the most recent in 2006 (George, 2006). The
instrument has been most typically used in educational settings, in both K-12 and
university settings (George, 2006).
Applications of SoCQ Research: Once the Stages of Concern were identified,
strategies for increasing rates of adoption could be employed and shared visions of the
future constructed. The organization could begin to address communications strategies
that shift from top-down (first-order communications) to team learning and shared vision
communication which utilize second-order communication strategies (continuous loop
models) (Meynell, 2005). This communication strategy would be especially important in
Extension given geographic distance and limited funding for travel.
Further, the work of Lezotte and McKee (2002), Senge (2000), and Meynell
(2005) in conjunction with the results of a concern profile can enabled analysis of
institutional barriers that impacted educator engagement, in addition to appropriately
identifying other concerns. Notes Senge (2000), understanding common concerns might
have facilitated alignment, where “alignment has the connotation of arranging a group of
scattered elements so that they function as a whole, by orienting them to a common
awareness of each other, their purpose, and their current reality” (p. 51).
The CBAM Stages of Concern Questionnaire was not able to address all elements
of organizational politics nor did it identify specific content training needs of field
faculty. However, the instrument identified where faculty had concerns and helped to
establish a starting point for the change process given organizational and fiscal
constraints.
43
CHAPTER III - METHODOLOGY
Methodology
The purpose of this study was to assess concerns regarding renewable energy
programming held by Extension professionals. It sought to determine how the concerns
of educators might influence the design of Extension renewable energy programming and
associated professional trainings. This chapter explains the instrumentation used and
target population of the study. The survey instrument, the Stages of Concern
Questionnaire (SoCQ), is explained with regard to how the instrument was used to
analyze faculty concerns related to renewable energy programming. The reliability and
validity of SoCQ is discussed, as well as the procedures used to administer the survey.
Data processing procedures and appropriate analysis methods are described.
Research Design
This research was conducted utilizing a descriptive survey analysis based on the
Stages of Concern Questionnaire (SoCQ). It was administered electronically to
Extension faculty in the Fall 2011.
The population for this research was all Extension educators employed in
Montana, Wyoming, and Colorado. These states were selected because of the following
similarities in renewable energy Extension programming: 1) all states had an Extension
renewable energy professional in place, but were within the first three years of
developing renewable energy programming for field faculty, 2) all states had similar

44
renewable energy opportunities given climate and topography, and 3) all states had
identified a desire to engage field faculty in renewable energy education programming.
The size of this population at the time of the study was 307 (Montana = 90, Colorado =
153, and Wyoming = 64), as reported by the Extension Human Resource Department in
each state.
Total Extension faculty numbers represented a broad cross-section of employees
and may have varied by state. For example, many counties had grant-funded positions
that were included in counts of full-time equivalents. WY and CO also had regional
specialist positions that were included in this number. MT did not have regional
specialists and did not include any statewide appointments in the count. Ideally, the
number of Extension faculty could have been more specifically defined. This was not
possible, however, for several reasons. First, in Montana faculty did not always have
specific assignments, as they did in WY and CO. For example, a faculty member in MT
who worked predominately in agriculture may also have had a position description that
included youth development or family and consumer sciences. Second, accountability
for energy programming at the time of the study had not been assigned to any type or
group of faculty in MT and WY. To delimit faculty would eliminate responses from
faculty who could later be assigned energy responsibility. Further, to eliminate, for
example, grant funded or positions with regional responsibility may also have
compromised responses from those later assigned responsibility in energy programming.
While the counts of faculty provided by the human resource offices in each state likely
varied in terms of which types of positions were included in the FTE counts, there was no

45
effective means of standardizing the position counts without potentially sacrificing a
valid sample of the population.
A census was used. The census sought to overcome differences in staffing
patterns and field faculty assignments in the selected states. Proportional sampling by
position type was not possible as common classifications for positions did not exist
between state Extension systems. Given the small population size and the high response
rate required, true randomization was not possible. A sample size ranging from 50 to 100
percent of the population would be appropriate. Leedy and Ormrod (2010) indicated
sample sizes of 100% for populations of N =100 and below, and a sample size of 50% for
populations of 400 to 600 (p. 213). In a review of Extension research from 1995-1999,
response rates for Extension census surveys averaged 29.5% (Linder, 2002). Research by
Archer suggested that for Extension, in-house, web-based surveys of this type, a response
rate of 40% should be expected (Archer, 2008). This study had a total response rate of
46.9%, and a usable response rate of 41%, which was consistent with Archer’s findings.
Procedures Permission and Validation of Use for Extension Faculty
Permission to use the SoCQ instrument to assess faculty concerns regarding
renewable energy was granted by Dr. Gene Hall via email communication prior to
administration of the survey. Dr. Hall was an original creator of the survey and continues
to work with the members of the RDCTE research group and SEDL (formerly Southwest
Education Development Laboratory), the entity that currently promotes and advances

46
SoCQ work. Dr. Hall verified that the instrument validity and reliability was tested using
higher education faculty and that Extension field faculty would be “well inside
established norms” (Hall G. , Personal Communication, 2011). In the standard survey
instrument, respondents scaled a variety of statements about “the innovation” on a Likert
scale. The research committee for this project recommended substituting the words “the
innovation” within the survey with “renewable energy programming” to ensure correct
responses to the instrument. Dr. Hall approved that substitution provided that no other
words in the instrument were altered (Hall G. , Personal Communication, 2011). A copy
of the correspondence is included in Appendix B.
Research Design
Demographic Survey
For this study, demographic information was collected from each participant in
order to obtain information regarding age, sex, state of employment, length of
employment with Extension, key Extension responsibilities (agriculture, FCS, 4-H, etc),
involvement in energy programming, and prior work history. The demographic study
was comprised of 10 questions which were asked at the beginning of the survey.
Stages of Concern Questionnaire
This research was conducted utilizing a descriptive survey analysis based on the
Stages of Concern Questionnaire (SoCQ), designed by the researchers at RDCTE (Hall,
2006). The SoCQ was a quick-scoring measure of seven concern constructs using a 35-
item questionnaire. The standardized instrument (Form 075) (Hall G. E., 2011) was used
47
in conjunction with a 10-item demographic survey that provided additional analytical
detail in addressing the research questions. The instrument was modified to substitute
“the innovation” language within the instrument with “renewable energy programming”
and to add a demographic survey. The answers to these questions were used to
construct concern profiles using seven key measures of concern: Stage 0: Awareness -
Measured the level of concern or involvement, Stage 1: Informational - Assessed general
awareness and indicated interest in learning more regarding the issue, Stage 2: Personal
– measured concerns about the demands the issue might place on the individual and
concerns regarding adequacy to meet those demands, as well as concerns related to role
with implementing an innovation, Stage 3: Management - measured concerns regarding
process and tasks of implementation, such as, but not limited to, efficiency, organizing,
managing, scheduling, and time demands, Stage 4: Consequence - measured concerns
related to impact on clients in participant’s sphere of influence, Stage 5: Collaboration -
measured concerns regarding cooperation and coordination of efforts with others
regarding the issue, and Stage 6: Refocusing - measured concerns of universal benefit
from the innovation or issue, including the possibility of major changes or replacement of
the suggested innovation with a more powerful innovation. (Hall G. E., 2006).
The instrument had strong reliability estimates (test/retest reliabilities ranging
from .64 to .86) and internal consistency alpha-coefficients ranging from .64 to .83 (Hall
G. E., 2006). The extent to which this instrument has been utilized and tested for
reliability was verified through analysis of the historic development of the SoCQ
questionnaire, as described in Chapter II.
48
Data Collection
Several studies have been conducted in recent years that indicate declining
response rates in survey data collection. The decline is partially attributed to electronic
surveying making data collection easier for researchers. Dillman (2002) expressed
concern that, “the current survey mania tends to cheapen and threaten the entire
enterprise of surveying” (p. 479). Anseel, Lievens, Schollaert, and Choragwicka (2010)
found that many researchers attempted to overcome declining response rates with
response enhancing techniques (incentives, reminders, etc.), but that, “when controlling
for the use of response enhancing techniques, response rates are indeed declining” (p.
346). Even in mailed surveys, which tended to have higher response rates, mean
response rates were 34% to 35.7% for organizational respondents (Anseel, Lievens,
Schollaert, & Choragwicka, 2010). When controlling for response enhancing techniques,
Anseel et. al found a negative response rate effect of web-based surveys, and
recommended that, “researchers should anticipate a somewhat lower average response
rate using Internet technologies in comparison to more traditional paper-and-pencil
surveys” (p. 347) Factors increasing response rates are advance notice, personalization,
identification numbers [rather than names], and sponsorship (p. 347).
Despite lower response rates indicated by electronic survey collection
methodologies (Shannon, 2010), data collection in this research was conducted utilizing
SurveyMonkey online surveying. A copy of the instrument was provided in Appendix
D. This methodology was selected for several reasons. First, within CES it was
politically appropriate to request the involvement of Extension faculty through the state
Extension Director. Electronic requests for state participation to the Extension Directors

49
in WY and CO was easily accomplished through e-communication from MT’s Extension
Director. Their willingness to participate could be immediately identified. The
electronic survey also could easily be forwarded to faculty by the respective directors.
Second, the electronic methodology allowed the researcher to track participation levels in
three states in real time. Had response rates been abnormally low, this tracking allowed
for the methodology to be appropriately addressed in a reasonable time frame, where
response rates from mailed surveys would not have been known until the data collection
window was closed. Finally, it was not possible to obtain a physical mailing list from
human resource departments for each faculty member, but the directors were willing to
forward information to their respective online address listserves.
The survey instrument was submitted to the Montana State University
Institutional Review Board and was approved on August 29, 2011.
Following a request from the researcher, the Montana State University Vice
President of External Relations and Director of Extension, Dr. Douglas Steele, sent an
electronic request to engage field faculty in the respective states to Extension Directors in
CO and WY on September 20, 2010 (Steele, 2011). A copy of this correspondence is
included in Appendix C. On September 20, 2011, Dr. Steele sent an electronic letter to
Extension faculty in Montana requesting their participation in the electronic survey
(Steele, 2011). The requests by Dr. Steele to support this research were extremely
beneficial in legitimizing the research and encouraging participation in all three states.
On September 21, 2011, Dr. Louis Swanson, Extension Director in CO, requested
that CO Energy Specialist, Cary Weiner, forward the request for participation in the

50
survey to CO Extension faculty. Mr. Weiner forwarded the request with a deadline of
October 20, 2011. A reminder email was sent by Mr. Weiner in CO on October 10, 2011.
Montana faculty were also asked to respond by October 20. A follow-up
reminder request was sent out by the researcher on October 12, 2011.
In WY, Extension Director, Dr. Glen Whipple, requested the participation of
Extension faculty on October 2, 2011. Dr. Whipple also sent a follow-up email on
October 20, 2011. The survey collection for responses in WY was closed on November
2, 2011.
Of the total possible responses (N= 307), 144 were received, yielding a response
rate of 46.9%. Of the 144 received, 126 were usable, yielding a usable return rate of
41.0% (n = 126). The composition of usable responses by state is depicted in Table 3.
These response rates were normal for electronic survey collection (Archer, 2008) (Linder,
2002) (Shannon, 2010), however due to the small population size a non-responder survey
was conducted to check for sampling biases and to establish whether significant
difference in non-responders versus non-responders in CO existed, given the small
sample size of CO. Analysis of the non-responder survey was provided in Chapter IV.
TableThese response rates were normal for electronic survey collection (Archer,
2008) (Linder, 2002) (Shannon, 2010), however due to the small population size a non-
responder survey was conducted to check for sampling biases and to establish whether
significant difference in non-responders versus non-responders in CO existed, given the
small sample size of CO. Analysis of the non-responder survey was provided in Chapter
IV.
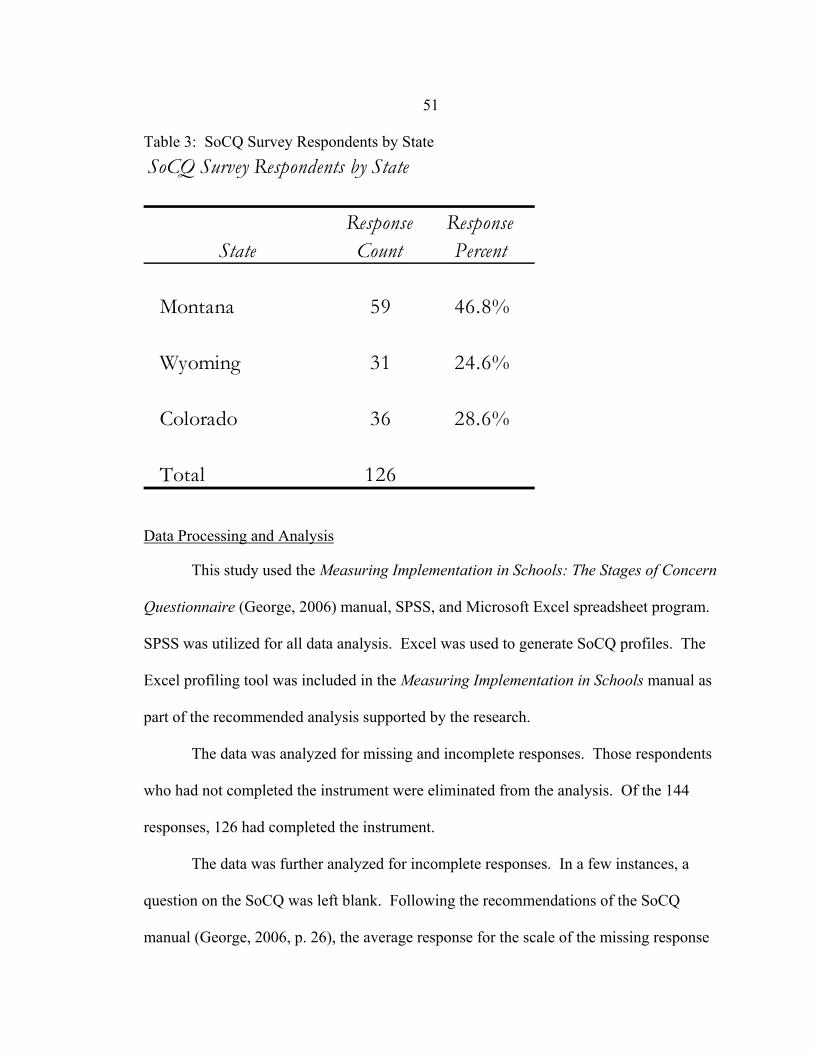
51
Table 3: SoCQ Survey Respondents by State
SoCQ Survey Respondents by State
StateResponse Count
Response Percent
Montana 59 46.8%
Wyoming 31 24.6%
Colorado 36 28.6%
Total 126
Data Processing and Analysis
This study used the Measuring Implementation in Schools: The Stages of Concern
Questionnaire (George, 2006) manual, SPSS, and Microsoft Excel spreadsheet program.
SPSS was utilized for all data analysis. Excel was used to generate SoCQ profiles. The
Excel profiling tool was included in the Measuring Implementation in Schools manual as
part of the recommended analysis supported by the research.
The data was analyzed for missing and incomplete responses. Those respondents
who had not completed the instrument were eliminated from the analysis. Of the 144
responses, 126 had completed the instrument.
The data was further analyzed for incomplete responses. In a few instances, a
question on the SoCQ was left blank. Following the recommendations of the SoCQ
manual (George, 2006, p. 26), the average response for the scale of the missing response
52
was used to populate the response. Further analysis procedures on each research
objective are provided in Chapter IV.
Use of ANOVA and Post Hoc t-Test Analysis
Utilizing SPSS, one-way analysis of variance (ANOVA) was used to evaluate
differences between subgroups in the data. ANOVA was selected over multiple
regression analysis for several reasons. First, multiple regression analysis is concerned
with the predictive ability of an independent variable (such as age) on a dependant
variable (SoCQ Stage), whereas ANOVA simply looks to explore statistical significance
between and within groups (Pallant, 2007). This research is less concerned with
predicting stages by independent variables, and more concerned with whether differences
exist. To further understand where significant differences existed within the data, post
hoc t-test analysis was utilized where ANOVA analysis indicated a significant difference.
Second, subgroup sizes differed in this data set. ANOVA allowed for comparison of
different group sizes and distributions, where MANOVA analysis assumed normal
distributions, similar sample sizes, and is sensitive to outliers (Pallant, 2007).
To reduce Type I Error, post hoc t-test analysis was used, and a Bonferroni (α =
.007) adjustment was made in the t-test to further reduce possibility of Type I Error on
those items where statistical significance was indicated in the ANOVA. All constructs
were evaluated for skew and kurtosis and Komogorov-Smirnov testing was completed to
indicate possible non-parametric distributions. Levene’s test for equality of variance was
also used in each ANOVA analysis to ensure that assumptions of homogeneity of
variance were not violated.
53
CHAPTER IV - RESULTS
Introduction
The analysis for this research was derived from data collected from 126 Extension
faculty members in MT, WY, and CO through an online survey in the fall of 2011. The
purpose of this analysis was to a) measure the present level of field faculty engagement in
renewable energy education in MT, WY, and CO, b) describe concerns (as defined by the
Concerns-Based Adoption Model) of Extension educators in MT, WY, and CO regarding
renewable energy education, c) determine whether MT, WY, and CO field faculty
concerns differed by the primary job function, and d) identify CBAM (Concerns-Based
Adoption Model) concerns of subgroups of MT, WY, and CO Extension faculty that may
influence program involvement with renewable energy education.
This chapter contains the procedures and conventions followed to address the
research objectives, including discussion of the population and sample. The chapter
presents actual survey responses and separate analyses in support of the research
questions. For the total sample, as well as each subgroup of interest, statistical analysis,
Stages of Concern Questionnaire (SoCQ) profiles and High Stage Score and Second High
Stage Score comparisons are provided. Group averages (expressed as percentiles) reflect
the dominant high and low Stage of Concern scores of composite group in the SoCQ
profile. Analysis of individual High Stage (peak score) and Second High Stage (second
highest score) provides additional insight into the dynamics of concerns. The High Stage
and Second High stage score analysis was tabulated in a matrix. This process was

54
recommended as part of the SoCQ data analysis as it revealed distinct subgroups in the
data and reflected complexity of concerns data (George, 2006).
Questionnaire Respondent Demographics
The target population for this research was all Extension educators employed in
Montana, Wyoming, and Colorado. Of the total possible responses (n = 307), 144 were
received, yielding a response rate of 46.9%. Of the 144 received, 126 were complete and
usable, yielding a usable return rate of 41.0%. TableTable 4 depicts the composition of
usable responses by state.
Table 4: SoCQ Survey Participation as a Percentage of State Population
SoCQ Survey Participation as a Percentage of State Population
StateTotal
FacultyNumber Respondi
Percent of Population
Montana 90 59 65.6%
Wyoming 64 31 48.4%
Colorado 153 36 23.5%
Total 307 126 41.0%
Montana had a total of 90 Extension faculty (n = 90) and had a usable response rate of
65.6%. Wyoming (n = 64) had a usable response rate of 48.4%. Colorado (n = 153) had
a usable response rate of 23.5%.

55
Respondents completed 10 demographic questions. Of the respondents, 42.9%
(n=54) were male and 57.1% (n=72) were female. Table 5 shows that the sex of
respondents by state were consistent with the total sample.
Table 5: Sex of Respondents by State SoCQ Survey Respondents by Sex and State
Sex Count Percent Count Percent Count Percent Count Percent
Male 54 42.9% 25 42.4% 11 35.5% 18 50.0%
Female 72 57.1% 34 57.6% 20 64.5% 18 50.0%
Total 126 59 31 36
Wyoming Colorado Total Montana
With regard to educational attainment, 59.2% (n = 74) of respondents held a
Master’s Degree, while 34.4% (n = 43) held a Bachelor’s Degree and 6.4% (n = 8) held a
PhD. No respondents held less than a Bachelor’s Degree.
Respondents represented a distribution of age ranges. Table 6 presents the
respondent age data in total and by state.
Demographic question five sought to determine the employment level of faculty
respondents. The majority of respondents (94.4%) (n = 118) indicated full-time
employment of at least 40 hours per week. Thirty-six percent (n = 45) of respondents
indicated that they have been employed by Extension from 1-5 years. Figure 3 provides a
graphical representation of respondents’ time in Extension.

56
Table 6: SoCQ Survey Respondents by Age and State SoCQ Survey Respondents by Age and State
Age Count Percent Count Percent Count Percent Count Percent21 to 25 years old 2 1.6% 1 1.7% 1 3.2% 0 0.0%
26 to 35 years old 34 27.0% 16 27.1% 14 45.2% 4 11.1%
36 to 45 years old 26 20.6% 12 20.3% 6 19.4% 8 22.2%
46 to 50 years old 17 13.5% 12 20.3% 1 3.2% 4 11.1%
51 to 55 years old 15 11.9% 8 13.6% 1 3.2% 6 16.7%
56 to 60 years old 16 12.7% 5 8.5% 4 12.9% 7 19.4%
Over 61 years old 16 12.7% 5 8.5% 4 12.9% 7 19.4%
Total 126 59 31 36
Total Montana Wyoming Colorado
Figure 3: Respondent Years in Extension
0
5
10
15
20
25
Colorado Montana Wyoming
# o
f Res
pons
es
Years in Extension
Less than 1 year
1-5 years
6-10 years
11-15 years
16-20 years
Over 20 years

57
While CO respondents indicated a slightly different profile, all states showed a
predominance of respondents in the early stages (up to 10 years of experience) of their
Extension careers.
The majority of respondents (80.2%) (n = 101) indicated that they had been in
their current position in Extension from less than 1 to 15 years (5.6% (n = 7) less than 1
year, 43.7% (n=55) from 1-5 years and 31% (n=39) from 6-15 years). This information
is illustrated in
Figure 44, where the respondents from CO indicate a slightly longer tenure in
positions, but a predominance of faculty in their positions less than 15 years can again be
seen.
Figure 4: Years in Current Extension Position
0
5
10
15
20
25
Colorado Montana Wyoming
# o
f Res
pons
es
Years in Position
Less than 1 year
1-5 years
6-15 years
16-25 years
Over 25 years

58
The research also sought to assess the type of position appointment of the
respondents. Respondents were grouped into categories of Ag & Natural Resources, 4-H,
Family and Consumer Sciences, Community and Economic Development, and Mixed
Appointment, based on the percent of actual time worked in each responsibility type.
Table7 shows that by this classification, 29.4% (n = 37) of respondents were
agriculture and natural resource faculty, 26.2% (n = 33) mixed appointment, 23.8%
(n=30) 4-H, and FCS and CDED were 10.3% (n=13) respectively.
Table 7: SoCQ Survey Respondents by Position Type
SoCQ Survey Respondents by Position Type
StateResponse
CountResponse Percent
Agriculture and Natural Resources 37 29.4%
4-H (Youth Development) 30 23.8%
Family and Consumer Sciences (FCS) 13 10.3%
Community and Economic Development 13 10.3%
Mixed Appointment 33 26.2%
Total 126
Response and Non-Response Analysis
A non-responder survey of 7.9% (n=10) of the sample size was conducted to
compare demographic data and Stage of Concern mean scores of responders and non-
responders to the survey. Non-responder surveys were conducted via telephone and

59
addressed total of 7 demographic questions and 5 randomly-selected SoCQ questions.
Non-responders were also asked to identify the primary reason they did not respond to
the survey. Seventy percent of non-responders (n=7) indicated they did not complete the
survey because they did not feel it pertained to them, and 30% (n=3) indicated they were
too busy to respond. Non-responder demographic responses were compared to those of
responders in the categories of age, FTE, state of employment, time in Extension, and
prior employment using independent t-test analysis. No significant results were found
when comparing all non-responders to responders nor when comparing non-responders
between states. Also important to note was that no differences were found between non-
responders in CO and the other states, which was a concern given low response rates
from CO. Independent t-test analysis was used to compare SoCQ scores on 5 randomly
selected questions for responders and non-responders. There was no significant
difference in the mean scores for each of the questions analyzed. The statistical analysis
results were presented in Table 8.
Data were analyzed to determine whether differences existed between early
responders and late responders to the survey request. Early responders were defined as
those who completed the survey instrument prior to the reminder notice (in MT and CO
between September 20, 2011 and October 10, 2011 and in WY between October 2, 2011
and October 20, 2011). As is typical of electronic surveys, the majority of responders
were early responders (Shannon, 2010), with 75.4% (n=95) responding prior to the
reminder date. Independent t-test statistical analysis was conducted to compare the
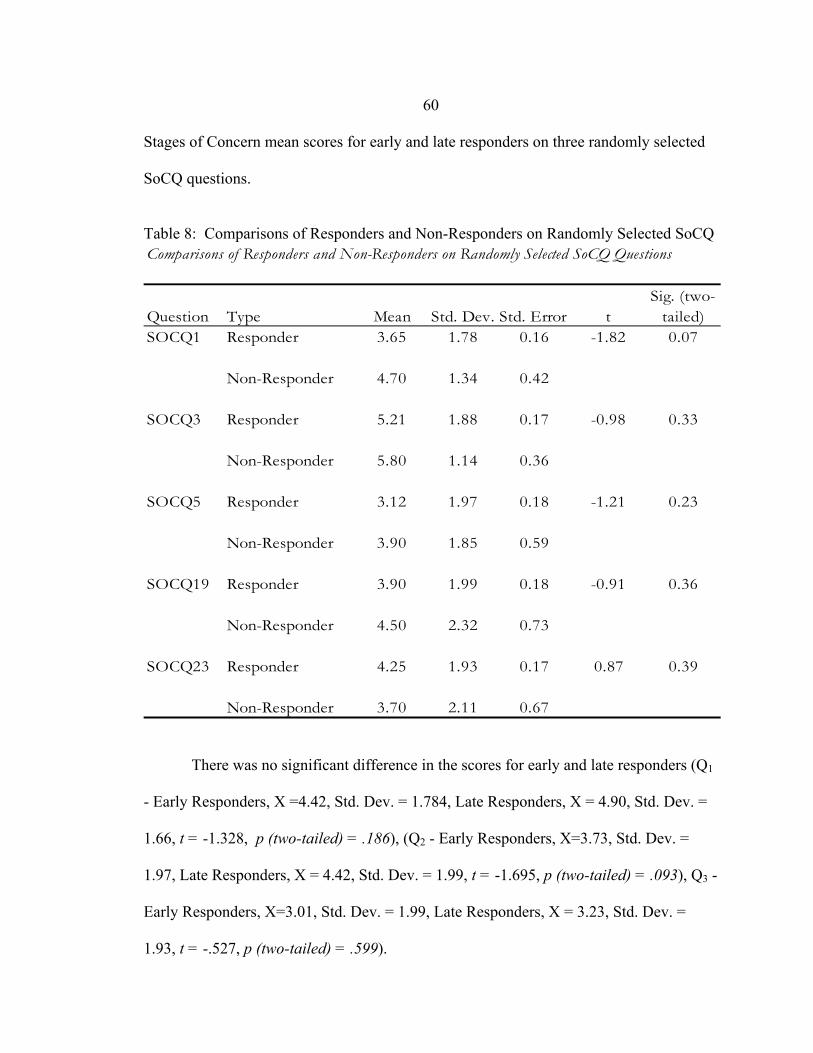
60
Stages of Concern mean scores for early and late responders on three randomly selected
SoCQ questions.
Table 8: Comparisons of Responders and Non-Responders on Randomly Selected SoCQ Comparisons of Responders and Non-Responders on Randomly Selected SoCQ Questions
Question Type Mean Std. Dev. Std. Error tSig. (two-
tailed)SOCQ1 Responder 3.65 1.78 0.16 -1.82 0.07
Non-Responder 4.70 1.34 0.42
SOCQ3 Responder 5.21 1.88 0.17 -0.98 0.33
Non-Responder 5.80 1.14 0.36
SOCQ5 Responder 3.12 1.97 0.18 -1.21 0.23
Non-Responder 3.90 1.85 0.59
SOCQ19 Responder 3.90 1.99 0.18 -0.91 0.36
Non-Responder 4.50 2.32 0.73
SOCQ23 Responder 4.25 1.93 0.17 0.87 0.39
Non-Responder 3.70 2.11 0.67
There was no significant difference in the scores for early and late responders (Q1
- Early Responders, X =4.42, Std. Dev. = 1.784, Late Responders, X = 4.90, Std. Dev. =
1.66, t = -1.328, p (two-tailed) = .186), (Q2 - Early Responders, X=3.73, Std. Dev. =
1.97, Late Responders, X = 4.42, Std. Dev. = 1.99, t = -1.695, p (two-tailed) = .093), Q3 -
Early Responders, X=3.01, Std. Dev. = 1.99, Late Responders, X = 3.23, Std. Dev. =
1.93, t = -.527, p (two-tailed) = .599).
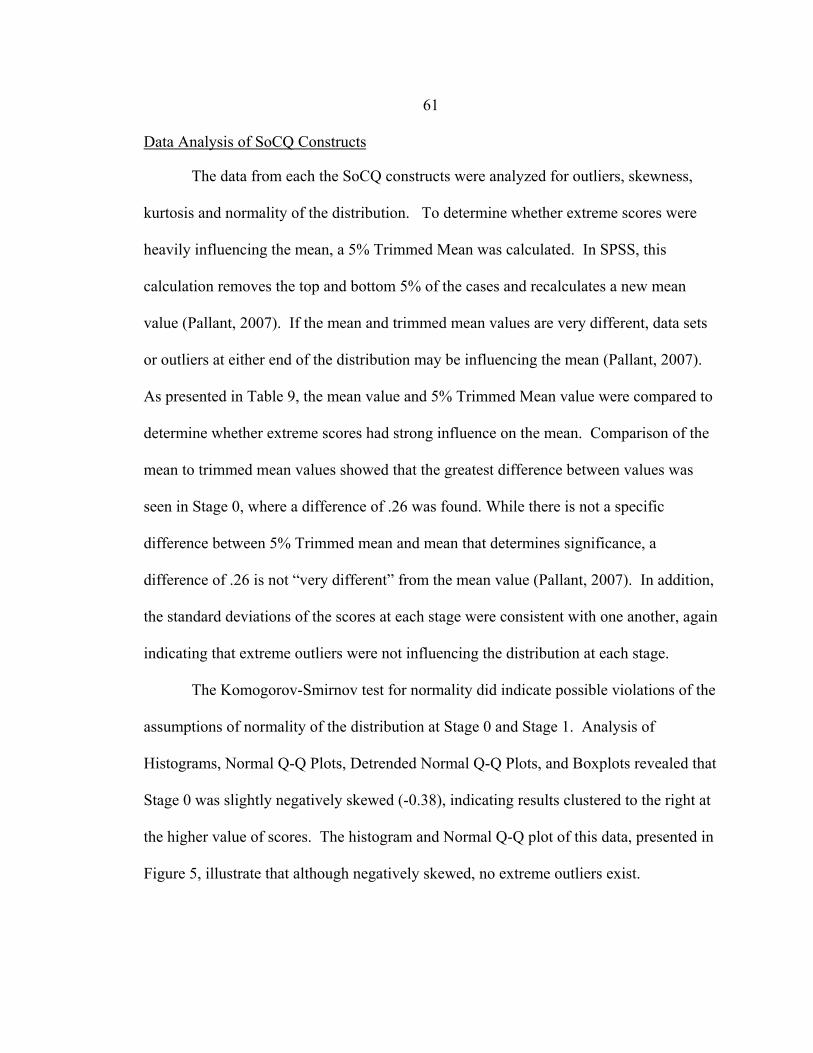
61
Data Analysis of SoCQ Constructs
The data from each the SoCQ constructs were analyzed for outliers, skewness,
kurtosis and normality of the distribution. To determine whether extreme scores were
heavily influencing the mean, a 5% Trimmed Mean was calculated. In SPSS, this
calculation removes the top and bottom 5% of the cases and recalculates a new mean
value (Pallant, 2007). If the mean and trimmed mean values are very different, data sets
or outliers at either end of the distribution may be influencing the mean (Pallant, 2007).
As presented in Table 9, the mean value and 5% Trimmed Mean value were compared to
determine whether extreme scores had strong influence on the mean. Comparison of the
mean to trimmed mean values showed that the greatest difference between values was
seen in Stage 0, where a difference of .26 was found. While there is not a specific
difference between 5% Trimmed mean and mean that determines significance, a
difference of .26 is not “very different” from the mean value (Pallant, 2007). In addition,
the standard deviations of the scores at each stage were consistent with one another, again
indicating that extreme outliers were not influencing the distribution at each stage.
The Komogorov-Smirnov test for normality did indicate possible violations of the
assumptions of normality of the distribution at Stage 0 and Stage 1. Analysis of
Histograms, Normal Q-Q Plots, Detrended Normal Q-Q Plots, and Boxplots revealed that
Stage 0 was slightly negatively skewed (-0.38), indicating results clustered to the right at
the higher value of scores. The histogram and Normal Q-Q plot of this data, presented in
Figure 5, illustrate that although negatively skewed, no extreme outliers exist.

62
Table 9: SoCQ Descriptive Statistics, Skewness, Kurtosis, and Normality SoCQ Descriptive Statistics, Skewness, Kurtosis, and Normality
Statistic Stage 0 Stage 1 Stage 2 Stage 3 Stage 4 Stage 5 Stage 6
Mean 22.12 19.71 17.48 15.62 18.46 17.94 13.45
5% Trimmed Mean 22.38 19.87 17.60 15.43 18.48 17.98 13.29
Std. Deviation 7.33 6.28 7.44 7.25 6.26 7.93 6.85
Skewness -0.38 -0.33 -0.25 0.30 -0.01 -0.12 0.25
Kurtosis -0.29 -0.19 -0.26 -0.34 0.18 -0.40 0.06
Kolmogorov-Smirnov Significance .04* .01* 0.20 0.20 0.20 0.20 0.18* Indicates non-normal distribution
Similar analysis for Stage 1 was conducted given the Komogorov-Smirnov test
for normality result of .01. The difference between mean and trimmed mean was .16.
The standard was 6.28. The differences in trimmed mean and mean and standard
deviation indicate that the data were not unduly influenced by outliers. Histogram and
Normal Q-Q Plots provided in Figure 5 illustrated a slightly negatively skewed
distribution.
Box Plot analysis did indicate an outlier on the lower end of the distribution as
can be seen in Figure 6.
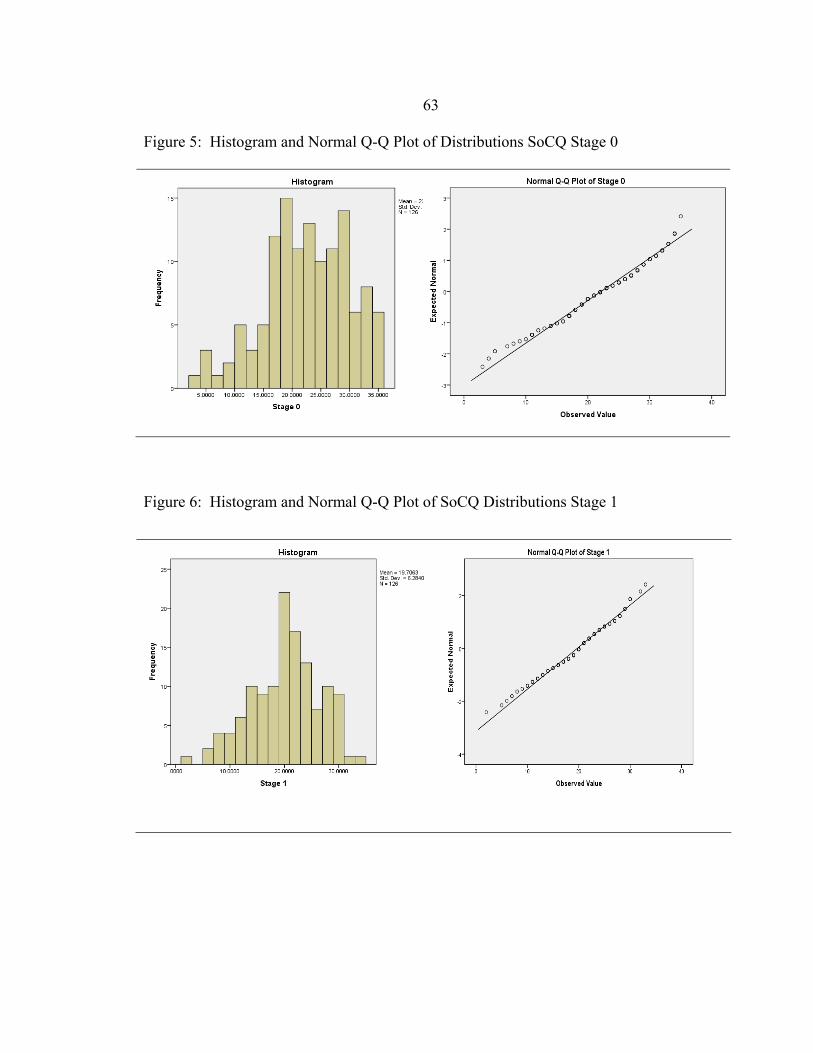
63
Figure 5: Histogram and Normal Q-Q Plot of Distributions SoCQ Stage 0
Figure 6: Histogram and Normal Q-Q Plot of SoCQ Distributions Stage 1
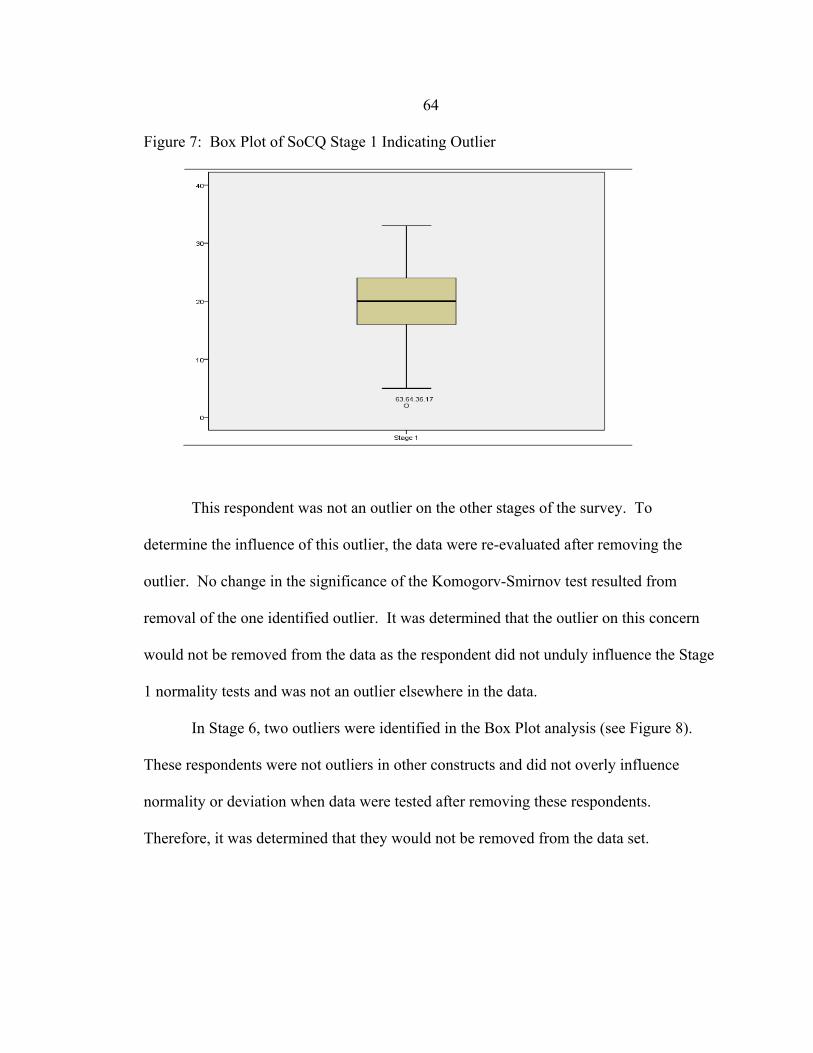
64
Figure 7: Box Plot of SoCQ Stage 1 Indicating Outlier
This respondent was not an outlier on the other stages of the survey. To
determine the influence of this outlier, the data were re-evaluated after removing the
outlier. No change in the significance of the Komogorv-Smirnov test resulted from
removal of the one identified outlier. It was determined that the outlier on this concern
would not be removed from the data as the respondent did not unduly influence the Stage
1 normality tests and was not an outlier elsewhere in the data.
In Stage 6, two outliers were identified in the Box Plot analysis (see Figure 8).
These respondents were not outliers in other constructs and did not overly influence
normality or deviation when data were tested after removing these respondents.
Therefore, it was determined that they would not be removed from the data set.

65
Figure 8: Box Plot of SoCQ Stage 6 Including Outliers
The Komogorov-Smirnov test did indicate non-normal distributions on Stages 0
and 1. According to Pallant, the distribution of these scores could be considered
reasonably normal. A significant result is one over .05, where a very significant result
might be .000. Stage 0 (.043) is only slightly non-normal. Stage 1 is .01, but this does
not necessarily indicate a problem with the scale, more the underlying nature of the
construct being measured as “many scales and measures used in the social sciences have
scores that are skewed, positively or negatively” (Pallant, 2007, p. 62). This is especially
true of social science scales where emotions or concerns are being measured (p. 62) For
statistical analysis, parametric techniques assume that the distribution is normal, “most of
the techniques are reasonably robust or tolerant of this assumption” especially if sample
sizes are greater than 30 (p. 204). To additionally ensure the homogeneity of variance,

66
Levene’s test for equality of variance was utilized as part of the analysis of variance and
t-test analyses.
All of the remaining stages were evaluated for normality and outliers. As
reported previously in The Komogorov-Smirnov test for normality did indicate possible
violations of the assumptions of normality of the distribution at Stage 0 and Stage 1.
Analysis of Histograms, Normal Q-Q Plots, Detrended Normal Q-Q Plots, and Boxplots
revealed that Stage 0 was slightly negatively skewed (-0.38), indicating results clustered
to the right at the higher value of scores. The histogram and Normal Q-Q plot of this
data, presented in Figure 5, illustrate that although negatively skewed, no extreme
outliers exist.
Table 9, no significant outliers were found in the remaining stages and
Komogorov-Smirnov tests were not significant for the remaining stages, indicating
normal distributions.
The constructs were also tested for internal reliability. According to George
Hall,and Stiegelbauer, the reliability of the SoCQ instrument has strong correlations of
internal consistency ranging from .64 to .83 (George, 2006). In this study, the
Cronbach’s alpha coefficient was .78. Values above .7 are considered acceptable
reliability (Urdan, 2010, p. 178).
Data Analysis of the Research Objectives
As described in Chapter 3, each research objective was addressed using Microsoft
Excel for SoCQ profiling and SPSS for data analysis.
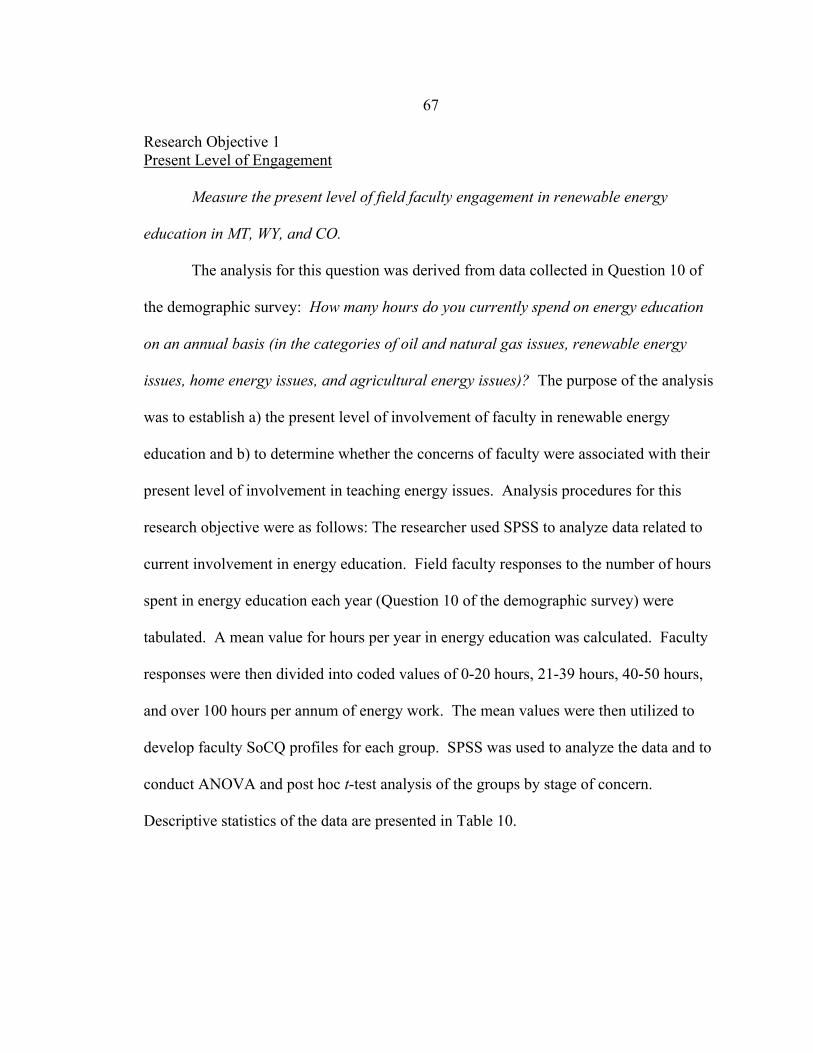
67
Research Objective 1 Present Level of Engagement
Measure the present level of field faculty engagement in renewable energy
education in MT, WY, and CO.
The analysis for this question was derived from data collected in Question 10 of
the demographic survey: How many hours do you currently spend on energy education
on an annual basis (in the categories of oil and natural gas issues, renewable energy
issues, home energy issues, and agricultural energy issues)? The purpose of the analysis
was to establish a) the present level of involvement of faculty in renewable energy
education and b) to determine whether the concerns of faculty were associated with their
present level of involvement in teaching energy issues. Analysis procedures for this
research objective were as follows: The researcher used SPSS to analyze data related to
current involvement in energy education. Field faculty responses to the number of hours
spent in energy education each year (Question 10 of the demographic survey) were
tabulated. A mean value for hours per year in energy education was calculated. Faculty
responses were then divided into coded values of 0-20 hours, 21-39 hours, 40-50 hours,
and over 100 hours per annum of energy work. The mean values were then utilized to
develop faculty SoCQ profiles for each group. SPSS was used to analyze the data and to
conduct ANOVA and post hoc t-test analysis of the groups by stage of concern.
Descriptive statistics of the data are presented in Table 10.
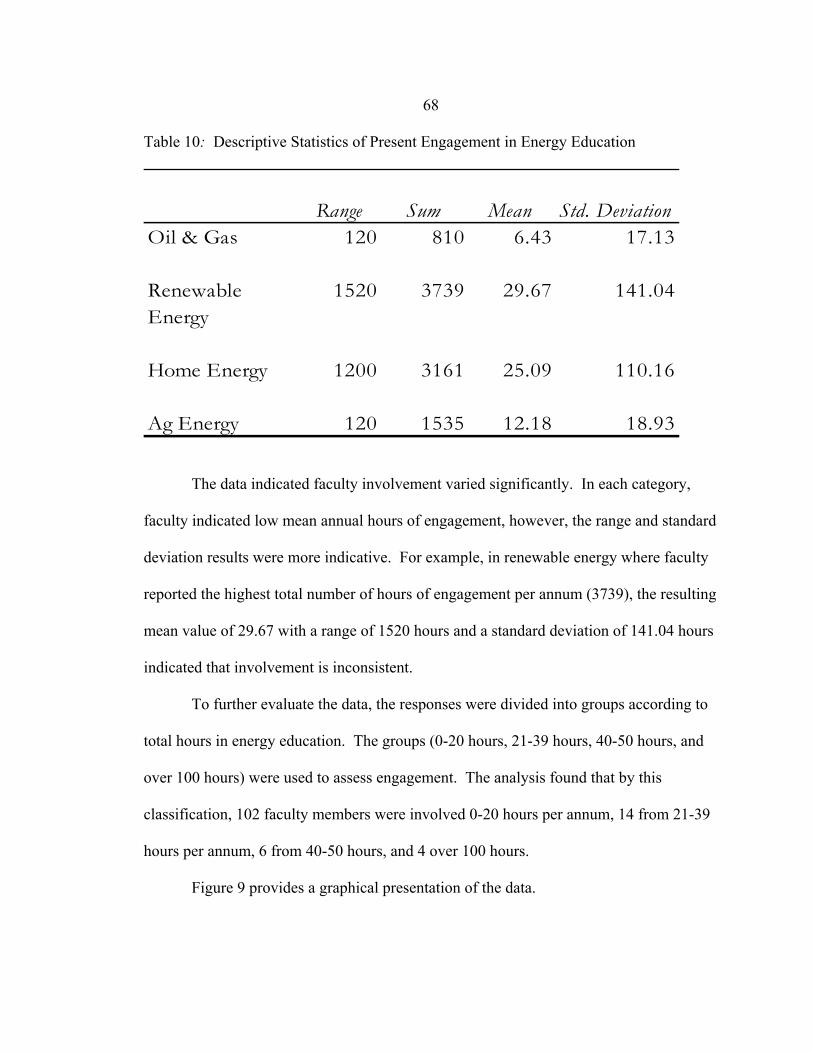
68
Table 10: Descriptive Statistics of Present Engagement in Energy Education
Range Sum Mean Std. DeviationOil & Gas 120 810 6.43 17.13
Renewable Energy
1520 3739 29.67 141.04
Home Energy 1200 3161 25.09 110.16
Ag Energy 120 1535 12.18 18.93
The data indicated faculty involvement varied significantly. In each category,
faculty indicated low mean annual hours of engagement, however, the range and standard
deviation results were more indicative. For example, in renewable energy where faculty
reported the highest total number of hours of engagement per annum (3739), the resulting
mean value of 29.67 with a range of 1520 hours and a standard deviation of 141.04 hours
indicated that involvement is inconsistent.
To further evaluate the data, the responses were divided into groups according to
total hours in energy education. The groups (0-20 hours, 21-39 hours, 40-50 hours, and
over 100 hours) were used to assess engagement. The analysis found that by this
classification, 102 faculty members were involved 0-20 hours per annum, 14 from 21-39
hours per annum, 6 from 40-50 hours, and 4 over 100 hours.
Figure 9 provides a graphical presentation of the data.

69
Figure 9: Present Faculty Engagement in Energy Education
0- 20 Hours81%
21-39 Hours11%
40-50 Hours5%
Over 100 Hours
3%
Present Faculty Engagement in Energy Education
To further investigate this data, the researcher considered the frequency
distributions in each category where respondents indicated no (0) hours of involvement in
energy education. In Oil and Gas Issues, 69% (n = 87) of respondents indicated no hours
per year of energy education. Similarly, no hours of involvement were reported by
42.1% (n = 53 ) in Renewable Energy, 42.9% (n = 54) in Home Energy, and 49.2% (n=
62 ) in Ag Energy.
Using mean values, 92% (n = 116) of respondents indicated less than 40 hours
per annum in any category of energy education. When asked about their employment
status, 94.4% (n = 118) of respondents indicated full employment or 1 FTE. One full-
time-equivalent (FTE) is typically defined at 2080 hours per year. A dedication of 39
hours or less in energy education represented less than 2% of available hours spent in

70
energy by approximately 92% of Extension faculty. This finding indicated that the
majority of Extension faculty were not engaged in energy education at a meaningful
level.
The data were further analyzed to determine whether the four faculty members
who indicated over 100 hours per annum in energy-related programming should be
considered outliers. While their hours spent in energy education clearly differed from the
mean (n = 18.32), their responses to the SoCQ instrument were consistent with the larger
sample. The mean responses of these individuals were further analyzed using SPSS to
verify that their responses were not outliers in any other questions. A SoCQ profile was
generated to determine whether differences in concern existed between the subgroups of
involvement in energy education. Figure 10 illustrates that, despite involvement in
energy education, the profiles of concerns were consistent across groups, with only the
Stage 1 Concern (Informational) showing differences between those with minimal to no
involvement and those with over 100 hours per year.
As the respondents who indicated over 100 hours per year in energy education
involvement did not appear to vary from the other subgroups in the concern profiles, it
was determined that they should not be excluded from the analysis as outliers. Analysis
of the profile will be discussed in subsequent research objectives.

71
Figure 10: SoCQ Profile by Energy Involvement per Annum
0
10
20
30
40
50
60
70
80
90
100
0 1 2 3 4 5 6
Rel
ativ
e In
tens
ityin
Per
cent
iles
SoCQ Profiles by Hours of Energy Involvement per Annum
0-20 Hours
21-39 Hours
40-50 Hours
100+ Hours
Unconcerned Informational Personal Management Consequence Collaboration Refocusing
Stages of Concern
ANOVA analysis (including a Levene’s test) was conducted to determine whether
there were statistically significant differences between groups. A null hypothesis was
assumed: There is no statistically significant difference (at an α of .007 with the
Bonferroni adjustment) in concerns of Extension educators between groups based on
present levels of engagement in energy education. The results of that analysis are
presented in Table 11.
There were no statistically significant differences in Stages of Concern between
groups based on present level of engagement in energy education.

72
Table 11: ANOVA Analysis of Respondents by Hours Spent in Energy Education
Statistic Sig F-Stat Sig.Stage 0 0.24 0.87 0.24 0.87
Stage 1 1.59 0.20 1.51 0.22
Stage 2 0.95 0.42 0.27 0.85
Stage 3 0.27 0.84 0.38 0.77
Stage 4 0.86 0.47 0.24 0.87
Stage 5 0.05 0.98 0.46 0.71
Stage 6 0.97 0.41 0.74 0.53
Levene Statistic ANOVA
Research Objective 2 Concerns of Educators by State
Describe concerns (as defined by the Concerns-Based Adoption Model) of
Extension educators in MT, WY, and CO regarding renewable energy education.
Analysis procedures used in addressing the research objective are as follows: The
researcher used Microsoft Excel to calculate raw scores and relative intensity profiles for
the entire sample. This was accomplished using Excel formulas provided as part of the
Measuring Implementation in Schools SoCQ manual. The formulas were analyzed to
ensure accuracy. High Stage and Second High Stage Scores analysis were used to assist
in the data interpretation. High Stage and Second High Stage Scores were recommended
as part of the analysis of SoCQ (George, 2006). The SoCQ profile, High Stage, and
Second High Stage analysis were also conducted on responses for each state. SPSS was
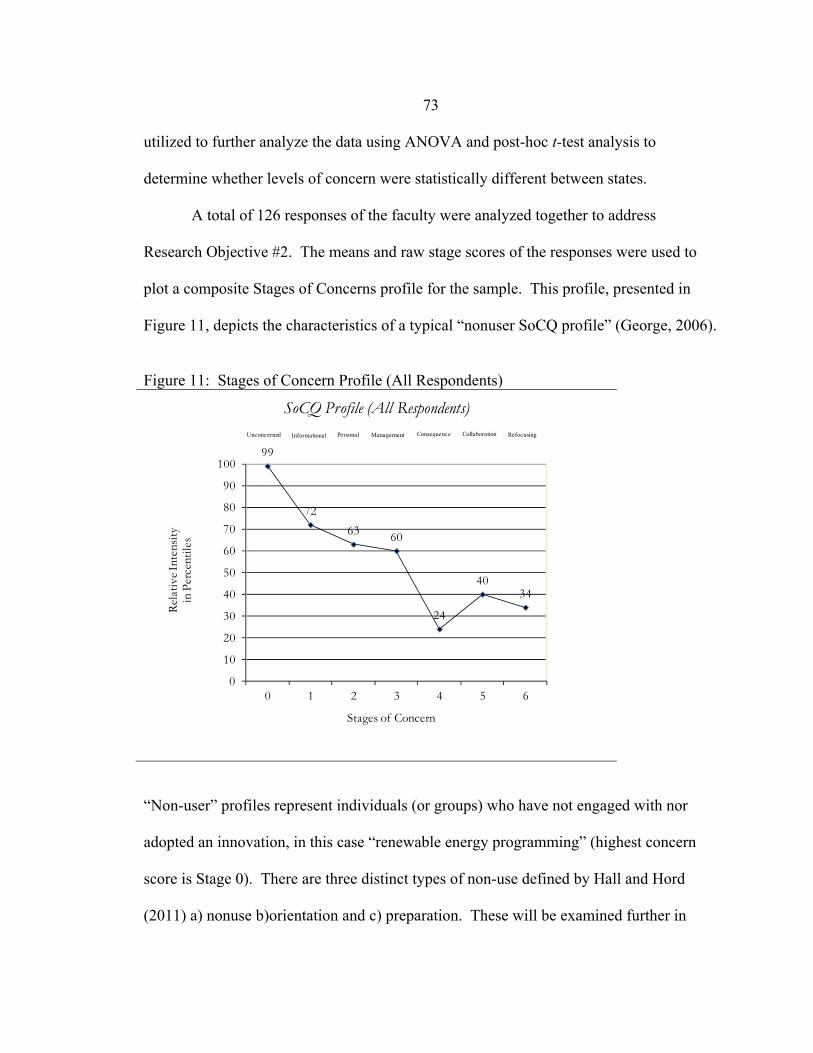
73
utilized to further analyze the data using ANOVA and post-hoc t-test analysis to
determine whether levels of concern were statistically different between states.
A total of 126 responses of the faculty were analyzed together to address
Research Objective #2. The means and raw stage scores of the responses were used to
plot a composite Stages of Concerns profile for the sample. This profile, presented in
Figure 11, depicts the characteristics of a typical “nonuser SoCQ profile” (George, 2006).
Figure 11: Stages of Concern Profile (All Respondents)
99
72
63 60
24
4034
0
10
20
30
40
50
60
70
80
90
100
0 1 2 3 4 5 6
Rel
ativ
e Int
ensi
tyin
Per
cent
iles
Stages of Concern
SoCQ Profile (All Respondents)Unconcerned Informational Personal Management Consequence Collaboration Refocusing
“Non-user” profiles represent individuals (or groups) who have not engaged with nor
adopted an innovation, in this case “renewable energy programming” (highest concern
score is Stage 0). There are three distinct types of non-use defined by Hall and Hord
(2011) a) nonuse b)orientation and c) preparation. These will be examined further in
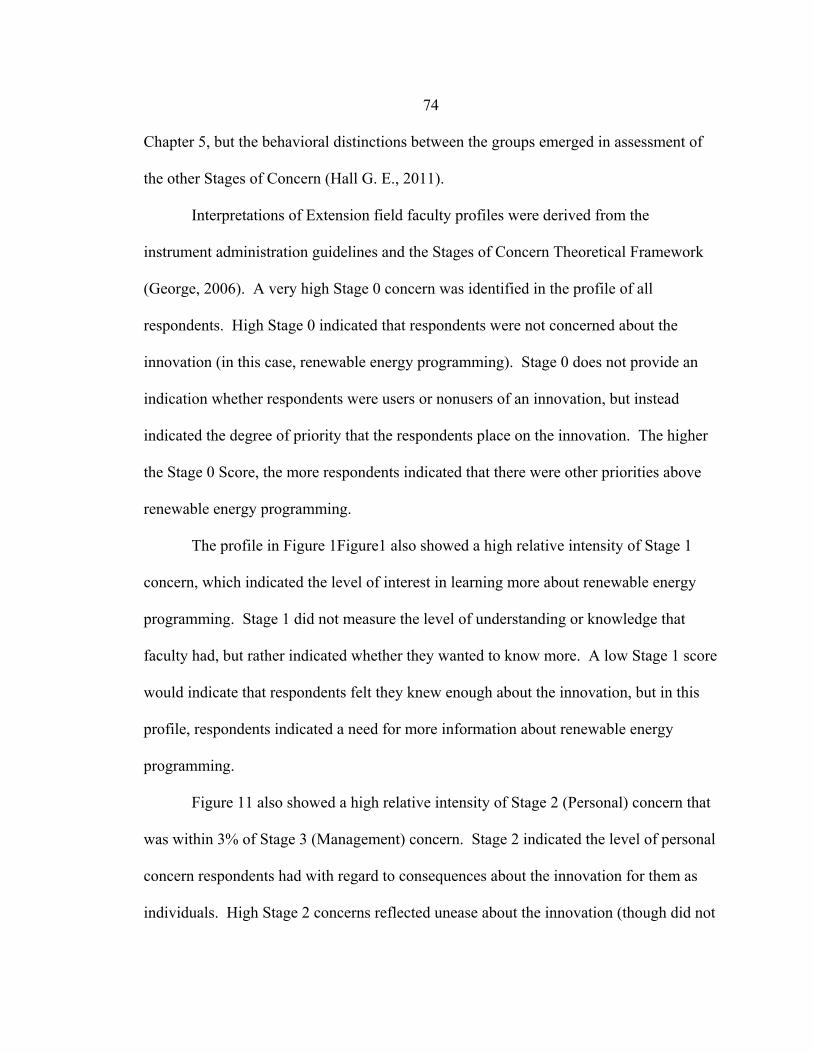
74
Chapter 5, but the behavioral distinctions between the groups emerged in assessment of
the other Stages of Concern (Hall G. E., 2011).
Interpretations of Extension field faculty profiles were derived from the
instrument administration guidelines and the Stages of Concern Theoretical Framework
(George, 2006). A very high Stage 0 concern was identified in the profile of all
respondents. High Stage 0 indicated that respondents were not concerned about the
innovation (in this case, renewable energy programming). Stage 0 does not provide an
indication whether respondents were users or nonusers of an innovation, but instead
indicated the degree of priority that the respondents place on the innovation. The higher
the Stage 0 Score, the more respondents indicated that there were other priorities above
renewable energy programming.
The profile in Figure 1Figure1 also showed a high relative intensity of Stage 1
concern, which indicated the level of interest in learning more about renewable energy
programming. Stage 1 did not measure the level of understanding or knowledge that
faculty had, but rather indicated whether they wanted to know more. A low Stage 1 score
would indicate that respondents felt they knew enough about the innovation, but in this
profile, respondents indicated a need for more information about renewable energy
programming.
Figure 11 also showed a high relative intensity of Stage 2 (Personal) concern that
was within 3% of Stage 3 (Management) concern. Stage 2 indicated the level of personal
concern respondents had with regard to consequences about the innovation for them as
individuals. High Stage 2 concerns reflected unease about the innovation (though did not

75
necessarily indicate resistance). Stage 3 concerns were those related to logistics, time,
and management (p 53). The SoCQ scoring guide suggested that a difference of only 1
or 2 percentage points between scores should be considered essentially a tie (p. 32) for
the person’s level of intensity related to a concern. While a 3-point spread was not
considered a tie, this profile does show a very close level of concern between Stage 2 and
Stage 3.
Stages 4-6 indicated low levels of concern. Respondents indicated a low level of
concern at Stage 4 (Consequence). This low level of concern indicated that faculty had
minimal concerns about the effects of renewable energy programming on constituents.
The slight tick upward at Stage 5 (Collaboration) indicated some (although low) level of
interest or concern with regard to collaborating with others. Higher Stage 5 scores could
have indicated some level of interest with regard to what others were doing in terms of
renewable energy programming. It was significant that the profile tailed down at Stage 6.
A high Stage 6 in a non-user profile indicated that respondents had strong ideas about
how an innovation should be accomplished and tended to indicate negative responses to
an innovation (p 54). This profile did not indicate an upward tick in Stage 6 and
therefore, did not indicate that tendency.
The SoCQ profile was the most frequently used method for interpreting data from
the questionnaire. However, first and second high stage score analysis were also
recommended. High score and second high score relative frequency analysis yielded
information on relationships or patterns of concern. The analysis may also indicate
subgroups within a data set with a profile different from the aggregate profile. First and

76
second high stage relative frequency analysis is calculated from the raw scores (not
percentile scores) of the SoCQ data analysis, which helps to further reduce the influence
of extreme values that might be obscured in averaging and rounding.
A summary of the High Stage Score and Second High Stage Score analysis for all
respondents is provided in Figure Figure 12 and Figure 13. These charts illustrated the
high stage score of the overall sample was Stage 0 Concern, with Stage 1 as the second
high stage score.
Figure 12: High Stage Score (Total Respondents)
0.0
0.1
0.2
0.3
0.4
0.5
0 1 2 3 4 5 6
Rel
ativ
e Fr
eque
ncy
Stages of Concern
High Stage Score (Total Respondents)
George (2006), the author of the analysis guidelines established for use of the
SoCQ instrument, cautioned that a particularly high Stage 0 concern relative to other
scores may have indicated that the other scores have little significance (p 53). Because of
the developmental nature of concerns, the second high stage score will often be adjacent
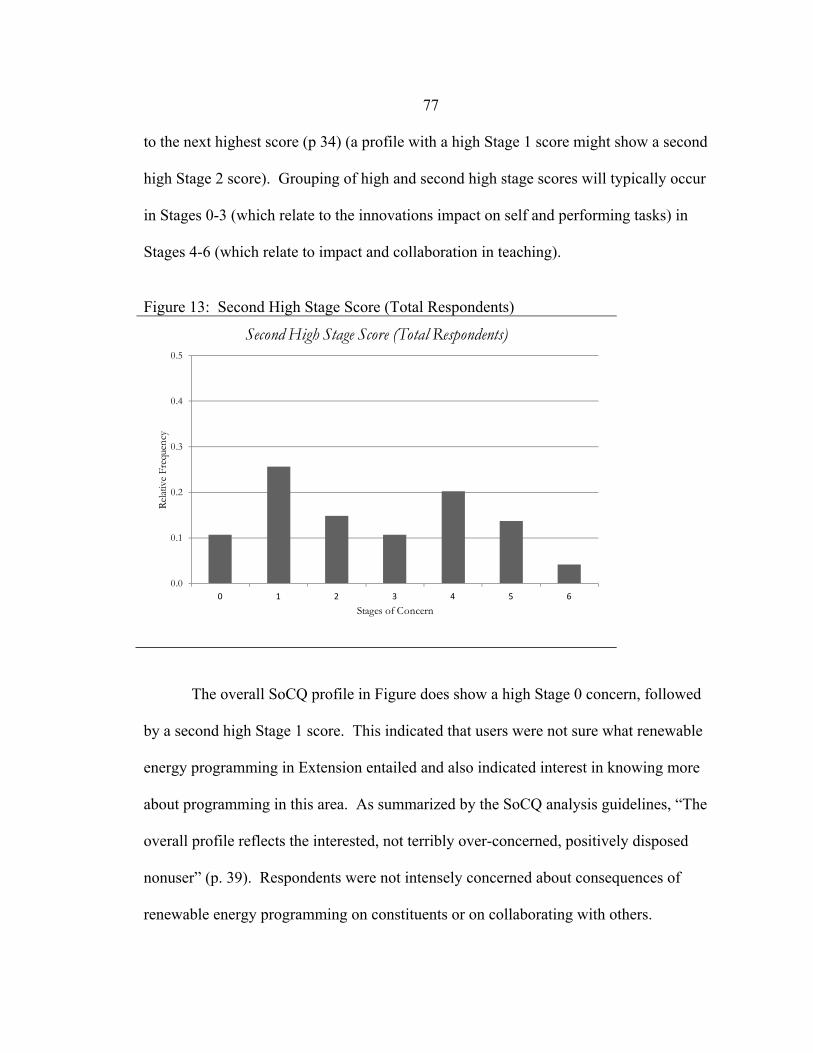
77
to the next highest score (p 34) (a profile with a high Stage 1 score might show a second
high Stage 2 score). Grouping of high and second high stage scores will typically occur
in Stages 0-3 (which relate to the innovations impact on self and performing tasks) in
Stages 4-6 (which relate to impact and collaboration in teaching).
Figure 13: Second High Stage Score (Total Respondents)
0.0
0.1
0.2
0.3
0.4
0.5
0 1 2 3 4 5 6
Rel
ativ
e Fr
eque
ncy
Stages of Concern
Second High Stage Score (Total Respondents)
The overall SoCQ profile in Figure does show a high Stage 0 concern, followed
by a second high Stage 1 score. This indicated that users were not sure what renewable
energy programming in Extension entailed and also indicated interest in knowing more
about programming in this area. As summarized by the SoCQ analysis guidelines, “The
overall profile reflects the interested, not terribly over-concerned, positively disposed
nonuser” (p. 39). Respondents were not intensely concerned about consequences of
renewable energy programming on constituents or on collaborating with others.
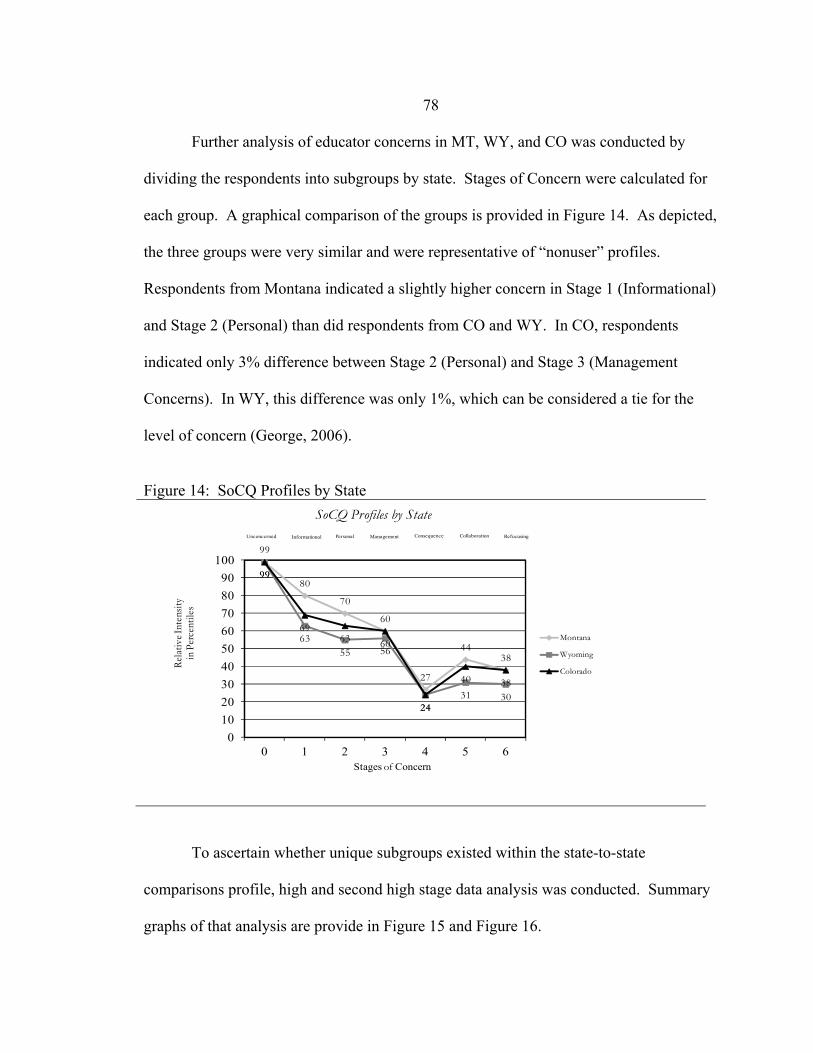
78
Further analysis of educator concerns in MT, WY, and CO was conducted by
dividing the respondents into subgroups by state. Stages of Concern were calculated for
each group. A graphical comparison of the groups is provided in Figure 14. As depicted,
the three groups were very similar and were representative of “nonuser” profiles.
Respondents from Montana indicated a slightly higher concern in Stage 1 (Informational)
and Stage 2 (Personal) than did respondents from CO and WY. In CO, respondents
indicated only 3% difference between Stage 2 (Personal) and Stage 3 (Management
Concerns). In WY, this difference was only 1%, which can be considered a tie for the
level of concern (George, 2006).
Figure 14: SoCQ Profiles by State
99
80
70
60
27
4438
99
6355 56
2431 30
99
6963 60
24
40 38
0
10
20
30
40
50
60
70
80
90
100
0 1 2 3 4 5 6
Rel
ativ
e Int
ensi
tyin
Per
cent
iles
SoCQ Profiles by State
Montana
Wyoming
Colorado
Unconcerned Informational Personal Management Consequence Collaboration Refocusing
Stages of Concern
To ascertain whether unique subgroups existed within the state-to-state
comparisons profile, high and second high stage data analysis was conducted. Summary
graphs of that analysis are provide in Figure 15 and Figure 16.

79
Figure 15: High Stage Score by State
0.0
0.1
0.2
0.3
0.4
0.5
0 1 2 3 4 5 6
Relat
ive
Freq
uenc
y
Stages of Concern
High Stage Score (By State)
Montana
Wyoming
Colorado
Figure 16: Second High Stage Score by State
0.0
0.1
0.2
0.3
0.4
0.5
0 1 2 3 4 5 6
Rel
ativ
e Fr
eque
ncy
Stages of Concern
Second High Stage Score (By State)
Montana
Wyoming
Colorado
High and second high stage score analysis by state again revealed that the majority of
respondents were positively disposed nonusers, with concerns concentrated at Stage 0-1.

80
However, WY respondents did indicate a higher level of concern than the other states in
Stages 4-5, which were stages reflecting a concern for impact on constituents and
collaboration with other educators.
Analysis of the SoCQ profile and High Stage and Second High Stage Scores
provided insight into educator concerns. Statistical analysis was also conducted to
compare mean values of educators in each concern construct by state and to determine
whether difference in mean levels of concern are statistically different. The results were
as follows:
In conducting the statistical analysis, a null hypothesis was assumed: There is no
statistically significant difference (at a Bonferroni adjusted α of .007) in concerns of
Extension educators between the states. ANOVA analysis was utilized to compare mean
values both between the states and within the states. In this analysis, the ANOVA
calculations indicated whether there were significant differences in the state of
employment (CO, MT, and WY) and the mean level of educator concerns at each stage of
the SoCQ analysis. Descriptive statistics and ANOVA analyses were conducted for each
stage of SoCQ concern. The results are presented in Table 12.
The Levene’s Test for homogeneity of variance confirms that the assumption of
homogeneity between groups was not violated in this analysis (Leven’s significance less
than .05) The analysis produced a statistically significant result at α of .05 for variables
Stage 1 (Informational) (F = 7.67, = .000) and Stage 2 (Personal) (F = 5.09, = .01).
Therefore, the null hypothesis (indicating no difference between the concerns by the state

81
of employment) was rejected for Stage 1 and Stage 2 SoCQ Concerns. The null
hypothesis was accepted for the remaining stages.
Table 12: Descriptive Statistics & ANOVA Analysis of Responses by Concern Stage & State
Concern Statistic Sig Mean Std. Dev. Mean Std. Dev. Mean Std. Dev. F Stat SigStage 0 (Awareness) 2.00 0.14 22.81 7.22 21.71 8.34 21.33 6.63 0.52 0.60
Stage 1 (Informational) 0.33 0.72 21.85 5.97 17.00 5.60 18.53 6.28 7.67 0.00
Stage 2 (Personal) 0.89 0.42 19.42 6.79 14.39 7.14 16.97 7.91 5.09 0.01
Stage 3 (Management) 1.59 0.21 16.10 6.81 14.71 6.59 15.61 8.50 0.37 0.69
Stage 4 (Consequence) 0.42 0.66 19.00 5.66 18.19 6.64 17.81 6.95 0.44 0.65
Stage 5 (Collaboration) 3.07 0.05 18.81 6.97 18.81 6.97 15.97 9.69 1.35 0.26
Stage 6 (Refocusing) 2.49 0.09 14.39 6.04 11.61 8.20 13.50 6.71 1.69 0.19
ANOVALevene Test Montana Wyoming Colorado
α > .05 Post hoc t-tests were conducted to further determine where statistically significant
difference between the Stage 1 and Stage 2 Concerns might exist, or to determine
whether all concerns by state differed from one another at a significant level. Tukey’s
Honestly Significantly Different (HSD) test was utilized for the post hoc t-test. This is a
fairly liberal test and is more likely to produce a statistically significant difference than
other t-tests (e.g. – Scheffe) (Urdan, 2010). The following was determined from this
analysis for Stage 1 (Informational) Concerns:
The mean level of Stage 1 Concern of educators in Montana is statistically
different from those of educators in Wyoming (mean difference of 4.85) (Tukey
HSD test = .001, at α = .007).

82
The mean level of Stage 1 Concern of educators in Montana (21.85) was
statistically different from those of educators in Colorado (18.52) (mean
difference of 3.32) (Tukey HSD test = .026, at α = .007).
The mean level of Stage 1 Concern of educators in Wyoming (21.71) was not
statistically different from those of educators in Colorado (18.52) (Tukey HSD test
= .551, at α = .007).
Post-hoc t-tests were also conducted for Stage 2 (Personal) Concerns. Results of that
analysis are as follows:
The mean level of Stage 2 Concern of educators in Montana was statistically
different from those of educators in Wyoming (mean difference 5.04) (Tukey HSD
test = .006, at α = .007).
The mean level of Stage 2 Concern of educators in Montana was not statistically
different from those of educators in Colorado (mean difference 2.45) (Tukey HSD
test = .246, at α = .007).
The mean level of Stage 2 Concern of educators in Wyoming was not statistically
different from those of educators in Colorado (mean difference 2.59) (Tukey HSD
test = .312, at α = .007).
Research Objective 3 Concerns of Educators by Job Function
Determine whether MT, WY, and CO field faculty concerns differ by the primary
job function.

83
Analysis procedures used to address this objective were as follows: The
researcher divided the faculty into subgroups based on the responses to Question 9 of the
demographic survey. In this question, respondents were asked to indicate the percentage
of time they spent working in the categories of natural resources, agriculture, 4-H, family
and consumer sciences, and community and economic development. This question
sought to overcome differences in job classifications between states and to mitigate
differences between position appointments and actual time in various job functions (For
example, a position appointment may indicate a 30/30/30/10% split between various job
functions, but actual time may be heavily weighted in one area.) During the data analysis,
the natural resources and agriculture categories were combined. There were only five
respondents who indicated time in natural resources, and all of those respondents also
reported time in agriculture. The responses were then tabulated by the percentage of time
spent in each area. Any respondent indicating 50% or more time spent in a subject matter
area was categorized into that area. (For instance, a respondent indicating 60% of time
spent in agriculture was categorized as an agriculture appointment.) No respondents
reported a 50%/50% split between categories. Further, a category for “Mixed
Appointment” was created to reflect those respondents who did not indicate at least 50%
focus in any one area. This “Mixed” category was likely comprised respondents of single
field faculty counties. This categorization of positions was done to overcome differences
between types of appointments between states.
Following the creation of the subcategories, the researcher calculated a composite
SoCQ profile for each subgroup. The study compared profiles for trends and differences.

84
The High Stage and Second High Stage Score for each subgroup was calculated and
comparative analysis was conducted. Using SPSS, a series of ANOVA analyses was
conducted to identify any significant differences between groups.
Using the grouping described, 37 respondents (29.4%) were Ag and Natural
Resource positions, 30 (23.8%) 4-H, 13 (10.3%) FCS, 13 (10.3%) CD/ED, and 33
(26.2%) were mixed appointments.
A SoCQ profile of the groups was developed and is presented in Figure 17.
Figure 17: SoCQ Profile for Educators by Position Type
0
10
20
30
40
50
60
70
80
90
100
0 1 2 3 4 5 6
Rel
ativ
e In
tens
ity
in P
erce
ntile
s
SoCQ Profiles by Position Type
Ag & Natural Resources
4-H
FCS
CD/ED
Mixed Appointment
Unconcerned Informational Personal Management Consequence Collaboration Refocusing
Stages of Concern
No statistically significant differences in levels of concern were identified as all
position types were profiled as non-users. Respondents classified in a primary position
type of 4-H showed two interesting characteristics. First, the respondents indicated a tie
score for Stage 1 (69%), Stage 2 (70%), and Stage 3 (69%) concerns per the SoCQ
85
scoring manual where a difference of less than 2 was considered a tie. This response
indicated that 4-H faculty have equal levels of concern in the need for information,
concerns about implications for self (time and energy required, expectations for changes
in teaching, etc.) and concerns about management (time allocation, ability to manage all
responsibilities, coordination of tasks and people). Also interesting in the 4-H profile
was the uptick at Stage 6. While it is important to remember that a high Stage 0 score
does overwhelm other responses, an uptick at Stage 6 is an indication of a resistance to
the innovation (George, 2006, p. 42). All other groups profiled as positively disposed
non-users.
High Stage and Second High Stage score analyses were also conducted. In Figure
18, the relative frequency of Stage 0 concern was again indicated. Community and
economic development (CD/ED) faculty did indicate an equal relative frequency of Stage
0 (Awareness) concern and Stage 5 (Collaborative) concern. This scoring pattern
suggested that CD/ED faculty were not aware of the innovation, but desired to know
what others are doing in this subject. High early adopter scores (0-1) with a high Stage 5
score may have also indicated that faculty did not desire to lead an innovation, but were
open to collaborating with others to implement. This was more typical of a high Stage 1
and high Stage 5 score, but may also apply for these faculty.
Second High Stage Score analysis for most position types showed a grouping of
high Stage 0 and Stage 1 concerns. Both 4-H and FCS faculty showed high (compared to
other groups) relative frequencies in Stage 4 as their second high stage. Stage 4 concerns
were those related to implications for learners. Because Stage 0 scores were very high,

86
caution must be exercised in reviewing information on other stages. The Second High
Stage Score data was presented in Figure 19
Figure 18: High Stage Score by Position Type
0
0.1
0.2
0.3
0.4
0.5
0.6
0 1 2 3 4 5 6
Relat
ive
Freq
uenc
y
Stages of Concern
High Stage Score (By Position Type)
Ag & Natural Resources
4‐H
FCS
CD/ED
Mixed Appointment
Figure 19: Second High Stage Score by Position Type
0
0.1
0.2
0.3
0.4
0.5
0.6
0 1 2 3 4 5 6
Relat
ive
Freq
uenc
y
Stages of Concern
Second High Stage Score (By Position Type)
Ag & Natural Resources
4‐H
FCS
CD/ED
Mixed Appointment

87
The SoCQ instrument was a valid, reliable tool and the profiles were sensitive
enough to indicate the presence of concern differences between user groups. However, to
verify that there were no statistically significant differences in mean levels of concern for
each construct between these groups, statistical analyses (ANOVA) were conducted.
Based on the SoCQ profile, a null hypothesis was assumed: There was no
statistically significant difference (at a Bonferroni adjusted α of .007) in concerns of
Extension educators between position types. Descriptive statistics and single factor
ANOVA analyses were conducted for each stage of SoCQ concern. There results were
summarized in Table 13.
Levene’s Test for homogeneity of variance results indicated assumptions of
homogeneity for this data set were above .05, and therefore were not violated. The
ANOVA analysis yielded no significant differences in the mean level of concerns
between position types, thus confirming the null hypothesis.

Table 13: ANOVA Analysis of Respondents by Position Type
Concern Statistic Sig Mean Std. Dev. Mean Std. Dev. Mean Std. Dev. Mean Std. Dev. Mean Std. Dev. F Stat SigStage 0 (Awareness) .29 .885 21.97 7.34 24.17 6.36 19.92 7.41 19.77 8.48 22.21 7.52 1.23 0.303
Stage 1 (Informational) .44 .776 19.57 6.50 19.43 6.92 17.54 5.36 22.00 5.37 20.09 6.03 0.87 0.483
Stage 2 (Personal) .34 .847 17.81 7.33 18.87 8.04 15.85 6.66 18.85 6.18 15.97 7.76 0.88 0.477
Stage 3 (Management) .58 .679 14.81 7.74 17.50 6.89 13.23 7.72 16.69 8.45 15.33 6.22 1.06 0.380
Stage 4 (Consequence) .62 .646 18.62 6.39 19.07 7.01 16.62 5.72 20.62 6.78 17.61 5.37 0.89 0.470
Stage 5 (Collaboration) .68 .606 18.73 8.45 16.70 8.55 15.38 6.80 20.85 7.38 18.06 7.27 1.05 0.383
Stage 6 (Refocusing) .62 .649 13.57 7.07 14.43 7.23 10.23 5.37 13.08 7.37 13.85 6.56 0.91 0.460
MixedCDEDLevene's Test Agriculture 4-H FCS ANOVA
88

89 Research Objective 4 Concerns of Educators by Subgroups
Identify CBAM (Concerns-Based Adoption Model) concerns of subgroups of MT,
WY, and CO Extension faculty that may influence program involvement with renewable
energy education, based on standardized user profiles generated from the SoCQ (Stages
of Concern Questionnaire).
Data analysis procedures for this objective were as follows: The researcher
divided the faculty into subgroups based on the responses to the demographic survey.
Subgroups were determined by years in Extension, age of faculty member, and work
history. Following the creation of the subgroups, the researcher calculated a composite
SoCQ profile for each subgroup. The study compared profiles for trends and differences.
The High Stage and Second High Stage Score for each subgroup was calculated and
comparative analysis was conducted. Next, a series of ANOVA analyses were conducted
to identify any significant differences between groups. When statistical significance
existed, post hoc t-tests were conducted to determine where the statistical differences
might exist.
Subgroup A: Time in Extension: In this analysis, respondents were divided into
subgroups based on years of employment with Extension. Years of employment
categories were listed on the survey instrument (less than 1 year, 1-5 years, 6-10 years,
11-15 years, 16-20 years and over 20 years). An SoCQ profile for the subgroups is
presented in Figure 20.

90 Figure 20: SoCQ Profiles by Time in Extension
0
10
20
30
40
50
60
70
80
90
100
0 1 2 3 4 5 6
Rel
ativ
e In
tens
ity
in P
erce
ntile
sSoCQ Profiles by Time in Extension
Less than 1 year
1-5 years
6-10 years
11-15 years
16-20 years
Over 20 years
Unconcerned Informational Personal Management Consequence Collaboration Refocusing
Stages of Concern
Consistent with the overall profile, the subgroups profile as non-users. However, a few
interesting elements emerged in the analysis by time in Extension. First, respondents in
Extension from 6-10 years indicated a higher Stage 3 (Management) concern than other
groups, especially when compared to those in the 16-20 year group. Also, the over 20
years group indicated a slight uptick at Stage 6, which may have indicated a resistance to
the innovation.
To further analyze the data, High Stage and Second High Stage scores were
calculated for each of the subgroups. Figure 21.
Figure 21 presents the High Stage Score analysis.

91 Figure 21: High Stage Score by Time in Extension
0
0.1
0.2
0.3
0.4
0.5
0.6
0 1 2 3 4 5 6
Rel
ativ
e Fr
eque
ncy
Stages of Concern
High Stage Score (By Time in Extension)
Less than 1 year
1‐5 years
6‐10 years
11‐15 years
16‐20 years
Over 20 years
High and second high stage score analyses were recommended to identify unique
subgroups with the SoCQ profiles. In this analysis, Stage 0 concern was the primary
High Stage Score. Those employed by Extension less than 1 year did indicate a
predominate Stage 0 concern, but were relatively lower in the Stage 0 concern and
relatively higher Stage 4 (Consequence) concern than other groups. Those employed
from 1-5 years were also relatively lower in Stage 0 concern.
Second High Stage concern analysis, presented in Figure 22, showed those
employed less than 1 year had a relatively higher Stage 0 score in the second high stage.
Stage 1 concern showed high relative intensity for all groups, where alignment between
adjacent constructs was expected. There were relatively strong Second High Stage
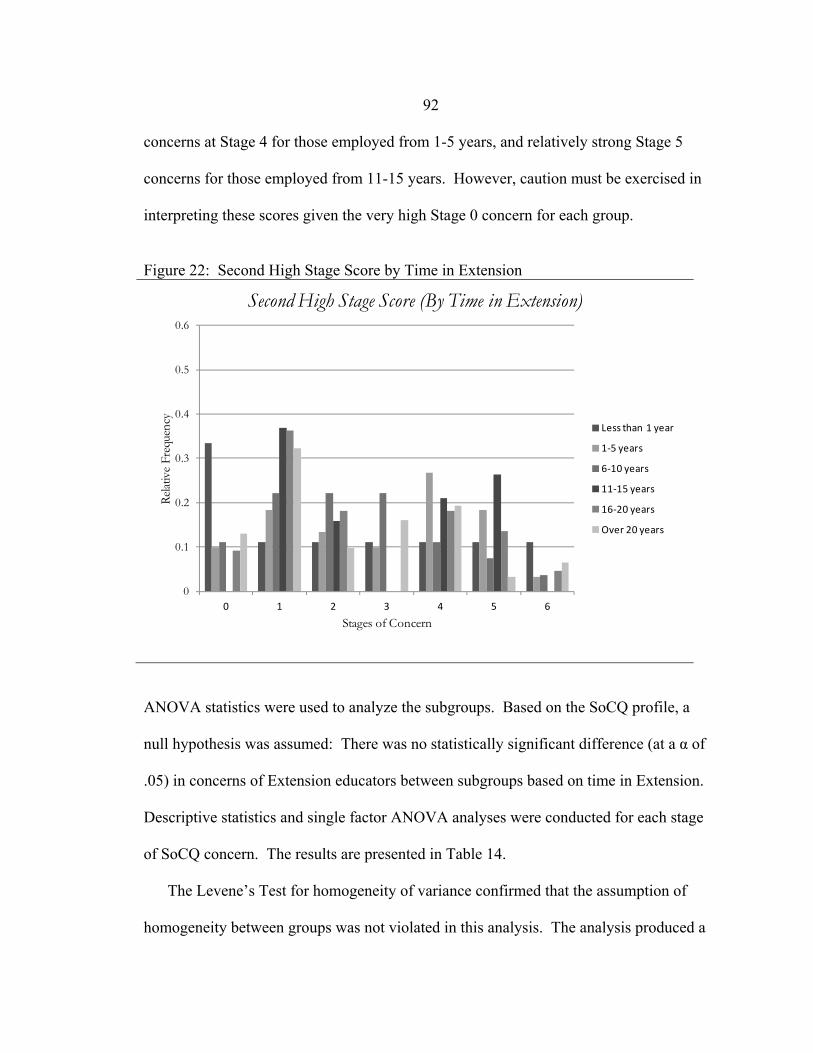
92 concerns at Stage 4 for those employed from 1-5 years, and relatively strong Stage 5
concerns for those employed from 11-15 years. However, caution must be exercised in
interpreting these scores given the very high Stage 0 concern for each group.
Figure 22: Second High Stage Score by Time in Extension
0
0.1
0.2
0.3
0.4
0.5
0.6
0 1 2 3 4 5 6
Rel
ativ
e Fr
eque
ncy
Stages of Concern
Second High Stage Score (By Time in Extension)
Less than 1 year
1‐5 years
6‐10 years
11‐15 years
16‐20 years
Over 20 years
ANOVA statistics were used to analyze the subgroups. Based on the SoCQ profile, a
null hypothesis was assumed: There was no statistically significant difference (at a α of
.05) in concerns of Extension educators between subgroups based on time in Extension.
Descriptive statistics and single factor ANOVA analyses were conducted for each stage
of SoCQ concern. The results are presented in Table 14.
The Levene’s Test for homogeneity of variance confirmed that the assumption of
homogeneity between groups was not violated in this analysis. The analysis produced a

93 statistically significant result at α of .05 for variables Stage 3 (Management) (F = 2.62,
= .03). Therefore, the null hypothesis (indicating no difference between the concerns by
the time in Extension) was rejected for Stage 3. The null hypothesis was accepted for the
remaining stages.
Table 14: ANOVA Analysis of Respondents by Time in Extension
Stage Statistic Sig F-Stat SigStage 0 0.69 0.63 0.40 0.85
Stage 1 0.69 0.63 0.56 0.73
Stage 2 1.44 0.22 1.16 0.34
Stage 3 2.32 0.05 2.62 0.03
Stage 4 0.91 0.48 1.02 0.41
Stage 5 0.40 0.85 0.57 0.72
Stage 6 0.49 0.78 0.38 0.86
Levene Statistic ANOVA
Post hoc t-tests were conducted to further determine where statistically significant
differences between the Stage 3 concerns might exist between subgroups. The following
was determined from this analysis for Stage 3 (Management) Concerns:
The mean level of Stage 3 Concern of educators between those employed for 6-10
years was statistically different from those employed for 16-20 years (mean
difference of 8.13) (Tukey HSD test = .008, at α = .007)
94
The mean level of Stage 3 Concern of educators between all other subgroups was
not statistically significant at α = .007.
Subgroup B: Age of Faculty Member: Responses were analyzed by subgroups of
age. The categories for age were provided in the survey instrument (21-25 years, 26-35
years, 36-45 years, 46-50 years, 51-55 years, 56-60 years, and over 60 years). A SoCQ
profile comparison for the subgroups was developed and was presented in Figure 23.
The non-user profile was again consistent between subgroups. Respondents 46-50 years
old did show a tie score between Stage 1 (Informational) (Score 80) and Stage 2
(Personal) (Score 78). The respondents aged 21 to 25 showed higher levels of concern
relative to others, most notably at Stage 1, Stage 2, and Stage 4. Those 56-60 years old
indicated a slight tailing up at Stage 6, which may have indicated resistance.
High Stage Score analysis was conducted for each of the subgroups and the
results are presented in Figure 24. Respondents aged 21-25 indicated a lower relative
intensity of Stage 0 as their High Stage Score. They also indicated dispersed high stage
scores between Stage 1, Stage 2, and Stage 4. The 46-50 and 51-55 year olds also
indicated a lesser high stage score in Stage 0, relative to the other groups over 25 years
old.
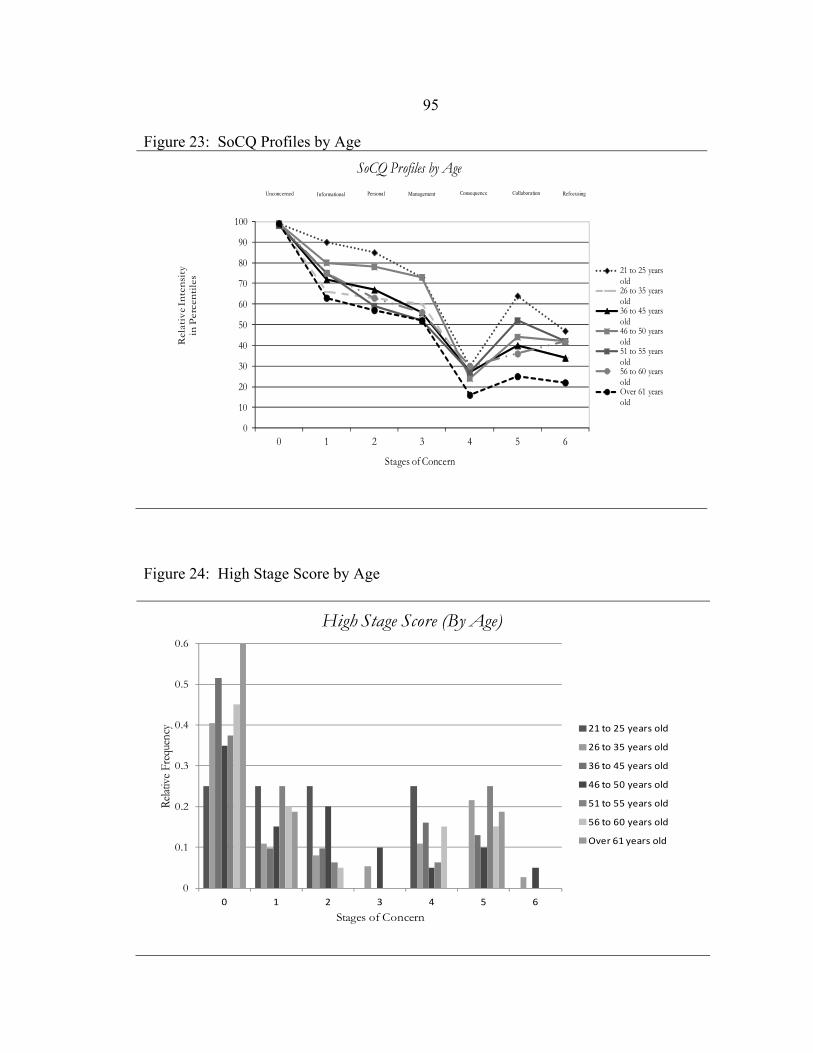
95 Figure 23: SoCQ Profiles by Age
0
10
20
30
40
50
60
70
80
90
100
0 1 2 3 4 5 6
Rel
ativ
e In
ten
sity
in P
erce
nti
les
SoCQ Profiles by Age
21 to 25 years old26 to 35 years old36 to 45 years old46 to 50 years old51 to 55 years old56 to 60 years oldOver 61 years old
Unconcerned Informational Personal Management Consequence Collaboration Refocusing
Stages of Concern
Figure 24: High Stage Score by Age
0
0.1
0.2
0.3
0.4
0.5
0.6
0 1 2 3 4 5 6
Relat
ive
Freq
uenc
y
Stages of Concern
High Stage Score (By Age)
21 to 25 years old
26 to 35 years old
36 to 45 years old
46 to 50 years old
51 to 55 years old
56 to 60 years old
Over 61 years old
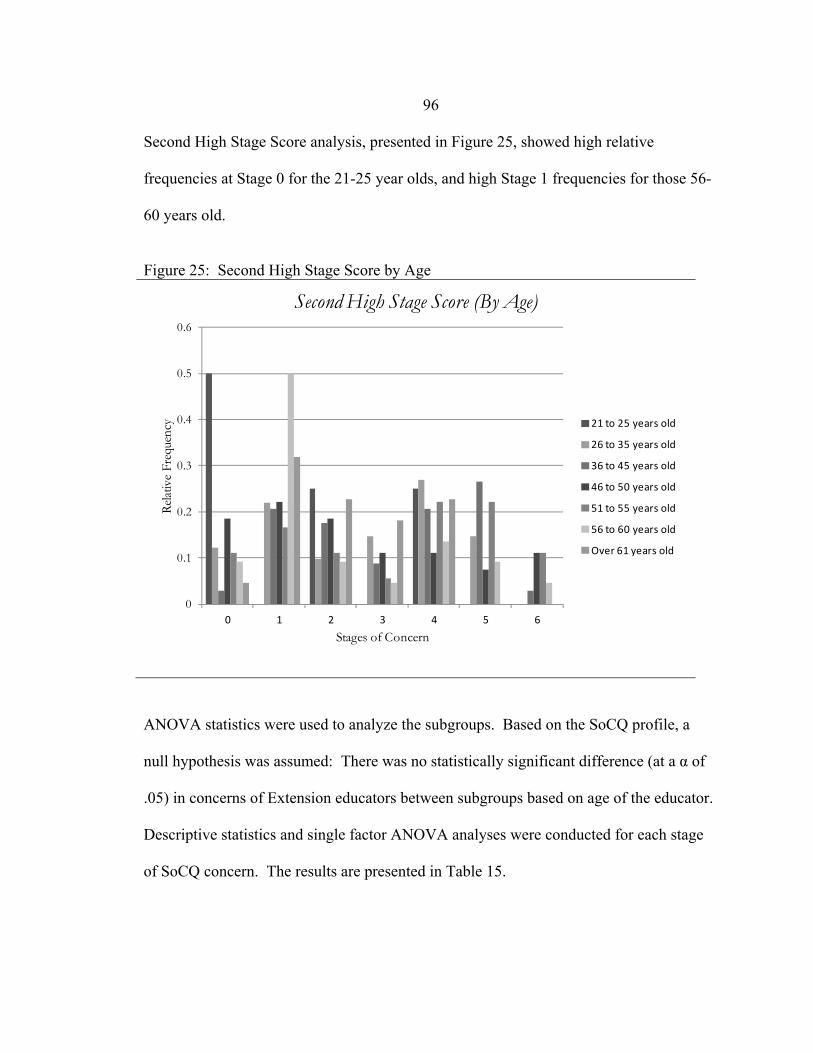
96 Second High Stage Score analysis, presented in Figure 25, showed high relative
frequencies at Stage 0 for the 21-25 year olds, and high Stage 1 frequencies for those 56-
60 years old.
Figure 25: Second High Stage Score by Age
0
0.1
0.2
0.3
0.4
0.5
0.6
0 1 2 3 4 5 6
Rel
ativ
e Fr
eque
ncy
Stages of Concern
Second High Stage Score (By Age)
21 to 25 years old
26 to 35 years old
36 to 45 years old
46 to 50 years old
51 to 55 years old
56 to 60 years old
Over 61 years old
ANOVA statistics were used to analyze the subgroups. Based on the SoCQ profile, a
null hypothesis was assumed: There was no statistically significant difference (at a α of
.05) in concerns of Extension educators between subgroups based on age of the educator.
Descriptive statistics and single factor ANOVA analyses were conducted for each stage
of SoCQ concern. The results are presented in Table 15.

97 Table 15: ANOVA Analysis of Respondents by Age of Educator
Stage Statistic Sig F-Stat Sig
Stage 0.72 .64 .41 .87
Stage 1 1.21 .31 1.65 .14
Stage 2 .91 .49 1.80 .10
Stage 3 2.10 .06 .87 .52
Stage 4 1.01 .42 .93 .47
Stage 5 .55 .77 1.36 .24
Stage 6 .48 .82 .98 .45
Levene Statistic ANOVA
The Levene’s Test for homogeneity of variance confirmed assumptions of
homogeneity between groups were not violated in this analysis. The ANOVA analysis
did not indicate a statistically significant difference between the subgroups. Therefore,
the null hypothesis (indicating no difference between the concerns by age of the
educator) was accepted.
Subgroup C: Work History: Respondents were asked to identify their
professional background. The question sought to assess whether differences existed
between faculty members who had a) only worked in Extension b) had or currently
worked in agriculture c) had experience from the private sector or d) had experience from
another public sector. Did, for example, faculty members hired from the private sector
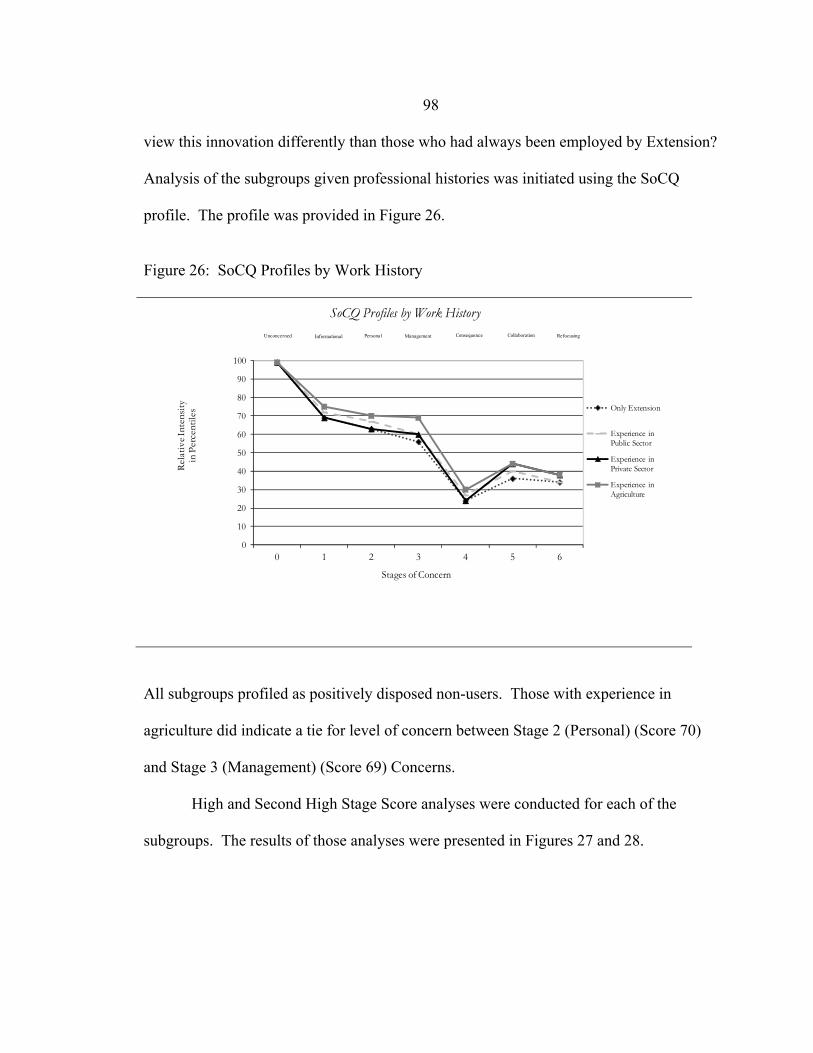
98 view this innovation differently than those who had always been employed by Extension?
Analysis of the subgroups given professional histories was initiated using the SoCQ
profile. The profile was provided in Figure 26.
Figure 26: SoCQ Profiles by Work History
0
10
20
30
40
50
60
70
80
90
100
0 1 2 3 4 5 6
Rel
ativ
e In
tens
ity
in P
erce
ntile
s
SoCQ Profiles by Work History
Only Extension
Experience in Public Sector
Experience in Private Sector
Experience in Agriculture
Unconcerned Informational Personal Management Consequence Collaboration Refocusing
Stages of Concern
All subgroups profiled as positively disposed non-users. Those with experience in
agriculture did indicate a tie for level of concern between Stage 2 (Personal) (Score 70)
and Stage 3 (Management) (Score 69) Concerns.
High and Second High Stage Score analyses were conducted for each of the
subgroups. The results of those analyses were presented in Figures 27 and 28.

99 The analysis showed strong grouping between high Stage 0 and second high Stage 1
concerns. Those with prior public sector background showed slightly higher frequencies
in high score analysis at Stage 5 (Collaboration).
Figure 27: High Stage Score by Work History
0
0.1
0.2
0.3
0.4
0.5
0 1 2 3 4 5 6
Rel
ativ
e Fr
eque
ncy
Stages of Concern
High Stage Score (By Work History)
Only Extension
Experience in Public Sector
Experience in Private Sector
Experience in Agriculture

100 Figure 28: Second High Stage Score by Work History
0
0.1
0.2
0.3
0.4
0.5
0 1 2 3 4 5 6
Rel
ativ
e Fr
eque
ncy
Stages of Concern
Second High Stage Score (By Work History)
Only Extension
Experience in Public Sector
Experience in Private Sector
Experience in Agriculture
ANOVA statistics were used to analyze the subgroups. Based on the SoCQ
profile, a null hypothesis was assumed: There was no statistically significant difference
(at a α of .05) in concerns of Extension educators between subgroups based on work
history. Descriptive statistics and single factor ANOVA analyses were conducted for
each stage of SoCQ concern. The results were presented in Table 16.

101 Table 16: ANOVA Analysis of Respondents by Work History
Stage Statistic Sig F-Stat SigStage 0 .81 .49 .24 .87
Stage 1 .34 .80 .58 .63
Stage 2 .45 .72 .54 .66
Stage 3 1.87 .14 .89 .45
Stage 4 .12 .95 .86 .46
Stage 5 .53 .66 .56 .64
Stage 6 .17 .92 .29 .83
Levene Statistic ANOVA
The Levene’s Test for homogeneity of variance confirmed assumption of
homogeneity between groups were not violated in this analysis. The ANOVA analysis at
α of .05 for did not indicate a statistically significant difference between the subgroups.
Therefore, the null hypothesis (indicating no difference between the concerns by work
history) was accepted.

102
CHAPTER V - CONCLUSIONS, IMPLICATIONS,
AND RECOMMENDATIONS
The purpose of this study was to determine what Extension field faculty concerns
regarding renewable energy programming exist, such that appropriate intervention
strategies for curriculum and professional development could be identified. This chapter
will summarize the findings for each of the research objectives, in addition to generalized
summation and recommendations for further research.
Representative Nature of the Sample
To verify that the sample in this research was representative of the population of
Extension faculty in the respective states, the demographics of the sample were compared
to a 2007 Western Extension Middle Manager’s survey. Human resource offices in MT,
WY, and CO did not regularly compile or report faculty demographics and this survey
was the most current reference including the three states studied in this analysis. The
Middle Manager’s survey (n = 118) reported 64% (n = 76) of respondents were female
and 36% (n = 41) were male, compared to the sample in this research where 57.1% (n =
72) were female and 42.9% (n = 54) were male (Managers, 2007). Distribution of age
ranges was consistent with the findings of the 2007 survey (Managers, 2007). The 2007
survey found that 97% of the respondents had been employed by Extension for five years
or less (Managers, 2007). This would be consistent with the data in this research, as 5
years have passed since the research was collected. Attrition rates have been low since
the economic recession began in 2009. Compared to the 2007 survey, the sample in this

103 research was also consistent with the prior survey in terms of respondent educational
attainment. In 2007, faculty reported 8% (n = 10) PhDs, 76% (n = 89) Master’s Degrees
and 100% (n=118) with educational attainment of at least a Bachelor’s Degree
(Managers, 2007). From the available comparison data, the demographics of faculty
were consistent with the sample demographics and support the conclusion that the sample
was representative of the population.
Understanding the “Nonuser” This research involved Stages of Concern analysis for six groupings of
respondents by: total composite, state, primary job function, time in Extension, age of
faculty member, and prior work history. The analysis not only included SoCQ profiling,
but also High Score and Second High Score evaluation of the data. In all analyses,
respondents demonstrated a dominate Stage 0 score, which indicated non-users.
Research Objective #1 measured the present level of engagement. Respondents
indicated very low levels of engagement in renewable energy programming, with 92% (n
= 116) indicating less than 2% of available FTE hours per annum of any type of energy
programming. The 3% (n = 4) of users that did indicate more than 100 hours per year of
educational involvement in energy exhibited a non-user profile, suggesting that they did
not identify with a larger “programming” initiative. Those users also showed a relatively
high Stage 1 Score, which indicated that despite higher levels of involvement, the users
had not clearly identified how “renewable energy programming” had been defined and/or
applied in educational contexts. The finding that Extension faculty were non-users of
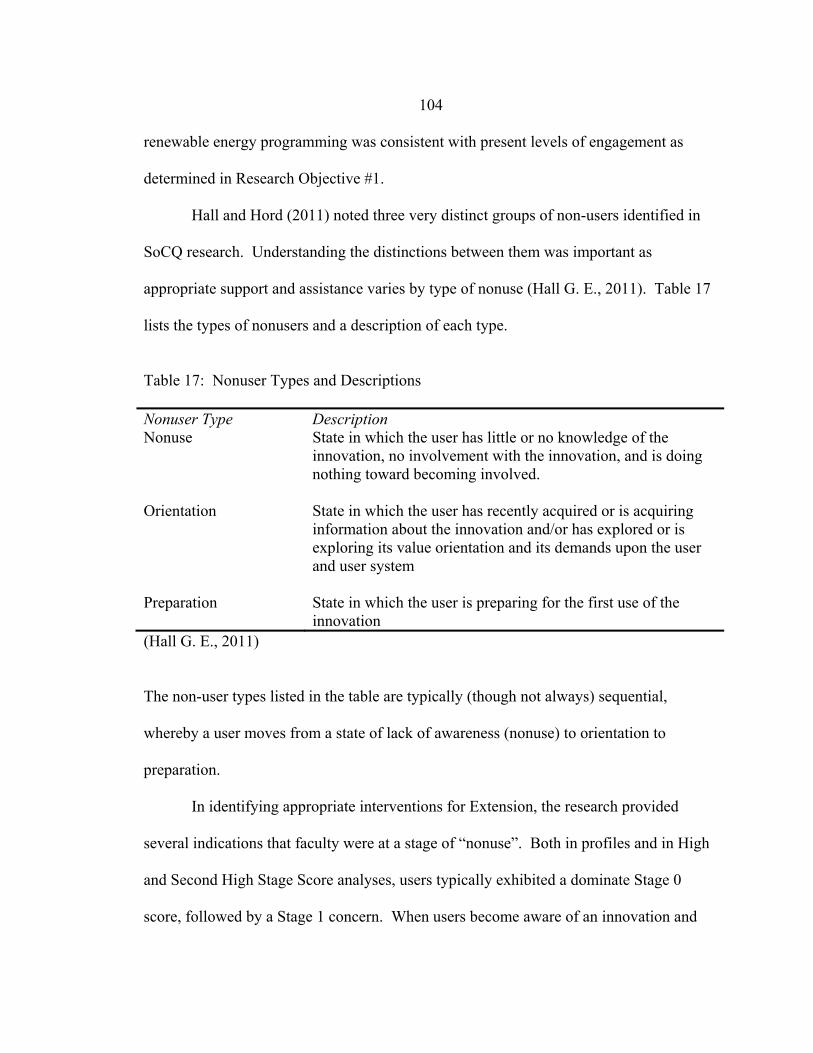
104 renewable energy programming was consistent with present levels of engagement as
determined in Research Objective #1.
Hall and Hord (2011) noted three very distinct groups of non-users identified in
SoCQ research. Understanding the distinctions between them was important as
appropriate support and assistance varies by type of nonuse (Hall G. E., 2011). Table 17
lists the types of nonusers and a description of each type.
Table 17: Nonuser Types and Descriptions Nonuser Type Description Nonuse State in which the user has little or no knowledge of the
innovation, no involvement with the innovation, and is doing nothing toward becoming involved.
Orientation State in which the user has recently acquired or is acquiring
information about the innovation and/or has explored or is exploring its value orientation and its demands upon the user and user system
Preparation State in which the user is preparing for the first use of the
innovation (Hall G. E., 2011)
The non-user types listed in the table are typically (though not always) sequential,
whereby a user moves from a state of lack of awareness (nonuse) to orientation to
preparation.
In identifying appropriate interventions for Extension, the research provided
several indications that faculty were at a stage of “nonuse”. Both in profiles and in High
and Second High Stage Score analyses, users typically exhibited a dominate Stage 0
score, followed by a Stage 1 concern. When users become aware of an innovation and

105 begin to actively seek and evaluate information, the concern profile shifts – Stage 0
concerns are reduced and other stages increase in relative intensity (Hall G. E., 2011).
The SoCQ Profile and subsequent analysis of all respondents showed a Stage 0 relative
intensity percentile of 99% and a Stage 1 relative intensity percentile of 72%, which is a
nearly textbook nonuse profile (George, 2006).
A few notable differences appeared in the nonuse profile within the subgroups.
When comparing SoCQ scores by state, a statistically significant difference in Stage 1
mean value was found between Montana and Wyoming (mean difference of 4.85, Tukey
HSD test = .001 at α = .007) and between Montana and Colorado ((mean difference of
3.32, Tukey HSD test = .026 at α = .007). However, no statistically significant
difference was found between Wyoming and Colorado. This may indicate that educators
in Montana were more disposed toward an “orientation” stage of nonuse than their
Wyoming and Colorado counter-parts. Stage 1 (Informational) concern indicated a
general awareness about an innovation and an interest in learning more details about it.
High Stage 1 concern relative to other stages indicated that a user was interested in the
general characteristics of an innovation, possible effects, and requirements for use, but
did not identify concerns about him/herself with regard to the innovation. It was
important to remember two things about the Stage 1 findings in this research. First,
although Stage 1 was the Second High stage score for most subgroups, the dominant
score remained Stage 0. Second, Stage 1 concern can indicate interest, but does not
necessarily indicate the effort the user is putting forth in obtaining more information.
The Second High Stage 1 score may indicate curiosity and a positively disposed nature of

106 the user group, but does not indicate the extent to which the user has obtained and
considered the information (George, 2006). The profiles in this research may have
indicated only a higher level of curiosity and awareness regarding renewable energy
programming by faculty in Montana. This could be supported by the fact that, while
Montana users did show a slightly higher Stage 2 Concern (70%, versus 63% in Colorado
and 55% in Wyoming), the overall profile is consistent with the other states. If Montana
faculty had moved into an Orientation state of non-use, it could be expected that the
Stage 0 score would be different than the other states and more significant differences in
the other stages of concern (Stages 3-6) would have been apparent.
A second subgroup of interest in addressing the state of nonuse appeared in the
analysis of High and Second High Scores by age. The relative frequency of Stage 0 as
the High Stage Concern was lower for the younger demographics (21-25 and 26-35 year
old groups). The 21-25 year old group was almost evenly dispersed in stage of concern
between Stage 0, Stage 1, Stage 2, and Stage 4. This would suggest a perceived
involvement with the innovation by this user group, however, the Second High Score of
Stage 0 indicated limited awareness. It could be interpreted that this group was positively
disposed to renewable energy programming, and was prepared to be in the Orientation
nonuse stage, but was not aware of a defined innovation or initiative. The 26-35 year old
age group showed a more dispersed concern level at the other stages in both High and
Second High score analysis, which may imply this group perceived involvement with the
innovation. The 56-60 year olds showed a slightly lower High Stage 0 score, but a very
high Stage 1 score for their Second High stage. This group appeared to have a demand
107 for information that was higher than their Stage 0 score – which may imply that they
perceived some level of involvement with the innovation and were moving toward an
Orientation stage of non-use. However, the 56-60 age group also demonstrated a slight
tailing up at Stage 6, which may have indicated resistance to the innovation.
There were three subgroups that identified possible negative disposition to
“renewable energy programming”. Those subgroups were the 56-60 age group, faculty
with primary responsibilities in 4-H, and those employed by Extension for more than 20
years.
A limitation of the SoCQ instrument is that, while it can identify possible negative
disposition to the innovation, it cannot describe the nature of the disposition without
further inquiry. There are two factors that should be considered in respect to the
subgroups that indicated possible negative disposition: First, the SoCQ does not indicate
the level of attitude. Rogers (1971) identified two types of attitudes. They were a) a
specific attitude toward the innovation and b) a general attitude toward change (p. 110).
The nature of the attitude of the negatively disposed subgroups impacted the
implementation strategy. Strategies differed when addressing concerns if the resistance is
topical (specific to renewable energy) versus general concerns. Lippitt, Watson, and
Westley (1958) noted,
One form of resistance that is most likely to occur at the beginning of the change process is a general opposition to any kind of change. Often this grows out of a combination of fear and ignorance…Fear that [they] will be able to change successfully or that, once accomplished, the change will require things of the people which they are unable to deliver. Only the status quo seems safe; any else seems to carry the threat of failure (p. 83-84).

108 The tailing up at Stage 6 may have indicated resistance to renewable energy, but
given the very high Stage 0 score indicating a lack of knowledge about the topic,
it was likely that the resistance from these subgroups was the more general
opposition to change as it was a fairly common resistance force.
Second, it was important to remember that a favorable or unfavorable
attitude did not always lead to adoption or rejection of an innovation (Rogers,
2003). As people moved from nonuse to orientation and preparation stages,
there were many opportunities for an individual to develop or change an
attitudinal position. While the initial SoCQ indicated possible negative
disposition in these three subgroups, there were many points in the introduction
and management of the change process where the attitudes could be positively
influenced (Rogers, 2003). This means that those negatively disposed out the
outset of change may be persuaded to adopt an innovation. Conversely, those
positively disposed may become negative toward the innovation as they learn
more or experience stress and anxiety in the change process. Further research is
required to understand the nuances and extent of the negative disposition
indicated by an uptick at Stage 6 in these SoCQ profiles. Those seeking to
implement programming or training for faculty in those groups may wish to
further explore the findings so that the implementation strategies can be
appropriately crafted. However, all implementation strategies need to consider
that attitudinal positions can and will shift. Appropriate change management is
essential for all involved, not just these specific subgroups.

109
The majority of the users profiled as positively-disposed non-users at the nonuse
stage. The intervention recommendations for this stage will be further considered in this
report.
Implications of Finding for Each Subgroup
The following section summarizes the findings for each subgroup analyzed in
Chapter 4. While interesting elements of the data analysis were considered in this
section, it is important to remember that the very high (99%) relative intensity of Stage 0
concern may negate the importance of other concerns (George, 2006). Interventions may
consider the findings of this research in addressing the non-Stage 0 concerns, but they
should not be the primary focus of intervention implementation. Because the profiles are
so similar, only unique findings for each subgroup are discussed in this section.
Total Respondents
As has been discussed, the total respondent profile revealed that faculty are non-
users at the nonuse stage. The concerns were highly focused on “self”, or concerns
related to the implications of implementation on the user. This is expected in a non-user
profile. As implementation begins, task concerns tend to increase while self-concerns
decrease (Hall G. E., 2011). This profile did show a very close Stage 2 (Personal) (63%)
and Stage 3 (Management) (60%) concern. These scores imply that users were
concerned about how this innovation would affect them and how they might need to
balance this innovation in the context of existing obligations – even before they were
aware of what the innovation entailed. This is not atypical of SoCQ nonuser profile, but
110 these concerns should be recognized and addressed by defining the expectations of
faculty in the development of curriculum and training.
Rogers (2003) offered a means of addressing these Stage 2 and Stage 3 concerns
in recognizing that “the compatibility of an innovation, as perceived by members of a
social system, is positively related to its rate of adoption” (p. 247). In the case of
renewable energy programming, curriculum and training strategies that emphasized the
ways in which programming and personnel expectations are compatible with existing
efforts of field faculty were likely to help reduce the anxiety associated with adoption.
For example, if renewable energy programming were introduced as an entirely new
curriculum where faculty were expected to add hundreds of hours of effort without
compromising existing work, faculty would like respond with higher Stage 2 and Stage 3
concerns. Conversely, were faculty presented with strategies that allow individuals to
begin teaching energy concepts as part of existing programming efforts and introduction
of the innovation articulated that adding smaller increments of programming would help
them professionally (by being recognized as an adopter by administration and by meeting
relevant needs in their communities), faculty could more likely to find “compatibility” of
the innovation with existing expectations.
Respondent Concerns by State
The findings of the state subgroups have already been discussed. Despite
statistically significant mean scores at Stage 1 between Montana and the other two states,
the overall profile was very similar. Montana faculty had been slightly more inclined
toward seeking information, but because the Stage 0 and other concerns mirrored

111 Wyoming and Colorado, they should be treated similarly in terms of training and
curriculum development.
Respondent Concerns by Primary Job Function
Respondents classified as having their primary job function in 4-H showed a tie in
relative frequency of Stage 1, Stage 2, and Stage 3 Concerns. These scores reflected
concentration of concerns on issues of “self” and “task”. The 4-H group also showed an
uptick at Stage 6, indicating resistance to the innovation. According to George (2006),
the tailing up tended to imply that the group has strong ideas about how to do things
differently. These ideas may have been positive, but were more likely to be negative
toward the innovation (p. 54). The relatively high intensity of Stage 1-3 may have
implied frustration with Personal or Management concerns that were perceived not to
have been resolved, as well as ideas about how the situation should be changed (p. 54).
Interpretation of these scores could not be definitively concluded without further
qualitative research to ensure accurate interpretation of the data.
Interventions with the 4-H faculty may benefit from interview research with
members of this group to better assess and understand their concerns. It was interesting
to note that the only known standardized Extension curricula on renewable energy was
the National 4-H Wind Project curriculum. Further research should assess whether the
reactions of the 4-H group were related to this curriculum effort, or to the overall topic of
renewable energy programming. Interview research should examine whether the
concerns at Stages 1-3 were specific to renewable energy programming, or if this

112 subgroup were overwhelmed by other matters and is resistant to any perceived change as
described by Lippit, Watson and Westly (1958).
The other subgroup differing in profile from the general non-user profile was the
Community and Economic Development (CD/ED) group. This group showed a tied
High Stage Score at Stage 0 and Stage 5. Users with this profile showed a desire to know
what others were doing, but limited interest in leading the collaboration (George, 2006).
Further research was necessary to understand the nature of this split. The profile could
have resulted from the nature of community development work being typically more
collaborative than other disciplines. Perhaps personnel with those responsibilities seek
collaboration when they lack information. Stage 0 concern also indicated the individual
views the innovation as an important part of their work. A lower Stage 0 score indicated
that the innovation was very important to the individual (George, 2006). Therefore, it
may also be interpreted from the Stage 0 concern that this subgroup felt involvement in
renewable energy education should be part of their work, but because they lacked
awareness of existing resources sought collaboration to address the need. Interview
research should be used to gain insights as to the actual nature of this split.
Respondent Concerns by Time in Extension
Those employed with Extension from 6 to 10 years showed a much higher Stage 3
(Management) concern than did the other groups. This implied the group had concerns
about logistics, time, and management. Management concern could also have reflected
concern over teaching the content. Further research should assess the nature of the higher
Stage 3 concern in this group.

113
The Over 20 years of employment group indicated a slight uptick in Stage 6. This
should be investigated further for those looking to implement renewable energy
programming change in this demographic.
The research on the Time in Extension subgroup revealed interesting information
about the maturity of Extension professionals on the topic of renewable energy
programming. In 1969, Francis Fuller developed a model that described how, with
increasing experience, educators moved through four levels of concern: unrelated, self,
task and impact. This model was an important foundation in the creation of the Stages of
Concern constructs. Described by Hall and Hord (2011), Fuller’s research indicated that
educators begin with unrelated concerns – those not specific to teaching, and progress to
concerns of “self”, with an egocentric frame of reference in terms of what the teaching
will be like for “me” and whether “I” can succeed - to concerns of tasks. Task concerns
are those related to teaching, but focused on managing the workload and performance-
related issues. As experience increases, teachers become focused on impact – where the
focus is on what can be done to enhance the learning experience for students and what
can be done to improve the teacher’s performance (Hall and Hord, 2011, p. 69-70).
When a new change is introduced, this process is repeated with the educator again
beginning to focus on self-concerns before progressing to task and impact concerns. In
contrast, curriculum changes that are perceived by the educator to be consistent with
existing work may show profiles concentrated on impact – the change is seen as one that
can be integrated into the existing teaching effort.
114
The SoCQ profiles of faculty by time in Extension illustrated that renewable
energy programming was a new change in that even experienced educators showed
strong self-concerns (Stages 0-2) and only those in the 6-10 year group showing higher
relative Task (Stage 3) concerns. The data provided two implications for those seeking to
achieve implementation of renewable energy programming in Extension: 1) it cannot be
assumed that experienced educators will bypass the concerns process and move directly
to consideration of impact. All Extension professionals in this sample illustrate a need to
move through the process of unrelated, to self, to task to impact concerns, and 2) initial
training and programming will need to address the “self” concerns by being empathetic to
the intensity of these concerns and then making efforts to resolve them.
When considering implementation strategies for Extension in renewable energy
education, this process of moving from unrelated to self to impact may be addressed by
allowing faculty to move through the Perceived Attributes of Innovations as defined by
Rogers (2003) (p. 16). The Perceived Attributes were:
1. Relative Advantage – faculty need articulation of the relative advantage of
adopting renewable energy programming. Advantages may be meeting
relevant constituent needs, adding programming that is new to Extension and
likely not being offered in their area (strategic differentiation), positive
performance evaluations, opportunities to take a leadership role in creating
programming in a new (to Extension) subject matter. Identifying adoption as
a means of accomplishing a greater purpose may help faculty move beyond
“self” and “task”.

115
2. Compatibility – to reduce concerns of “self” and “task”, faculty can be
provided with opportunities to incorporate renewable energy programming in
existing efforts. An example of how this might be accomplished could be
providing an agricultural educator with a 15 or 20-minute program on solar
fencing alternatives that the educator could incorporate into a range tour.
Using this example, the educator is able to add new content and enrich an
existing program, without needing to fully adopt all elements of renewable
energy programming.
3. Complexity – The extent to which renewable energy is perceived as complex
and hard to understand will influence rates of adoption. These concerns will
be concerns of self (How will I understand this? What happens if I fail? What
if I give inaccurate information? Etc.) and concerns of task (How will I find
time to learn all of this information? How will I add all of this work to my
existing responsibilities? Etc.) Therefore, curricula that make it easy for
faculty to both understand and teach relevant concepts in renewable energy
are more likely to be adopted. Extension administration or specialists may
need to provide tiers of curriculum where faculty can opt to engage at a lower
level of complexity, but may also opt to increase knowledge and provide
programming at a higher level of complexity.
4. Triablity – Rogers defines triablity as the extent to which the innovation can
be “tried” prior to adoption (p. 16). In the case of renewable energy,
programming options that allow faculty members to try lower risk
116
implementation (perhaps a 15-30 minute programming) may address this
concern. Methods for incorporating energy education in existing
programming may also allow faculty to “try” energy programming without
having to commit to an educational series or a more typical (in Extension) 60-
90 minute programming format where technical expertise is more likely
expected of the educator.
5. Observability – The extent to which the results of adaptors of the innovation
can be observed by others will influence rates of adoption. In the case of
renewable energy, observability can be integrated both in terms of educators
sharing impacts, results and efforts with one another; and though the
development of double-loop communication strategies, whereby continuous
improvement mental modes create a cultural expectation of adoption (Lezotte,
2002). Simple methods of observability can be webinars hosted by those who
have implemented renewable energy programming, listserve communications
where individuals can share experiences and impacts, share sessions at
conferences, social media share groups, or quarterly conference calls for
exchanging successes, frustrations, and other experiences. While more
sophisticated communication strategies are possible, these suggestions could
easily implement with limited fiscal support.
Moving faculty from concerns of self and task to impact will require developing
curriculum and training initiatives that allow these perceived attributes to be tested and
considered by faculty.

117 Respondent Concerns by Age of Faculty Member
Some of the dynamics of age have been discussed previously, but the data
revealed that self concerns (Stages 0-2) were much higher in those aged 21-25 than the
other groups. The group most closely aligned with the 21-25 group was those aged 46 to
50 years old. Those ‘Over 61’ showed lesser concern at each stage than did the other
ages and the group was statistically different from the 21 to 25 year old group at Stage 3.
Although the 21-25 year olds showed relatively higher concerns at all stages and the Over
61 group showed decidedly less concern at all stages, analysis of the groups from age 26
to age 61 showed varied level of concern between the groups and showed that the
concern level was not directly related to age.
Respondent Concerns by Work History
The question of work history was posed to establish whether concerns varied
according to professional background. Would those from a private sector or agricultural
background show a different profile than those always employed by Extension? The
analysis revealed no differences in concern profiles based on work history.
Analysis of Findings Relative to the Principles of Change
The majority of the subgroups in the research were positively disposed nonusers
and all respondents were at the nonuse stage. Therefore, this research was best discussed
in the context of implementing change and moving faculty into use of the innovation of
“renewable energy programming”. Hall and Hord (2011) and those involved with the

118 research of change (from RDCTE in the 1970s to present) have identified the patterns
that occur in the change process as basic principles, which “are no longer debatable
points, for they summarize the predictable aspects of change” (p. 5) Therefore, consider
the research data for each of the Principles of Change:
Change Principle 1: Change is Learning
To achieve improvement, unsuccessful practices must be changed which requires
learning. Change research found that stating a behavior change is required will not be
successful unless those implementing the change are able to engage in learning (Hall G.
E., 2011). Hall and Hord (2011) provide two examples of the need for learning. A very
simple example is a man who decides that rather than walk, he will get to a distant
location using a bicycle. Deciding to use a bicycle does not make him competent or
skillful in accomplishing the task. However, once he learns to ride, he is able to use the
bicycle proficiently in going to multiple locations. As another example, a teacher is
required to implement a new inquiry-oriented math curriculum. The “teacher proof”
teaching directions work when students respond to lessons with the correct answers and
understanding, but when students deviate from the script, the teacher is unable to adapt
and apply the curriculum to meet the class needs. Only after the teacher learns the
practices is she able to apply them and improve the learning of students (Hall G. E.,
2011). The learning process will also apply to Extension educators on the topic of
renewable energy programming.
Extension faces two challenges in addressing this change principle. First, the
High Stage 0 score across all subgroups established the need for faculty to learn the

119 innovation. This will require Extension to define “renewable energy programming” and
to define the expectation for faculty. How is successful implementation defined? What
materials, curriculum and supporting resources are available in implementation? The
most telling information from the research that indicates “renewable energy
programming” has not been defined is provided by the 3% of respondents involved in
more than 100 hours of energy education per year. Despite significantly more
involvement in energy education than their Extension counterparts, this group was
consistent with other faculty in terms of a 99% relative intensity of Stage 0 concern –
meaning the group did not identify with a defined “renewable energy programming”
innovation.
The second challenge in addressing this change principle lied in faculty learning
“renewable energy” in general. Extension faculty primary responsibilities were typically
in the categories identified in this research (agriculture and natural resources, family and
consumer sciences, 4-H, and community and economic development). Given the primary
responsibilities of faculty and the current low levels of energy programming involvement
identified in this research, it should not be assumed that faculty have background in
energy, or more specifically in renewable energy. Forston (2006) summarized the
complexity of learning renewables as, “There is no simple track for learning the
renewable energy ropes. Nor is there a one-size-fits all option that will work…There are
countless variables to consider when learning about the viability of renewables” (p. 2).
Research should be conducted to assess actual levels of knowledge and skill in energy,
however, it is likely that faculty will need to learn renewable energy (terms, technologies,

120 calculations, etc.) to effectively implement education - in addition to learning the
renewable energy programming curricula. Using the analogy of the math teacher from
above, this means that the teacher not only needs to learn the new curriculum, she needs
first to learn math. This is an incrementally more difficult task that than simply
introducing a new curriculum.
The creation of expertise in the majority of Extension faculty members on
multiple renewable technologies (wind, solar photovoltaic, solar hot water, geothermal,
micro hydropower, etc.) in the near term is unrealistic. This level of learning requires
significant fiscal and time investment. Extension administration may identify one
individual per technology or a “renewable energy specialist” who can address technical
complexity of many systems, but the majority of faculty will require means of
engagement that does not require extensive technical knowledge and experience at the
start. As an example, teaching “all” of small wind may not be realistic for a faculty
member new to energy, but key concepts can be broken out that allow faculty to begin
teaching elements of small wind with confidence that they are teaching from quality non-
biased, research based curriculum resources. As faculty gain experience and confidence,
additional technical knowledge and complexity can be introduced. In other words,
Extension must find ways to make the complex simple and teachable for faculty in order
for them to begin adopting the innovation.
Extension administration must determine the extent to which field faculty will be
expected to learn and teach renewable energy. The level of investment required to
provide technical competence and depth in renewable energy in field faculty who do not

121 have energy background is extensive. This is especially true for states where the land-
grant university has eliminated mechanical arts outreach and education functions, such as
Extension agricultural engineering.
For new faculty, Extension administration might consider whether pre-service
course work or field experience in energy is required. If so, coordination with colleges
preparing future Extension personnel might be required to ensure course offerings in
energy.
Change Principle 2: Change is a Process, Not an Event
Change research has established that change is not accomplished by an
announcement that change will occur or through a one-time event or training. Note Hall
and Hord (2011), successful change implementers, “allow at least three to five years of
implementation and budget the resources needed to support formal learning and on-site
coaching for the duration of this [learning] phase” (p. 8). This change principle explains
why, despite years of Extension administration stating a desire for faculty to engage in
renewable energy programming as evidenced in the literature review, field faculty remain
at a 99% relative intensity at Stage 0 concern. For faculty to become engaged, the
expectations must be specifically defined, the learning process must begin, and the
process must be continually reinforced and supported until change has been adopted.
Lippitt, Watson, and Westly (1958) established a process for planned change
appropriate for addressing Extension adoption of renewable energy programming. The
phases of planned change are Phase I: Development of a Need for Change, Phase II:
Establishment of a Change Relationship, Phase III: Clarification of the Problem, Phase

122 IV: Establishing Goals and Intentions of Action, Phase V: Transformation of Intentions
into Actual Change Efforts, and Phase VI: Generalization of Change (p. 131-142). These
phases were included in the foundations of RCDTE work, but discussing them in the
context of Extension provides possible action steps for beginning the change process.
The first phase could be summarized as problem awareness, where the need for
change is recognized and clarified. Lippitt, Watson, and Westly note, “problem
awareness is not automatically translated into a desire for change” (p. 131). In the case of
Extension, this may be especially relevant. Extension has demonstrated (as evidenced in
the literature review) an awareness of the demand for renewable energy education.
However, the organization has fallen short of succinctly defining what elements of
renewable energy are to be addressed by Extension and clarifying expectations for
faculty. A tangible step for each Extension state might be to define the problem and
articulate the desired level of change. Extension should consider, for example, that
renewable energy is a multi-faceted topic including: commercial wind and solar
development and associated high voltage transmission line construction, small home,
farm and ranch applications, community-scale projects, and public policy. Extension is
not likely to create expertise in all of these areas immediately. Defining an area of focus
and establishing curriculum resources in that area may be an important first step in
defining the problem.
Phase II involves the establishment of relationship. The establishment of a
relationship in the change process is defined by Lippet, Watson and Wesley (1958) as the
relationship of the members of the organization with a “change facilitator” – the
123 individual responsible for implementing the change (p. 133). For Extension, this requires
that an individual in each state be tasked with training field faculty in the implementation
of renewable energy programming. Montana, Wyoming, and Colorado have each
created positions to address Extension energy (a coordinator in Wyoming, a specialist in
Colorado, and an associate specialist in Montana). This is an important step in the
process. States might consider whether expectations for those positions are explicit terms
of the involvement of field faculty. As with all specialist positions in Extension, it is
possible for materials and programming to be delivered from specialists to consumers,
without engagement of field faculty. The specialist-to-consumer model does accomplish
some level of energy outreach, but as discussed in the literature review, those evaluating
Extension as a whole may not perceive Extension to have an energy presence if field
faculty are not involved in outreach efforts. While it is not essential that the state energy
professional be the change facilitator in Extension, it may be logical given existing
investment in those positions.
Lippet, Watson, and Westly (1958) define the third phase as clarifying the
problem (p. 138). This may seem redundant to the first phase, but in practice is very
different. In Phase I, the organization is considering the need and desire to change. The
third phase requires clearly establishing what changes will be required, assessing the
organizational needs and desires, and collecting information about the change process.
The SoCQ assessment can be used in data collection. The SoCQ analysis in this research
indicates that change facilitators will not only need to overcome Stage 0 (Unconcerned),
but also need to address Stage 1 (Informational) Concerns. As faculty work to move

124 from a nonuse to an orientation state, they will seek information (Hall G. E., 2011). The
informational stage will not only involve understanding the content faculty will be
expected to teach, but also the expectations associated with implementation: How many
hours are faculty expected to teach? How will faculty performance be evaluated? What
are the benefits/consequences of adopting/not adopting the innovation? The Extension
change facilitator must be prepared to provide both content and information on the
implications for faculty. The change agent must also acknowledge and address Stage 2-3
Concerns – As faculty move from the orientation state to the preparation state, they will
seek information, support, and reassurance with regard to Personal (Stage 2) and
Management (Stage 3) concerns. Extension must be prepared to address these concerns
and offer support to faculty. A possible example of implementation strategies that
address these concerns might again involve programming that is easy to implement with
existing efforts (e.g. - an FCS agent learns how to include energy education as part of
food safety preservation programming). A second possible strategy may be incremental
increases in energy programming. Rather than expect that the majority of Extension
faculty move from less than 20 hours per year of education to over 100, perhaps an
expectation is that faculty complete one programming effort in the first year, where the
first effort might be only 15 minutes of presenting or a series of articles in the local
newspaper. This also addresses the element of triablity described by Rogers (Rogers,
2003).
The fourth phase is the establishment of goals and intentions of actions. At this
point in the process the change facilitator becomes a less critical player and the change

125 process is pervasive throughout the organization. It is here that the support and
articulation of goals and intensions from Extension administration is critical. This and
the remaining phases (transforming into actual change efforts and the generalization of
change) are essential to successful change implementation. However, the strategies used
in these phases depend upon the earlier phases, so they will not be discussed in detail
here. Extension must be aware that many phases of the change process exist and will
need to be fostered and supported for several years in order for the desired change to take
place.
Change Principle 3: The Local Organization is the Primary Unit for Change
Even though external organizations may encourage and even require renewable
energy programming from Extension, the key organization for making change is the local
organization. In the case of a campus or school, this unit is the localized leadership unit.
In Extension, this unit is the state Extension office. Hall and Hord (2011) assert that even
though the state is part of county, regional and federal systems, “the [state] staff and
leaders will make or break any change effort, regardless of whether it is initiated from
inside or outside” the organization (p. 9). It is the responsibility of the local leadership
organization to establish the expectations for change and to seek appropriate external
resources to support the change effort.
In Extension engagement in renewable energy, this leadership will mean both
defining “renewable energy programming” and providing the learning, support, and
resources for effective implementation. It will also require appointing a change
facilitator tasked with implementation.

126 Change Principle 4: Organizations Adopt Change – Individuals Implement Change
This principle reveals its importance when considering the historical context of
Extension in renewable energy education presented in the literature review when
compared to the levels of adoption found in the research. Extension administration and
funders have articulated a desire for Extension to engage in energy programming for
decades. However, the majority (92%) of faculty invest less than 20 hours per year in
energy outreach and score 99% relative intensity at Stage 0 (Unconcerned) in group
analysis. The data illustrates that Extension must address change at the individual level in
order for renewable energy education to be implemented. While not all interventions can
be addressed on an individual basis, the patterns of transition through the concern process
should be anticipated and addressed as change is implemented. Many changes should be
targeted to subgroups, and many others directed at the organization as a whole, while
retaining emphasis on the individual elements of change (Hall G. E., 2011, p. 10). The
support of individuals in Extension can be more difficult than on a traditional campus as
faculty are geographically dispersed. The support of individuals will need to be
cognitively considered as intervention strategies are developed.
Change Principle 5: Interventions are the Key to the Success of the Change Process
The various actions, events, and activities that can influence the adoption process
are known as interventions. While trainings and workshops are the most obvious type of
intervention, Hall and Hord (2011) caution that to be effective, trainings and workshops
need to be supplemented with other interventions. Short, intense, and applicable
127 interventions can be highly effective in helping faculty to engage in the change process
(p. 12). Hall and Hord (2011) suggest appropriate interventions at the state of nonuse
might include:
Acknowledge that little concern about the innovation is legitimate and okay.
Share some general information about the innovation in hopes of arousing some interest in it.
Suggest and describe how the innovation might be related to an area that the person(s) is concerned about.
Decree that the use of the innovation is required. Encourage the person(s) to talk with others who are interested
in or using the innovation (p. 299) Conversely, inappropriate interventions are:
Communicating the lack of concern to others, thereby discouraging their interest.
Continuing to accept/tolerate the lack of concern while others are engaged (p. 299)
Given that Extension faculty are non-users at the nonuse stage, the interventions
suggested by Hall and Hord are appropriate.
Intervention strategies will shift as faculty become more aware of the innovation.
For example, appropriate interventions change as users move from nonuse (Stage 0) to
informational (Stage 1). At Stage 1, Hall and Hord (2011) suggest that interventions
provide general descriptive information and that interventions are spread over time and
provided in a variety of mediums and contexts. Appropriate interventions at this stage
are:
Share general descriptive information about the innovation through short “elevator speeches”, email, brochures, short media presentations, and staff meetings.

128
Provide information contrasting what the individual is presently doing with potential advantages of use of the innovation.
Express enthusiasm for consideration of the innovation. Hear from others who are excited about what they are doing
with innovation. State realistic expectations about the benefits, costs and effort
needed to use the innovation (p. 299-300).
Intervention strategies continue to evolve as high stage concerns evolve. In general, the
interventions shift from being very specific about what is to be adopted to a more
collaborative approach where modifications and adaptations of the innovation are
encouraged.
In Extension renewable energy programming, the types of interventions should be
phased to address changing needs as levels of adoption increase. Initially, the change
facilitator for each state will need to develop short and longer-term strategies for
supporting change. Hord et al (1987) (p. 76-78) suggest strategic planning for
intervention might include the following:
Develop and Support Organizational Arrangements – this intervention work will
include developing and preparing all of the necessary elements for educators
before implementation can begin. This will include providing for curriculum,
materials, guidelines, regulations, policies, funding, equipment and all other items
that create structure and provide for the management of the change process.
Funding is typically a constraint that needs to be considered and addressed prior
to implementation. Extension change facilitators will need to consider the support
and resources necessary to address individual needs once the change process is
initiated.
129
Training: no matter how appealing or in-depth materials may be, “with most
innovations, teachers need training to clearly understand how to use them” (p.
76). In Extension, the training plan will need to include a mix of methods that
teach specific technologies and technical knowledge, as well as instruction on the
materials faculty are to use in teaching the concepts. It is not likely that a one-
time intensive training will accomplish this objective. As described in the Stage 1
appropriate interventions, it is likely that Extension will need to begin by defining
a curriculum or set of materials that faculty are expected to teach. This may be a
significant issue for states that do not have curriculum resources, as they must
first develop a standardized set of materials. From that point, a multitude of short
interventions will be necessary. This may mean an initial 3-4 hour training
describing why Extension is adopting renewable energy programming, followed
by an overview of the curriculum. This initial training accomplishes two
objectives. The first is to orientate faculty to the materials. Second, it provides
initial awareness of both an expectation to teach renewable energy and an
awareness of a defined “programming” resource. Subsequent interventions may
include webinars on specific topics related to teaching the materials in the
curriculum. More in-depth technical sessions (either in-person workshops or
webinars) specific to each technology can serve to enhance specific subject matter
knowledge. The change facilitator might also partner with field faculty to
demonstrate the curriculum in public workshops whereby the local educator
coordinates an energy event and the change facilitator teaches the workshop using

130
the curriculum. The local educator might be invited to co-teach the program.
Repeated small interventions will likely be necessary and the interventions will
vary by state.
Consultation and Reinforcement: These interventions are less formal and more
personalized to individual needs and are usually a follow up to more formal
training (p. 76) In Extension, this may mean the change agent identifies
individuals who are trying to implement energy education and works with them to
craft programming specific to their local needs. It may involve recruiting expert
speakers who can support programming efforts on specific topics or providing
resources unique to the community.
Monitoring: Monitoring is important in ensuring successful improvement efforts
and in helping faculty recognize that their implementation and improvement is a
priority. For Extension, monitoring should involve using standardized
evaluations so that faculty performance and programmatic impacts can be
consistently assessed following programming efforts. These evaluations are also
critical in reporting effort and impact to funders of Extension. Monitoring also
enables the change facilitator to track adoption and to identify subgroups resisting
implementation.
External Communication: The change agent will need to support implementation
efforts by informing others (the public, funders, administration, etc.) of successful
implementation and impact. This not only increases awareness and support for
Extension, but also helps to create a cultural expectation of adoption.

131
Dissemination: These actions involve the change facilitator broadcasting
information about the best practices to encourage others to adopt the innovation.
As Extension in Montana, Colorado and Wyoming are currently at the non-use
state and will likely move to the informational stage, examples of successful
implementation may help others to understand how to apply renewable energy
programming in their own work. To start, these examples might be very simple,
but show an improvement in engagement.
The change facilitator in each state will need to monitor faculty as they progress through
the various stages and adapt intervention strategies accordingly. For example, when
faculty begin expressing Stage 2 concerns, interactions with faculty might involve more
empathic interventions addressing their personal concerns (Hall G. E., 2011). At Stage 3,
the interventions should shift to more “how to do it” recommendations and interventions
(Hall G. E., 2011).
Change Principle 6: Appropriate Interventions Reduce Resistance to Change
Change research suggests that when concerns are correctly identified and
addressed proactively, resistance is typically mitigated. The SoCQ research is helpful in
addressing this change principle in the following ways:
The research shows that faculty do not have concerns about the concept of
teaching renewable energy. Unlike the example of sustainable agriculture
where faculty were found to have predisposed bias against the topic, the
SoCQ profiles did not indicate this to be the case in renewable energy – at the

132
current level of understanding (which is low) about the topic. If faculty were
resistant to renewable energy or perceived that the topic would have negative
impact on constituents, high Stage 4 and Stage 6 concerns would likely have
appeared in the profiles. There were some subgroups with upticks at Stage 6
and further research should be done in those subgroups to determine the
nature of their resistance, but the majority of faculty were positively disposed
to renewable energy programming. Therefore, implementers of renewable
energy programming change need not spend excessive time working to
address resistance to the subject on matters of principle. Provided that
Extension remains dedicated to providing non-biased, research based
information, this concern does not appear to be a primary issue.
It could be presupposed that the failure of Extension to become engaged with
renewable energy is a result of over-tasked employees – faculty too busy and
too overwhelmed to consider a new programming effort. The SoCQ analysis
identified that the failure of Extension to engage in renewable energy
programming is more likely linked to a lack of clear understanding of what
Extension expects in “renewable energy programming”. There was also an
identified lack of information, both about the content to be taught and the
expectations of faculty. While Stage 2 (Personal) and Stage 3 (Management)
concerns will need to be addressed as implementation efforts proceed the
primary concern of faculty at present is in understanding what and how
renewable energy programming is to be implemented.
133
Calabrese’s (1982) problem identification matrix (PIM) is based on the concept
that in order to address a problem, we must first define it correctly. The SoCQ research
has defined that the initial problem lies in the lack of awareness and information. These
issues need to be addressed by the specified change facilitator in each state for
implementation to begin. It is important for Extension to note that as implementation
begins, additional research will be required. Faculty concerns will change as their
understanding of the innovation increases. This research can be done using subsequent
SoCQ analyses which will help the change facilitator recognize when faculty have moved
from one stage to another. However, two other tools are provided in change research that
may also be considered: the Innovation Configuration and Levels of Use instruments,
which are designed to assess concerns and implementation barriers after the change
process has been initiated (Hall G. , 2003).
In the initial stages of change implementation, reducing resistance to change is
important. The change facilitator needs to respect and understand divergent opinions, but
the high levels of non-use indicate that faculty must first understand what is being
required and how they might use the innovation. For the leadership of the change
facilitator to be credible, however, Fullan argues, “Leaders should have good ideas and
present them well (with the authoritative element) while at the same time seeking and
listening to doubters (aspects of democratic leadership). They must try to build good
relationships to be effective (be affilitative) even with those who may not trust them.” (
(Fullan, 2007, p. 42). For the change facilitator, being alert to differences of opinion is
vital. The change facilitator must manage the change and ensure double-loop
134 communication early in the process. In other words, while prior planning and accurate
assessment of the appropriate interventions may reduce conflict, conflict is not something
that should be avoided or eliminated as implementation begins. Instilling the attributes of
a learning organization described by Rowe (2010) will require that diversity of opinion
focused on improvement of Extension be allowed and encouraged.
Change Principle 7: Administrator Leadership is Essential to Long-Term Change Success
Hall and Hord (2011) report,
A central theme of advocates of bottom-up changes is that those nearest the action have the best ideas of how to accomplish change. Many implementers believe that they do not need any involvement from or with those above them. But here again, the findings of research and experience argue for a different conclusion (p. 13).
Change research has found that unless organizational administration supports and
legitimizes change, it will be short lived. Even those bottom-up efforts that seemed to
have great energy and faculty buy-in were discarded when the change initiators either
opted to limit their involvement or left the organization (Hall G. E., 2011). For change to
become ingrained in Extension, leadership in Extension will need to legitimize renewable
energy programming, support the efforts of those tasked with implementation, and find
resources to encourage the continued use of the innovation. Montana, Colorado, and
Wyoming have all taken an important first step by identifying an energy specialist, which
demonstrates a commitment to renewable energy outreach. Each state should determine
the extent to which field faculty involvement is expected and should determine whether
the energy specialist is also the designated change facilitator for field faculty
engagement. Field faulty need to be made aware of administration’s expectations for

135 their involvement and need to know that administration has endorsed a change facilitator.
The administration’s support of and encouragement to participate in trainings will help to
reinforce the implementation strategies of the change facilitator. To the extent that it is
appropriate, Extension administration might also consider how performance evaluations
or less formal recognitions can be used to reward field faculty engagement in renewable
energy programming.
There are many elements of renewable energy education implementation that will
require Extension administration involvement in order for long-term success to be
achieved. Examples include:
Identify expertise and resources that are available to Extension specialists and
field faculty. As an example, if a state no longer has an agricultural engineering
program, identify resources that could be made available to support renewable
energy education for agricultural operations. Could a relationship be formally
created with a college of engineering within that state’s university? Could a
relationship be formally created with another land grant university? Extension
field faculty success will hinge upon the quality and availability of resources
available to support programming implementation.
Recognize that even highly competent Extension specialists will require
supplemental research-base and resources to effectively implement training across
multiple technologies. Renewable energy is a multi-faceted topic, as is a more
traditional Extension subject, like agriculture. Extension readily accepts that a
beef nutrition expert may not have extensive background in forage management,
136
even though the topics are related. Much the same, an expert in solar energy may
have a working knowledge of wind energy, but may not be prepared to teach and
support field faculty at an equal level on both topics. Clear expectations of
performance and well-defined scopes of work for specialists will be needed to set
direction and to ensure that field faculty needs are met.
Define levels of competence and essential understandings that are expected of
faculty. This consideration should include both expectations for existing faculty
and expectations for new employees. Are all employees expected to teach
energy? If not, who might be assigned the task? Will position descriptions,
position announcements, and performance evaluations included energy? These
considerations may involve discussions with energy specialists, but typically fall
outside the scope of responsibility of an energy specialist.
Determine the level of faculty engagement and social engagement that is
considered appropriate with regard to NIFA reporting requirements. Ensure that
energy specialists are aware of these standards and have adequate resources to
achieve those measures.
Change Principle 8: Facilitating Change is a Team Effort
Change research argues that the entire organization needs to be engaged for
change to take effect. Leadership, program implementers, administrators, educators, and
support staff need to all be aware of the change and begin taking steps toward

137 implementation. In Extension, this principle becomes both very important and very
difficult.
The team effort is important in implementing renewable energy for several
reasons. First, research shows that unless the entire organization is aware of and
participating in the change it will not be successful. Second, it is unlikely that Extension
will be able to create energy-specific field faculty positions given current budget
constraints. This means that energy will need to be integrated into existing teaching
efforts. Therefore, the efforts to incorporate renewable energy will need to involve those
in all disciplines (agriculture, 4_H, FCS, CD/ED, etc.) for it to be pervasively included in
outreach. Third, because of the geographically dispersed nature of Extension offices,
support of the individual and consistency in encouraging change can only be achieved if
all players are involved.
In regard to including renewable energy programming in each discipline,
Extension change facilitators might consider Rogers’ (2003) discussion of the use of
Opinion Leaders – those who can informally influence other individual’s behavior (p.
362) in each of the disciplines. For example, the change facilitator might identify a field
faculty member in agriculture who is an opinion leader for other agricultural field faculty.
The change facilitator might work with that opinion leader to design a program or
outreach effort that is beneficial for the opinion leader, but uses the innovation. The
involvement of the opinion leader with the innovation is likely to encourage other
agricultural faculty members to become involved.

138
Change facilitators might also seek to understand the existing communication
networks of field faculty. Rogers (2003) defines these networks as “interconnected
individuals who are linked by patterned flows of information” (p. 363). Individuals may
determine their adoption of an innovation based on the communications within their
network (Rogers, 2003). In Extension, the communication networks may take time for
the change facilitator to understand. Because of the geographically dispersed nature of
field faculty, communications take place within a variety of subgroups. Faculty may
relate on a basis of job type (agricultural faculty communicate with other agricultural
faculty), based on time of hire (newer faculty related to other newer faculty), location,
etc. Understanding the networks in each state will be important for the change facilitator
in three primary ways: 1) Positive feedback about renewable energy programming
communicated through these informal networks will improve the rate of adoption. 2)
Negative tones spread in the networks will require the change facilitator to become aware
of those communications and to devise appropriate intervention strategies to address the
concerns. Because Extension is not housed in one facility, negative disposition can
spread throughout a state without the leadership being aware of the disposition. 3) The
change facilitator might best identify means of establishing double-loop communication
if the existing communication networks are well understood.
However, for Extension administration the need to promote and encourage change
in renewable energy programming may prove difficult. While Extension administration
has indicated interest in engaging faculty, publically advocating renewable energy
programming change (perhaps over other programming areas) may be politically

139 sensitive. In this time of constrained budgets, Extension offices may find vacancies or
reduction of resources in traditionally supported educational areas. Advocating change in
renewable energy programming may require public perception management to ensure
that supporters of Extension do not perceive a letting go of traditional efforts in lieu of a
more “politically” supported topic, such as renewable energy. McDowell (2003) argues
that the balance between needing to address societal demands and retaining the support of
traditional Extension constituents is a long-standing and complex issue, but that it must
be addressed for Extension to remain relevant. The need for this balance may also
provide a strong argument for renewable energy education to take place within existing
programming efforts. In other words, the perception management can occur by
emphasizing that Extension is not forgoing outreach in (for example) agriculture, but
Extension is adding information about energy in agricultural work.
Change Principle 9: Mandates Can Work
Mandates can be effective strategies in implementing change. Mandates make the
priority and expectation for implementation clear. However, mandates fail when they are
not supported by other elements of the change implementation strategy (ongoing
learning, communication, support of faculty, etc.) (Hall G. E., 2011). Extension may
benefit from mandates that energy will be incorporated into outreach work. However, for
this to be effective, Extension leadership in each state must first define “renewable
energy programming” expectations and must have staff and resources in place to support
implementation.
140 For Extension, renewable energy programming mandates will differ over time.
To start, faculty need specific direction (an established curriculum, expectations for
performance, etc). This need is indicated by the high Stage 0 concern of faculty. The
mandate to become involved must be specific for faculty to understand what is being
mandated. However, as implementation increases, the nature of the mandate for
involvement should shift to one of providing leadership and structure, while allowing
faculty to adapt and change the innovation. Fullan (2007) provides an example of the
change in leadership processes as faculty adopt the innovation,
The leader becomes the context setter – not an authority figure with solutions. Once folks at the grass roots realize they own the problem, they also discover that they can help create the answer – and they get after it very quickly, very aggressively, and very creatively, with a lot more ideas than the old-style strategic direction… it works because people on the ground usually know what’s going on (p. 111).
Rogers (2003) discusses the importance of allowing faculty to change the innovation in
his discussions of re-invention. As the innovation is adopted, people find new
applications, modifications, and improvements on the original innovation (p. 17). The
end result is a more applied innovation and usually a more creative product than the
original. While the initial mandate for involvement may be required in Extension,
leadership must shift to allow this level of creativity over time. Mandates in the context
of renewable energy education in Extension are not the “teacher-proof” curriculum
described in early days of the National Defense Education Act. Rather, mandates in this
context should include basic standards and guidelines for implementation of renewable
energy education. Extension specialists, supported by administration, should provide
141 essential understandings and benchmark participation levels expected of faculty. The
expectations should be included in position descriptions and performance accountability
should be tied to those expectations, but the faculty members should be allowed latitude
to adapt and modify curriculum to meet localized needs.
Change Principle 10: The Context Influences the Process of Learning and Change
Hall and Hord (2011) argue that there are two contextual factors that influence
learning and change. One is the physical attributes of the organization. The second are
the “people factors” – the attitudes, beliefs, and culture of those in the organization. The
research of Rowe (2010) with regard to evaluation of Extension as a learning
organization indicates that this change principle will be a difficult one for Extension to
manage. First, Extension does not have a physical structure in which to influence
organizational dynamics. Faculty are dispersed throughout each state. Second, faculty
are limited in their interactions with one another. The limited interaction makes it more
difficult to create and sustain enthusiasm for the change. It also allows for negative
dispositions toward the change to exist and spread without the knowledge of those
leading the implementation efforts. For Extension to be successful in addressing this
change principle, strategies for consistent contact, double-loop communication and
support of faculty will need to be considered (Lezotte, 2002).
Here too, Extension strategies may differ from the initial need to provide
information and training, to one of fostering communication and creativity. The SoCQ
research and measurement of current involvement show that faculty will need
information to begin teaching renewable energy. However, as faculty learn the

142 innovation, the need for information will decline. Brown and Duguid (2000) discuss the
current social phenomenon of sheer volumes of information leading to “information
glut”. They note, “For all information’s independence and extent, it is people, in their
communities, organizations, and institutions who ultimately decide what it all means and
why it matters” (p. 18). Extension change facilitators in each state will need to develop
support and communication structures that foster these human elements of change
implementation for renewable energy to evolve beyond an initial mandate for faculty
participation.
Summary
Implementing renewable energy education in Extension is a complex challenge.
The challenge is not one of information. A search of the Internet produces abundant
information on renewable energy. The challenge is not one of simply expressing a desire
to engage Extension in energy outreach. The literature review provides evidence of a
stated desire for engagement from the late 1970s. The challenge is not one of needing
encouragement from external entities. Again, the literature review shows multiple
supporters and funders of Extension articulating desire for outreach on the topic. The
challenge IS one of understanding the needs and concerns of individuals tasked with
implementation, while also adapting the organization to support those individuals. Note
Brown and Duguid (2000),
Envisioned change will not happen or will not be fruitful until people look beyond the simplicities of information… to the complexities of learning, knowledge, judgment, communities, organizations, and institutions (p. 213).
143 Addressing the complexities of engaging Extension field faculty in renewable energy
programming will require dedication and strategic change management practices.
Based on the research, the following action steps are recommended for implementing
renewable energy programming in MT, WY, and CO.
1. Extension administrative leadership in each state must clarify what “renewable
energy programming” entails. Specifically, leadership must define areas of
renewable energy in which the organization intends to focus (eg. Small home
technologies, commercial development issues, community energy, etc.) and the
level of depth that is considered adequate to meet societal needs given available
resources.
2. Standardized materials should be developed for faculty. While an abundance of
information is available on each technology, faculty need resources vetted by
Extension specialists and that are consistent in the manner in which they present
information. Consistency in materials will help faculty to learn both the teaching
materials and the technical elements of renewable energy more quickly.
3. Extension leadership must define the expected level of field faculty involvement
for current faculty. Leadership must make clear the expectation to faculty and be
prepared to support implementation efforts, with specific focus on addressing
Stage 0-3 concerns in the near term.
4. A change facilitator in each state must be identified. Extension leadership must
validate and articulate the role of the change facilitator to field faculty.

144
5. Strategic interventions need to be developed by the change facilitator that provide
for two types of faculty learning – learning about the expectations of renewable
energy programming and learning about renewable energy. Strategies for training
and support of faculty need to be developed in each state. Strategies should seek
methods of implementation that allow faculty to incorporate renewable energy
training in to existing programming efforts. Support needs to be ongoing and
focused on meeting individual needs while also addressing subgroup and
organizational needs.
6. Communications strategies need to be integrated as part of the implementation
effort. The strategies need to connect faculty to one another, as well as to the
state level. Enthusiasm and learning about the innovation will require faculty to
connect and support one another in implementation efforts. State-level leadership
will need to receive constant feedback from faculty in order to adapt and enhance
programming efforts to support implementation needs.
7. The change facilitator will need to allow for a phasing out of the facilitation role.
This process should also allow for users of the innovation to begin creatively
adapting and applying their learning. The change process should encourage
organizational learning and connectivity of the people that will make change real
and valuable for Extension.
These recommendations will aid Extension administration and specialists in
structuring and implementing renewable energy programming. However, it should be
recognized that the majority of faculty cannot be expected to engage beyond a basic

145
level in renewable energy education unless significant resources are devoted to
professional development. For example, faculty may be trained to discuss
fundamentals of small wind energy or solar hot water systems, but are unless they are
certified or extensively trained, should not engage in siting systems or recommending
system configurations unique to a home or specific site. It will be important for
Extension to define realistic expectations for field faculty engagement and to further
ensure that the availability of expert-level resources be clearly defined for Extension
constituents.
Suggestions for Further Research Further research may be warranted on the three subgroups that indicated a tailing
up at Stage 6 of the SoCQ research. Those groups included the 56-60 age group, faculty
with primary responsibilities in 4-H, and those employed by Extension for more than 20
years. Interview research with members of each of these subgroups may provide insights
as to the resistance, specifically whether the resistance was related to the innovation of
renewable energy programming or related to change in general. Interview research might
also be utilized to asses Community and Economic Development faculty to better
understand their tie score between Stage 0 and Stage 5 levels of concern. Interview
research should also be conducted with those employed from 6-10 years to better
understand their higher Stage 3 concerns.
There may have been overlap between those 56-60 years old and those employed
by Extension for more than 20 years. The amount of overlap is dependent on when the
146 employee’s career began. Further research could be conducted to evaluate dynamics that
contributed to both of these subgroups indicating an uptick at Stage 6. However,
strategically these groups likely represent demographics with the potential for shorter-
term employment with Extension. The research may prove interesting, but change
management strategies should not seek to target these groups unless they are opinion
leaders in Extension.
Research should be conducted as to what levels of energy expertise exist within
current Extension faculties. A Delphi study methodology may be appropriate in
assessing knowledge and skills at increasing levels of depth. More basic needs
assessment tools may not accurately ascertain skill levels if respondents are have limited
background in energy (e.g. – People may not know what they don’t know.)
As states begin implementing the change process, continued evaluation and
research of faculty concerns is recommended. The Stages of Concern Questionnaire may
be used to compare concerns of faculty as the change process evolves, however less
formal assessment might also indicate progression of faculty through the various stages
of concern. The Innovation Configuration and Levels of Use instruments are designed
specifically to assess faculty concerns and implementation efforts and may provide rich
insights for change facilitators as the process evolves. Any significant resistance to the
innovation should be assessed using the SoCQ to understand the nature of the resistance
and the levels of faculty concern.
Evaluation research related to continuous improvement should be implemented as
a tenet of becoming a learning organization. Learning organization texts provide a

147 variety of evaluation matrixes that might be used to assess Extension in this process. The
elements of the learning organization will be critical to long term adoption and evolution
of renewable energy programming in Extension.

148
REFERENCES CITED

149 7 U.S.C. 301. (n.d.). Cornell Law: United States Code. Retrieved June 21, 2011, from Morrel Act: Title 7, Chapter 13, Subchapter 1, 301: http://www.law.cornell.edu/uscode/7/301.html
7 U.S.C. 3103. (n.d.). Cornell Law: United States Code. Retrieved June 21, 2011, from Smith Lever Act: Title 7, Chapter 64, Subchapter 1, 3103: http://www.law.cornell.edu/uscode/html/uscode07/usc_sec_07_00003103----000-.html
Anseel, Lievens, Schollaert, & Choragwicka. (2010). Response Rates in Organizational Science 1998-2005: A meta-analytic review and guidelines for survey researching. Journal of Business and Psychology , 335-349.
APLU. (2011). APLU Energy Initiatve. Retrieved June 30, 2011, from Association of Public and Land-Grant Universities: http://www.aplu.org/page.aspx?pid=1225
Archer, T. (2008, July). Response Rates to Expect from Web-Based Surveys and What to Do About It. Retrieved February 17, 2012, from Journal of Extension Online: http://www.joe.org/joe/2008june/rb3.php
Arunga, R. A. (1995). What Ohio Extension Agents Say About Sustainable Agriculture. Journal of Sustainable Agriculture , 169-187.
Bok, D. (1994). Universities and the Future of America, Fourth Impression. Duke University Press.
Born, S. (1980). Extension and the Energy Crisis: Players or Speculators. Journal of Extension , 6-13.
Brown, J., & Duguid, P. (2000). The Social Life of Information. Boston: Harvard Business School Press.
Calabrese, R. (1982). The Problem Identification and Classification Process. NASSP Bulletin , 10-15.
Cash, D. (2001). “In Order to Aid in Diffusing Useful and Practical Information”: Agricultural Extension and Boundary Organizations. Science, Technology, and Human Values , 431-453.
Coffnner, D. a. (1997). Can You Teach an Old Dog New Tricks? An Evaluation of Extension Training in Sustainable Agriculture. Journal of Sustainable Agriculture , 5-19.
Creative Research Systems. (2007-2010). Sample Size Calculators. Retrieved 14 July , 2011, from Creative Research Systems: http://www.surveysystem.com/sscalc.htm
Dillman, D. (2002). Mail and Internet Surveys: The tailored design method. New York: Wiley.

150 Elliot, H. M. (2008). Sustainable Living Education: A Call to All Extension. Journal of Extension .
Everett M. Roger, F. F. (1971). Communications of Innovations: A cross-cultural approach. Free Press.
eXtension. (2011). eXtension. Retrieved July 14, 2011, from Home Page: http://www.extension.org/
Fischel, F. K. (2009). Old-School Extension Programming: A Simple User Survey Provides the Impetus to a New and Successful Regional Program Opportunity. Journal of Extension , 1-5.
Fortson, L. (2006). 25 by 25: Extension's Role in Rural Energy Development. Journal of Extension , 44 (5).
Francis, C., & Clive Edwards, J. G. (1995). Impact of Sustainable Agriculture Programs on US Landgrant Universities. Journal of Sustainable Agriculture , 19-33.
Franz, N. R. (2002). Leading Organizational Change: A Comparison of County and Campus Views of Extension Engagement. Journal of Extension .
Fridgen, C. (1995). A National Strategic Plan for Natural Resources and Environmental Management Education. Journal of Extension .
Fullan, M. (2007). Leading in a Culture of Change. Jossey-Bass.
George, A. G. (2006). Measuring Implmentation in Schools: The Stages of Concern Questionnaire. Austin: SEDL.
Gibson, J. a. (1994). Training Needs of Area Specialized Agents. Journal of Extension .
Grudens-Schuck, N. (2001). Stakeholder Effect: A Qualitative Study of the Influence of Farmer Leaders' Ideas on Sustainable Agriculture Educational Programming for Adults. Journal of Agricultural Education , 1-11.
Hall, G. (2003). Diffusion of Innovation, 5th Edition. Free Press.
Hall, G. E. (2011). Implementing Change: Patterns, Principles, and Potholes: Third Edition. Boston: Pearson Education.
Hall, G. (1998). Meauring Stages of Concern About the Innovation: A manual for use of the SoC Questionnaire. Southwest Educational Development Laboratory (SEDL) (1998).
Hall, G. (2011, September 8). Personal Communication. (S. Hamlen, Interviewer)
151 Heilman, J. (1982). Uses of Direct and Indirect Measures: A Case Study of Program Impact in the Energy Conservation Field . Evaluation Review , 61-78.
Hord, R. H.-A. (1987). Taking Charge of Change. Association for Supervision & Curriculum Development.
Kellogg Commission on the Future of State and Land-Grant Universities. (1999). Returning to our roots: The engaged institution. Washington DC: National Associaiton of State Universities and Land-Grant Colleges.
Kilpatrick, S. a. (1998). Information vs Training: Issues in Farmer Learning. The Journal of Agricultural Education and Extension , 39-51.
Kirby, C. a. (2009). Energy Education Ideas that Work. Journal of Extension .
Laquatra, J. M. (2009). The Consumer Education Program for Residential Energy Efficiency. Journal of Extension .
Laquatra, J. M. (2009). The Consumer Education Program for Residential Energy Efficiency. Journal of Extension .
Leedy, P. D. (2010). Practical Research, 9th Ed. Upper Saddle River: Pearson Education, Inc.
Lezotte, L. W. (2002). Assembly Required: A Continuous School Improvement System. Okemos: Effective School Products, Ltd.
Liles, H. R. (1978). Energy Crisis vs. Extension Opportunities. Journal of Extension , 6-9.
Linder, J. a. (2002, December). Communicating the Handling of Nonresponse Error in Journal of Extension Research in Brief Articles. Retrieved February 17, 2012, from Journal of Extension Online: http://www.joe.org/joe/2002december/rb1.php
Lippit, W. W. (1958). The Dynamics of Planned Change - A Comparative Study of Principles and Techniques. Harcourt, Brace & World.
Managers, W. E. (2007). Western Extension Middle Managers Survey. Western Extension Middle Managers.
McDowell, G. (2003). Engaged Universities: Lessons from the Land-Grant Universities and Extension. The Annals of the American Academy of Political and Social Science , 31-50.
McDowell, G. R. (1985). The Political Economy of Extension Program Design. Journal of American Agricultural Economics Association , 717-725.
152 Meynell, F. (2005). A second-order approach to evaluating and facilitating organizational change. Action Research , 211-231.
Meynell, F. (2005). A second-order approach to evaluating and facilitating organizational change. Action Research , 211-.
Montana State University. (2011). MT Weatherization Training Center. Retrieved July 14, 2011, from MT Weatherization Training Center: http://www.weatherization.org/
Murphrey, T. P. (2000). Perceived Strengths, Weaknesses, Opportunities, and Threats that Impact... Proceedings of the 27th Annual National Agricultural Education Research Conference (pp. 463-475). Texas A&M University.
NIFA, U. (2010, February 2). AREERA State Plans of Work. Retrieved November 11, 2010, from USDA NIFA: www.nifa.usda.gov
Pallant, J. (2007). SPSS Survival Manual. New York: McGraw-Hill.
Rogers, E. M. (2003). New Product Adoption and Diffusion, 5th Edition. New York: Simon and Schuster, Inc.
Rowe, E. (2010). Looking at Extension as a Learning Organization. Journal of Extension.
Schmitt, M. a. (2009). Organizational Restructuring and Its Effect on Agricultural Extension Educator Satisfaction and Effectiveness. Journal of Extension , 1-11.
Schneph, R. (2004). Energy use and Agriculture: Background and Issues. Congressional Research Service , p. RL32677.
Seevers, G. G. (1997). Education Through Cooperative Extension. Albany: Delmar Publishers.
Senge, P. (2000). Schools That Learn. New York: Doubleday.
Shannon, D. a. (2010). The Comparison of Response Rate, Response Time, and Costs of Mail and Electronic Surveys. Journal of Experimental Education , 179-192.
Shinn, G. a. (1999). Anticipating Roles of the Cooperative Extension Service in 2010: A Delphi Technique Involving Agriculture and Natural Resource Agents and Family and Consumer Science Agents in Texas. Proceedings of the 26th Annual National Agricultural Education Research Conference (pp. 392-406). Texas A&M University.
Simon-Brown, V. (2004). Intellegent Consumption: Addressing Consumer Responsiblities for Natural Resources - and Beyond. Journal of Extension .

153 South Dakota State University Extension. (2011). Stewards of Progress. Brookings: South Dakota State University Extension.
Steele, D. (2011, September 20). MSU Extension Director. Letter to Extension Directors . Bozeman, MT: Email.
Steele, D. (2011, September 20). MSU Extension Director. Electronic Letter to MT Extension Faculty . Bozeman, MT: Email.
Stephenson, G. (2003). The Somewhat Flawed Theoretical Foundation of the Extension Service. Journal of Extension .
University of Nevada Cooperative Extension. (2011, March). Response to the Provost’s March 7, 2011 Curricular Review Proposal. Reno, NV, USA.
Urdan, T. (2010). Statistics in Plain English, Third Ed. New York: Routledge.
US DOE. (2011). EERE Department of Energy Glossary. Retrieved June 30, 2011, from Glossary of Energy-Related Terms: http://www1.eere.energy.gov/site_administration/glossary.html#R
USDA. (2006). Energy and Agriculture: 2007 Farm Bill Theme Paper. Retrieved October 2009, from USDA: www.usda.gov/documents/Farmbill07energy.pdf
Vergara, O. G. (2002). Extension Agriculture Education Survey: A Preliminary Summary of Selected Data. Mississippi State: Mississippi State University.
Warner, K. D. (2008). Agroecology as Participatory Science : Emerging Alternatives to Technology Transfer Extension Practice. Science, Technology, and Human Values , 754-777.
WEDA. (2008). Western Energy Extension Survey. Corvallis: WEDA.
WEDA. (n.d.). Western Exetension Director's Association. Retrieved June 18, 2011, from Reports and Publications: http://extension.oregonstate.edu/weda/reports-publications
WEDA. (2009). Western Region Extension Energy Inventory and Survey Results. Corvallis: WEDA.
White House. (2011, January 25). The White House. Retrieved June 17, 2011, from Remarks by the President in the State of the Union Address 2011: http://www.whitehouse.gov/the-press-office/remarks-president-state-union-address
Wikipedia. (2011, June 17). Wikipedia. Retrieved 17 2011, June , from Wikipedia: The Free Encyclopedia: http://en.wikipedia.org/wiki/Renewable_energy

154 WSARE Survey. (2010, April 2). Western Region Extension Program Updates. Bozeman, MT.
WSU Extension. (2011). WSU Energy. Retrieved 14 2011, July , from WSU Extension Energy Program: http://www.energy.wsu.edu/

155
APPENDICES
156
APPENDIX A
IRB TRAINING CERTIFICATE

157

158
APPENDIX B
PERSONAL CORRESPONDENCE
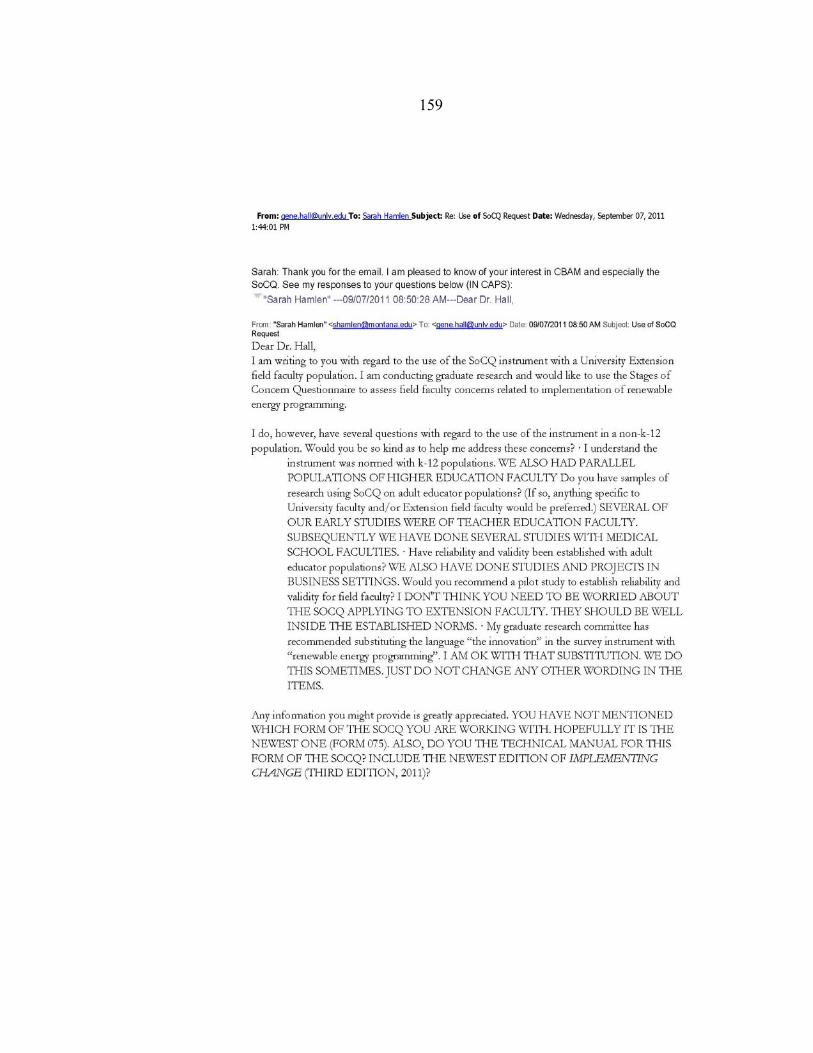
159

160

161
APPENDIX C
REQUEST FOR INVOLVMENT OF WY AND CO
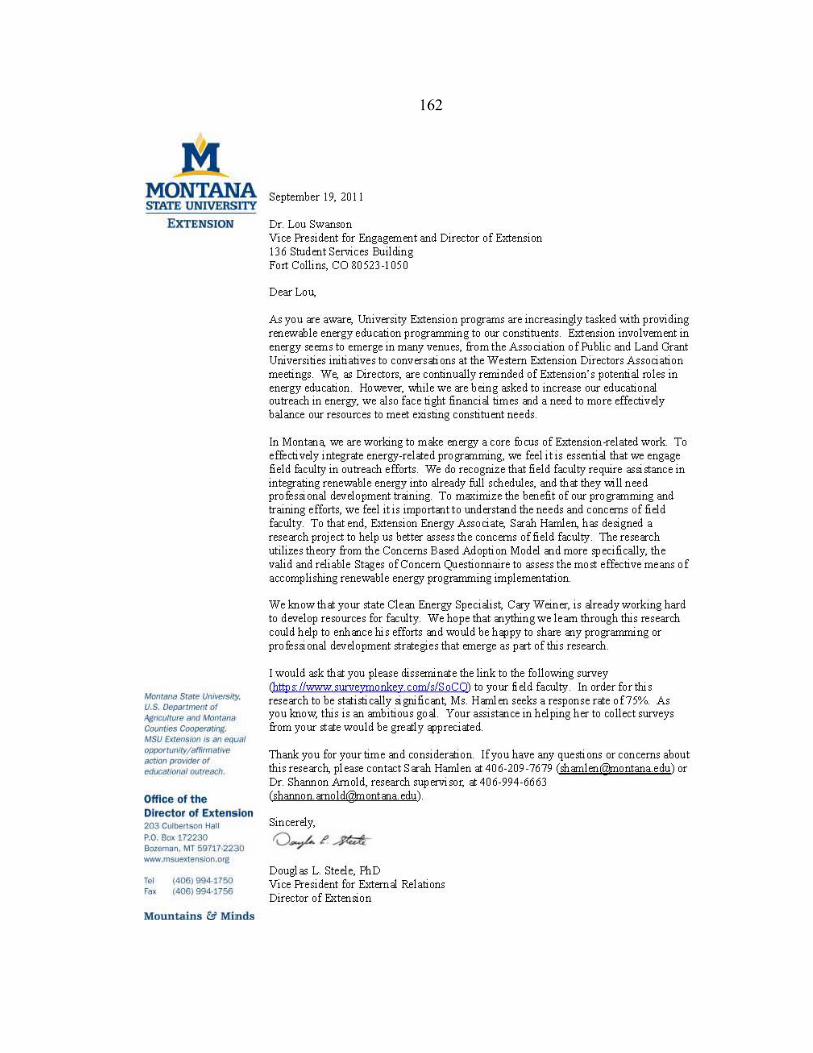
162

163

164
APPENDIX D
SURVEY INSTRUMENT

165

166

167
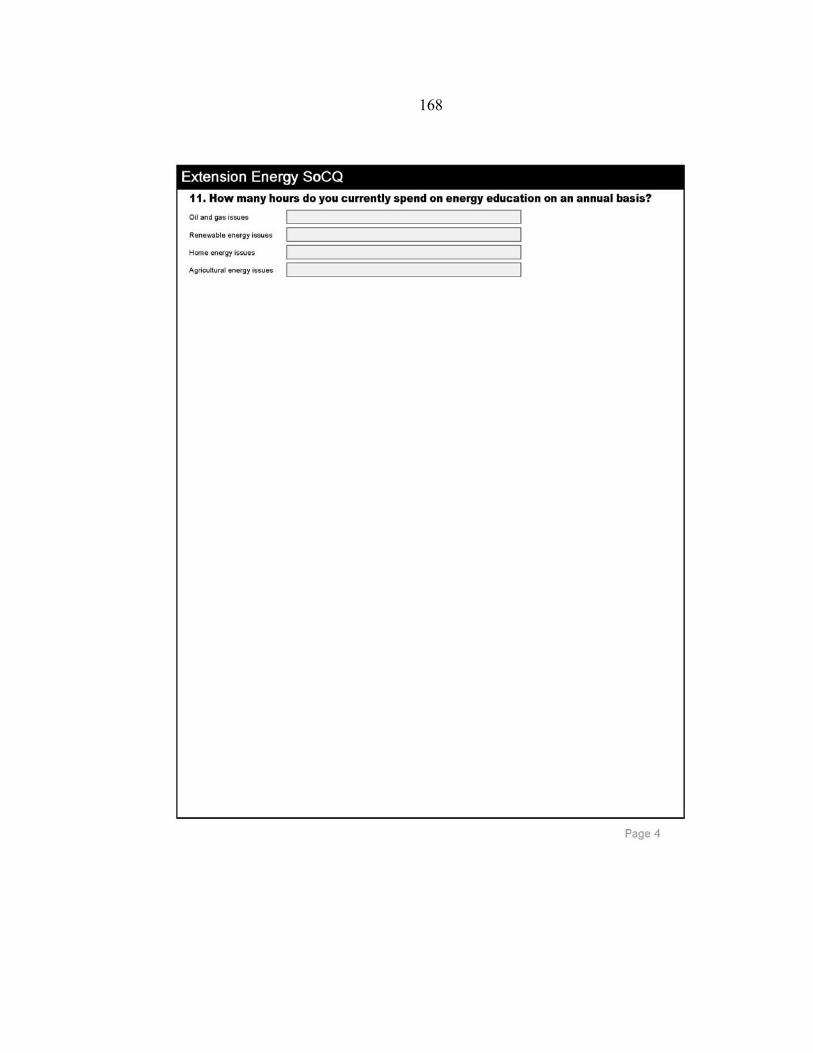
168

169

170

171

172

173

174