Embed Size (px)
Citation preview
DISTRIBUTION STATEMENT A. Approved for
public release: distribution unlimited.
An Evaluation of ChalleNGe
Graduates’ DOD Employability Lauren Malone, Cathy Hiatt, and Bill Sims
with Jen Atkin and Neil Carey
January 2018
This work was performed under Federal Government Contract No. N00014-16-D-5003.
Copyright © 2018 CNA
This document contains the best opinion of CNA at the time of issue.
It does not necessarily represent the opinion of the sponsor.
Distribution
DISTRIBUTION STATEMENT A. Approved for public release: distribution unlimited.
PUBLIC RELEASE. 1/22/2018
Request additional copies of this document through [email protected].
Photography Credit: The Oregon National Guard Youth Challenge Program (OYCP)
Cadet Color Guard team, for class 2011-12, reports during their class graduation
ceremony in Redmond, OR, Dec. 14. The primary mission of the OYCP is to intervene in,
and reclaim the lives of 16-18 year old at-risk youth. Program graduates receive
instruction in values, self-discipline, education, and life skills necessary to succeed as
productive citizens, in addition to earning a G.E.D. (Photo by Sgt. Zach Holden, 115th
Mobile Public Affairs Detachment).
Approved by: January 2018
Jeffery M. Peterson – Research Team Leader
Fleet and Operational Manpower Team
Resource Analysis Division
i
Abstract
In this study, we evaluate the feasibility of increasing the number of graduates from
the National Guard Youth ChalleNGe Program (ChalleNGe) who could be employable
in one of the four military services. Because of the Department of Defense’s (DOD’s)
and the services’ quality goals, this requires that a significant portion of ChalleNGe
graduates have high school diplomas and score in the upper 50th percentiles on the
Armed Forces Qualification Test (AFQT). Our methodology is three pronged: (1) we
interviewed program directors, (2) we developed a test linking that allows us to
predict AFQT scores based on ChalleNGe cadets’ scores on the Test of Adult Basic
Education (TABE, a registered trademark of Data Recognition Corporation), and (3)
we analyzed the test scores and attrition behavior of those ChalleNGe graduates who
joined the services. We ultimately determine that increasing DOD employability
would require changes to the ChalleNGe program; the program directors would have
to carefully consider whether such changes align with the program’s philosophy and
mission.

ii
This page intentionally left blank.
iii
Executive Summary
The National Guard Youth Challenge Program (ChalleNGe) is a quasi-military, 22-
week residential program designed to serve 16- to 18-year-old high school dropouts,
as well as students at risk of dropping out (i.e., students who have earned far fewer
credits than expected are considered at risk of dropping out). The program also
includes a 12-month post-residential mentoring component. During this time, cadets
and their mentors report back to the program about the cadets’ status—whether they
are employed, in school, or serving in the military. The overall goal of ChalleNGe is to
help improve cadets’ cognitive and noncognitive skills by increasing their education
levels, self-confidence, life skills, and, ultimately, employment potential. Currently,
there are 35 ChalleNGe locations in 27 states, Washington, D.C., and Puerto Rico.
Depending on the program attended, cadets may have one of three educational
options on successful completion of the ChalleNGe program: a high school diploma,
recovered high school credits with which to return to one’s home high school and
complete the degree (called credit recovery), or proof of passing the General
Education Development (GED) test. Those leaving ChalleNGe with a GED certificate
are increasingly less employable, both in the civilian world and in the military,
because employers’ demand for traditional high school diplomas has risen. The
Department of Defense (DOD), in particular, requires that 90 percent of accessions
be Tier 1 recruits (typically traditional high school degree holders) and that 60
percent score in the upper 50th percentiles on the Armed Forces Qualification Test
(AFQT). Many ChalleNGe graduates, at present, do not meet these requirements. In
this light, CNA was asked to evaluate the feasibility of increasing the DOD
employability of ChalleNGe graduates (a) by increasing the percentage of cadets
taking the diploma or credit recovery options and/or (b) by increasing the percentage
of cadets capable of scoring 50 or above on the AFQT on graduation.
We took a three-pronged approach to answering this question. First, we interviewed
all 35 program directors to gather their views on the likelihood of increasing
ChalleNGe graduates’ DOD employability. Second, using the ChalleNGe programs’
data, we created a predictive linking between scores on the Test of Adult Basic
Education (TABE) and the AFQT, allowing us to predict AFQT scores—and the
percentage of cadets who can be expected to score in the upper 50th percentiles.
Finally, using data from the Defense Manpower Data Center (DMDC), we analyzed the
test scores and attrition rates of those ChalleNGe graduates who have joined the
military over the course of the past decade.
iv
The findings from all three efforts are supportive of the same general conclusion: the
ChalleNGe program should carefully weigh the trade-offs inherent in making the
necessary changes to prioritize creating more Tier 1 graduates and high-quality
graduates, where high-quality graduates are those with Tier 1 education credentials
who also score within the upper 50th percentiles on the AFQT. Many programs face
significant barriers to offering credit recovery or high school diploma options and
feel that meeting the necessary requirements to add these options would limit the
programs’ abilities to offer non-classroom, personal-development-related activities.
In addition, increasing graduates’ AFQT scores would require significant changes in
the classroom curricula and perhaps imposing academic requirements for program
admission—changes that would not effectively serve the at-risk population that the
program was designed to help. Our test-linking results revealed that 18 percent of
ChalleNGe graduates, on average, can be expected to score in the upper 50th
percentiles on the AFQT. This suggests that obtaining a significant increase in this
percentage would in fact require a revamping of curricula and the academic skills
being prioritized in the classroom. Finally, analysis of DMDC data reveals that those
ChalleNGe graduates who have enlisted have traditionally had significantly lower
AFQT scores than other recruits. There is suggestive evidence that an increase in
ChalleNGe graduates with Tier 1 credentials could decrease their overall attrition
rates (for those who go on to enlist), but it is unclear whether the policy and
programmatic changes that would be necessary to make military service feasible for
more ChalleNGe graduates align with the programs’ current philosophy and mission.
If, for example, a minimum TABE score were required for ChalleNGe admission, this
could have positive, long-term impacts for ChalleNGe graduates. Our previous work
has shown that cadets with higher initial reading and applied math TABE scores are
more likely to complete ChalleNGe. In addition, those graduates who begin
ChalleNGe with higher TABE scores and ultimately go on to enlist will likely have
more choice in their military occupational specialty (due to higher AFQT scores).
Having greater choice in their military occupational specialty would likely result in
greater job satisfaction, perhaps ultimately lowering ChalleNGe graduate attrition.
Another policy option for increasing ChalleNGe’s population of Tier 1 and high-
quality recruits would be to increase the age restriction. Increasing the minimum age
from 16 to 17 could increase the number of cadets able to earn their high school
diplomas while at ChalleNGe. In turn, this could increase the number of ChalleNGe
graduates who are immediately able to enlist in the services, thus making the
ChalleNGe program more of a direct accession pipeline. Although current policy and
data do not bode well for dramatically increasing the number of Tier 1 and high-
quality ChalleNGe graduates, it could be feasible with the right policy changes.
Regardless of what changes are ultimately considered, ChalleNGe will need to
carefully weigh whether increasing the number of potential Tier 1 and/or high-
quality recruits jeopardizes the program’s mission or philosophy in any way.
v
Contents
Introduction ............................................................................................................................ 1
Data and Methodology .......................................................................................................... 3
Interviews with ChalleNGe directors ................................................................................. 3
Developing a test-score conversion methodology ......................................................... 4
Program Director Inputs ...................................................................................................... 7
Education options offered ................................................................................................... 7
Cadets’ general ability on standardized tests ............................................................... 11
Feasibility of cadets’ scoring 50 on AFQT ...................................................................... 12
Programs’ current test preparation efforts ................................................................... 14
Other challenges to matriculating high-quality recruits ............................................. 16
Test-Score Conversion Results ......................................................................................... 17
Equipercentile linking......................................................................................................... 17
Verification of linking results ........................................................................................... 20
Comparing ChalleNGe Graduates With Other Recruits ................................................ 23
Conclusion ............................................................................................................................ 27
Appendix A: Number of Graduates per ChalleNGe Site, by Year ............................... 30
Appendix B: Development of Our Test-Score Conversion Methodology .................. 32
Which of the three types of linking does our data permit? ....................................... 35
Should we use pre-TABE or post-TABE scores in the linking analysis? ................... 37
Do we need to account for extra instruction days in between the pre-TABE and the AFQT? ..................................................................................................................... 40
Are data from all ChalleNGe sites in the linking and verification samples suitable for analysis? .......................................................................................................... 42
References ............................................................................................................................. 44

vi
This page intentionally left blank.
vii
List of Figures
Figure 1. Education options offered by the ChalleNGe programs .......................... 8 Figure 2. Distribution of responses to: “How likely is it that cadets could
score 50 or above on the AFQT at the end of ChalleNGe?” .................. 13 Figure 3. Graphical schematic of equipercentile linking procedure .................... 17 Figure 4. Percentage of cadets predicted to earn 50 or more on the AFQT ....... 19 Figure 5. Actual and predicted AFQT scores ............................................................ 20 Figure 6. Actual (ChalleNGe and enlistment) AFQT and predicted AFQT
scores ............................................................................................................... 21 Figure 7. Histogram of estimation errors .................................................................. 22 Figure 8. Comparison of AFQT score categories among enlisted
servicemembers, ChalleNGe graduates, and enlisted ChalleNGe
graduates ......................................................................................................... 23 Figure 9. AFQT score categories of enlisted ChalleNGe graduates, as
compared to the Tier 1, Tier 2, and Tier 3 enlistees .............................. 24 Figure 10. Percentage of ChalleNGe and non-ChalleNGe enlistees who attrite
by 6 and 12 months, by education tier ..................................................... 26 Figure 11. Scattergram of individual cadets’ scores on the AFQT and pre-
TABE ................................................................................................................. 37 Figure 12. Average score increases between pre-TABE and post-TABE, by
site ..................................................................................................................... 39 Figure 13. Increase in GE level, by ChalleNGe site ..................................................... 40 Figure 14. Mean AFQT versus pre-TABE, by ChalleNGe site .................................... 43

viii
This page intentionally left blank.
ix
List of Tables
Table 1. Equipercentile equating of AFQT and pre-TABE ..................................... 18 Table 2. Number of ChalleNGe graduates, by site and year (2010-2016) .......... 30 Table 3. Number of cadets in each sample, by ChalleNGe site ............................ 33 Table 4. Number of cadets in the linking sample, by month in the
ChalleNGe program ....................................................................................... 35 Table 5. Correlations between AFQT, pre-TABE, and post-TABE scores
(linking sample) .............................................................................................. 38 Table 6. Summary results from regression of AFQT on pre-TABE and
extra days of instruction (linking sample) ............................................... 42

x
This page intentionally left blank.
xi
Glossary
AFQT Armed Forces Qualification Test
ASVAB Armed Services Vocational Aptitude Battery
CAT Category
ChalleNGe National Guard Youth ChalleNGe Program
DMDC Defense Manpower Data Center
DOD Department of Defense
FTE Full-Time Equivalent
GE Grade Equivalent
GED General Education Development
HiSET High School Equivalency Test
TABE Test of Adult Basic Education

xii
This page intentionally left blank.
1
Introduction
The National Guard Youth ChalleNGe Program (ChalleNGe) is designed to provide a
second chance to high school dropouts (ages 16 to 18) and support for those at risk
of dropping out. The program has two components: a 5-month residential portion,
followed by a 12-month mentoring phase. ChalleNGe has a quasi-military structure:
participants live in barracks, wear military-style uniforms, and perform activities
typically associated with military training (e.g., marching, drills, and physical
training). Participation in the program, however, is voluntary. Although participants
are referred to as cadets, they have no subsequent requirement for military service.
The goal of ChalleNGe is to help “young people improve their self-esteem, self-
confidence, life skills, education levels, and employment potential” [1].
There are currently 35 ChalleNGe academies operating in 27 states, Puerto Rico, and
the District of Columbia. These sites are funded jointly by the Department of
Defense (DOD) and the states. The National Guard Bureau is responsible for
management and oversight of ChalleNGe. That said, each site is given discretion in
how it structures its program. As a result, the academic goals of the ChalleNGe sites
vary. Some seek to have cadets pass the General Education Development (GED) test,
whereas others award alternative high school diplomas. Some ChalleNGe sites
provide credit recovery so that cadets can earn high school credits and return to
their original high schools after completing the program. There also are some
ChalleNGe sites that are equivalent to high schools and award state-certified high
school diplomas. In many cases, sites offer more than one of these options.
The type of program the ChalleNGe graduates attend and the resulting credentials
they attain have important implications for their future employability. Those who
ultimately earn traditional high school diplomas are more employable than those
earning a GED because employers value the cognitive and noncognitive skills that are
developed during the pursuit of a traditional high school diploma. They are more
employable not only in the civilian labor market but also in the military. The DOD,
for example, requires that 90 percent of incoming recruits be Tier 1, the majority of
whom have traditional high school diplomas.1 In addition, DOD limits the number of
1 It is possible to classify as a Tier 1 recruit without a traditional high school diploma, but it
requires a minimum of 15 semester-hour college credits.
2
recruits who have lower mental aptitudes. Specifically, there is a DOD goal that at
least 60 percent of accessions score in the upper 50th percentiles on the Armed
Forces Qualification Test (AFQT). Many services, however, strive for even higher
quality goals. Because of this, participation in ChalleNGe has not traditionally been a
pipeline to military service for those cadets who are interested. Since recruiters are
incentivized to meet all quality benchmarks that their services’ impose, they may not
view the ChalleNGe population as part of their recruitable pool. Thus, many
ChalleNGe graduates are not immediately DOD employable on completion of the
program.
In this light, the Office of the Assistant Secretary of Defense for Reserve Integration
asked CNA to determine whether ChalleNGe graduates, on average, are DOD
employable and, if not, what it would take to make them DOD employable. We take a
three-pronged approach to answering this question. First, we conducted interviews
with each of the ChalleNGe program directors to gather their inputs on the feasibility
of producing Tier 1 and high-quality recruits out of the ChalleNGe program, where
high-quality recruits are those with Tier 1 education credentials who also score
within the upper 50th percentiles on the AFQT.2 Second, using available data on the
cadets’ scores on the Test of Adult Basic Education (TABE) and AFQT, we create a
predictive linking between the TABE and the AFQT. This allows us to predict cadets’
AFQT scores based on what they scored on the TABE and thus provide estimates of
the percentage of ChalleNGe graduates expected to score within the upper 50th
percentiles on the AFQT. This analysis, combined with information on the number of
programs that offer a high school diploma option, allows us to evaluate the overall
DOD employability of ChalleNGe graduates.
The remainder of this report is organized as follows. In the next section, we provide
detailed information on our data and methodology. This includes a description of
our interviews with the ChalleNGe program directors as well as the methodology
used to create our test score predictive linking and the data employed. In the next
section, we summarize the program directors’ inputs regarding the feasibility of
increasing the DOD employability of ChalleNGe graduates. Then we summarize our
findings from the test-score conversions. In the following section, we compare
ChalleNGe graduates who enlisted in the military with other nontraditional recruits
(namely, Tier 2 and 3 recruits) to gauge how their test scores and attrition rates
differ. We conclude by discussing the implications of these findings for the
ChalleNGe Program.
2 Per DOD’s three-tiered education system, implemented in 1987 and most recently updated
2014, Tier 1 recruits are regular high school graduates, adult diploma holders, and
nongraduates with at least 15 semester hours of college credit [2]. Tier 2 recruits are those with
alternative high school credentials, primarily GED certificates, and Tier 3 recruits are those
with no secondary school credentials.
3
Data and Methodology
In this study, we took a three-pronged approach to determining the feasibility of
increasing the number of Tier 1 and high-quality recruits produced by ChalleNGe.
First, we interviewed each of the 35 ChalleNGe program directors (and, in some
cases, also their deputies). Then, we turned to the data to evaluate the feasibility of
ChalleNGe graduates scoring 50 or above on the AFQT. We also compare the test-
score distributions of ChalleNGe graduates who joined the military with other
recruits. Finally, we compare the probability that these ChalleNGe graduates will
attrite during the first year of service with the probability of attrition for other
recruits with nontraditional educational backgrounds (e.g., GEDs). Such analysis
required data from ChalleNGe programs as well as the Defense Manpower Data
Center (DMDC). Each ChalleNGe program provided data on recent classes of
ChalleNGe cadets, including their TABE and AFQT test scores.3 The number of years
of available data varied by site (as shown in Appendix A), as did the completeness of
those data. This variation was due simply to the available data at each site; all
available data were used in our analysis. In order to analyze test-score and attrition
differences by recruit type, we also collected data from DMDC on FY09–FY16 active-
duty, non-prior-service accessions. Merging these two datasets allows us to track
ChalleNGe graduates who entered the services.
Interviews with ChalleNGe directors
In these discussions, we collected information on the sites’ current and expected
challenges in producing Tier 1 and high-quality recruits. That is, we focused on what
would be necessary to have more ChalleNGe graduates attain high school diplomas
and how likely it is that they could score in the upper 50th percentiles on the AFQT.
Specifically, we asked the following questions:
What are the education options offered by your program (e.g., degree granting,
credit recovery, GED)? To the best of your knowledge, how did your program
determine which options would be offered?
3 While at ChalleNGe, all cadets take both the TABE and AFQT, administered by each program.
4
For those programs not granting high school diplomas and/or offering the
credit recovery option:
o Why is obtaining a high school diploma or participating in credit recovery
not an available option at your program? What factors make these options
infeasible?
o What would be necessary to add the options of a high school diploma
and/or credit recovery at your program?
At the end of the ChalleNGe program, how would you characterize cadets’
ability to perform well on standardized tests? How likely do you think it is that
they could score 50 or above on the AFQT? What would be necessary to
increase the probability of higher score attainment?
Does your program currently provide test preparation activities specifically
designed to improve cadets’ TABE scores at the end of the program? What are
the methods for doing so? Do you think these methods would work for
improving AFQT scores as well?
Developing a test-score conversion
methodology
A primary objective of ChalleNGe’s academic component is to allow participants to
improve on the TABE and ultimately pass the GED test or obtain a high school
diploma. ChalleNGe sites currently collect data on participants’ TABE scores at the
beginning of training (pre-TABE), and at least one time after ChalleNGe training has
started (post-TABE). To determine whether the program’s training enables
participants to score high enough on the AFQT to be eligible for military service, we
set out to predict ChalleNGe graduates’ scores on the AFQT based on their TABE
scores. This requires a linking between TABE and AFQT scores.4
4 To the best of our knowledge, no one has linked TABE and AFQT scores before. As
background for our linking study, we requested a copy of the TABE 9/10 Norms Book and
Technical Manual from Data Recognition Corporation (DRC), the owner of all proprietary rights
in and to the TABE 9/10 Assessment. As a condition of providing us those publications, DRC
asked that the following disclaimer be used in our report: “DRC granted permission to allow
research data of DRC’s proprietary TABE product for use in this research study. DRC strongly
recommends the use of TABE according to product guidelines in order to preserve the integrity
of test interpretation. DRC is not responsible for the design, methodology, or findings of this
study. Use of the DRC proprietary materials in any way that does not conform to product
guidelines, including score interpretation, is not the responsibility of DRC.”
5
The three types of links that can possibly be developed [3] follow:5
1. Predictive linking: The goal of this method is to predict a score from one
test based on the score on another test. This method is comparatively
weak because it does not require that the tests measure the same
attribute.
2. Scale aligning: The objective of scale aligning is to “transform the scores
from two different tests onto a common scale” ([3], p. 3). This linking
method is stronger than predictive linking because it requires that the
two tests measure the same attribute.
3. Equating: The goal of equating is to “produce a linkage between scores
on two test forms such that the scores from each test form can be used
as if they had come from the same test” ([3], p. 3). This form of linking is
the strongest because it requires that the tests meet five very stringent
requirements: the two tests must measure the same attribute, be equally
reliable, and show symmetry, equity, and population invariance.6
We conducted considerable analysis to determine which of these three types of
linking are most appropriate for our dataset and precisely how the linking should be
conducted. Specifically, we needed to determine the following:
1. Is predictive linking, scaling, or aligning most appropriate for our
dataset?
2. Should we use pre-TABE or post-TABE scores in our linking?
3. Are data from all ChalleNGe sites suitable for inclusion in the linking
analysis?
4. Do adjustments need to be made for the extra days of ChalleNGe
instruction that occur after the pre-TABE but before the AFQT?
5 There is a rich literature on the subject of linking scores on different tests. The interested
reader is invited to examine references [3-8] on the subject.
6 The word symmetry means that “mapping the scores of Y to those of X should be the inverse
of the equating transformation for mapping the scores of X to those of Y” ([3], p. 5), which
disqualifies regression methods from being a form of test equating. Equity means that
examinees should be indifferent to which of the two tests they take. Population invariance
means that the linking function should be the same regardless of the subpopulation(s) from
which it is developed.
6
In Appendix B, we discuss in detail the analysis conducted to answer these questions.
We ultimately determined that, first, a predictive linking is most appropriate for our
data since the TABE and the AFQT do not measure the same academic abilities. As we
explain fully in Appendix B, there are two types of predictive linking: linear and
equipercentile. The equipercentile method is preferable here because the two tests
are scored on different metrics. This means that the relationship between the two
scores would contain a small nonlinear component that could distort the linear
linkage. Second, pre-TABE is used in the linking owing to its higher correlation with
AFQT scores and the fact that post-TABE scores will be influenced by programmatic
differences, whereas pre-TABE scores should not.7 Third, we do find that all
ChalleNGe sites are suitable for inclusion in the analysis. That is, we find no evidence
of extreme outliers. And finally, we do not find evidence that any adjustments need
to be made for the extra days of instruction in between the pre-TABE and the AFQT
because the number of days of instruction is not statistically significantly correlated
with final AFQT scores. For the interested reader, greater detail on all of these points
can be found in Appendix B.
7 If some programs place greater emphasis on TABE improvements, this could be reflected in
their (presumably higher) post-TABE scores. Thus, the post-TABE will be influenced by such
program-level differences, whereas the pre-TABE is taken early enough to be free from the
influence of such differences.
7
Program Director Inputs
To gain the programs’ perspectives regarding the feasibility of and challenges to
increasing the number of ChalleNGe graduates whom the military would classify as
Tier 1, we conducted phone interviews with each of the 35 program directors. We
began the interviews by reviewing what educational options (high school diploma,
credit recovery, and/or GED/High School Equivalency Test (HISET)) the program
offers and asking the directors how the current options were selected. We then
focused the rest of the discussion on the two main avenues for increasing the
number of ChalleNGe graduates that qualify for Tier 1 status (referred to herein as
“Tier 1 ChalleNGe graduates”): (1) increasing the number of programs that offer
credit recovery and/or high school diploma options (and thus the number of
graduates returning to high school or with a diploma in hand) and (2) increasing the
number of GED holders who are able to score 50 or better on the AFQT portion of the
Armed Services Vocational Aptitude Battery (ASVAB).
In the remainder of this section, we summarize the program directors’ inputs. We
begin by reviewing the education options offered at the different programs and how
the decisions to offer these options were made. The reasons provided for why
programs offer different combinations of programs were enlightening and often, in
themselves, highlighted potential challenges to increasing the prevalence of credit
recovery and high school diploma options. We also asked the GED-only programs
why they offer neither credit recovery nor the high school diploma options and what
would be necessary to add one or both of these options to their programs. After
reviewing these inputs, we move to a discussion of the directors’ thoughts regarding
the feasibility of increasing the number of high-quality graduates via improvements
in their AFQT scores (to 50 or above). As part of this discussion, we review (1) their
inputs on cadets’ abilities to perform on standardized tests in general, (2) how much
(if any) and what kind of test preparation is provided by their program and if this
preparation might be effective in increasing AFQT scores, and (3) what would be
necessary to increase the probability of higher score attainment.
Education options offered
Each ChalleNGe program offers some combination of three education options:
preparing for the GED (or HiSET), credit recovery, and earning a high school diploma.
8
In some states, when a cadet passes the GED or HiSET, the state automatically awards
him or her a high school diploma. The military services, however, do not consider
these diploma holders to be Tier 1 recruits; the services reserve that status for
traditional high school diploma holders. Thus, for the purpose of classification, we
consider any program that offers a high school diploma to those who can pass the
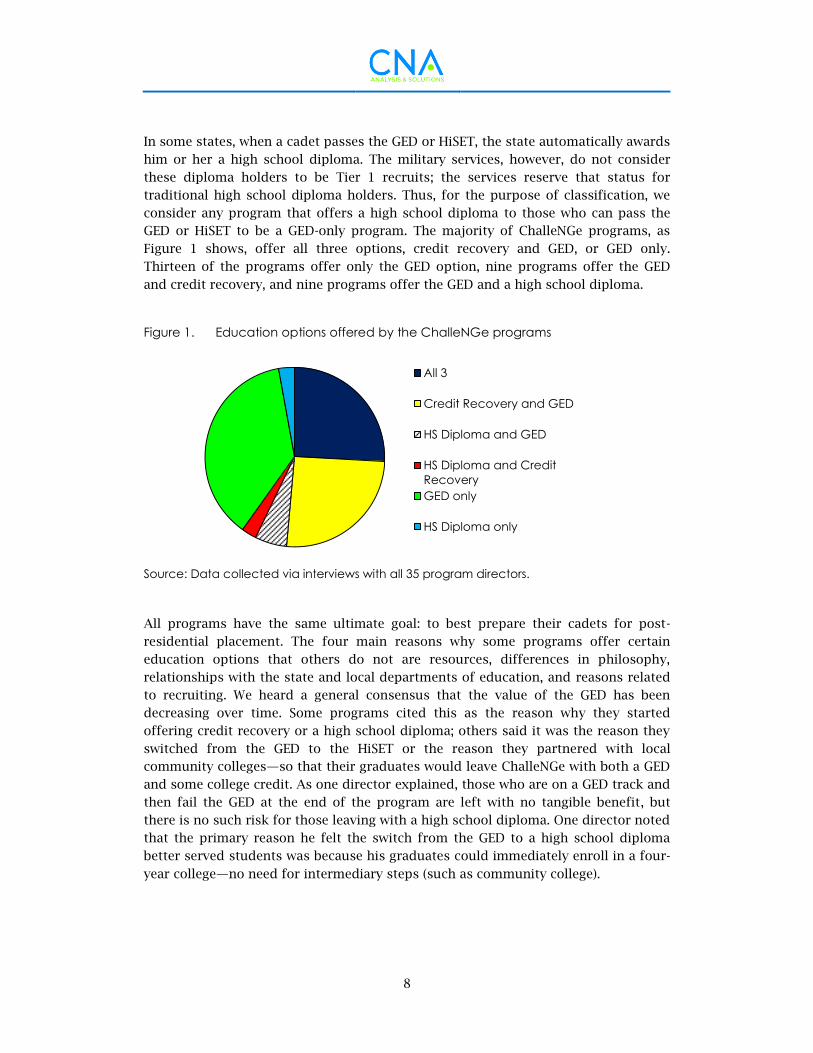
GED or HiSET to be a GED-only program. The majority of ChalleNGe programs, as
Figure 1 shows, offer all three options, credit recovery and GED, or GED only.
Thirteen of the programs offer only the GED option, nine programs offer the GED
and credit recovery, and nine programs offer the GED and a high school diploma.
Figure 1. Education options offered by the ChalleNGe programs
Source: Data collected via interviews with all 35 program directors.
All programs have the same ultimate goal: to best prepare their cadets for post-
residential placement. The four main reasons why some programs offer certain
education options that others do not are resources, differences in philosophy,
relationships with the state and local departments of education, and reasons related
to recruiting. We heard a general consensus that the value of the GED has been
decreasing over time. Some programs cited this as the reason why they started
offering credit recovery or a high school diploma; others said it was the reason they
switched from the GED to the HiSET or the reason they partnered with local
community colleges—so that their graduates would leave ChalleNGe with both a GED
and some college credit. As one director explained, those who are on a GED track and
then fail the GED at the end of the program are left with no tangible benefit, but
there is no such risk for those leaving with a high school diploma. One director noted
that the primary reason he felt the switch from the GED to a high school diploma
better served students was because his graduates could immediately enroll in a four-
year college—no need for intermediary steps (such as community college).
All 3
Credit Recovery and GED
HS Diploma and GED
HS Diploma and Credit
Recovery
GED only
HS Diploma only
9
Many of the directors of GED-only programs noted that their graduates would be
better off leaving the program with a high school diploma or, at a minimum,
returning to high school. However, the programs remain GED-only because of other
barriers (such as lack of accreditation, resource constraints, and lack of agreement
with the local school districts and department of education). In some cases, there are
legislative barriers. A few program directors noted the role of recent changes to state
law mandating that a teenager cannot drop out of high school before age 18. This
made it infeasible for some programs to only offer the GED option; becoming an
accredited high school then became their only option. Allowing cadets to also pursue
a GED at ChalleNGe would require legislative changes so that 16- and 17-year-olds
could attend ChalleNGe and not be considered dropouts. In some states, the extra
requirements that would be imposed on the programs were they to offer high school
credits and/or a diploma are quite burdensome—including special education
requirements, testing requirements, a required total 180 hours of seat time per
academic “year,” and second language program requirements. Many of the students
arrive at ChalleNGe at low levels of reading comprehension, writing, and basic math;
they simply are not ready to acquire a second language. In addition, program
directors noted that the seat time (and classroom time) required to meet these
requirements would come at the expense of other activities—activities that may be
more important for improving cadets’ noncognitive skills and preparing them for
employment. These directors noted that, not only is there not enough cadet time,
there also aren’t enough employees or sufficient resources to meet the accreditation
requirements.
Another significant challenge to offering high school diplomas or credit recovery is
posed by the fact that many cadets arrive at low academic levels (sometimes, for
example, reading at the fifth grade level). In addition, many cadets are also “credit
deficient.” They are far behind their high school peers as a result of failing courses
and dropping out. Many directors stated that there simply is not enough time to
recover the credits necessary to grant them diplomas in a 5.5-month period.
Another significant barrier cited was the lack of local support. All directors of
programs granting high school diplomas stressed the importance of relationships
with local school districts and/or the state Department of Education. Some programs,
for example, were successful in establishing credit recovery only after convincing the
local school districts that the ChalleNGe graduates would be motivated, disciplined
students when they return to high school (even though they likely were not before
they left high school). These are precisely the types of role models a high school
10
should be happy to have among its student body.8 Some programs have established
partnerships with local schools that allow them to share staff as well. Without some
sort of agreement between the ChalleNGe program and the local school district, in
addition to the support of the state Department of Education, it is unlikely that any
of the current GED-only programs could adopt the credit recovery or high school
diploma options. Program directors emphasized that these relationships are
especially important in minimizing the extent to which other high schools view
ChalleNGe as a source of competition, especially for full-time-equivalent (FTE)
funding. Credit recovery may be a more tenable option than granting high school
diplomas for FTE funding reasons: when ChalleNGe cadets ultimately return to their
home high schools, the FTE dollars follow them. In addition, the high schools’
dropout rates ultimately fall. The schools can not only transfer their dropouts to the
ChalleNGe program but also get credit for graduations when the cadets return.
Other directors voiced more philosophical concerns. One noted, for example, that the
main aim of the ChalleNGe program is behavior intervention, not to serve as a school.
Thus, this director felt that if there were a need (or mandate) for increased focus on
academics, it would be at the expense of the program’s ability to mitigate impulsive
behavior and otherwise prepare these cadets for a successful, independent
adulthood. Similarly, another director noted that character development, service to
community, and other core elements of the ChalleNGe program would have to be
sacrificed to increase the academic focus. Another director noted that these youth
have already been failed by the traditional school system, so transforming ChalleNGe
into a program more focused on granting high school diplomas and getting the
cadets back into their home high schools would essentially turn ChalleNGe into
another traditional setting. In addition, programs that do not need to focus on state-
mandated graduation requirements (often in the form of passing various tests) are
able to focus more on the cadets’ individual needs. Some directors were concerned
that the program’s current, effective framework would be replaced by one with
greater emphasis on teaching to the test. Thus, these directors felt that the best way
to serve their populations was to maintain their focus as GED-granting programs.
One director whose program had transitioned from GED only to offering a high
school diploma and credit recovery noted that there were definite benefits from
being GED only. Namely, the extra flexibility in scheduling afforded them the
opportunity to expose their cadets to a wider range of opportunities since they did
not have to be in the classroom Monday through Friday. This director also
8 In other cases, directors noted that not all principals are eager to commit to eventually
accepting these students back into their schools; this has made the establishment of the credit
recovery option challenging.
11
recognized, however, that the cadets’ career paths were limited in the long term by
having only a GED.
Finally, some directors said that they arrived at their current mix of education
options at least partially because of recruiting concerns. A director of a program
offering all three options expressed the desire for as many adolescents as possible to
attend the program and the belief that offering the most options is the most effective
way to attract the largest population. Another director remarked that, previously,
when the program was GED only, the teenagers arriving at ChalleNGe were becoming
increasingly “rougher”—more gang-affiliated, more criminal history. This director felt
that the best way to reverse that trend was to increase the options available, thus
making the program more attractive to those who want to earn their high school
diplomas and potentially even attend college.
Cadets’ general ability on standardized tests
After discussing with program directors the feasibility of increasing the number of
cadets who complete ChalleNGe with a high school diploma or with sufficient credits
recovered to return to their home high schools, we turned to the other avenue for
increasing the DOD employability of ChalleNGe graduates: improving AFQT scores.
We first asked program directors about their cadets’ overall test-taking abilities when
they arrive at ChalleNGe and then discussed the feasibility of cadets’ scoring 50 or
above on the AFQT as well as the programs’ current test-preparation efforts (to the
extent that they use any).
In terms of cadets’ overall test-taking abilities, the one theme that emerged from
nearly all interviews was that there is significant improvement from the beginning to
the end of ChalleNGe. When the cadets first arrive, they often have a defeatist
attitude and, given their history of failure in the school environment, a fear that they
will continue to fail academically. This manifests itself in the form of severe test
anxiety and often an unwillingness to fully apply themselves. It is generally easier to
accept failure when little effort has been applied. If one does not aim to achieve
success and ultimately fails, this cannot be interpreted as a lack of ability. It is not
surprising that, when cadets first arrive at ChalleNGe, many of them refuse to put
forth their best effort on the pre-TABE and other tests. As a result, it is difficult to
gauge cadets’ true academic and testing abilities on these early tests. At many
programs, however, the cadets are taught test-taking strategies and how to approach
testing with less fear and anxiety. Testing barriers can also be broken down at
programs where a significant number of tests are administered at the start of the
program (e.g., TABE placement testing); within the first few weeks at ChalleNGe,
testing becomes part of their regular routine. The cadets’ increased comfort with
testing, combined with the improvements in academic skills made over the course of
12
the program, ultimately means that they are much better test takers at the end of the
program than at the beginning.
The gains that can be made at ChalleNGe, however, are partially determined by the
cadets’ abilities on arrival. The cadets arrive with a wide distribution of academic
skills: one program director noted that his program has some cadets functioning at
the 1st or 2nd grade level and others at the 11th or 12th grade level on arrival. Although
all cadets may become more comfortable with testing by the end of the program,
their knowledge of basic academic skills will also be an important determinant of
how well they test. Some directors noted that the academic improvements made over
the course of ChalleNGe will depend partially on how the program structures its
classrooms. Some, for example, place the students in different classrooms depending
on their incoming academic abilities. Others, however, have classrooms with mixed-
ability levels. In these settings, one director noted, it can be challenging to
simultaneously teach those at the 4th grade level and those at the 11th or 12th grade
level. Thus, the ultimate test improvements made may partially depend on the
classroom structure and the extent to which cadets are able to receive the
individualized attention they need.
Directors also commented that cadets’ overall testing abilities—both at the beginning
and end of ChalleNGe—depend on other incoming characteristics as well, not just
their incoming academic skills. Those cadets, for example, who come from
households with little constructive parenting, who are from relatively poor
socioeconomic backgrounds, or who speak English as a second language (if at all) will
have more to overcome in improving their testing abilities. Realistically, the
ChalleNGe instructors and staff have only a 22-week period to work with cadets, and
the improvements that can be made over that period will depend on the “state” of
the cadet on arrival. The directors did note that, on average, testing is difficult for
their cadets. Many said that the top 20 or 25 percent of the cadets in any given class
may be comfortable test takers. That said, the large majority do not perform well on
standardized tests. This suggests that even in cases of large and significant test-
score improvements, cadets will still fall below national averages for their ages and
grade levels.
Feasibility of cadets’ scoring 50 on AFQT
After discussing cadets’ overall ability to perform well on standardized tests, we
asked the program directors to specifically comment on the feasibility of their cadets
scoring 50 or above on the AFQT. Specifically, we asked the directors, “At the end of
the ChalleNGe program, how would you characterize cadets’ ability to perform well
on standardized tests? How likely do you think it is that they could score 50 or above
on the AFQT?” They were asked to classify the likelihood of cadets scoring 50 or
above at the end of ChalleNGe as very likely, somewhat likely, not likely, or can’t say.
13
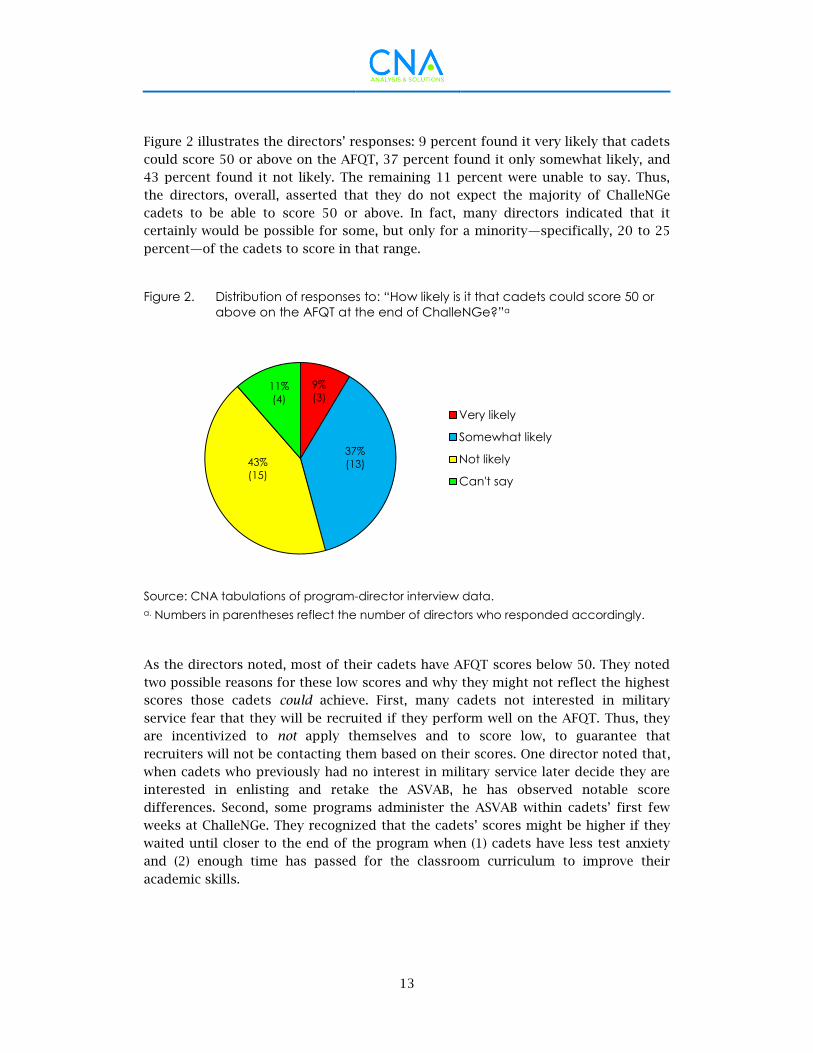
Figure 2 illustrates the directors’ responses: 9 percent found it very likely that cadets
could score 50 or above on the AFQT, 37 percent found it only somewhat likely, and
43 percent found it not likely. The remaining 11 percent were unable to say. Thus,
the directors, overall, asserted that they do not expect the majority of ChalleNGe
cadets to be able to score 50 or above. In fact, many directors indicated that it
certainly would be possible for some, but only for a minority—specifically, 20 to 25
percent—of the cadets to score in that range.
Figure 2. Distribution of responses to: “How likely is it that cadets could score 50 or
above on the AFQT at the end of ChalleNGe?”a
Source: CNA tabulations of program-director interview data.
a. Numbers in parentheses reflect the number of directors who responded accordingly.
As the directors noted, most of their cadets have AFQT scores below 50. They noted
two possible reasons for these low scores and why they might not reflect the highest
scores those cadets could achieve. First, many cadets not interested in military
service fear that they will be recruited if they perform well on the AFQT. Thus, they
are incentivized to not apply themselves and to score low, to guarantee that
recruiters will not be contacting them based on their scores. One director noted that,
when cadets who previously had no interest in military service later decide they are
interested in enlisting and retake the ASVAB, he has observed notable score
differences. Second, some programs administer the ASVAB within cadets’ first few
weeks at ChalleNGe. They recognized that the cadets’ scores might be higher if they
waited until closer to the end of the program when (1) cadets have less test anxiety
and (2) enough time has passed for the classroom curriculum to improve their
academic skills.
9%
(3)
37%
(13) 43%
(15)
11%
(4)
Very likely
Somewhat likely
Not likely
Can't say
14
We asked the directors to opine on what might be necessary to increase cadets’ test
scores. A few directors stressed the importance of presenting the ASVAB to cadets as
not just a test necessary for military enlistment, but also a way to help them
determine what career fields would be a good fit for them and identify where there
strengths lie. That is, if the ASVAB were introduced as a general battery assessment,
as opposed to a test aimed at determining whether they qualify for military service
or specific military occupations, the cadets might be more willing to apply
themselves and perform at their personal best levels.
The directors also noted that, at present, achieving higher AFQT scores is possible
for those cadets with initiative. That is, for the few cadets who are interested in
military service, they study for the test throughout their time at ChalleNGe (on their
own time) and opt to retake the ASVAB to try to improve their scores. Even for these
kids, however, the directors stated that more resources and more study materials are
needed. At present, there simply is not enough time for sufficient test preparation.
As a result, they felt that some elements of the current curriculum would have to be
sacrificed if ASVAB test preparation efforts were to become a priority.
Finally, a number of directors suggested that, to achieve a goal of higher AFQT
scores, there would have to be changes to the cadets accepted into the program.
They noted, for example, that cadets would need better academic skills at intake than
is true of the current population since those with a more established academic base
on which to build would be more capable of scoring 50 or better on the AFQT.
Similarly, one director mentioned that cadets have become increasingly younger in
recent years. The director felt that this trend would have to be reversed if higher
scores were to be achieved since older cadets arrive with more credits and a more
established academic background, enabling them to score higher on tests.
Programs’ current test preparation efforts
Finally, after getting a sense of the program directors’ opinions regarding their
cadets’ general test-taking abilities and the likelihood of cadets scoring over 50 on
the AFQT, we asked the directors what their programs currently offer by way of TABE
test preparation and whether these methods could be applied to increasing AFQT
scores. Most directors informed us that there is no specific TABE-preparation
offered. In fact, one director noted that the instructors intentionally aim not to “teach
to the test”; they teach the cadets the material necessary to improve their
fundamental skills and catch them up on material they may have missed in high
school. Although much of the course content will ultimately be aligned with TABE
content—and in that way attending class is a form of TABE preparation—they do not
focus specific efforts on maximizing cadets’ post-TABE scores or overall TABE
growth. There was, however, one director whose program does focus somewhat on
specifically preparing the cadets for the TABE because of state law that requires a
15
TABE score of 9 or higher to take the GED. For the most part, however, the only TABE
preparation the cadets receive is through the curriculum.
There are a number of program initiatives to improve cadets’ overall test-taking
abilities, and, to the extent that these can improve performance in any testing
situation, they could also be viewed as a form of TABE preparation. These include
teaching the cadets how to approach learning without memorizing, how to pace
themselves on exams to ensure that they have sufficient time for all sections, and
how to reduce test anxiety. A couple of directors noted that the most effective way to
help cadets overcome their fear of testing is to expose them to frequent and
different tests. These directors said that, with sufficient practice and exposure to a
wide range of test formats, cadets’ confidence in their ability to approach any test
notably increases.
We then asked the directors to opine on whether any of their current test-
preparation efforts (whether general or specific) might be effective in increasing the
likelihood that cadets could score 50 or above on the AFQT. A few directors did not
think there was anything they could do in-house to help with AFQT preparation and
that spending time on AFQT preparation would not really benefit the cadets. Some
even felt that any time spent on AFQT preparation would be detrimental—taking
away from other valuable aspects of the program. Others noted that any test-
preparation efforts that help improve testing skills in general should also help
improve AFQT scores, even though they may not have specifically prepared the
cadets for the AFQT content.
Some directors mentioned ASVAB/AFQT preparation tools already at the cadets’
disposal, including available ASVAB tutors, ASVAB books and study guides (some
computer based), and ASVAB study groups directed by the National Guard. In
addition, the cadets can prepare for the ASVAB during study hall and attend other
voluntary preparation sessions. In all of these cases, however, the initiative rests with
the cadet. These resources are at their disposal, but cadets have to initiate obtaining
a tutor, attending study groups, and using the available study guides and computer
programs. In one case, the ASVAB is taken only by cadets who express interest in
joining the military because the test is administered only at the nearest Military
Entrance Processing Station. It seems unlikely that any of the currently available
resources or test preparation efforts will be effective in increasing the cadets’ AFQT
scores unless the cadets are motivated to prepare and fully apply themselves to the
test. We learned that one director’s program uses ASVAB scores as one factor in
determining which cadets get scholarships for continuing education. If more
programs were able to make the test have meaning for the cadets (perhaps in terms
of helping them to determine which career fields they are best suited to), it could
provide an additional incentive for all cadets to apply themselves and strive to
achieve the best score possible, even if they are not interested in joining the military.
16
Other challenges to matriculating high-
quality recruits
Most ChalleNGe directors lamented that, even if the majority of ChalleNGe graduates
were able to score 50 or above on the AFQT or had a high school diploma, it would
still be difficult to place most of them in a productive post-ChalleNGe environment
(whether in the military, in other employment, or in college). As the directors noted,
military recruiters are hesitant to write waivers unless they are necessary for meeting
accession missions, and the ChalleNGe graduates often have multiple characteristics
or behavioral patterns that would make a waiver necessary for enlistment. Many
ChalleNGe graduates, for example, are disqualified from service for tattoos, behavior
modification medications (such as Ritalin for ADHD), asthma, eyeglass prescriptions,
a history of recreational drug use, or a history of criminal activity. In addition, only
17 and 18 year olds can enlist, and the 17 year olds would need parental approval;
many of the ChalleNGe cadets come from broken homes and lack the necessary
parental support.
The ChalleNGe graduates’ ages are problematic not only for military enlistment but
also for finding civilian-sector employment. As the directors explained, most
employers are not willing to hire 16- or 17-year-olds, owing to either legal constraints
or previous experiences with unreliable minors. As one director put it, “These kids
need instruction on job readiness—how to [not only] find but also keep a job.”
ChalleNGe graduates are also affected, of course, by variation in the state and
regional labor markets. A few directors noted that job opportunities in their
particular areas are slim to nonexistent, making it difficult for the ChalleNGe
graduates to reintegrate themselves as successful members of society. Other
employment challenges include transportation (most graduates do not have a
driver’s license), visible tattoos, and criminal history.
Finally, college enrollment is also a challenge. Four-year colleges or universities will
not admit students who are under 18 years of age (or until their cohort has
graduated from high school). Thus, if the ChalleNGe graduates complete the program
prior to when they would have graduated from high school and are not yet 18 years
old, they will not be able to enroll in a four-year school. In addition, one director
noted that many colleges and universities will not accept ChalleNGe graduates
because they did not attend a traditional, brick-and-mortar high school. Overall, the
directors said that age was the most significant barrier to successfully placing their
graduates. Their 16- and 17-year-old graduates are unable to find employment,
unable to enroll in college, and unable to enlist.
17
Test-Score Conversion Results
Equipercentile linking
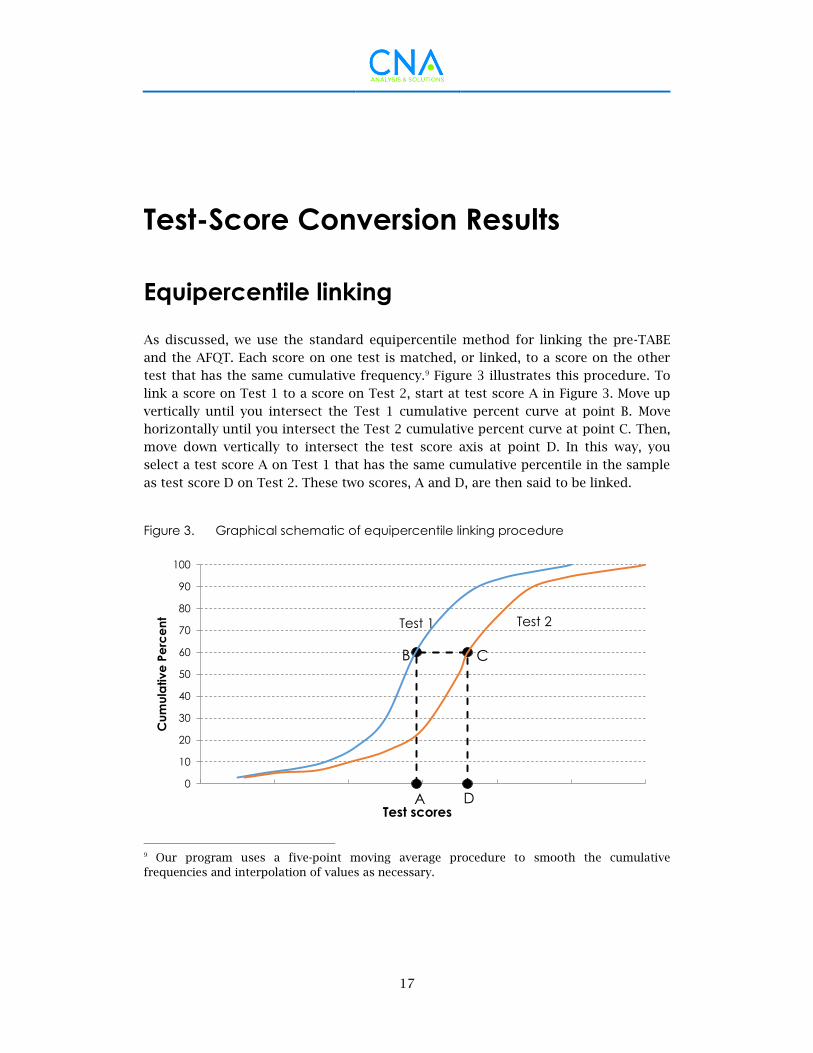
As discussed, we use the standard equipercentile method for linking the pre-TABE
and the AFQT. Each score on one test is matched, or linked, to a score on the other
test that has the same cumulative frequency.9 Figure 3 illustrates this procedure. To
link a score on Test 1 to a score on Test 2, start at test score A in Figure 3. Move up
vertically until you intersect the Test 1 cumulative percent curve at point B. Move
horizontally until you intersect the Test 2 cumulative percent curve at point C. Then,
move down vertically to intersect the test score axis at point D. In this way, you
select a test score A on Test 1 that has the same cumulative percentile in the sample
as test score D on Test 2. These two scores, A and D, are then said to be linked.
Figure 3. Graphical schematic of equipercentile linking procedure
9 Our program uses a five-point moving average procedure to smooth the cumulative
frequencies and interpolation of values as necessary.
0
10
20
30
40
50
60
70
80
90
100
Cu
mu
lativ
e P
erc
en
t
Test scores
Test 2
Test 1
B C
D A
18
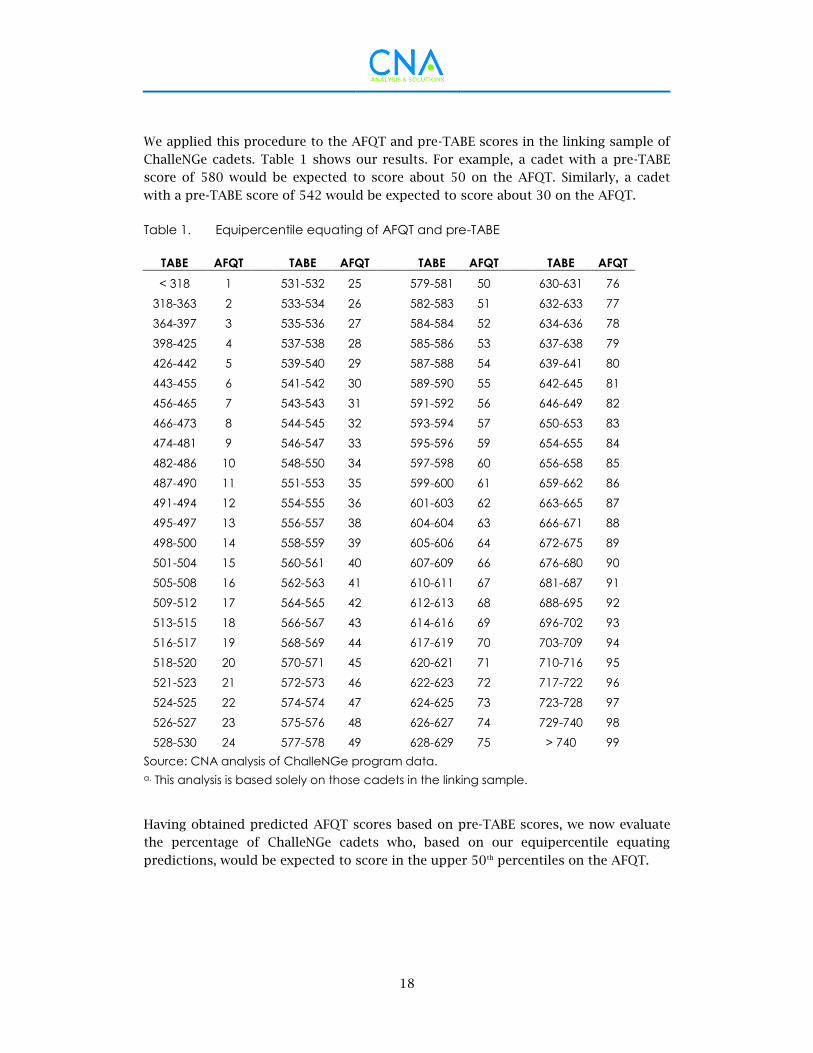
We applied this procedure to the AFQT and pre-TABE scores in the linking sample of
ChalleNGe cadets. Table 1 shows our results. For example, a cadet with a pre-TABE
score of 580 would be expected to score about 50 on the AFQT. Similarly, a cadet
with a pre-TABE score of 542 would be expected to score about 30 on the AFQT.
Table 1. Equipercentile equating of AFQT and pre-TABE
TABE AFQT
TABE AFQT
TABE AFQT
TABE AFQT
< 318 1
531-532 25
579-581 50
630-631 76
318-363 2
533-534 26
582-583 51
632-633 77
364-397 3
535-536 27
584-584 52
634-636 78
398-425 4
537-538 28
585-586 53
637-638 79
426-442 5
539-540 29
587-588 54
639-641 80
443-455 6
541-542 30
589-590 55
642-645 81
456-465 7
543-543 31
591-592 56
646-649 82
466-473 8
544-545 32
593-594 57
650-653 83
474-481 9
546-547 33
595-596 59
654-655 84
482-486 10
548-550 34
597-598 60
656-658 85
487-490 11
551-553 35
599-600 61
659-662 86
491-494 12
554-555 36
601-603 62
663-665 87
495-497 13
556-557 38
604-604 63
666-671 88
498-500 14
558-559 39
605-606 64
672-675 89
501-504 15
560-561 40
607-609 66
676-680 90
505-508 16
562-563 41
610-611 67
681-687 91
509-512 17
564-565 42
612-613 68
688-695 92
513-515 18
566-567 43
614-616 69
696-702 93
516-517 19
568-569 44
617-619 70
703-709 94
518-520 20
570-571 45
620-621 71
710-716 95
521-523 21
572-573 46
622-623 72
717-722 96
524-525 22
574-574 47
624-625 73
723-728 97
526-527 23
575-576 48
626-627 74
729-740 98
528-530 24
577-578 49
628-629 75
> 740 99
Source: CNA analysis of ChalleNGe program data.
a. This analysis is based solely on those cadets in the linking sample.
Having obtained predicted AFQT scores based on pre-TABE scores, we now evaluate
the percentage of ChalleNGe cadets who, based on our equipercentile equating
predictions, would be expected to score in the upper 50th percentiles on the AFQT.
19
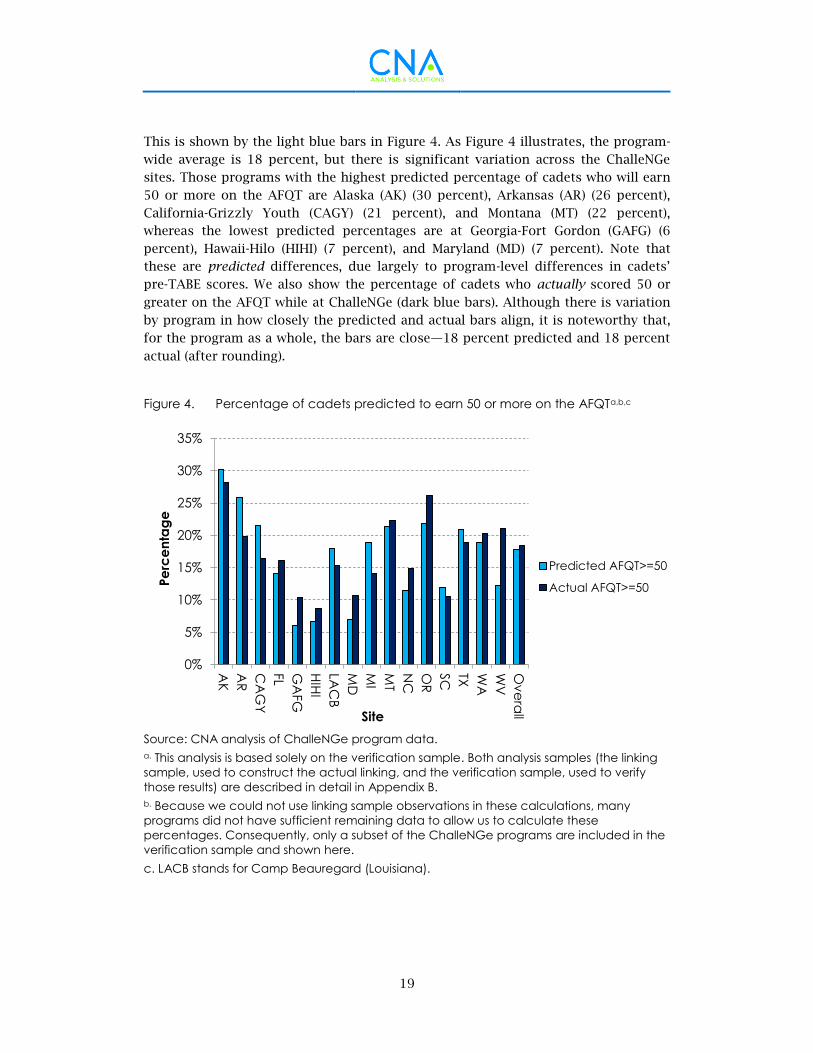
This is shown by the light blue bars in Figure 4. As Figure 4 illustrates, the program-
wide average is 18 percent, but there is significant variation across the ChalleNGe
sites. Those programs with the highest predicted percentage of cadets who will earn
50 or more on the AFQT are Alaska (AK) (30 percent), Arkansas (AR) (26 percent),
California-Grizzly Youth (CAGY) (21 percent), and Montana (MT) (22 percent),
whereas the lowest predicted percentages are at Georgia-Fort Gordon (GAFG) (6
percent), Hawaii-Hilo (HIHI) (7 percent), and Maryland (MD) (7 percent). Note that
these are predicted differences, due largely to program-level differences in cadets’
pre-TABE scores. We also show the percentage of cadets who actually scored 50 or
greater on the AFQT while at ChalleNGe (dark blue bars). Although there is variation
by program in how closely the predicted and actual bars align, it is noteworthy that,
for the program as a whole, the bars are close—18 percent predicted and 18 percent
actual (after rounding).
Figure 4. Percentage of cadets predicted to earn 50 or more on the AFQTa,b,c
Source: CNA analysis of ChalleNGe program data.
a. This analysis is based solely on the verification sample. Both analysis samples (the linking
sample, used to construct the actual linking, and the verification sample, used to verify
those results) are described in detail in Appendix B.
b. Because we could not use linking sample observations in these calculations, many
programs did not have sufficient remaining data to allow us to calculate these
percentages. Consequently, only a subset of the ChalleNGe programs are included in the
verification sample and shown here.
c. LACB stands for Camp Beauregard (Louisiana).
0%
5%
10%
15%
20%
25%
30%
35%
AK
AR
CA
GY
FL
GA
FG
HIH
I
LAC
B
MD
MI
MT
NC
OR
SC
TX WA
WV
Ov
era
ll
Pe
rce
nta
ge
Site
Predicted AFQT>=50
Actual AFQT>=50
20
Verification of linking results
Finally, it is important to verify that our results are valid in general and also apply to
cadets who are not in our linking sample. As we show in Table 3 in Appendix B, there
is not much overlap of sites in the linking and verification samples. Thus, if there
were any site-specific peculiarities in our linkage results, they would likely result in
poor agreement between the actual AFQT distribution in our verification sample and
the predicted AFQT distribution in our linking sample. We verify our results by using
the Table 1 results to estimate AFQT scores based on cadets’ pre-TABE scores; we
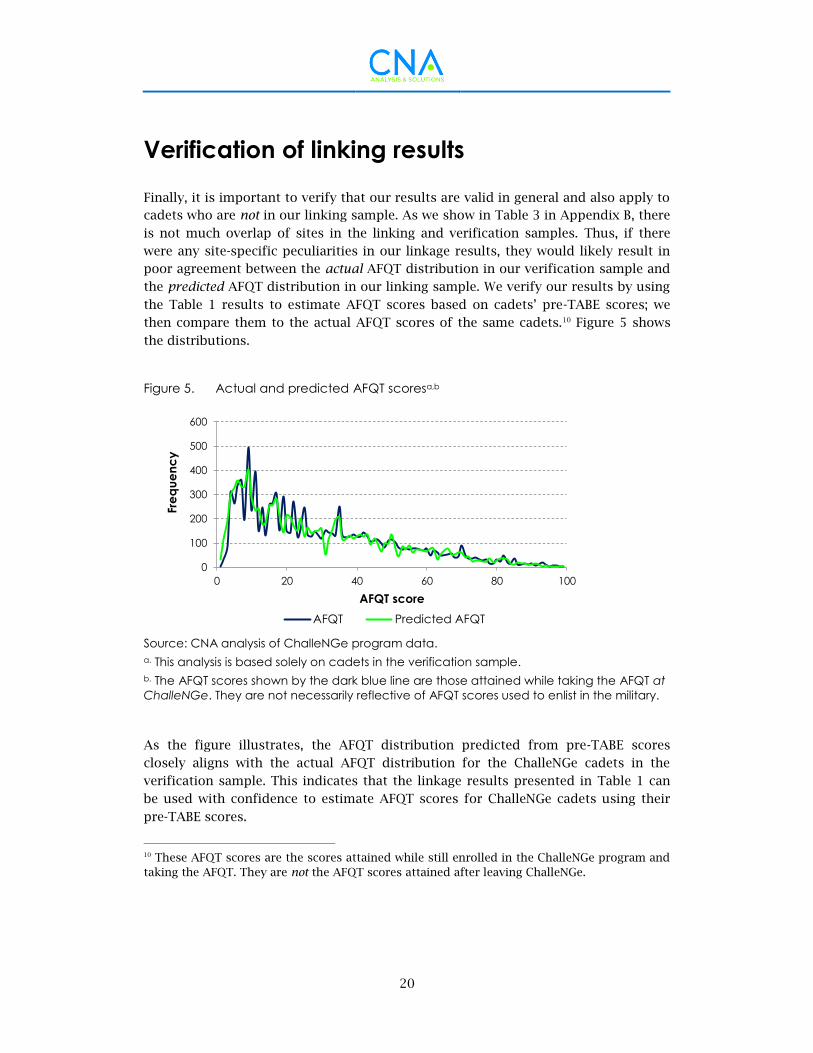
then compare them to the actual AFQT scores of the same cadets.10 Figure 5 shows
the distributions.
Figure 5. Actual and predicted AFQT scoresa,b
Source: CNA analysis of ChalleNGe program data.
a. This analysis is based solely on cadets in the verification sample.
b. The AFQT scores shown by the dark blue line are those attained while taking the AFQT at
ChalleNGe. They are not necessarily reflective of AFQT scores used to enlist in the military.
As the figure illustrates, the AFQT distribution predicted from pre-TABE scores
closely aligns with the actual AFQT distribution for the ChalleNGe cadets in the
verification sample. This indicates that the linkage results presented in Table 1 can
be used with confidence to estimate AFQT scores for ChalleNGe cadets using their
pre-TABE scores.
10 These AFQT scores are the scores attained while still enrolled in the ChalleNGe program and
taking the AFQT. They are not the AFQT scores attained after leaving ChalleNGe.
0
100
200
300
400
500
600
0 20 40 60 80 100
Fre
qu
en
cy
AFQT score
AFQT Predicted AFQT
21
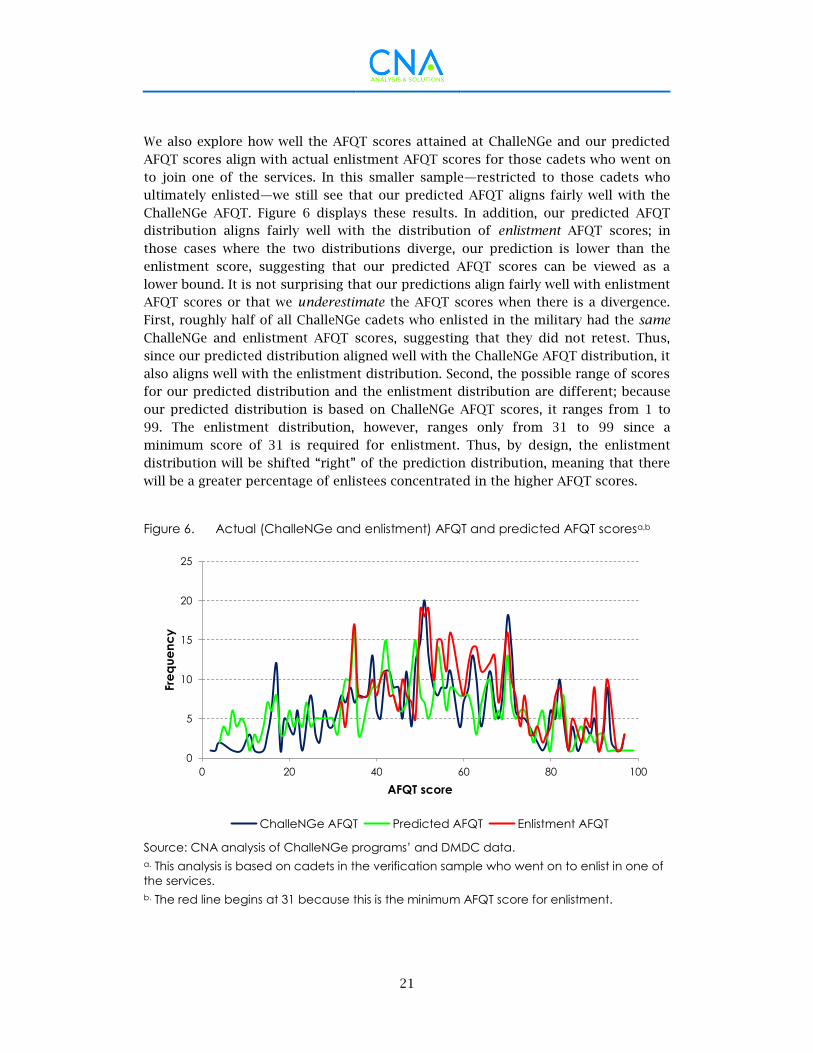
We also explore how well the AFQT scores attained at ChalleNGe and our predicted
AFQT scores align with actual enlistment AFQT scores for those cadets who went on
to join one of the services. In this smaller sample—restricted to those cadets who
ultimately enlisted—we still see that our predicted AFQT aligns fairly well with the
ChalleNGe AFQT. Figure 6 displays these results. In addition, our predicted AFQT
distribution aligns fairly well with the distribution of enlistment AFQT scores; in
those cases where the two distributions diverge, our prediction is lower than the
enlistment score, suggesting that our predicted AFQT scores can be viewed as a
lower bound. It is not surprising that our predictions align fairly well with enlistment
AFQT scores or that we underestimate the AFQT scores when there is a divergence.
First, roughly half of all ChalleNGe cadets who enlisted in the military had the same
ChalleNGe and enlistment AFQT scores, suggesting that they did not retest. Thus,
since our predicted distribution aligned well with the ChalleNGe AFQT distribution, it
also aligns well with the enlistment distribution. Second, the possible range of scores
for our predicted distribution and the enlistment distribution are different; because
our predicted distribution is based on ChalleNGe AFQT scores, it ranges from 1 to
99. The enlistment distribution, however, ranges only from 31 to 99 since a
minimum score of 31 is required for enlistment. Thus, by design, the enlistment
distribution will be shifted “right” of the prediction distribution, meaning that there
will be a greater percentage of enlistees concentrated in the higher AFQT scores.
Figure 6. Actual (ChalleNGe and enlistment) AFQT and predicted AFQT scoresa,b
Source: CNA analysis of ChalleNGe programs’ and DMDC data.
a. This analysis is based on cadets in the verification sample who went on to enlist in one of
the services.
b. The red line begins at 31 because this is the minimum AFQT score for enlistment.
0
5
10
15
20
25
0 20 40 60 80 100
Fre
qu
en
cy
AFQT score
ChalleNGe AFQT Predicted AFQT Enlistment AFQT
22
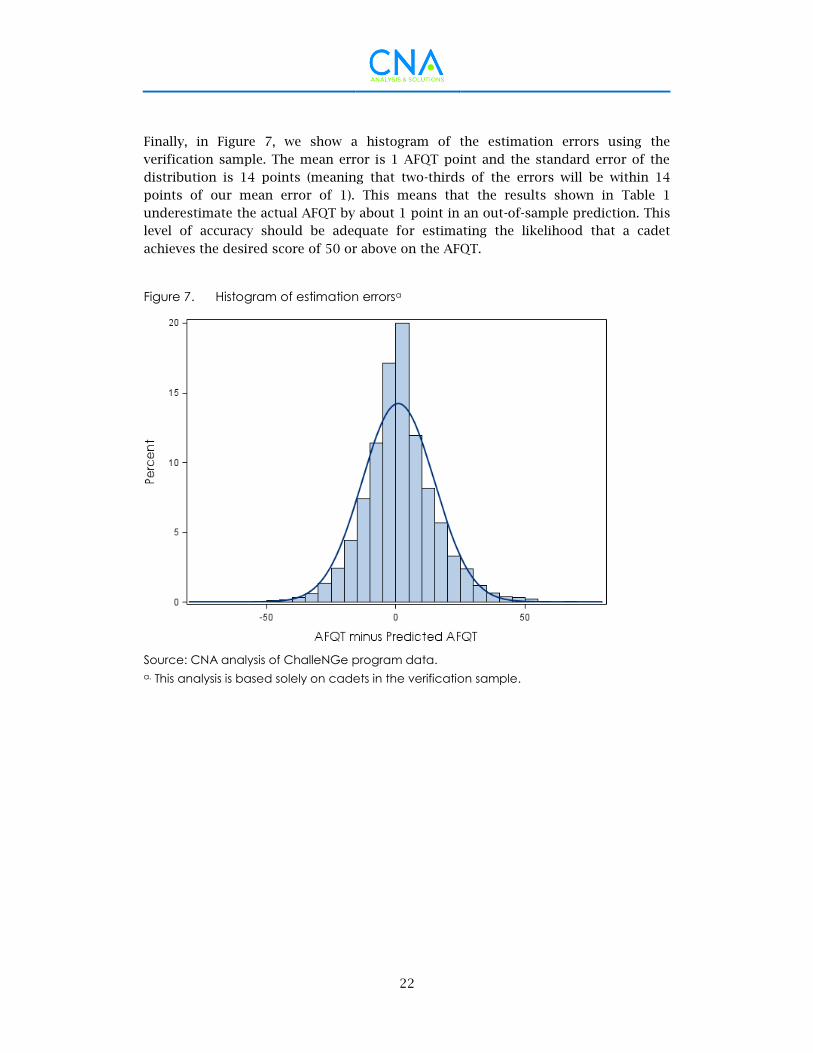
Finally, in Figure 7, we show a histogram of the estimation errors using the
verification sample. The mean error is 1 AFQT point and the standard error of the
distribution is 14 points (meaning that two-thirds of the errors will be within 14
points of our mean error of 1). This means that the results shown in Table 1
underestimate the actual AFQT by about 1 point in an out-of-sample prediction. This
level of accuracy should be adequate for estimating the likelihood that a cadet
achieves the desired score of 50 or above on the AFQT.
Figure 7. Histogram of estimation errorsa
Source: CNA analysis of ChalleNGe program data.
a. This analysis is based solely on cadets in the verification sample.
23
Comparing ChalleNGe Graduates
With Other Recruits
In this section, we compare the AFQT scores and attrition probabilities of ChalleNGe
graduates with those of other enlisted servicemembers. Although we begin this
discussion by comparing enlisted ChalleNGe graduates with all other enlisted
servicemembers, we ultimately focus the comparison on Tier 2 and Tier 3 recruits
since these are other groups of enlistees who typically have lower test scores and a
higher propensity to attrite, likely because of their nontraditional educational
backgrounds.
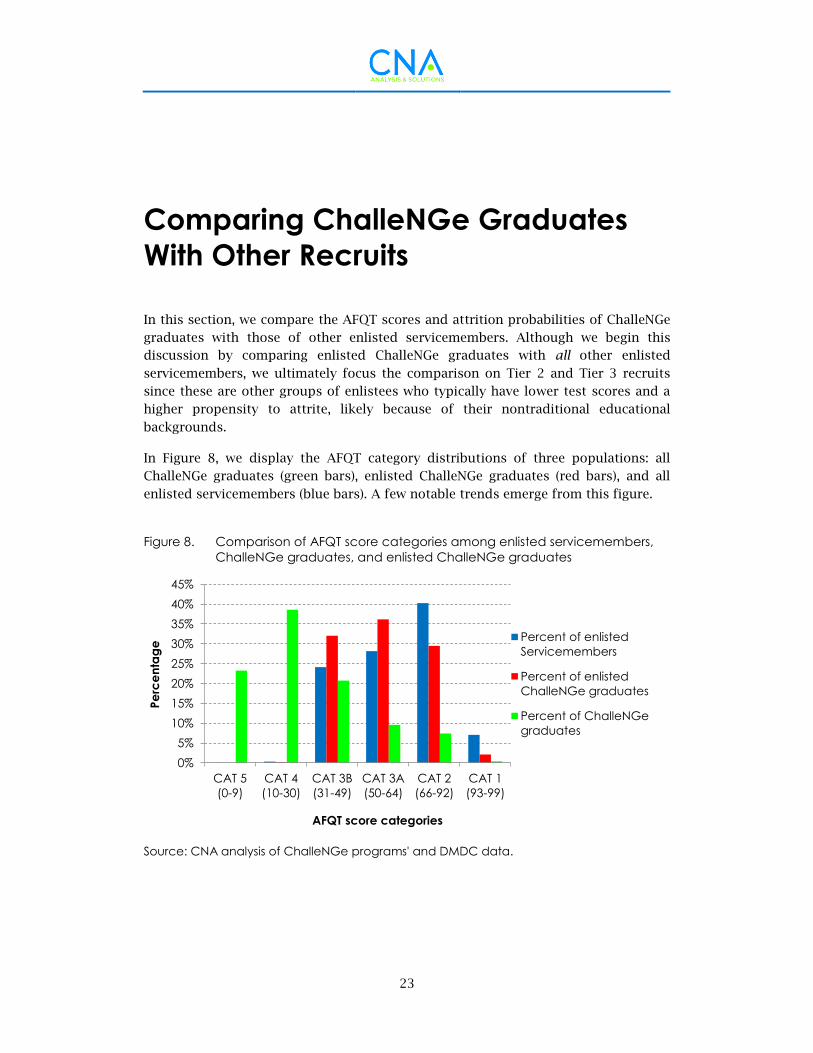
In Figure 8, we display the AFQT category distributions of three populations: all
ChalleNGe graduates (green bars), enlisted ChalleNGe graduates (red bars), and all
enlisted servicemembers (blue bars). A few notable trends emerge from this figure.
Figure 8. Comparison of AFQT score categories among enlisted servicemembers,
ChalleNGe graduates, and enlisted ChalleNGe graduates
Source: CNA analysis of ChalleNGe programs' and DMDC data.
0%
5%
10%
15%
20%
25%
30%
35%
40%
45%
CAT 5
(0-9)
CAT 4
(10-30)
CAT 3B
(31-49)
CAT 3A
(50-64)
CAT 2
(66-92)
CAT 1
(93-99)
Pe
rce
nta
ge
AFQT score categories
Percent of enlisted
Servicemembers
Percent of enlisted
ChalleNGe graduates
Percent of ChalleNGe
graduates
24
First, Category (CAT) 4 (AFQT scores 10-30) and CAT 5 (0-9) are effectively populated
by the ChalleNGe graduates only, since DOD policy is that CAT 4 recruits comprise at
most four percent of all recruits and no CAT 5 applicants are eligible to enlist.
Therefore, the distributions of enlisted servicemembers (ChalleNGe graduates or not)
are necessarily shifted to the right as compared to the distribution of all ChalleNGe
graduates. Second, among enlisted servicemembers, ChalleNGe graduates are notably
more likely to score in the CAT 3A (50-64) and CAT 3B (31-49) ranges than their non-
ChalleNGe counterparts. Finally, the group most likely to have the highest AFQT
scores—in CATs 1 and 2—are the non-ChalleNGe enlisted.
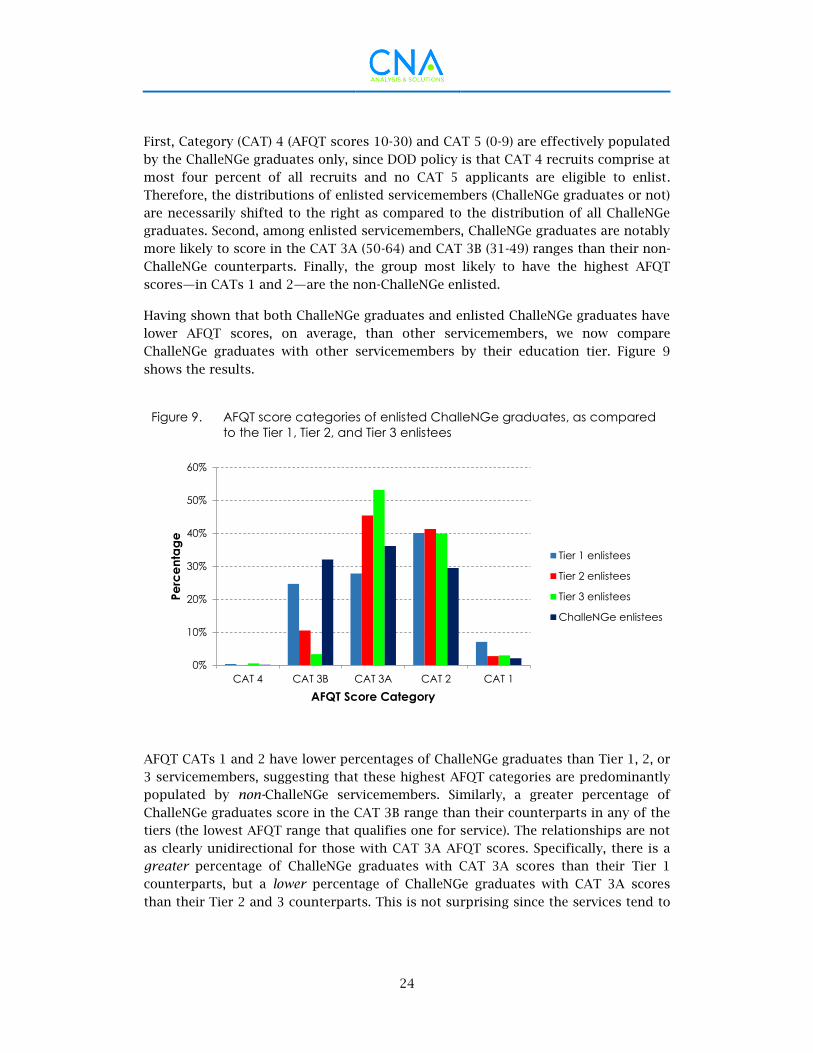
Having shown that both ChalleNGe graduates and enlisted ChalleNGe graduates have
lower AFQT scores, on average, than other servicemembers, we now compare
ChalleNGe graduates with other servicemembers by their education tier. Figure 9
shows the results.
Figure 9. AFQT score categories of enlisted ChalleNGe graduates, as compared
to the Tier 1, Tier 2, and Tier 3 enlistees
AFQT CATs 1 and 2 have lower percentages of ChalleNGe graduates than Tier 1, 2, or
3 servicemembers, suggesting that these highest AFQT categories are predominantly
populated by non-ChalleNGe servicemembers. Similarly, a greater percentage of
ChalleNGe graduates score in the CAT 3B range than their counterparts in any of the
tiers (the lowest AFQT range that qualifies one for service). The relationships are not
as clearly unidirectional for those with CAT 3A AFQT scores. Specifically, there is a
greater percentage of ChalleNGe graduates with CAT 3A scores than their Tier 1
counterparts, but a lower percentage of ChalleNGe graduates with CAT 3A scores
than their Tier 2 and 3 counterparts. This is not surprising since the services tend to
0%
10%
20%
30%
40%
50%
60%
CAT 4 CAT 3B CAT 3A CAT 2 CAT 1
Pe
rce
nta
ge
AFQT Score Category
Tier 1 enlistees
Tier 2 enlistees
Tier 3 enlistees
ChalleNGe enlistees
25
require higher AFQT scores of recruits with lower education credentials—namely,
less than a high school diploma. As a result, Tier 2 and 3 recruits are less likely to
access with CAT 3A scores (typically the lowest qualifying category) than are Tier 1
recruits, who do not have an additional test score requirement levied on them. CAT
3A starts at 50, which implies that ChalleNGe enlistees are less likely than their Tier
2 and 3 counterparts to score in the upper 50th percentiles on the AFQT. To the
extent that those servicemembers with lower AFQT scores are more likely to attrite—
which has been shown historically—the services may not be willing to take the
attrition risks inherent in accessing ChalleNGe graduates.
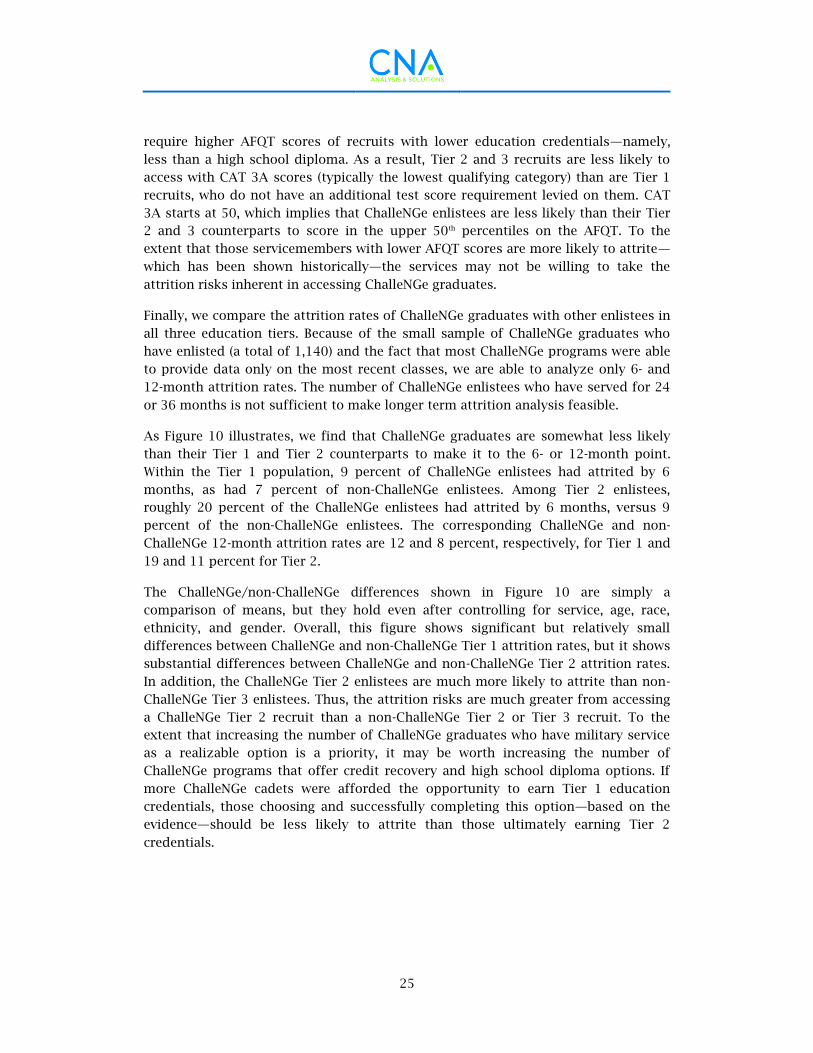
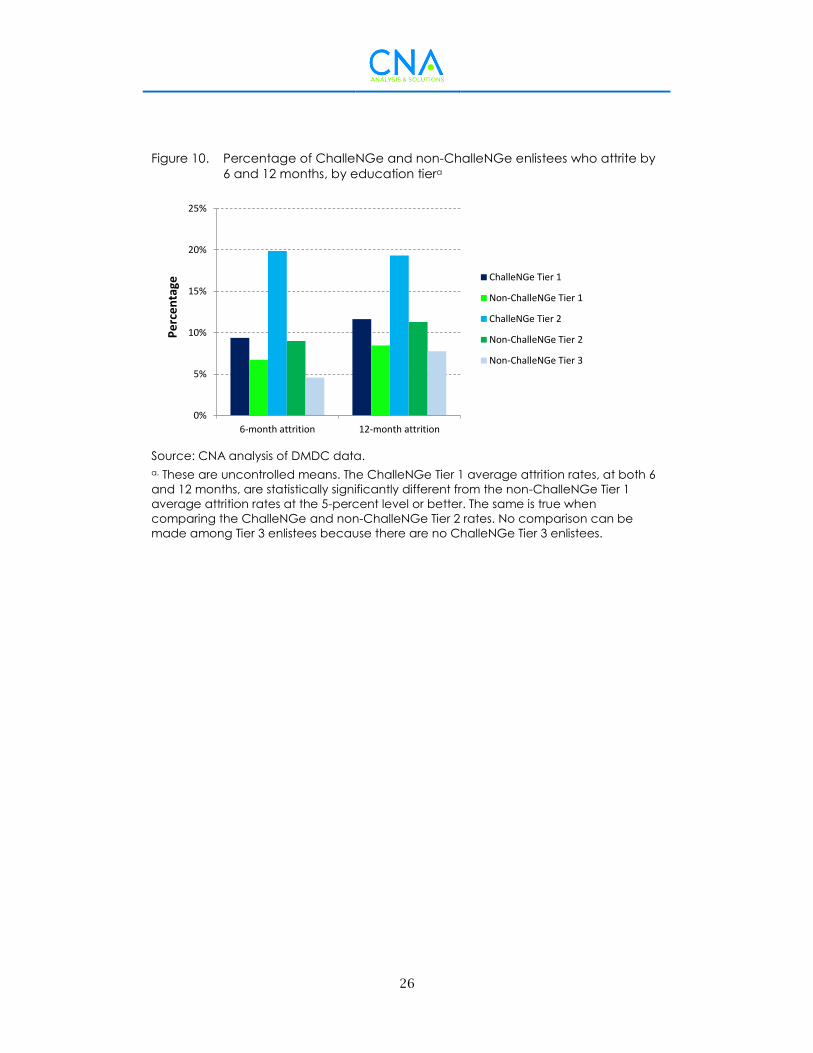
Finally, we compare the attrition rates of ChalleNGe graduates with other enlistees in
all three education tiers. Because of the small sample of ChalleNGe graduates who
have enlisted (a total of 1,140) and the fact that most ChalleNGe programs were able
to provide data only on the most recent classes, we are able to analyze only 6- and
12-month attrition rates. The number of ChalleNGe enlistees who have served for 24
or 36 months is not sufficient to make longer term attrition analysis feasible.
As Figure 10 illustrates, we find that ChalleNGe graduates are somewhat less likely
than their Tier 1 and Tier 2 counterparts to make it to the 6- or 12-month point.
Within the Tier 1 population, 9 percent of ChalleNGe enlistees had attrited by 6
months, as had 7 percent of non-ChalleNGe enlistees. Among Tier 2 enlistees,
roughly 20 percent of the ChalleNGe enlistees had attrited by 6 months, versus 9
percent of the non-ChalleNGe enlistees. The corresponding ChalleNGe and non-
ChalleNGe 12-month attrition rates are 12 and 8 percent, respectively, for Tier 1 and
19 and 11 percent for Tier 2.
The ChalleNGe/non-ChalleNGe differences shown in Figure 10 are simply a
comparison of means, but they hold even after controlling for service, age, race,
ethnicity, and gender. Overall, this figure shows significant but relatively small
differences between ChalleNGe and non-ChalleNGe Tier 1 attrition rates, but it shows
substantial differences between ChalleNGe and non-ChalleNGe Tier 2 attrition rates.
In addition, the ChalleNGe Tier 2 enlistees are much more likely to attrite than non-
ChalleNGe Tier 3 enlistees. Thus, the attrition risks are much greater from accessing
a ChalleNGe Tier 2 recruit than a non-ChalleNGe Tier 2 or Tier 3 recruit. To the
extent that increasing the number of ChalleNGe graduates who have military service
as a realizable option is a priority, it may be worth increasing the number of
ChalleNGe programs that offer credit recovery and high school diploma options. If
more ChalleNGe cadets were afforded the opportunity to earn Tier 1 education
credentials, those choosing and successfully completing this option—based on the
evidence—should be less likely to attrite than those ultimately earning Tier 2
credentials.
26
Figure 10. Percentage of ChalleNGe and non-ChalleNGe enlistees who attrite by
6 and 12 months, by education tiera
Source: CNA analysis of DMDC data.
a. These are uncontrolled means. The ChalleNGe Tier 1 average attrition rates, at both 6
and 12 months, are statistically significantly different from the non-ChalleNGe Tier 1
average attrition rates at the 5-percent level or better. The same is true when
comparing the ChalleNGe and non-ChalleNGe Tier 2 rates. No comparison can be
made among Tier 3 enlistees because there are no ChalleNGe Tier 3 enlistees.
0%
5%
10%
15%
20%
25%
6-month attrition 12-month attrition
Pe
rce
nta
ge ChalleNGe Tier 1
Non-ChalleNGe Tier 1
ChalleNGe Tier 2
Non-ChalleNGe Tier 2
Non-ChalleNGe Tier 3
27
Conclusion
In this report, we have evaluated the likelihood of ChalleNGe graduates becoming
successful military enlistees, which—owing to DOD’s and the services’ focus on
accessing Tier 1 and high-quality recruits—requires a traditional high school diploma
and an AFQT score of 50 or higher. We used a three-pronged approach, gathering
inputs from program directors, conducting a test-score equating (based on pre-TABE
scores) to determine the percentage of ChalleNGe graduates that could be expected
to score above 50 on the AFQT, and evaluating the test scores and early performance
of those who joined the military. Our findings indicate that ChalleNGe is not likely to
become a more prominent accession source for the services.
ChalleNGe program directors voiced real and important concerns regarding the
program’s ability to produce more Tier 1 and/or high-quality recruits. The primary
mechanism for making more ChalleNGe graduates eligible for Tier 1 status would be
to matriculate more cadets with high school diplomas or via the credit recovery
option, which allows them to return to their home high schools and complete their
education. Many cadets, however, arrive at ChalleNGe with insufficient high school
credits or TABE scores to be eligible for the credit recovery or high school diploma
options; they simply cannot get to the necessary academic levels to receive a diploma
or successfully return to high school by the end of the 22 weeks at ChalleNGe.
Many programs do not offer high school diploma or credit recovery options.
Directors of these programs expressed significant barriers to adding these
educational options, including the necessary agreements with local schools and
departments of education and what the directors characterized as burdensome state
requirements (a minimum number of seat-time hours, a second-language program,
etc.). Meeting these requirements, the directors felt, would begin to turn ChalleNGe
into a traditional school, precisely the environment in which the cadets do not have
great trust or a history of positive experiences. Reaching an objective of higher AFQT
scores for a majority of cadets would require fundamental changes to the program,
and perhaps more stringent requirements on incoming academic performance—
changes the directors felt would conflict with the program’s mission and philosophy.
Our test-score conversion results and analysis of ChalleNGe graduates who have
enlisted reveal that AFQT scores of 50 and above are currently out of reach for the
majority of ChalleNGe graduates. Specifically, we predict that only 18 percent of
ChalleNGe graduates, program wide, have the academic knowledge and testing
28
abilities to achieve such scores. It is likely that this is partially because the ChalleNGe
programs’ instruction tends to be TABE-centric (i.e., the immediate goals are to
develop the more basic and fundamental skills that many of the cadets lack) and
partially because the academic content on the TABE and AFQT is not perfectly
aligned. The TABE-AFQT misalignment is revealed by the fact that significant TABE
gains are made by cadets over the course of the program, but time in the program
has a very small effect on AFQT score. If the ChalleNGe program were to adopt an
objective of increasing AFQT scores, the current curriculum construct would need to
be reevaluated. Such program changes, however, would need to be considered
carefully to ensure that they are not made at the expense of the cadets’ overall
personal growth and the programs’ ability to prepare them to be successful,
independent adults. In addition, if the test-score conversion results are going to be
used to predict the percentage of cadets who qualify for military service or who can
score 50 on the AFQT, it will have to be updated to reflect any changes made in the
programs’ objectives.
Our analysis of ChalleNGe graduates who have gone on to enlist in the military
reveals that they have struggled to make the transition to becoming successful
servicemembers. Compared with other servicemembers, we find that ChalleNGe
graduates’ incoming AFQT scores are noticeably lower. In addition, ChalleNGe Tier 1
enlistees attrite by 6 and 12 months at somewhat higher rates than their non-
ChalleNGe counterparts, while ChalleNGe Tier 2 enlistees attrite at roughly double
the rates for their non-ChalleNGe counterparts. An important caveat to these
findings is that we suspect that the cadets choosing the credit recovery option and
ultimately receiving a diploma from their home high schools appear in the DMDC
data as regular high school graduates. If those graduates have lower attrition rates
than other ChalleNGe graduates, that could skew our results. Moving forward, it is
therefore essential that DMDC and ChalleNGe determine appropriate education
coding for such recruits. Our reported attrition rate differences suggest that an
increase in the number of ChalleNGe graduates enlisting with Tier 1 education
credentials could lower their overall attrition rates. However, as the program
directors note, it would likely require a significant revamping of the ChalleNGe
program, with significant shifts in the program’s focus, for cadets to become a more
sizable and successful accession source. The decision to prioritize the number of
Tier 1 ChalleNGe graduates—thus making ChalleNGe a more viable accession
source—is one that will have to be carefully weighed, taking into consideration
whether such a shift is contradictory to the program’s mission and current goals.
That said, these findings are based on current and historical data, and a
prioritization of Tier 1 and high-quality ChalleNGe graduates would likely come with
other policy changes. If, for example, a minimum TABE score were required for
ChalleNGe admission, this could have positive, long-term impacts for ChalleNGe
graduates. Our previous work has shown that cadets with higher initial reading and
applied math TABE scores are more likely to complete ChalleNGe. In addition, those
29
graduates who go on to enlist will have more choice in their military occupational
specialty. Many occupations have a minimum AFQT requirement, and ChalleNGe
cadets admitted to the program with higher TABE scores would be more likely to
reach this minimum by the program’s end. Having greater choice in their military
occupational specialty would likely result in greater job satisfaction, perhaps
ultimately lowering ChalleNGe graduate attrition. In addition to a TABE score
minimum, another policy option for increasing ChalleNGe’s population of Tier 1 and
high-quality recruits would be to increase the age restriction. At present, the
ChalleNGe program serves 16- to 18-year-olds. Increasing the minimum age to 17
could increase the number of cadets able to complete their high school diplomas
while at ChalleNGe. In turn, this could increase the number of ChalleNGe graduates
who are immediately able to enlist in the services. If DOD wants the ChalleNGe
program to become more of a direct accession pipeline, raising the minimum age
could help achieve this. Thus, although current policy and data do not bode well for
dramatically increasing the number of Tier 1 and high-quality ChalleNGe graduates,
it could be feasible with the right policy changes. The specifics of these changes will
likely require further analysis.
We do recommend that the ChalleNGe program consider standardizing when the
cadets take the AFQT as well as how the AFQT is being presented to them. On one
hand, if the programs are using the AFQT as an aptitude test and career-counseling
tool—to identify the areas in which the cadets have strengths and in which they can
develop achievable career goals—the test should be given early in the program, to
inform the goals set for cadets throughout the rest of the program. If the test is to be
used in this way, it should be presented to cadets accordingly so that they
understand how they will benefit by performing to the best of their abilities. On the
other hand, if the test is presented as a possible recruiting tool and as a way to
determine whether the cadets will qualify for military service and what military
occupational choices might be available to them, cadets may have an incentive to
underperform on the AFQT. Those who have no interest in military service and do
not want to be contacted by military recruiters, for example, might intentionally
score low. The test scores might be more accurate reflections of cadets’ abilities, and
more useful for research, if cadets were incentivized to perform at their best.
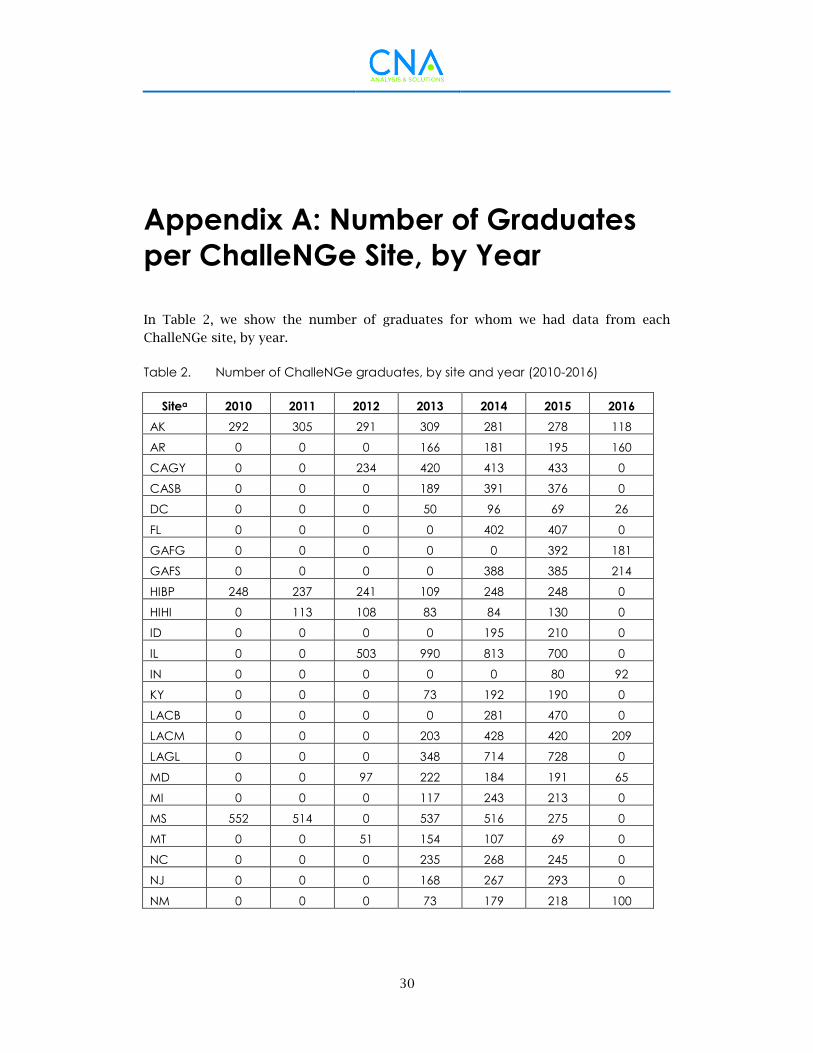
30
Appendix A: Number of Graduates
per ChalleNGe Site, by Year
In Table 2, we show the number of graduates for whom we had data from each
ChalleNGe site, by year.
Table 2. Number of ChalleNGe graduates, by site and year (2010-2016)
Sitea 2010 2011 2012 2013 2014 2015 2016
AK 292 305 291 309 281 278 118
AR 0 0 0 166 181 195 160
CAGY 0 0 234 420 413 433 0
CASB 0 0 0 189 391 376 0
DC 0 0 0 50 96 69 26
FL 0 0 0 0 402 407 0
GAFG 0 0 0 0 0 392 181
GAFS 0 0 0 0 388 385 214
HIBP 248 237 241 109 248 248 0
HIHI 0 113 108 83 84 130 0
ID 0 0 0 0 195 210 0
IL 0 0 503 990 813 700 0
IN 0 0 0 0 0 80 92
KY 0 0 0 73 192 190 0
LACB 0 0 0 0 281 470 0
LACM 0 0 0 203 428 420 209
LAGL 0 0 0 348 714 728 0
MD 0 0 97 222 184 191 65
MI 0 0 0 117 243 213 0
MS 552 514 0 537 516 275 0
MT 0 0 51 154 107 69 0
NC 0 0 0 235 268 245 0
NJ 0 0 0 168 267 293 0
NM 0 0 0 73 179 218 100
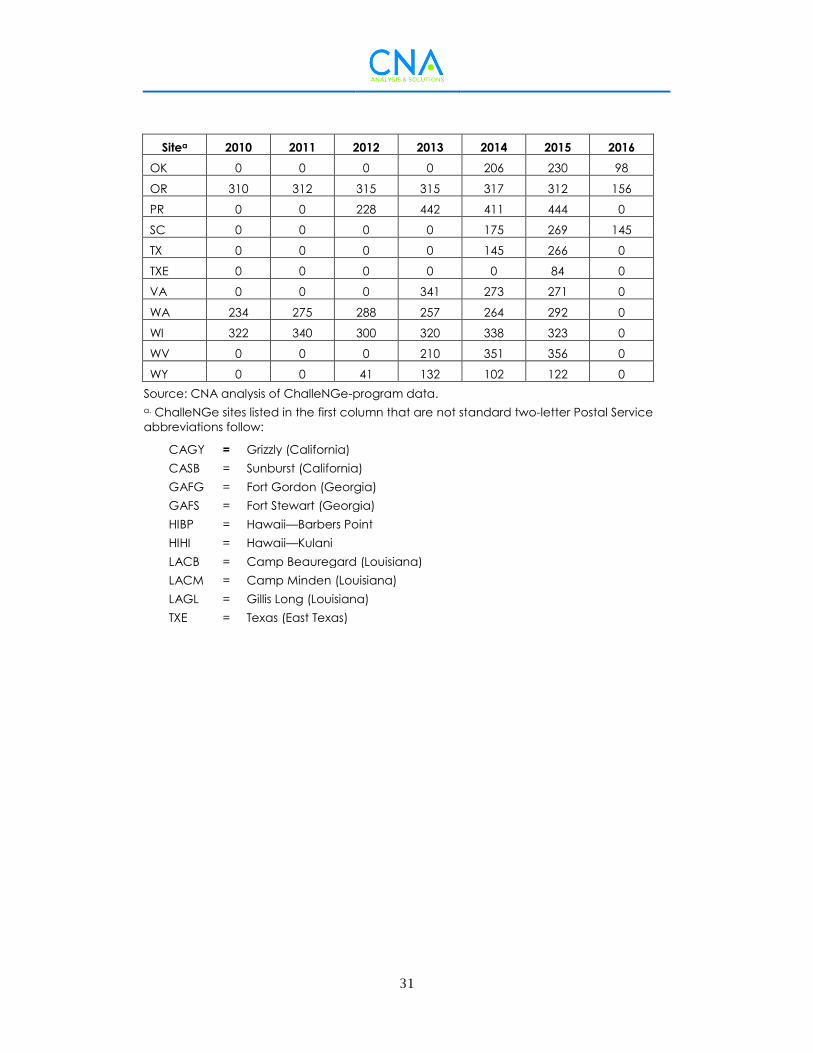
31
Sitea 2010 2011 2012 2013 2014 2015 2016
OK 0 0 0 0 206 230 98
OR 310 312 315 315 317 312 156
PR 0 0 228 442 411 444 0
SC 0 0 0 0 175 269 145
TX 0 0 0 0 145 266 0
TXE 0 0 0 0 0 84 0
VA 0 0 0 341 273 271 0
WA 234 275 288 257 264 292 0
WI 322 340 300 320 338 323 0
WV 0 0 0 210 351 356 0
WY 0 0 41 132 102 122 0
Source: CNA analysis of ChalleNGe-program data.
a. ChalleNGe sites listed in the first column that are not standard two-letter Postal Service
abbreviations follow:
CAGY = Grizzly (California)
CASB = Sunburst (California)
GAFG = Fort Gordon (Georgia)
GAFS = Fort Stewart (Georgia)
HIBP = Hawaii—Barbers Point
HIHI = Hawaii—Kulani
LACB = Camp Beauregard (Louisiana)
LACM = Camp Minden (Louisiana)
LAGL = Gillis Long (Louisiana)
TXE = Texas (East Texas)
32
Appendix B: Development of Our
Test-Score Conversion Methodology
In this appendix, we provide the full details on the analysis and decision-making
behind the development of our test-score conversion methodology. In most linkage
analyses, the dataset is specifically collected for the purpose of linking, with careful
attention paid to ensuring that all test takers have equal motivation and preparation
on both tests. In practice, this means that both tests should be administered on the
same day and should measure similar things. In this analysis, however, we are
limited to the available data, which was not specifically collected for linkage
purposes. As a result, we must closely examine the data to determine the most
appropriate approach to the linkage analysis. Specifically, we consult the data to
determine the following:
1. Should pre-TABE or post-TABE scores be used in our analysis?
2. Do adjustments need to be made for the extra days of ChalleNGe
instruction that occur after the pre-TABE but before the AFQT?
3. Which of the three linking types (predictive linking, scaling, or equating)
are appropriate for our data?
4. Are data from all ChalleNGe sites suitable for analysis?
Before describing the analysis conducted to answer these questions, we provide an
overview of the data used in our test-score conversions. In Table 3, we show the
distribution of our data across the 35 ChalleNGe sites. These data were provided to
us by the ChalleNGe sites. Sites sent the data they had available; some programs
archive more classes’ data than others, so there was significant variation in the
number of classes and thus the number of years for which we received data from
each site. Although some programs were able to provide data as far back as 2009 or
2010, the majority had data to send for 2014 through 2016 only. All available data
were used in our analysis.
For the purposes of this analysis, we divided the data into three mutually exclusive
groups: a linking sample, a verification sample, and the remainder (“other”). By using
an independent verification sample, we help ensure that our results are generally
applicable to all ChalleNGe cadets—not just the sample that generated the results:
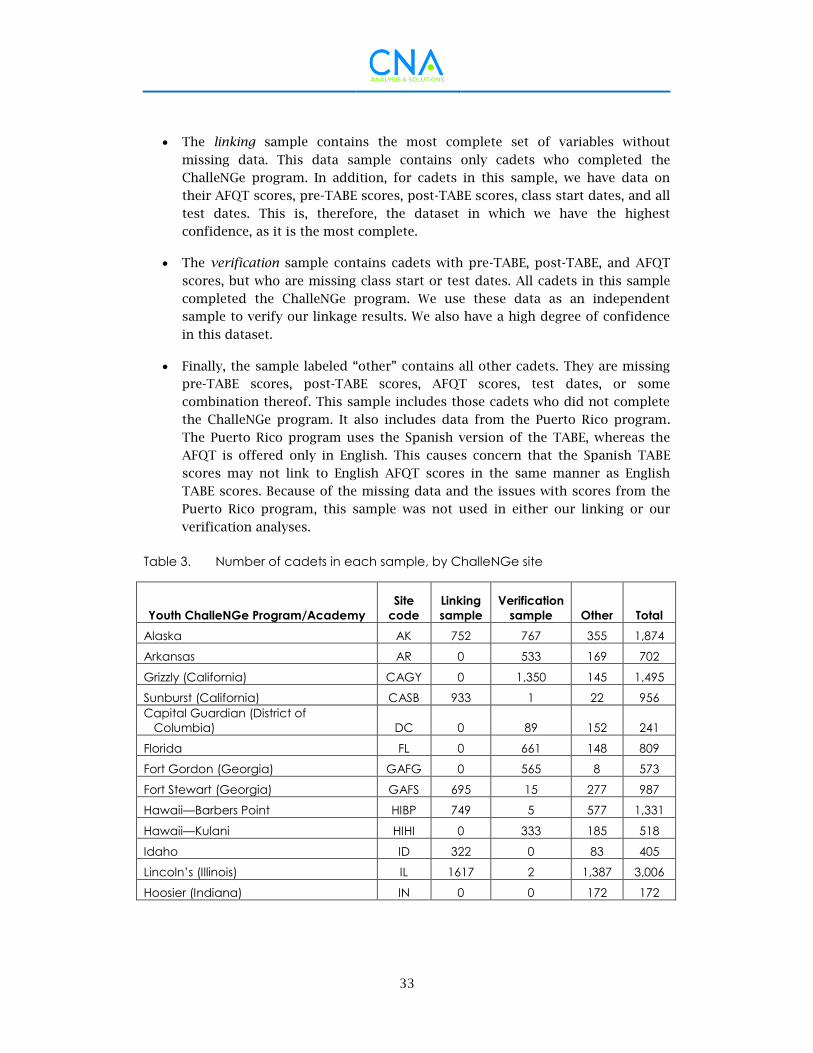
33
The linking sample contains the most complete set of variables without
missing data. This data sample contains only cadets who completed the
ChalleNGe program. In addition, for cadets in this sample, we have data on
their AFQT scores, pre-TABE scores, post-TABE scores, class start dates, and all
test dates. This is, therefore, the dataset in which we have the highest
confidence, as it is the most complete.
The verification sample contains cadets with pre-TABE, post-TABE, and AFQT
scores, but who are missing class start or test dates. All cadets in this sample
completed the ChalleNGe program. We use these data as an independent
sample to verify our linkage results. We also have a high degree of confidence
in this dataset.
Finally, the sample labeled “other” contains all other cadets. They are missing
pre-TABE scores, post-TABE scores, AFQT scores, test dates, or some
combination thereof. This sample includes those cadets who did not complete
the ChalleNGe program. It also includes data from the Puerto Rico program.
The Puerto Rico program uses the Spanish version of the TABE, whereas the
AFQT is offered only in English. This causes concern that the Spanish TABE
scores may not link to English AFQT scores in the same manner as English
TABE scores. Because of the missing data and the issues with scores from the
Puerto Rico program, this sample was not used in either our linking or our
verification analyses.
Table 3. Number of cadets in each sample, by ChalleNGe site
Youth ChalleNGe Program/Academy
Site
code
Linking
sample
Verification
sample Other Total
Alaska AK 752 767 355 1,874
Arkansas AR 0 533 169 702
Grizzly (California) CAGY 0 1,350 145 1,495
Sunburst (California) CASB 933 1 22 956
Capital Guardian (District of
Columbia) DC 0 89 152 241
Florida FL 0 661 148 809
Fort Gordon (Georgia) GAFG 0 565 8 573
Fort Stewart (Georgia) GAFS 695 15 277 987
Hawaii—Barbers Point HIBP 749 5 577 1,331
Hawaii—Kulani HIHI 0 333 185 518
Idaho ID 322 0 83 405
Lincoln’s (Illinois) IL 1617 2 1,387 3,006
Hoosier (Indiana) IN 0 0 172 172
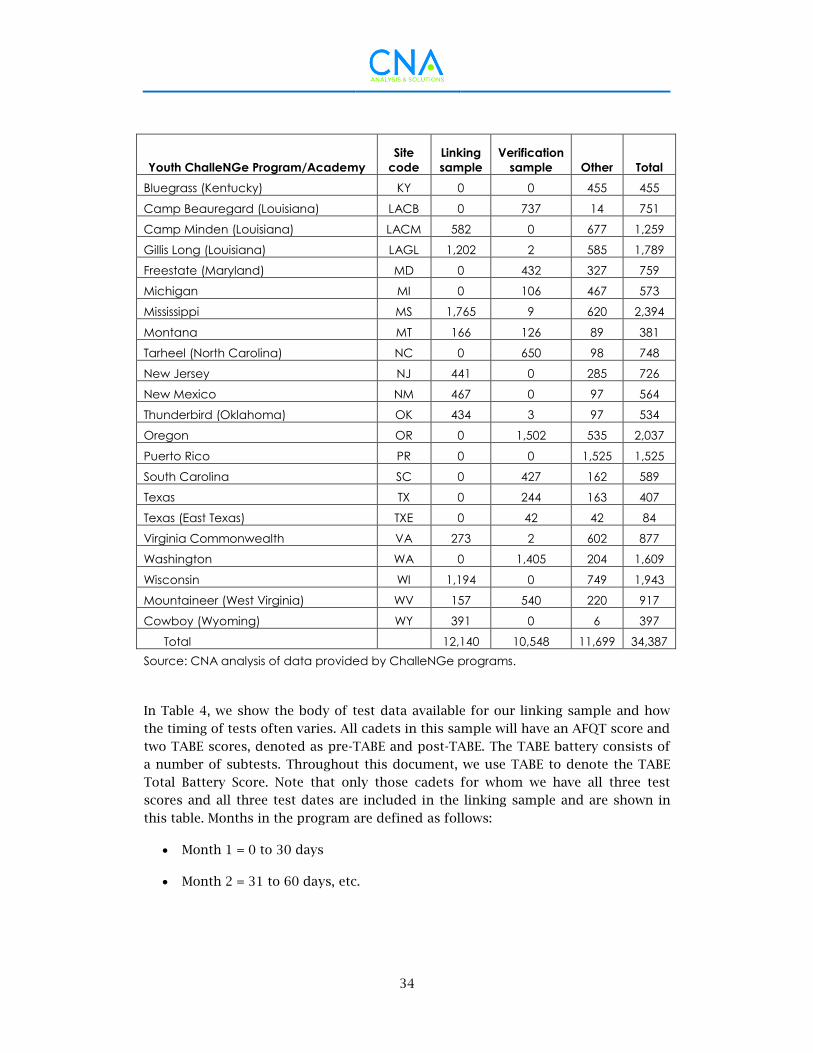
34
Youth ChalleNGe Program/Academy
Site
code
Linking
sample
Verification
sample Other Total
Bluegrass (Kentucky) KY 0 0 455 455
Camp Beauregard (Louisiana) LACB 0 737 14 751
Camp Minden (Louisiana) LACM 582 0 677 1,259
Gillis Long (Louisiana) LAGL 1,202 2 585 1,789
Freestate (Maryland) MD 0 432 327 759
Michigan MI 0 106 467 573
Mississippi MS 1,765 9 620 2,394
Montana MT 166 126 89 381
Tarheel (North Carolina) NC 0 650 98 748
New Jersey NJ 441 0 285 726
New Mexico NM 467 0 97 564
Thunderbird (Oklahoma) OK 434 3 97 534
Oregon OR 0 1,502 535 2,037
Puerto Rico PR 0 0 1,525 1,525
South Carolina SC 0 427 162 589
Texas TX 0 244 163 407
Texas (East Texas) TXE 0 42 42 84
Virginia Commonwealth VA 273 2 602 877
Washington WA 0 1,405 204 1,609
Wisconsin WI 1,194 0 749 1,943
Mountaineer (West Virginia) WV 157 540 220 917
Cowboy (Wyoming) WY 391 0 6 397
Total
12,140 10,548 11,699 34,387
Source: CNA analysis of data provided by ChalleNGe programs.
In Table 4, we show the body of test data available for our linking sample and how
the timing of tests often varies. All cadets in this sample will have an AFQT score and
two TABE scores, denoted as pre-TABE and post-TABE. The TABE battery consists of
a number of subtests. Throughout this document, we use TABE to denote the TABE
Total Battery Score. Note that only those cadets for whom we have all three test
scores and all three test dates are included in the linking sample and are shown in
this table. Months in the program are defined as follows:
Month 1 = 0 to 30 days
Month 2 = 31 to 60 days, etc.
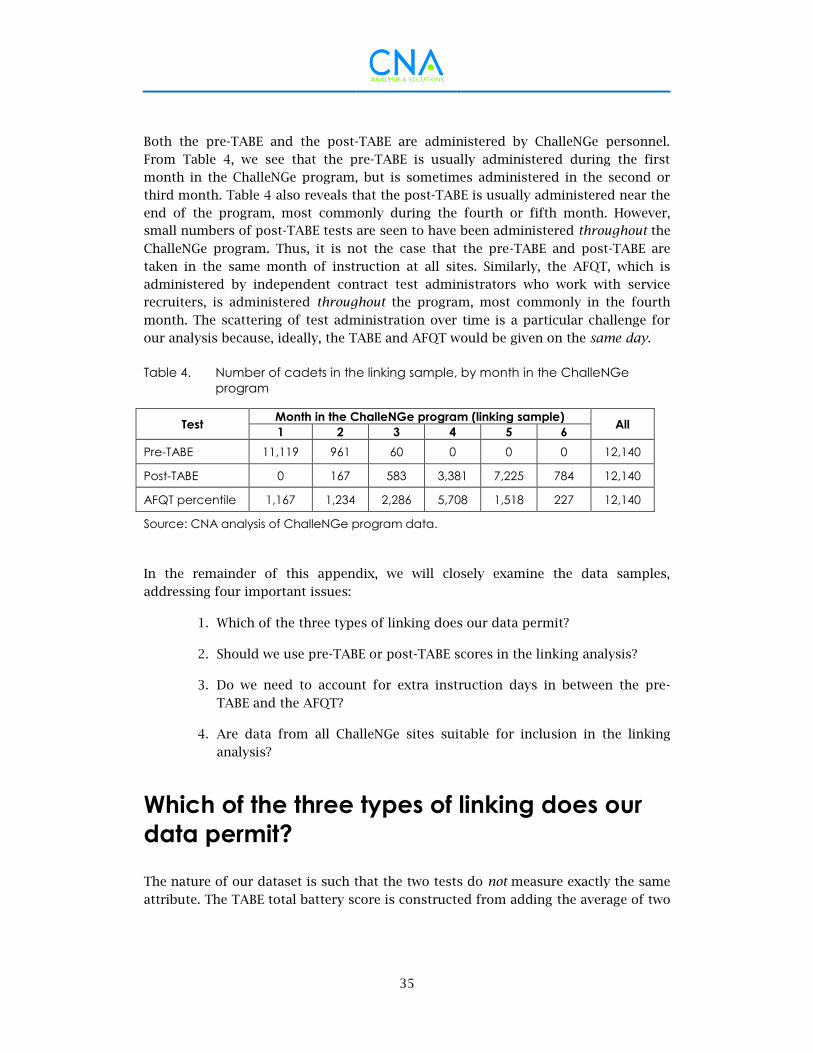
35
Both the pre-TABE and the post-TABE are administered by ChalleNGe personnel.
From Table 4, we see that the pre-TABE is usually administered during the first
month in the ChalleNGe program, but is sometimes administered in the second or
third month. Table 4 also reveals that the post-TABE is usually administered near the
end of the program, most commonly during the fourth or fifth month. However,
small numbers of post-TABE tests are seen to have been administered throughout the
ChalleNGe program. Thus, it is not the case that the pre-TABE and post-TABE are
taken in the same month of instruction at all sites. Similarly, the AFQT, which is
administered by independent contract test administrators who work with service
recruiters, is administered throughout the program, most commonly in the fourth
month. The scattering of test administration over time is a particular challenge for
our analysis because, ideally, the TABE and AFQT would be given on the same day.
Table 4. Number of cadets in the linking sample, by month in the ChalleNGe
program
Test Month in the ChalleNGe program (linking sample)
All 1 2 3 4 5 6
Pre-TABE 11,119 961 60 0 0 0 12,140
Post-TABE 0 167 583 3,381 7,225 784 12,140
AFQT percentile 1,167 1,234 2,286 5,708 1,518 227 12,140
Source: CNA analysis of ChalleNGe program data.
In the remainder of this appendix, we will closely examine the data samples,
addressing four important issues:
1. Which of the three types of linking does our data permit?
2. Should we use pre-TABE or post-TABE scores in the linking analysis?
3. Do we need to account for extra instruction days in between the pre-
TABE and the AFQT?
4. Are data from all ChalleNGe sites suitable for inclusion in the linking
analysis?
Which of the three types of linking does our
data permit?
The nature of our dataset is such that the two tests do not measure exactly the same
attribute. The TABE total battery score is constructed from adding the average of two
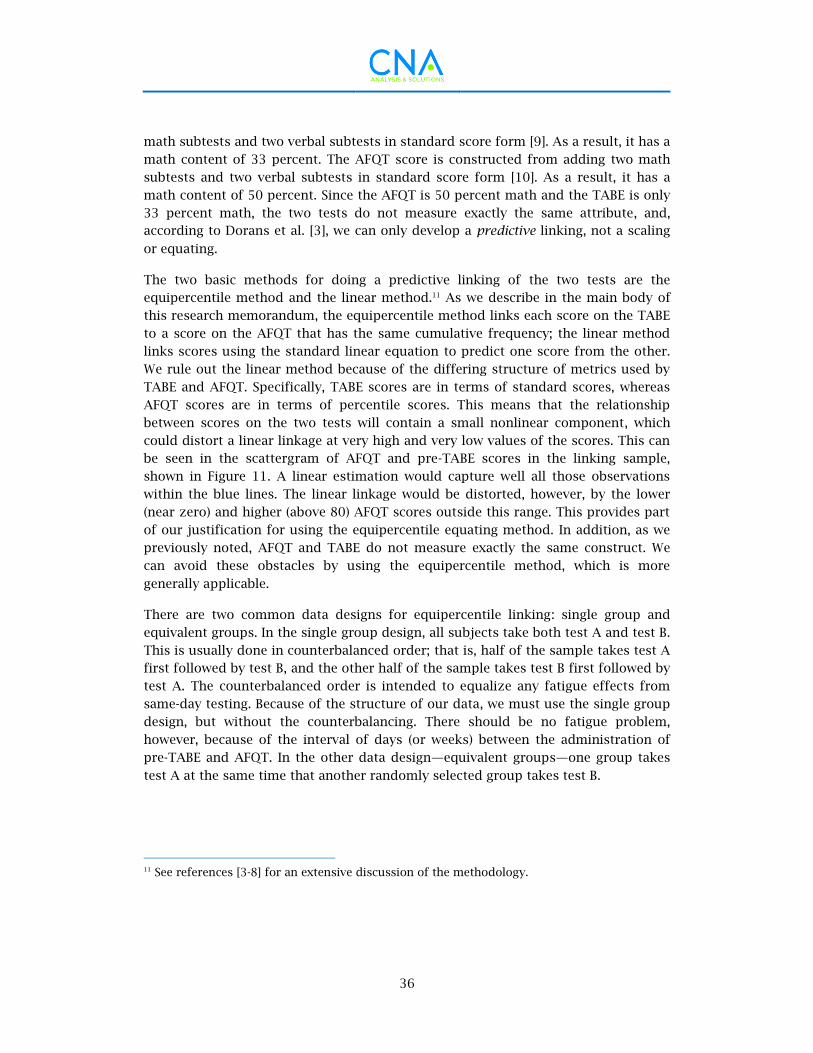
36
math subtests and two verbal subtests in standard score form [9]. As a result, it has a
math content of 33 percent. The AFQT score is constructed from adding two math
subtests and two verbal subtests in standard score form [10]. As a result, it has a
math content of 50 percent. Since the AFQT is 50 percent math and the TABE is only
33 percent math, the two tests do not measure exactly the same attribute, and,
according to Dorans et al. [3], we can only develop a predictive linking, not a scaling
or equating.
The two basic methods for doing a predictive linking of the two tests are the
equipercentile method and the linear method.11 As we describe in the main body of
this research memorandum, the equipercentile method links each score on the TABE
to a score on the AFQT that has the same cumulative frequency; the linear method
links scores using the standard linear equation to predict one score from the other.
We rule out the linear method because of the differing structure of metrics used by
TABE and AFQT. Specifically, TABE scores are in terms of standard scores, whereas
AFQT scores are in terms of percentile scores. This means that the relationship
between scores on the two tests will contain a small nonlinear component, which
could distort a linear linkage at very high and very low values of the scores. This can
be seen in the scattergram of AFQT and pre-TABE scores in the linking sample,
shown in Figure 11. A linear estimation would capture well all those observations
within the blue lines. The linear linkage would be distorted, however, by the lower
(near zero) and higher (above 80) AFQT scores outside this range. This provides part
of our justification for using the equipercentile equating method. In addition, as we
previously noted, AFQT and TABE do not measure exactly the same construct. We
can avoid these obstacles by using the equipercentile method, which is more
generally applicable.
There are two common data designs for equipercentile linking: single group and
equivalent groups. In the single group design, all subjects take both test A and test B.
This is usually done in counterbalanced order; that is, half of the sample takes test A
first followed by test B, and the other half of the sample takes test B first followed by
test A. The counterbalanced order is intended to equalize any fatigue effects from
same-day testing. Because of the structure of our data, we must use the single group
design, but without the counterbalancing. There should be no fatigue problem,
however, because of the interval of days (or weeks) between the administration of
pre-TABE and AFQT. In the other data design—equivalent groups—one group takes
test A at the same time that another randomly selected group takes test B.
11 See references [3-8] for an extensive discussion of the methodology.
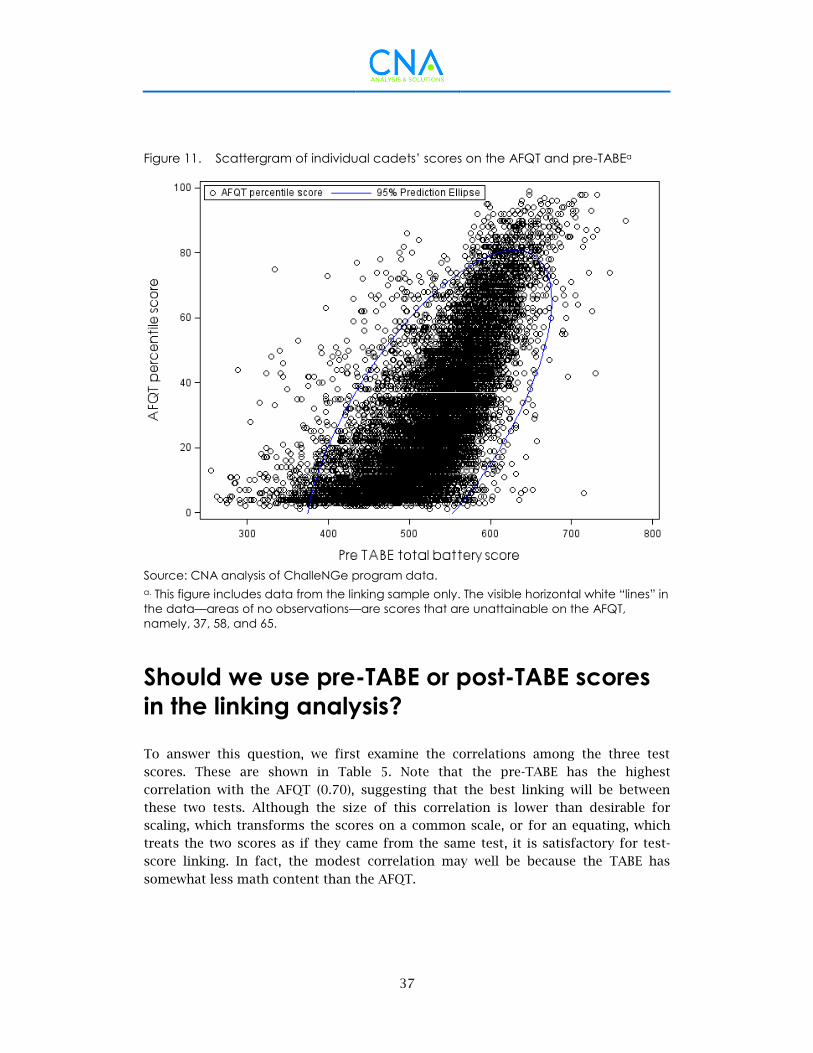
37
Figure 11. Scattergram of individual cadets’ scores on the AFQT and pre-TABEa
Source: CNA analysis of ChalleNGe program data.
a. This figure includes data from the linking sample only. The visible horizontal white “lines” in
the data—areas of no observations—are scores that are unattainable on the AFQT,
namely, 37, 58, and 65.
Should we use pre-TABE or post-TABE scores
in the linking analysis?
To answer this question, we first examine the correlations among the three test
scores. These are shown in Table 5. Note that the pre-TABE has the highest
correlation with the AFQT (0.70), suggesting that the best linking will be between
these two tests. Although the size of this correlation is lower than desirable for
scaling, which transforms the scores on a common scale, or for an equating, which
treats the two scores as if they came from the same test, it is satisfactory for test-
score linking. In fact, the modest correlation may well be because the TABE has
somewhat less math content than the AFQT.
38
Table 5. Correlations between AFQT, pre-TABE, and post-TABE scores
(linking sample)
Test AFQT Pre-TABE Post-TABE
AFQT 1.00 0.70 0.61
Pre-TABE 0.70 1.00 0.69
Post-TABE 0.61 0.69 1.00
Source: CNA analysis of ChalleNGe-program data.
Table 5 also reveals a lower-than-expected correlation between the pre-TABE and the
post-TABE, at 0.69. This is not entirely surprising. It suggests that the ChalleNGe
program is having significant impacts on the cadets’ academic and testing abilities.
The likely reason is that ChalleNGe is a residential instruction program—one in
which the cadets are required to go to class and do their homework; that is, it can
have a significant impact on a cadet’s academic growth. It is not surprising,
therefore, that we observe improvements in cadets’ test-taking skills and/or
academic performance. There are other factors that could be reducing the correlation
between the pre- and post-TABE, including the fact that some programs allow
students to stop taking the post-TABE once they achieve a high enough score to
attain a GED. In addition, program management varies by site, which may include
sites’ emphasis on TABE score-improvement and the degree to which their curricula
are structured around TABE elements.
Further evidence of test-score gains between the pre-TABE and post-TABE are
illustrated in Figure 12 and Figure 13. We see in Figure 12 that cadets at a few sites
(HIHI, MI, and TXE) show only modest score gains of around 15 TABE points. Other
sites, however, such as CASB, MD, and MS, show gains in the range of 70 to 85 points.
These differences could reflect superior instruction at some sites or differences in
the initial aptitude of the sites’ cadets, or they may have other causes (e.g., cadets
may not take the first administration seriously enough, causing their performance to
not be a full reflection of their academic capabilities). In an effort to better
understand these differences, we also examine the increase in grade equivalent (GE)
levels, by site, as shown in Figure 13.12
12 The GE levels can be interpreted as follows: the number before the decimal point represents
the year of schooling corresponding to the test performance, and the number after the decimal
point represents the month of schooling. For example, a GE level of 9.2 indicates performance
at the 2nd month of the 9th grade.
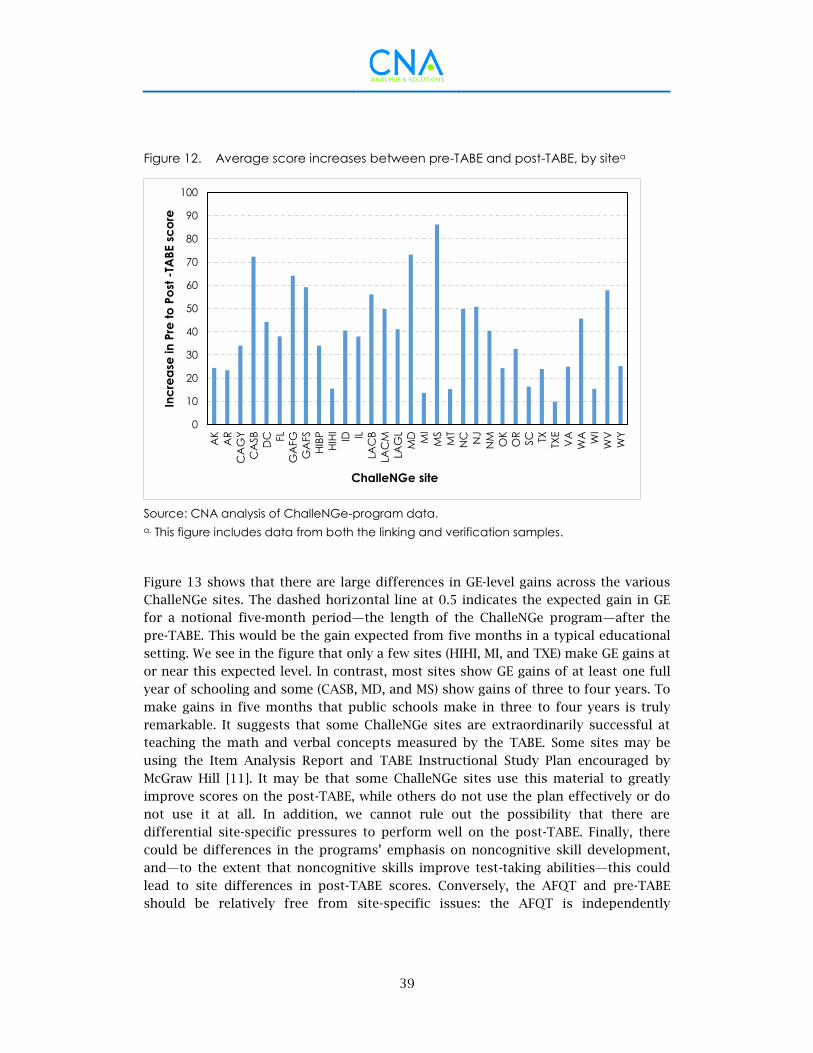
39
Figure 12. Average score increases between pre-TABE and post-TABE, by sitea
Source: CNA analysis of ChalleNGe-program data.
a. This figure includes data from both the linking and verification samples.
Figure 13 shows that there are large differences in GE-level gains across the various
ChalleNGe sites. The dashed horizontal line at 0.5 indicates the expected gain in GE
for a notional five-month period—the length of the ChalleNGe program—after the
pre-TABE. This would be the gain expected from five months in a typical educational
setting. We see in the figure that only a few sites (HIHI, MI, and TXE) make GE gains at
or near this expected level. In contrast, most sites show GE gains of at least one full
year of schooling and some (CASB, MD, and MS) show gains of three to four years. To
make gains in five months that public schools make in three to four years is truly
remarkable. It suggests that some ChalleNGe sites are extraordinarily successful at
teaching the math and verbal concepts measured by the TABE. Some sites may be
using the Item Analysis Report and TABE Instructional Study Plan encouraged by
McGraw Hill [11]. It may be that some ChalleNGe sites use this material to greatly
improve scores on the post-TABE, while others do not use the plan effectively or do
not use it at all. In addition, we cannot rule out the possibility that there are
differential site-specific pressures to perform well on the post-TABE. Finally, there
could be differences in the programs’ emphasis on noncognitive skill development,
and—to the extent that noncognitive skills improve test-taking abilities—this could
lead to site differences in post-TABE scores. Conversely, the AFQT and pre-TABE
should be relatively free from site-specific issues: the AFQT is independently
0
10
20
30
40
50
60
70
80
90
100
AK
AR
CA
GY
CA
SB
DC FL
GA
FG
GA
FS
HIB
P
HIH
I
ID IL
LAC
B
LAC
M
LAG
L
MD MI
MS
MT
NC NJ
NM
OK
OR
SC TX
TXE
VA
WA WI
WV
WY
Inc
rea
se in
Pre
to
Po
st -
TAB
E s
co
re
ChalleNGe site
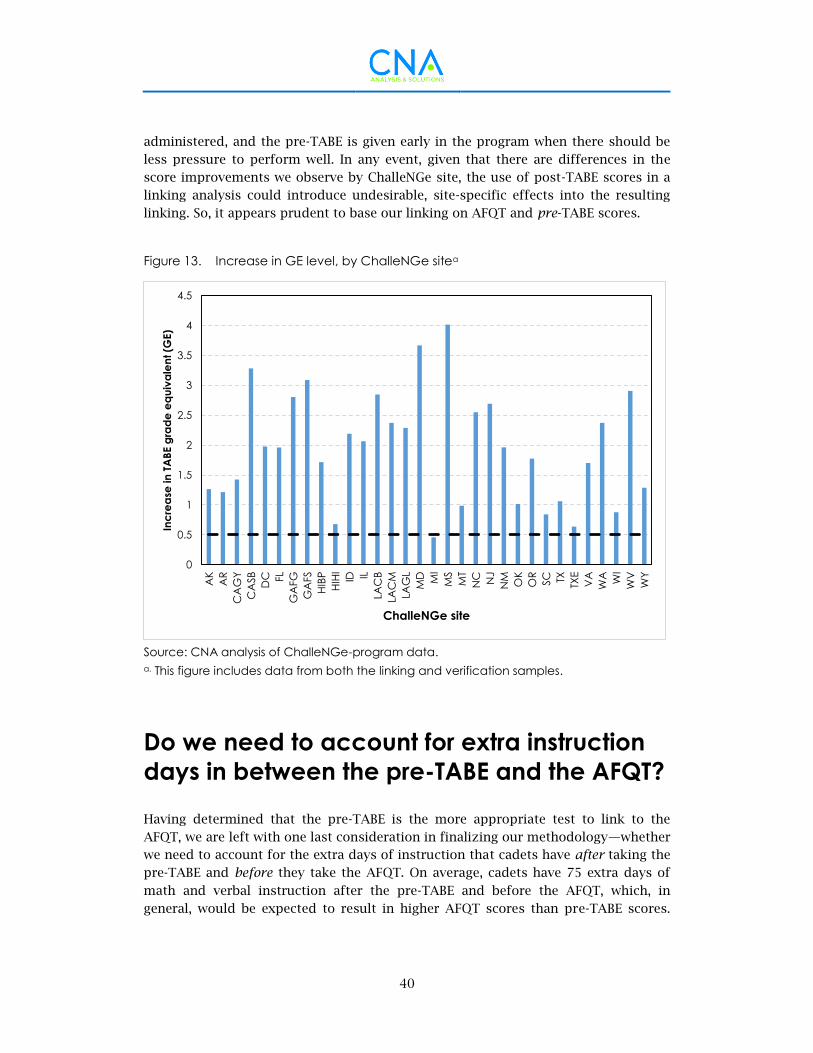
40
administered, and the pre-TABE is given early in the program when there should be
less pressure to perform well. In any event, given that there are differences in the
score improvements we observe by ChalleNGe site, the use of post-TABE scores in a
linking analysis could introduce undesirable, site-specific effects into the resulting
linking. So, it appears prudent to base our linking on AFQT and pre-TABE scores.
Figure 13. Increase in GE level, by ChalleNGe sitea
Source: CNA analysis of ChalleNGe-program data.
a. This figure includes data from both the linking and verification samples.
Do we need to account for extra instruction
days in between the pre-TABE and the AFQT?
Having determined that the pre-TABE is the more appropriate test to link to the
AFQT, we are left with one last consideration in finalizing our methodology—whether
we need to account for the extra days of instruction that cadets have after taking the
pre-TABE and before they take the AFQT. On average, cadets have 75 extra days of
math and verbal instruction after the pre-TABE and before the AFQT, which, in
general, would be expected to result in higher AFQT scores than pre-TABE scores.
0
0.5
1
1.5
2
2.5
3
3.5
4
4.5
AK
AR
CA
GY
CA
SB
DC FL
GA
FG
GA
FS
HIB
P
HIH
I
ID IL
LAC
B
LAC
M
LAG
L
MD MI
MS
MT
NC NJ
NM
OK
OR
SC TX
TXE
VA
WA WI
WV
WY
Inc
rea
se in
TA
BE g
rad
e e
qu
iva
len
t (G
E)
ChalleNGe site
41
When evaluating the effect of extra days of instruction on AFQT scores, however, the
results are only marginally significant, as shown in Table 6.13 That is, the variable
“extra days” is not significant at the usual reference level of 0.05; therefore, we
consider it to be not statistically significant. If, however, we relax the cutoff of
statistical significance to 0.10, thus concluding that extra days are statistically and
significantly correlated with AFQT scores, we would calculate the average impact to
be relatively small (i.e., (0.0057) * (75days) = 0.43 AFQT point).14 We suspect that the
reason that additional days of instruction are not leading to significantly higher
AFQT scores may be that the ChalleNGe teachers’ prioritize teaching math
computation over math reasoning. Unlike math computation, which focuses on
computing numeric operations, math reasoning is a more abstract skill and requires
the ability to apply learned math skills to word problems. Math computation,
however, is not one of the math skills directly measured by the AFQT.15 When we
examine pre-TABE to post-TABE gains on the TABE subtests for all sites combined,
we find that the average gains are greatest on math computation (74 points),
followed by applied math (48 points), reading (36 points), and language (35 points).
Of all components of the TABE, deficiencies in math computation may be the easiest
to identify, so math computation is likely the area in which teachers and cadets will
experience rapid and rewarding gains. This may incentivize teachers to focus their
instruction more heavily in this area. In addition, it is the component of the TABE
that is least like the material and academic constructs tested on the AFQT. As a
result, the extra days of ChalleNGe instruction do not correlate to higher AFQT
scores. No matter the reason, because we find that AFQT scores do not increase
significantly with additional days of training, we do not need to explicitly include
“extra days of training” in our linking analysis.
13 The “extra days” variable is measured as the date of the AFQT minus the date of the pre-
TABE.
14 Since the AFQT is scored in whole numbers, this would round down to an increase of 0 AFQT
point.
15 The two math components of the AFQT are Arithmetic Reasoning and Math Knowledge;
Arithmetic Reasoning consists of word problems, whereas Math Knowledge is the knowledge of
high school math principles (different from direct computation).
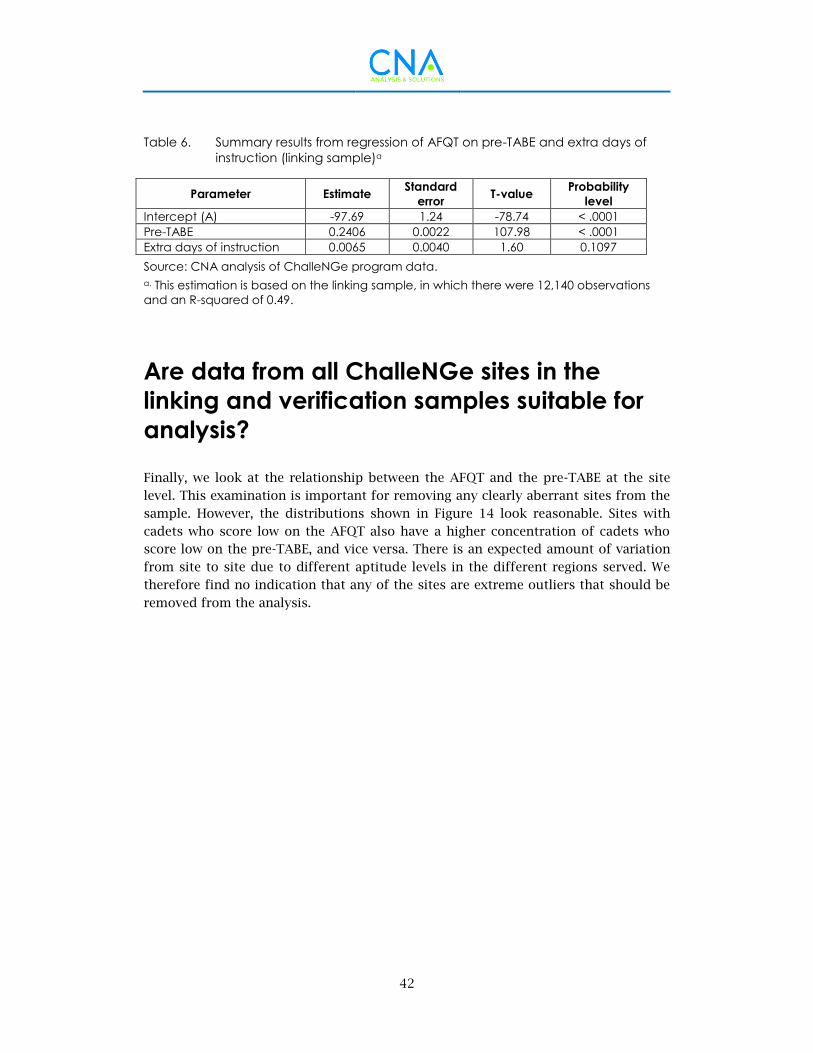
42
Table 6. Summary results from regression of AFQT on pre-TABE and extra days of
instruction (linking sample)a
Parameter Estimate Standard
error T-value
Probability
level
Intercept (A) -97.69 1.24 -78.74 < .0001
Pre-TABE 0.2406 0.0022 107.98 < .0001
Extra days of instruction 0.0065 0.0040 1.60 0.1097
Source: CNA analysis of ChalleNGe program data.
a. This estimation is based on the linking sample, in which there were 12,140 observations
and an R-squared of 0.49.
Are data from all ChalleNGe sites in the
linking and verification samples suitable for
analysis?
Finally, we look at the relationship between the AFQT and the pre-TABE at the site
level. This examination is important for removing any clearly aberrant sites from the
sample. However, the distributions shown in Figure 14 look reasonable. Sites with
cadets who score low on the AFQT also have a higher concentration of cadets who
score low on the pre-TABE, and vice versa. There is an expected amount of variation
from site to site due to different aptitude levels in the different regions served. We
therefore find no indication that any of the sites are extreme outliers that should be
removed from the analysis.
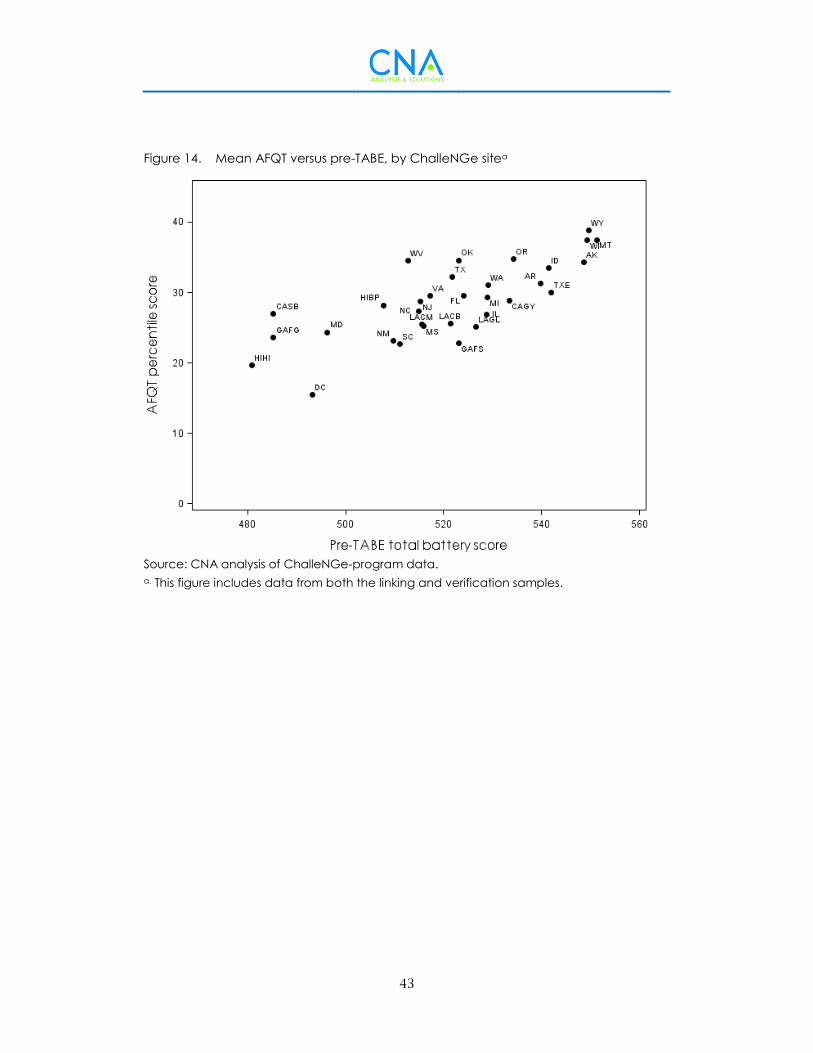
43
Figure 14. Mean AFQT versus pre-TABE, by ChalleNGe sitea
Source: CNA analysis of ChalleNGe-program data.
a. This figure includes data from both the linking and verification samples.
44
References
[1] National Guard Youth Foundation. 2016. “About Youth ChalleNGe.” National Guard Youth Foundation. Accessed Mar. 3, 2016. http://www.ngyf.org/about-challenge-2/.
[2] CNA. 2015. “Population Representation in the Military Services: Fiscal Year 2015 Summary Report.” cna.org. Accessed Sep. 8, 2017.
[3] Dorans, Neil J., Tim P. Moses, and Daniel R. Eignor. 2010. Principles and Practices of Test Score Equating. Educational Testing Service. Research Report ETS RR-10-29.
[4] Livingston, Samuel A. 2014. Equating Test Scores (without IRT). Second ed. Princeton: Educational Testing Service.
[5] Angoff, William H. 1971. “Scales, Norms, and Equivalent Scores.” In Educational Measurement (Second Edition). Edited by Robert L. Thorndike. Washington, DC: American Council on Education.
[6] Geving, Allison M., Shannon Webb, and Bruce Davis. 2005. “Opportunities for Repeat Testing: Practice Doesn't Always Make Perfect.” Applied H.R.M. Research 10 (2): 47-56.
[7] Gulliksen, Harold. 1950. Theory of Mental Tests. New York: John Wiley & Sons.
[8] Thorndike, Robert L. 1982. Applied Psychometrics. Boston: Houghton Mifflin Company.
[9] CTB McGraw Hill. Undated. TABE Norms Book, Complete Battery and Survey, Forms 9 and 10.
[10] Segall, Daniel O. 2004. Development and Evaluation of the 1997 ASVAB Score Scale. Defense Manpower Data Center.
[11] CTB McGraw Hill. Undated. “TABE Workshop on Test Administration.” In Linking Data to Instruction. 53-57.
CNA
This report was written by CNA’s Resource Analysis Division (RAD).
RAD provides analytical services—through empirical research, modeling,
and simulation—to help develop, evaluate, and implement policies,
practices, and programs that make people, budgets, and assets more
effective and efficient. Major areas of research include health research
and policy; energy and environment; manpower management;
acquisition and cost; infrastructure; and military readiness.
DRM-2017-U-016261-1Rev
www.cna.org ● 703-824-2000
3003 Washington Boulevard, Arlington, VA 22201
CNA is a not-for-profit research organization
that serves the public interest by providing
in-depth analysis and result-oriented solutions
to help government leaders choose
the best course of action
in setting policy and managing operations.
Nobody gets closer—
to the people, to the data, to the problem.