Embed Size (px)
Citation preview

US Department of the Interior National Park Service
National Center for Preservation Technology and Trait
Publication No. 1999-03
AN EVALUATION OF ARCHAEOLOGICAL APPLICATIONS OF MAPPING GRADE
GLOBAL POSITIONING SYSTEMS: FIELD TESTS IN NORTHEASTERN COLORADO’S
PLAINS AND MOUNTAINS
By Robert H. Brunswig, Jr, Ph.D. Department of Anthropology
University of Northern Colorado
1999
Funding for this report was provided by the National Park Services National Center for Preservation Technology and Training. NCPTT promotes and enhances the preservation of prehistoric and historic resources in the United States for present and future generations through the advancement and dissemination of preservation technology and training.

INTRODUCTION
The ability to collect and analyze spatially defined data is a core
component of archaeological research. In recent years, the collection and
manipulation of spatial data sets has become increasingly sophisticated and
effective with the introduction of Global Positioning (GPS), computer-based
mapping and Geographic Information System (GIS) hardware and software (see
Kennedy 1996, Napton and Greathouse 1997: 212-215, 225-228). On the more
immediate, and practical, level, the collection of precise positional information on
archaeological sites, features and artifacts using GPS instruments is,
hypothetically, made faster and more cost-effective (cf. Ladefoged, Graves,
O’Connor and Chapin 1998). Further, collected data can then be up-loaded into
computer-based software systems for mapping and simple statistical correlation
analysis. The generation of quickly recorded, electronic spatial data is,
potentially, both a time and money-saver in archaeological field projects, whether
they are basic field inventories (involving survey and testing strategies) or major
programs of archaeological research.
At the broadest (and more theoretical level) of research, spatial
manipulation and analysis of complex, interrelated data sets involving multiple
classes of data-archaeological, environmental, etc.-make possible sophisticated
modeling of past cultural and physical landscapes. This latter research
approach, landscape archaeology, is concerned with the comprehensive,
analytical integration of a human (cultural) and natural ecosystem components
within a well-defined geographic area (Brunswig 1996, Rossignol 1992). In
1

applying the landscape approach, pre-modern landscapes are conceptualized
within multiple, but interacting, “frames of reference” for archaeological and
paleoenvironmental researchers, frames which include. 1) physical landscapes,
or sets of evolving land forms over time with their associated soils, eroding and
expanding (alluviation, etc ) geomorphic features (streams, terraces, hills, etc);
2) biological landscapes with their associated ecosystems of plant and animal
communities that are distributed in varied, and often “patchy”, patterns across
the physical landscapes; and 3) archaeological landscapes or the synchronic
and diachronic distribution of loci of past human activity across, and functionally
defined by the characteristics of different elements of, associated physical and
biological landscapes.
In 1998, this author, under contract to the U.S. Park Service’s
National Center for Preservation Technology and Training undertook a
preliminary field test and evaluation of emerging Global Position Systems
technology for applications in archaeology. The results of that study,
described below, suggest that there are a number of highly positive (and
a few less positive) aspects to using GPS technology for assisting
archaeologists in acquiring multiple data sets for archaeological research
programs from the fundamental survey and inventory data collecting
phase to providing large-scale spatial data bases for regional landscape
models.
RESEARCH PROGRAM OBJECTIVES
The main objective of the GPS field testing program was to assess the
utility of mapping grade GPS instruments in collecting sub-meter spatial data on
2
archaeological sites in two environmental contexts, northeastern Colorado’s high
plains and mountains. The testing took place under standard field conditions at
archaeological sites being documented by University of Northern Colorado
survey teams working under cost-share agreements and cooperative contracts
with the U.S. Forest Service and U S. Park Service, respectively GPS positions
were collected at each of five sites in varying topographic contexts, position
logging times, and using two different methods for achieving sub-meter spatial
point precision. Altering variables of topography, collection times, and differing
differential correction methods allowed better insights into factors that affect
spatial data collection in field conditions. Learning about the effect of such
variables in GPS data collection provided a critical test of the applicability of the
technology to supporting archaeological goals.
METHODS OF TESTING AND EVALUATION GPS Instruments, Concepts and Terms Relevant to the Research
Testing the utility of precision, sub-meter GPS data recording at
archaeological sites involved the coordination of several instruments and
software packages. A Trimble ProXR GPS system with a 12 channel receiver
was the primary system. The ProXR has a 2 MB logging memory, capable of
storing several thousand individual positions along with associated data
dictionary information. The 12 channel receiver allowed the GPS to acquire and
maintain lock on multiple satellites (SV’s) as they transited from horizon to
horizon more consistently than earlier 8 channel models. The Trimble system
3
normally costs in the range of $12,500, although its academic price is somewhat
less at $9,000.
GPS satellite signal data obtainable by the ProXR is restricted only to a
signal type known as C/A code, a relatively low resolution signal type designed to
be received by civilian, not military, instruments. The higher resolution P-code
signal requires a classified GPS chip set not normally available to non-
governmental GPS users. Further, civilian GPS units are periodically subject to
selective availability or degradation of the satellite signals to C/A units by the
Department of Defense (DOD). The combination of a C/A code GPS chip set and
DOD selective availability commonly results in positional errors of c. 10 meters to
as much as 100 meters, hardly achieving the spatial precision needed for most
archaeological applications In recent years, however, civilian engineers resolved
DOD restrictions to higher GPS precision by developing hardware and software
“fixes” which correct for those “errors”. In doing so, they have managed to
achieve a somewhat greater degree of spatial resolution than normally available
in government GPS units equipped with P-code chip sets. The solution, known
as differential correction, differential correction, involves the use of a GPS base
station receiver with a known precise location and collecting satellite position
signal data at the same time a field (rover) GPS unit is being used. Very simply,
and simplistically, put, differential correction is a means of “determining position
error at a known location and applying that determined error-correction value” to
another (the rover GPS), unknown position (French 1996: 123-137, 232). At
present, three methods of differential correction exist: 1) computer post-
4
processing of field (rover) and base station data files, 2) real-time (in field,
instantaneous) differential correction of satellite (SV) positional data using a
broadcast signal of base station correction data from a beacon transmitter, and
3) real-time reception of “virtual” base correction data from an orbiting
geosynchronous satellite (French 1996: 123-151; for information on the satellite
correction signal approach-see Huff 1995 and visit the OMNISTAR web page:
(http.//www.omnistar.com). A fourth and normally less viable option is use of a FM-
broadcast signal from a local base station to a rover GPS unit. However, the FM
method is somewhat limited in range and effectiveness with present technology.
This study utilized two methods of achieving sub-meter field data; 1) post-
processing of field rover data downloaded into a computer from the GPS data
logger, and 2) use of a rented real-time, satellite “base station” antenna and
service. The later real-time approach involved rental of an “add-on” receiver and
antenna from a local Colorado surveying company who, in turn, had an annual
subscription to one of the major DGPS (Differential GPS) providers-OMNISTAR.
Rental of the OMNISTAR unit cost $35 per day while purchase of the system is
c. $3500 and annual subscription to the service itself is $800 a year. Post
processed base station correction data, early in the study, were obtained from an
Internet bulletin board site operated by the U.S. Forest Service in Fort Collins,
Colorado. However, early in 1998, the Forest Service opened up a base station
web page which provides continuous differential correction data in FTP
downloadable file formats (web address –
http://www.fs.fed. us/database/gps/ftcollins.htm). The correction data at the Fort
5

Collins web site are kept on line for 2 months from the time of collection and
collected 24 hours a day, 7 days a week. In addition to the Fort Collins facility,
the Forest Service, various federal agencies, and a number of private companies
maintain base stations with downloadable file sets at 47 sites in 27 states. All are
accessible through the USDA Forest Service’s GPS web page
(http://www.fs.fed.us/database/gps/). The development of Internet base station
pages has vastly simplified GPS post processing and allows sub-meter post-
processed data sets to be accurately generated for rover GPS data from within a
radius of 300 km of each station.
Post-processing rover GPS data collected during the study was done
using Trimble’s Pathfinder GPS software Pathfinder allows a number of essential
functions to be performed. Field data are up-loaded from the GPS data logger
and may be displayed in a generalized “flat map” form in the program. The
program also allows the easy post-processing of field data using parallel time
base station files (in this case, downloaded from an Internet base station web
page) Multiple field or post-processed files can be combined to make up much
larger, more complex, wider area (multi-site) files. Corrected and uncorrected
files can then be saved in a variety of Geographic Information System (GIS),
spreadsheet, or text formats, including any related field-recorded information on
each recorded spatial point. Specific information can be recorded for any field-
logged point using a custom designed data dictionary which is available in a
menu or general notation (alphanumeric) format on a GPS data logger’s LCD
screen. The data dictionary used for this field study changed as the project
6

evolved, but, in its final form, provided extremely useful point by point information
for later analyzing and labeling GPS field data (see Appendix A for a copy of the
study’s final data dictionary format). Further, Pathfinder allows post-collection
editing of point information before exporting the final corrected file to an external
GIS or mapping program.
Computers used in processing GPS data in the study included a Pentium
II 233 MHZ system with 64 MB RAM and a 42 GB Hard Drive. A 100 MB Zip
Drive was used for back-up storage and data transfer between other computers.
A second microcomputer, a Toshiba Pentium 133 MHZ notebook (portable)
system with a 2.1 GB Hard Drive and an external 100 MB Zip Drive, was used to
download GPS data while in the field and evaluate GPS performance as data
were being collected. The purpose of using a portable field computer was to view
uncorrected and real-time corrected data sets to determine if data collection
strategies were producing the desired results and to modify collection procedures
to enhance those results. For instance, one objective was to collect sufficient and
correctly “spaced” positional data to create high-resolution topographic maps of
archaeological sites and their surrounding terrain. The need for higher resolution
topographic maps for sites and site localities represents a long-standing problem
where U.S.G.S. 7.5” topographic maps commonly have contour intervals of 20 to
40 feet. Landscape archaeology modeling on the fine, micro (local) scale is
based, in part, on the need to document and understand localized site location
variables as the relationship of seasonal wind directions and local topographic
features, water drainage patterns, etc. Successful landscape archaeology
7
modeling, not to mention more mundane site survey mapping, on the local
(micro) scale requires relatively high-resolution land surface information which, it
was suggested, could be provided by high precision GPS (sub-meter) data sets.
If physical gaps in GPS field data existed, then high-resolution topographic maps
could not be effectively generated. Use of the viewing and initial mapping of field
files on the field computer would, it was reasoned, allow subsequent, remedial
data collection to fill in any gaps that might have occurred in the initial GPS
survey. This proved to be the case as the study evolved.
Research Methods and Strategies
Assessing the effectiveness of sub-meter GPS data sets to archaeological
applications was based on several, inter-connected approaches. First,
uncorrected GPS data were compared with post-processed corrected versions of
the same data. This allowed a rough evaluation in the Increase in precision for
the same data sets. Second, a particular statistic generated by Trimble’s
Pathfinder software, the S.D. or standard deviation, provided a useful means of
assessing the relative accuracy or spatial precision of each recorded GPS point.
The standard deviation is a calculation of the “closeness of clustering” of a series
of recorded positions for individual points. A coordinate location or specific three-
dimensional spot, in GPS terms, is really an averaging of a number of locational
(GPS satellite) signal readings, or positions, taken over a given period of time
(French 1996. 179). Depending on a variety signal variables (number of SV’s in
view, earth geometry, terrain obstacles, etc.) such positions will vary somewhat
in precision, but collectively are used to produce 3-dimensional coordinates for a
8
particular point on the earth’s surface. The tighter the standard deviation, the
higher the statistical probability for a reliable precision point coordinate to be
present. In practical terms, use of the S.D. statistic calculated automatically by
the Pathfinder software allowed an effective measuring tool for comparing and
evaluating relative point coordinate precision for recorded GPS data. In order to
obtain comparable, measurable GPS data, standard deviations for uncorrected,
real time (OMNISTAR-derived), and post-processed corrected point coordinates
were compiled on an Excel spreadsheet and each column averaged at the end of
each column. The resulting averaged S.D. values then provided a comparable
statistic of relative spatial precision of each alternative GPS data set and the
methods by which they were derived.
Two secondary, and somewhat informal, means of assessing the
accuracy of different GPS methods were: 1) visually comparing (graphically
overlaying) GPS-based maps with standard U.S.G.S. topographic maps of the
same areas, and 2) comparing the deviation of selected GPS logged positions
with those surveyed using a standard survey transit.
A final phase of the sub-meter GPS test program involved exporting
differentially corrected data from the Trimble Pathfinder program to mapping and
GIS programs. Given limitations of time, GIS analysis of the GPS data sets was
explored in only a rudimentary manner using data files directly exported to Arc-
View from Pathfinder, with further work to be done after the conclusion of the
study. However, GPS data in Universal Transverse Mercator (UTM) coordinate
system formats were exported as ASCII (test) files into the Excel Spreadsheet,
9
then re-formatted into column and row data appropriate for use in the SURFER
Mapping Program (Keckler 1995). The Excel data sheets were imported into
SURFER’s worksheet sub-program and’ the resulting data (.DAT) files further
processed into appropriate SURFER file formats for contour and surface maps
and labeled feature/artifact overlays. The resulting maps provided an excellent
example of the utility of sub-meter GPS in collecting high resolution spatial data
and using those data to create horizontal and three-dimensional maps of smaller
and larger scale archaeological landscapes.
Description of the Test Sites and Data Collection Procedures
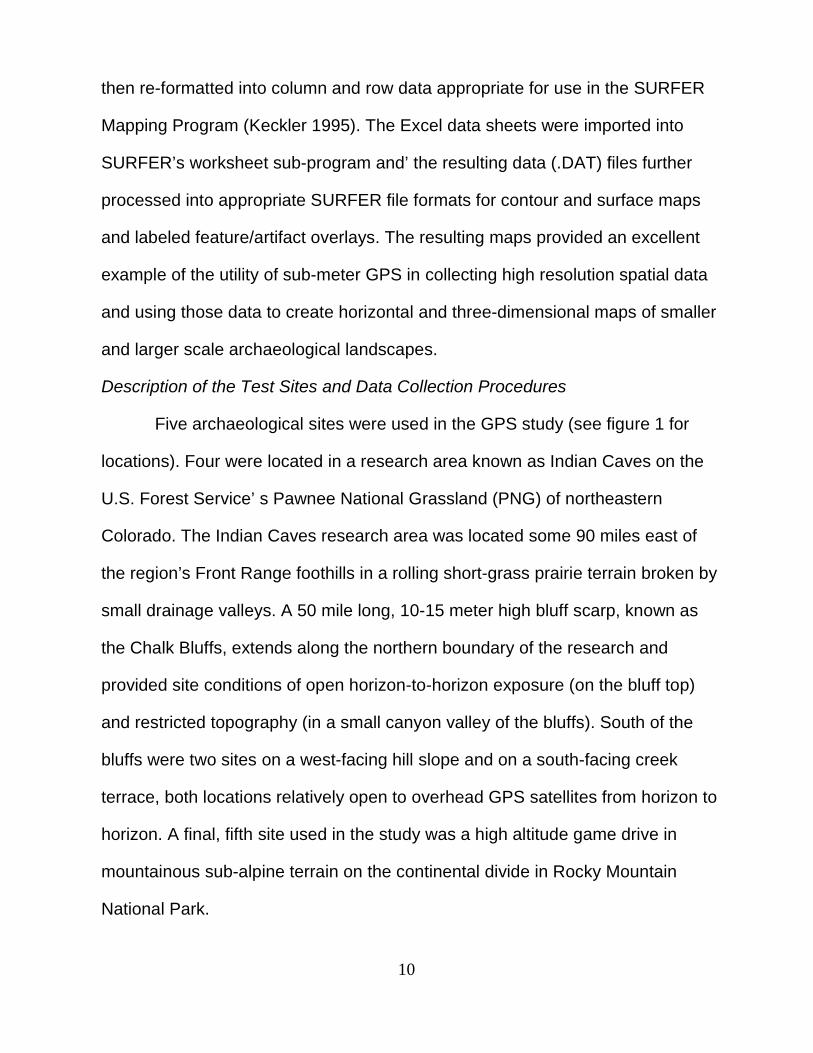
Five archaeological sites were used in the GPS study (see figure 1 for
locations). Four were located in a research area known as Indian Caves on the
U.S. Forest Service’ s Pawnee National Grassland (PNG) of northeastern
Colorado. The Indian Caves research area was located some 90 miles east of
the region’s Front Range foothills in a rolling short-grass prairie terrain broken by
small drainage valleys. A 50 mile long, 10-15 meter high bluff scarp, known as
the Chalk Bluffs, extends along the northern boundary of the research and
provided site conditions of open horizon-to-horizon exposure (on the bluff top)
and restricted topography (in a small canyon valley of the bluffs). South of the
bluffs were two sites on a west-facing hill slope and on a south-facing creek
terrace, both locations relatively open to overhead GPS satellites from horizon to
horizon. A final, fifth site used in the study was a high altitude game drive in
mountainous sub-alpine terrain on the continental divide in Rocky Mountain
National Park.
10
Figure 1
General Map Locations of the Two Test Site Areas
GPS point data were logged for the Indian Cave (PNG) sites after each
had been surveyed by University of Northern Colorado field crews (cf. Brunswig
1998). Standard archaeological survey techniques were used, with each site
being covered by survey crew members walking them at 3 meter intervals. All
artifacts and features were marked with pin flags for mapping and collection of
artifacts. Two classes of spatial points were recorded during the GPS survey: 1)
artifacts, features and test units, and 2) general topographic locations designed
to “fill-in” the local site topography, on-site and in adjacent non-site areas. The
Indian cave sites and their general descriptions included the following:
5WL2304-Located on a large extension of the bluff line, this site had an excellent horizon-to-horizon perspective of the surrounding terrain and exposure to the above line of orbiting GPS satellites. The exposed bedrock and shallow soil areas of the site surface contained dozens of artifacts and nine stone ring features, the latter representing the foundations of prehistoric tipi shelters.
11
5WL2308-This site is located in a small, protected and partly enclosed bluff canyon/valley just below 5Wl2304 at the base of the bluffs. Archaeological components included architectural foundation and depression (pit) remains from an earIy 20th
Century homestead, a small number of prehistoric stone tools, and two stone rings (tipi foundations). 5WL241 7-This is an open camp with scattered artifacts on a eroding terrace knoll on the northern margins of a small stream known as Cedar Creek. Three test pits and three shovel tests were excavated on the site, revealing two cultural units extending from c. 10 cms to 60 cms below the modern surface. Artifacts, animal bone, charcoal, and fire-cracked rock recovered from the surface and test pits and shovel tests indicated the existence of a series of short-term camps spanning several centuries. Recovery of single biface tool, characteristic of the region’s Middle and Late Ceramic culture periods, suggested that an intermediate portion of the site’s occupation likely dated to between AD 1100 and 1400. 5WL2422-This is an extensive scatter of hundreds of historic and prehistoric artifacts and features on a gently sloping west-facing hillside immediately east of site 5WL2417 Part of the site had been used as a trash dump by focal inhabitants in theearly 20th
Century. The oldest culturally diagnostic artifacts from the historic period were dated to c. AD 1900. Despite the recording and recovery of more than a hundred prehistoric artifacts, no chronologically/culturally diagnostic tools were found which could be used to date the prehistoric site component Several clusters of stone tools, fire-cracked rock, and hearths were found, representing ancient short-term camps.
The last archaeological site investigated using GPS survey methods was
5LRI 15-Trail Ridge Game Drive. 5LR15 is located on the eastern side of the
continental divide immediately south of Trail Ridge road approximately 3 miles
before it crosses the divide at Trail Ridge Pass. The site, with elevations ranging
between 3465-3500 meters, was recently documented as part of a study of high
altitude game drive sites in north central Colorado’s Front Range mountains
(Benedict 1996: 7-20). It consists of three loose-masonry rock walls and five
rock-lined game blind pits designed to funnel game from lower sub-alpine
wooded areas up a steep saddle between two mountain knolls Radiocarbon-
12
dating of charcoal, granite weathering studies, and recovered, culturally
diagnostic projectile point types provided evidence that elements of the drive
complex date from at least 3000 BC to as late as AD 1000. Discovery of a
Paleoindian tool thought to date c. 6000 BC suggests drive construction may
have begun as early as 8000 years ago.
A GPS survey of 5LR15 was undertaken as part of a multi-year
archaeological inventory of selected study areas within Rocky Mountain National
Park under contract with the U.S. Park Service. The survey provided important
baseline information on the applicability of sub-meter GPS spatial data collection
and precision topographic and archaeological feature mapping in high elevation
mountain territories, in contrast to the above described high plains site locales.
ANALYSIS AND RESULTS OF GPS FIELD TESTS
As noted above, five archaeological sites in varying terrains were
surveyed using GPS data logging. Table 1 summarizes key information on total
areas covered (square meters and acres), number of points recorded, and
number of positions per acre for each site. A total of 74.16 acres, or 301,118
meters2, were surveyed at the five test sites. Areas for each site were determined
by use of a Pathfinder software function which calculates both distances between
points and physical areas covered by a site’s recorded points-a useful tool for
archaeologists.
13
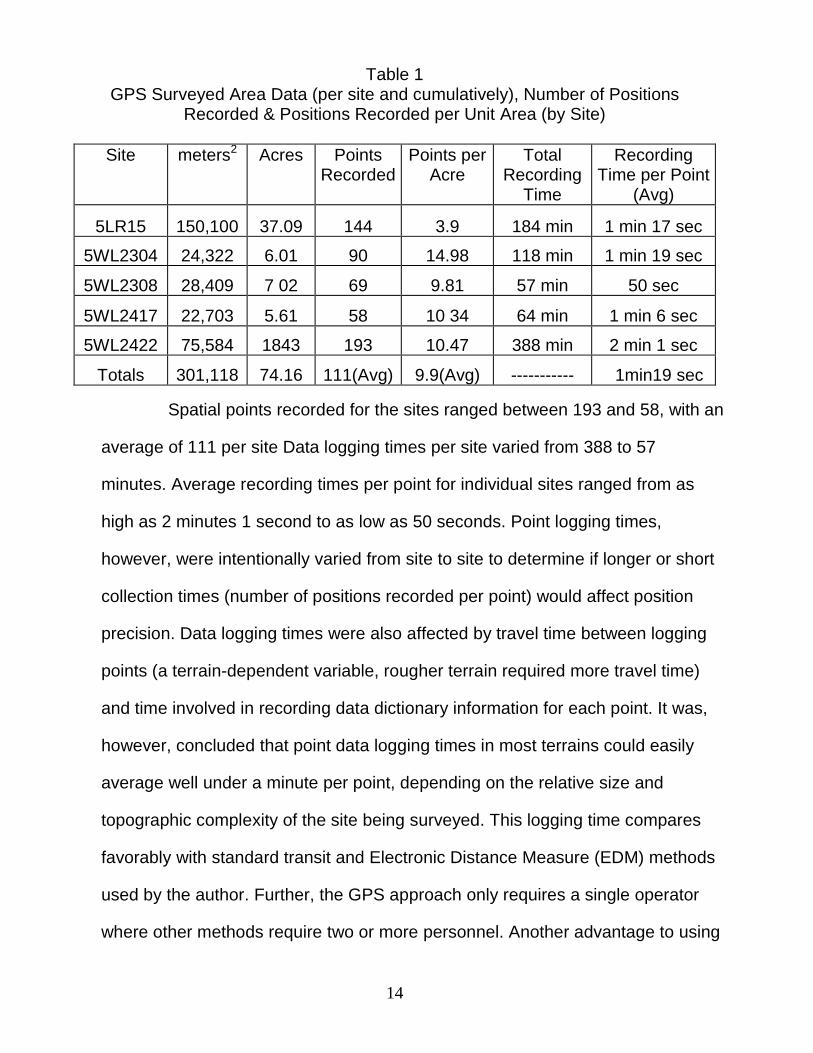
Table 1 GPS Surveyed Area Data (per site and cumulatively), Number of Positions
Recorded & Positions Recorded per Unit Area (by Site)
Site meters2 Acres Points Recorded
Points perAcre
Total Recording
Time
Recording Time per Point
(Avg)
5LR15 150,100 37.09 144 3.9 184 min 1 min 17 sec 5WL2304 24,322 6.01 90 14.98 118 min 1 min 19 sec
5WL2308 28,409 7 02 69 9.81 57 min 50 sec
5WL2417 22,703 5.61 58 10 34 64 min 1 min 6 sec
5WL2422 75,584 1843 193 10.47 388 min 2 min 1 sec
Totals 301,118 74.16 111(Avg) 9.9(Avg) ----------- 1min19 sec
Spatial points recorded for the sites ranged between 193 and 58, with an
average of 111 per site Data logging times per site varied from 388 to 57
minutes. Average recording times per point for individual sites ranged from as
high as 2 minutes 1 second to as low as 50 seconds. Point logging times,
however, were intentionally varied from site to site to determine if longer or short
collection times (number of positions recorded per point) would affect position
precision. Data logging times were also affected by travel time between logging
points (a terrain-dependent variable, rougher terrain required more travel time)
and time involved in recording data dictionary information for each point. It was,
however, concluded that point data logging times in most terrains could easily
average well under a minute per point, depending on the relative size and
topographic complexity of the site being surveyed. This logging time compares
favorably with standard transit and Electronic Distance Measure (EDM) methods
used by the author. Further, the GPS approach only requires a single operator
where other methods require two or more personnel. Another advantage to using
14
GPS over more conventional surveying instruments is that, in extremely rough or
vegetated (forest, etc.) terrain, conventional instruments, requiring line-of-sight
contexts, have to be re-positioned frequently using valuable field time. The GPS
operator simply moves over the landscape wherever topographic or archaeological
feature and artifact points need to be recorded.
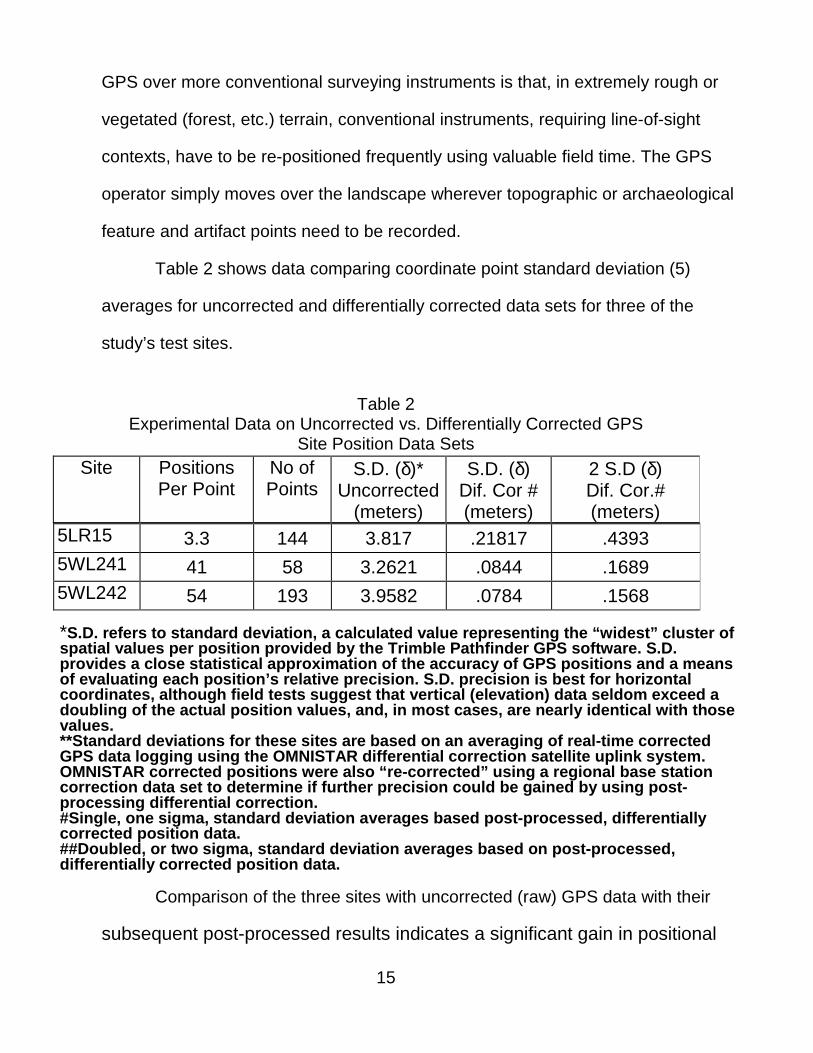
Table 2 shows data comparing coordinate point standard deviation (5)
averages for uncorrected and differentially corrected data sets for three of the
study’s test sites.
Table 2
Experimental Data on Uncorrected vs. Differentially Corrected GPS Site Position Data Sets
5LR15 3.3 144 3.817 .21817 .4393 5WL241 41 58 3.2621 .0844 .1689 5WL242 54 193 3.9582 .0784 .1568
*S.D. refers to standard deviation, a calculated value representing the “widest” cluster of spatial values per position provided by the Trimble Pathfinder GPS software. S.D. provides a close statistical approximation of the accuracy of GPS positions and a means of evaluating each position’s relative precision. S.D. precision is best for horizontal coordinates, although field tests suggest that vertical (elevation) data seldom exceed a doubling of the actual position values, and, in most cases, are nearly identical with those values. **Standard deviations for these sites are based on an averaging of real-time corrected GPS data logging using the OMNISTAR differential correction satellite uplink system. OMNISTAR corrected positions were also “re-corrected” using a regional base station correction data set to determine if further precision could be gained by using post-processing differential correction. #Single, one sigma, standard deviation averages based post-processed, differentially corrected position data. ##Doubled, or two sigma, standard deviation averages based on post-processed, differentially corrected position data.
Comparison of the three sites with uncorrected (raw) GPS data with their
subsequent post-processed results indicates a significant gain in positional
15
Site Positions Per Point
No of Points
S.D. (δ)* Uncorrected
(meters)
S.D. (δ) Dif. Cor # (meters)
2 S.D (δ) Dif. Cor.# (meters)
precision. The high elevation mountain site’s (5LR15) average of uncorrected, field
point values was ±3.817 meters. That site’s differentially corrected standard
deviation average (at 1δ) of the same points was ±.21817 meters, achieving an
accuracy of under a half meter. Two plains sites, 5WL2417 and 5WL2422, had
even more impressive increases in post-processed accuracy. Site 5WL2417,
situated on a low terrace along a shallow creek, had an averaged uncorrected
standard deviation of ±3.2621 meters. Its differentially corrected average was an
impressive ± .0844 meters, or less than 17 cm. Site 5WL2422, located on the mid
to lower, west-facing slope of a large hill, produced an uncorrected average of
±3.9582 meters, but when its GPS points were differentially corrected, yielded an
even more impressive average of ±.0784 meters-under 16cm.
Results of the above field tests compare favorably with other studies using
roughly comparable GPS systems, although not in similar topographic contexts.
U.S. Forest Service researchers working in the northwest coast’s Mount Hood
National Forest used an earlier model Trimble ProXL unit which produced
horizontal positions averaging ±1.34 meters under a forest canopy (Jasumback
1996: 4). A recent study of sub-meter GPS surveying at archaeological sites in
Hawaii reported levels of accuracy between 20 and 70 cm, although precision was
severely diminished in conditions of thick vegetation (Ladefoged, Graves,
O’Connor and Chapin 1998). The overall higher precision of spatial data generated
by this study, however, is largely attributable to the use of a more advanced
Trimble GPS unit (the 12 channel ProXR) and more open, horizon-to-horizon
environments of northeastern Colorado’s high plains and high mountains.
16
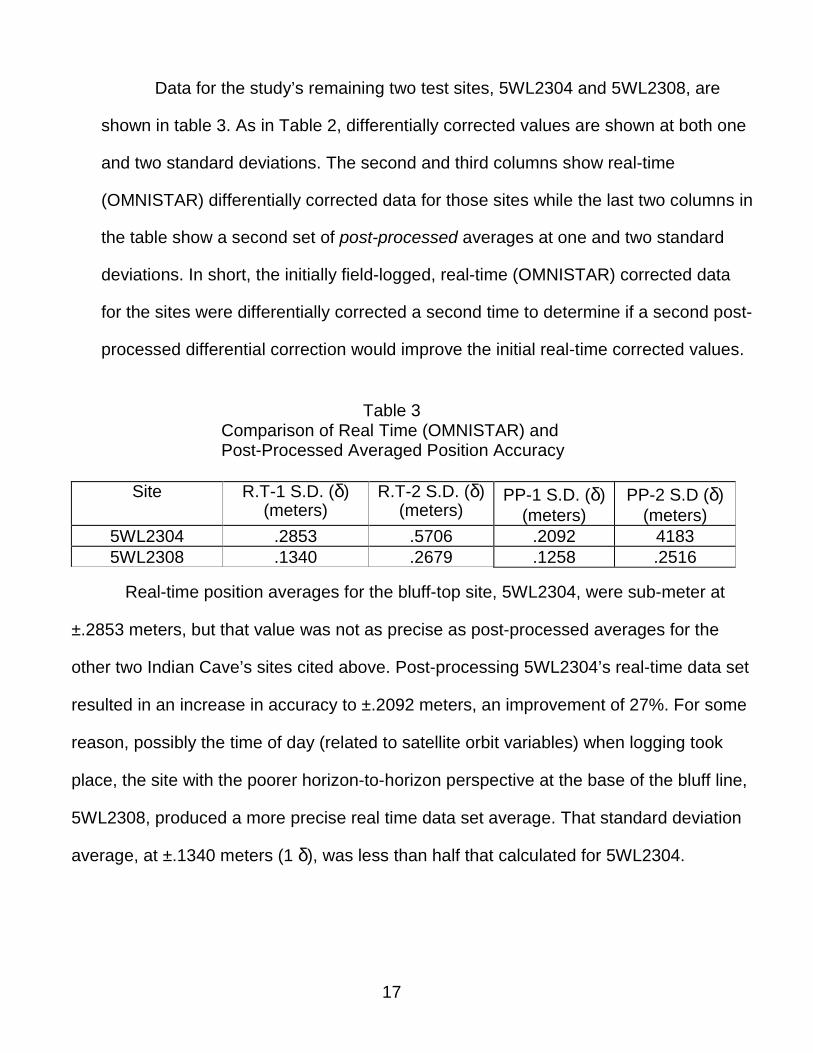
Data for the study’s remaining two test sites, 5WL2304 and 5WL2308, are
shown in table 3. As in Table 2, differentially corrected values are shown at both one
and two standard deviations. The second and third columns show real-time
(OMNISTAR) differentially corrected data for those sites while the last two columns in
the table show a second set of post-processed averages at one and two standard
deviations. In short, the initially field-logged, real-time (OMNISTAR) corrected data
for the sites were differentially corrected a second time to determine if a second post-
processed differential correction would improve the initial real-time corrected values.
Table 3
Comparison of Real Time (OMNISTAR) and Post-Processed Averaged Position Accuracy
Site R.T-1 S.D. (δ) (meters)
R.T-2 S.D. (δ)(meters)
PP-1 S.D. (δ) (meters)
PP-2 S.D (δ)(meters)
5WL2304 .2853 .5706 .2092 4183 5WL2308 .1340 .2679 .1258 .2516
Real-time position averages for the bluff-top site, 5WL2304, were sub-meter at
±.2853 meters, but that value was not as precise as post-processed averages for the
other two Indian Cave’s sites cited above. Post-processing 5WL2304’s real-time data set
resulted in an increase in accuracy to ±.2092 meters, an improvement of 27%. For some
reason, possibly the time of day (related to satellite orbit variables) when logging took
place, the site with the poorer horizon-to-horizon perspective at the base of the bluff line,
5WL2308, produced a more precise real time data set average. That standard deviation
average, at ±.1340 meters (1 δ), was less than half that calculated for 5WL2304.
17
Further, post-processing of the site’s real-time data resulted in only a marginal
increase in averaged point precision to ±.1258 meters.
Remote real-time differential correction using the OMNISTAR “virtual
base station” service compares favorably with results documented elsewhere.
Huff (1995) notes that earlier OMNISTAR-corrected GPS position logging
yielded accuracy on the order of ±.30 meters for horizontal coordinates and
±.60 meters for elevations. Forest Service researchers reported similar sub-
meter results of ±.48 meters (horizontal) and ±.62 meters (elevation) for
surveys in Louisiana’s Kisatchie National Forest using a differential correction
broadcast beacon at Vicksberg (Jasumbuck and Luepke 1996).
A broad comparison of the relative accuracy of the OMNISTAR real-
time correction method with uncorrected GPS data is illustrated in Table 4
which shows standard deviation averages for both types of data from the
Colorado test sites. The table lists single standard deviation values for
maximum (the highest S.D. of each data set) and minimum (the lowest S.D. in
each data set) S.D. positions and the average value of all positions in each
data set. Uncorrected averages ranged between ±3.262 and ±3.958 meters
while real time averages using OMNISTAR were ±.2853 and ±.1339.
18
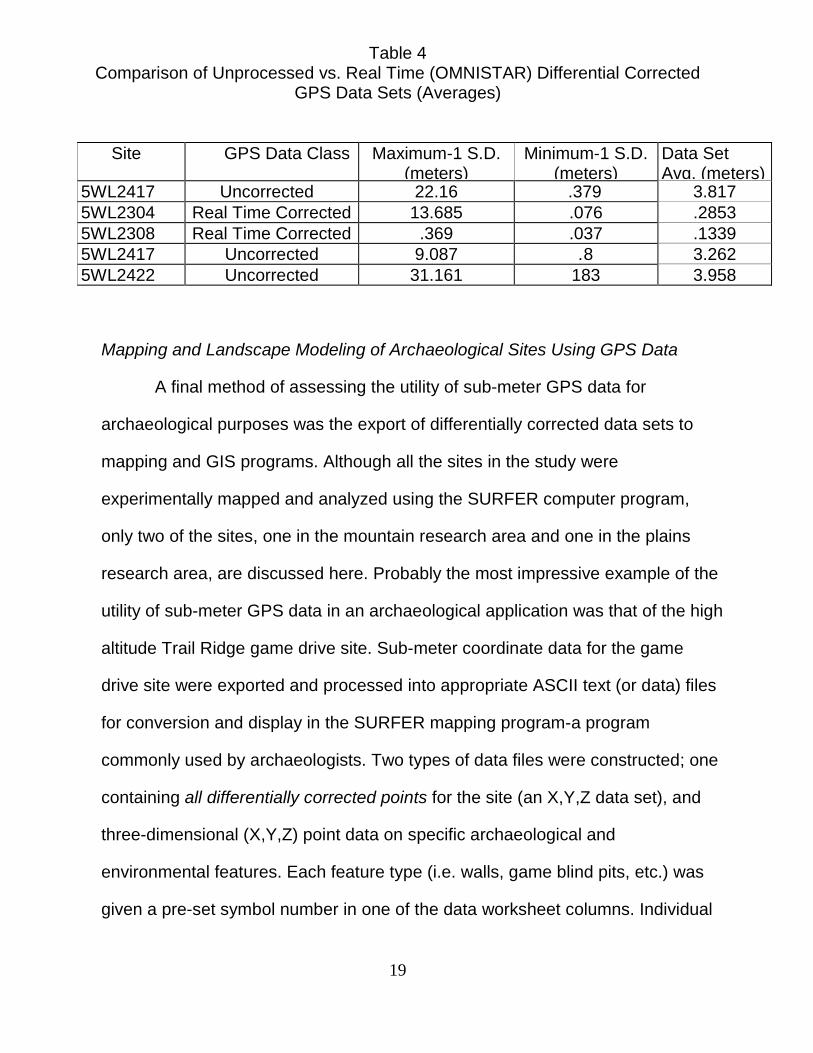
Table 4 Comparison of Unprocessed vs. Real Time (OMNISTAR) Differential Corrected
GPS Data Sets (Averages)
Site
GPS Data Class Maximum-1 S.D. (meters)
Minimum-1 S.D. (meters)
Data Set Avg. (meters)
5WL2417 Uncorrected 22.16 .379 3.817 5WL2304 Real Time Corrected 13.685 .076 .2853 5WL2308 Real Time Corrected .369 .037 .1339 5WL2417 Uncorrected 9.087 .8 3.262 5WL2422 Uncorrected 31.161 183 3.958
Mapping and Landscape Modeling of Archaeological Sites Using GPS Data
A final method of assessing the utility of sub-meter GPS data for
archaeological purposes was the export of differentially corrected data sets to
mapping and GIS programs. Although all the sites in the study were
experimentally mapped and analyzed using the SURFER computer program,
only two of the sites, one in the mountain research area and one in the plains
research area, are discussed here. Probably the most impressive example of the
utility of sub-meter GPS data in an archaeological application was that of the high
altitude Trail Ridge game drive site. Sub-meter coordinate data for the game
drive site were exported and processed into appropriate ASCII text (or data) files
for conversion and display in the SURFER mapping program-a program
commonly used by archaeologists. Two types of data files were constructed; one
containing all differentially corrected points for the site (an X,Y,Z data set), and
three-dimensional (X,Y,Z) point data on specific archaeological and
environmental features. Each feature type (i.e. walls, game blind pits, etc.) was
given a pre-set symbol number in one of the data worksheet columns. Individual
19
features were also labeled in another data worksheet column. SURFER employs
these types of data sets to generate contour and 3-dimensional surface maps
which can then be overlaid (posted) with feature symbols and labels.
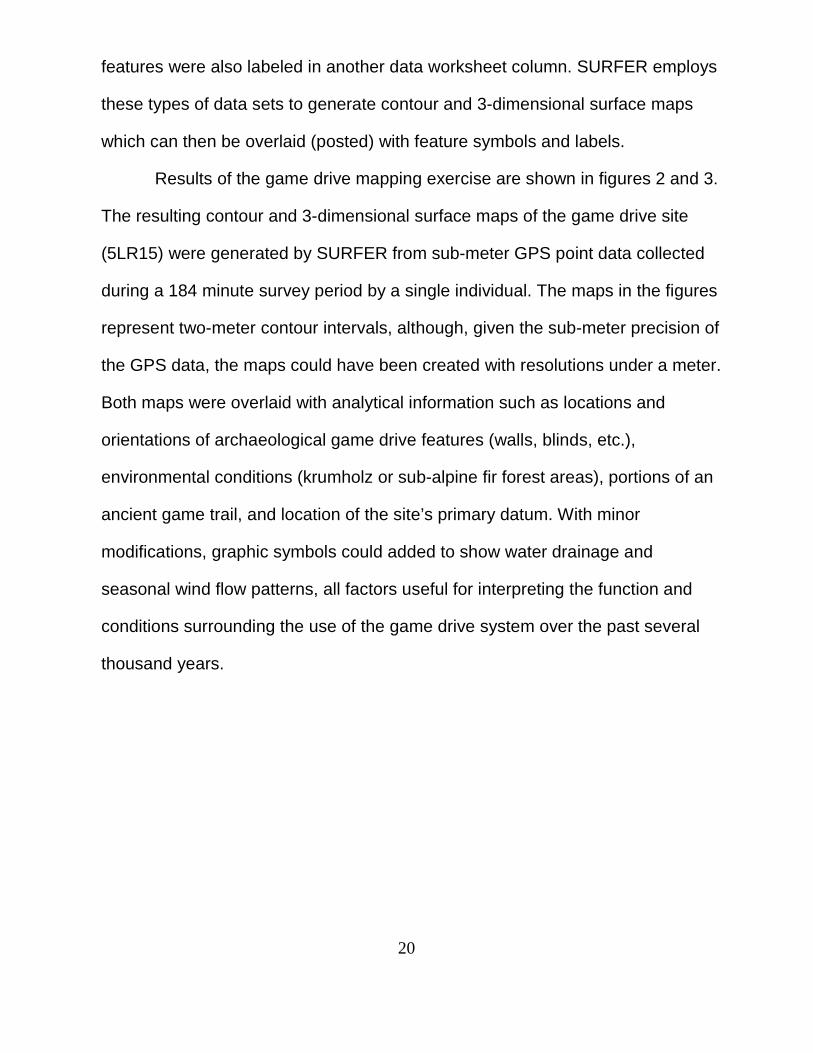
Results of the game drive mapping exercise are shown in figures 2 and 3.
The resulting contour and 3-dimensional surface maps of the game drive site
(5LR15) were generated by SURFER from sub-meter GPS point data collected
during a 184 minute survey period by a single individual. The maps in the figures
represent two-meter contour intervals, although, given the sub-meter precision of
the GPS data, the maps could have been created with resolutions under a meter.
Both maps were overlaid with analytical information such as locations and
orientations of archaeological game drive features (walls, blinds, etc.),
environmental conditions (krumholz or sub-alpine fir forest areas), portions of an
ancient game trail, and location of the site’s primary datum. With minor
modifications, graphic symbols could added to show water drainage and
seasonal wind flow patterns, all factors useful for interpreting the function and
conditions surrounding the use of the game drive system over the past several
thousand years.
20
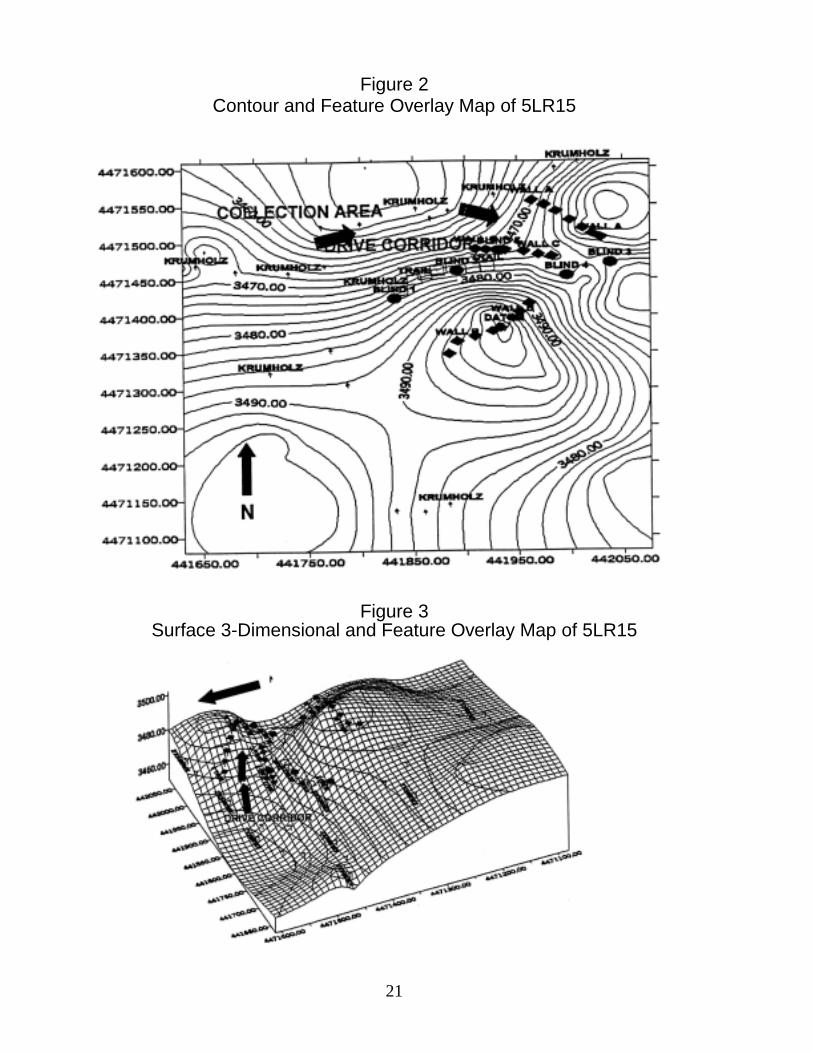
Figure 2
Contour and Feature Overlay Map of 5LR15
Figure 3
Surface 3-Dimensional and Feature Overlay Map of 5LR15
21
The current U.S G.S. 7.5 minute topographic map of the 5LR15 site area
provides a topographic map resolution of 1:24,000 with 40 foot contour lines. A
Digital Electronic Map (DEM) version of the same map has the same low 40-foot
contour resolution and provides insufficient accuracy and resolution for
reconstructing (mapping) terrain subtleties needed to better define environmental
factors related to the construction and operation of the drive system. However,
sub-meter GPS-based maps, as shown in the above figures, clearly provide
superior graphic evidence of factors involved in the drive’s operation as they are
related to local topographic and environmental conditions. Even greater accuracy
could be achieved using EDM laser surveying instruments, but at much greater
cost in time and convenience. However, it suggested that spatial resolution
higher than the ± .218 meter average acquired in the 5LR15 GPS survey is
unnecessary for quality landscape research at such sites.
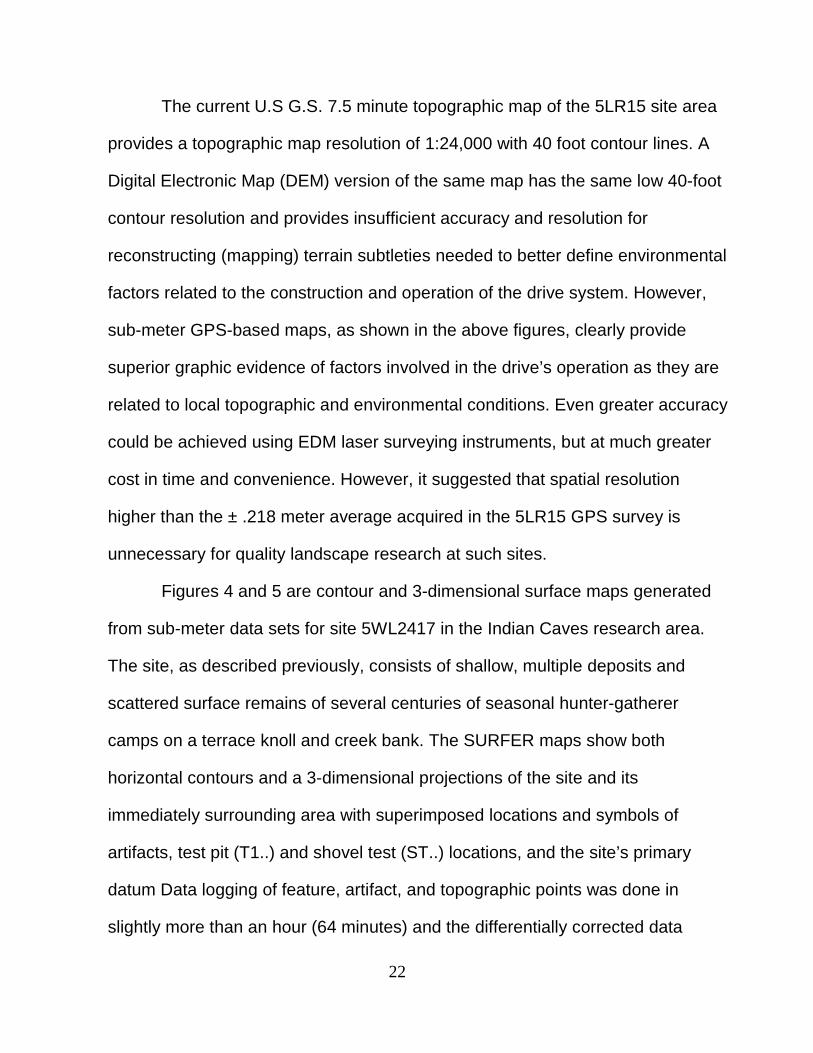
Figures 4 and 5 are contour and 3-dimensional surface maps generated
from sub-meter data sets for site 5WL2417 in the Indian Caves research area.
The site, as described previously, consists of shallow, multiple deposits and
scattered surface remains of several centuries of seasonal hunter-gatherer
camps on a terrace knoll and creek bank. The SURFER maps show both
horizontal contours and a 3-dimensional projections of the site and its
immediately surrounding area with superimposed locations and symbols of
artifacts, test pit (T1..) and shovel test (ST..) locations, and the site’s primary
datum Data logging of feature, artifact, and topographic points was done in
slightly more than an hour (64 minutes) and the differentially corrected data
22

made possible a site map in two and three dimensions with .5 meter contour
resolution. Standard transit and laser EDM methods could have been done in
the relatively open site terrain in an equivalent amount of time with greater
precision, but with slightly more effort since those methods would have required
at least a two person survey team. However, the GPS maps provide more than
adequate spatial resolution and quality mapping data for all but the most
demanding archaeological survey documentation needs. In fact, given that
most site surveys involve the drawing of simple sketch maps, usually made with
Brunton compasses and measuring tapes, sub-meter GPS data logging and
computer mapping is considered by this author to be a faster and more efficient
means of documenting the vast majority of sites encountered in standard
archaeological survey projects.
23
Feature 4
Contour Feature & Artifact Overlay Map of 5WL2417
24
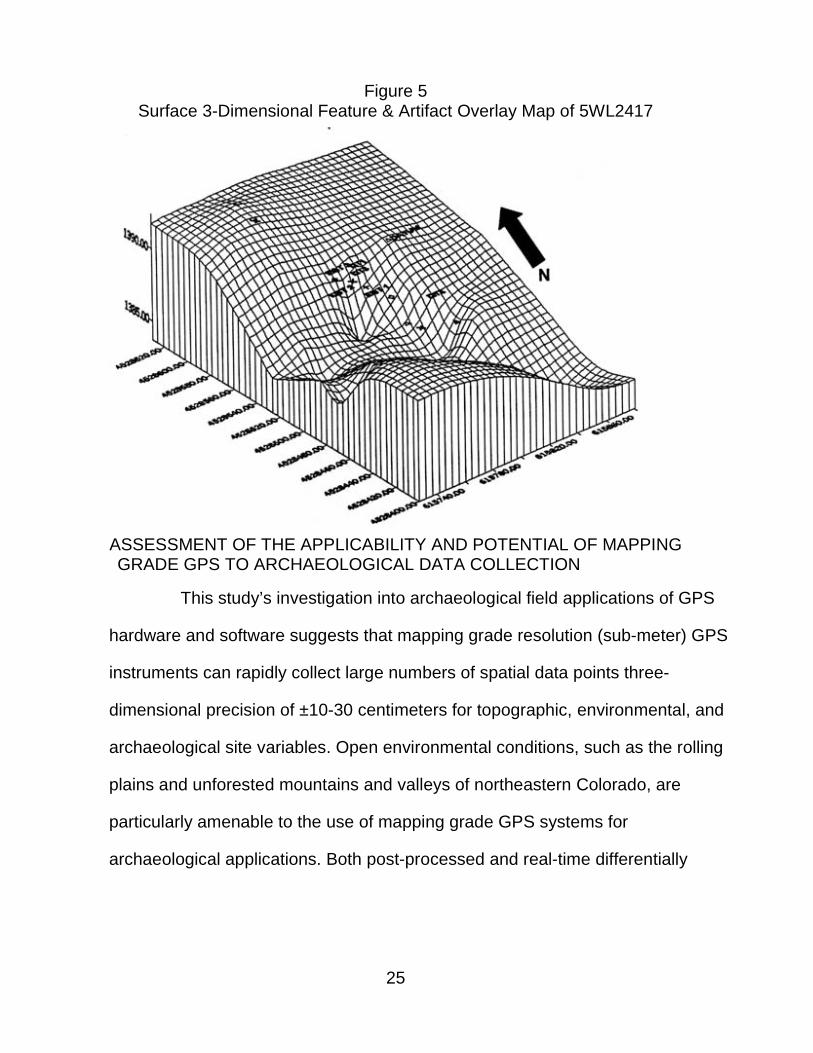
Figure 5
Surface 3-Dimensional Feature & Artifact Overlay Map of 5WL2417
ASSESSMENT OF THE APPLICABILITY AND POTENTIAL OF MAPPING GRADE GPS TO ARCHAEOLOGICAL DATA COLLECTION
This study’s investigation into archaeological field applications of GPS
hardware and software suggests that mapping grade resolution (sub-meter) GPS
instruments can rapidly collect large numbers of spatial data points three-
dimensional precision of ±10-30 centimeters for topographic, environmental, and
archaeological site variables. Open environmental conditions, such as the rolling
plains and unforested mountains and valleys of northeastern Colorado, are
particularly amenable to the use of mapping grade GPS systems for
archaeological applications. Both post-processed and real-time differentially
25

corrected GPS data sets in such environments provide reliable sub-meter point
data for use in advanced computer mapping and graphics-based analysis (i.e.
GIS) programs. Resulting mapping grade spatial data sets, downloaded into
mapping programs such as SURFER or GIS programs such as IDRIS or ARC-
INFO, provide the basis for graphical and statistical analysis and modeling of
archaeological, and associated natural, landscapes of both small and large
archaeological sites. Two particularly outstanding benefits of mapping grade GPS
technology in archaeology are time savings in mapping sites during large-scale
surveys and quickly (and more easily) collecting high resolution mapping data in
remote and rugged terrain.
26
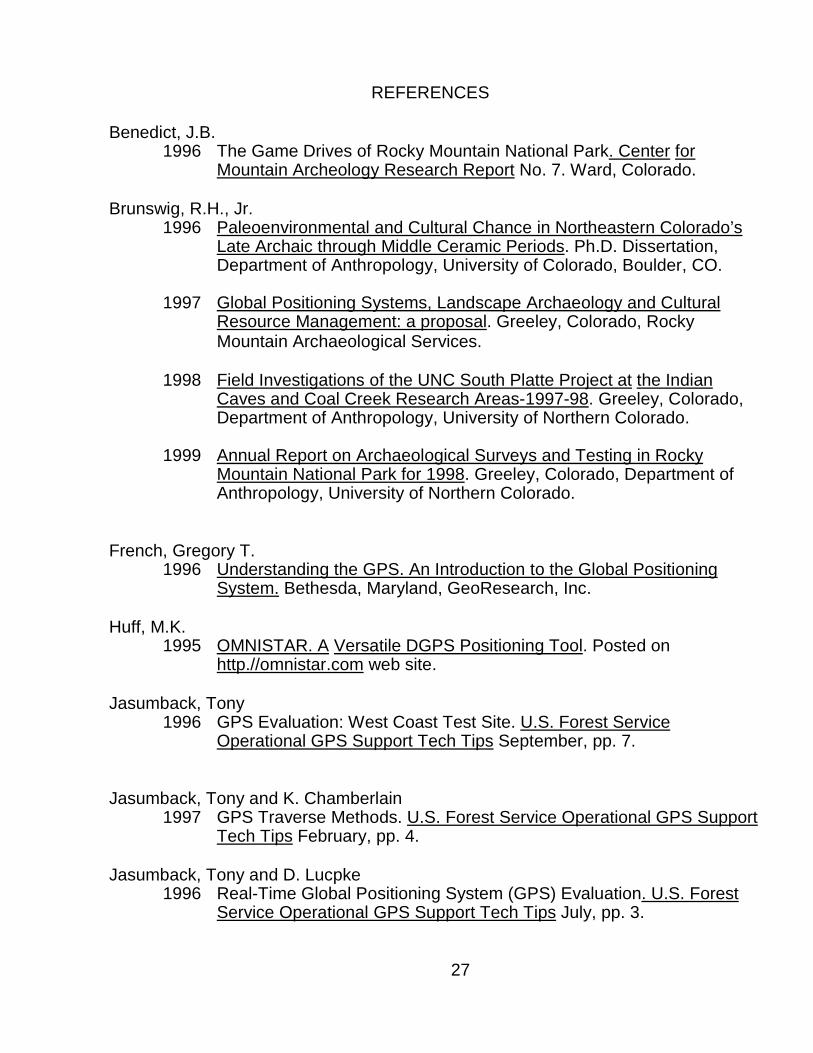
REFERENCES
Benedict, J.B. 1996 The Game Drives of Rocky Mountain National Park. Center for
Mountain Archeology Research Report No. 7. Ward, Colorado.
Brunswig, R.H., Jr. 1996 Paleoenvironmental and Cultural Chance in Northeastern Colorado’s
Late Archaic through Middle Ceramic Periods. Ph.D. Dissertation, Department of Anthropology, University of Colorado, Boulder, CO.
1997 Global Positioning Systems, Landscape Archaeology and Cultural
Resource Management: a proposal. Greeley, Colorado, Rocky Mountain Archaeological Services.
1998 Field Investigations of the UNC South Platte Project at the Indian
Caves and Coal Creek Research Areas-1997-98. Greeley, Colorado, Department of Anthropology, University of Northern Colorado.
1999 Annual Report on Archaeological Surveys and Testing in Rocky
Mountain National Park for 1998. Greeley, Colorado, Department of Anthropology, University of Northern Colorado.
French, Gregory T.
1996 Understanding the GPS. An Introduction to the Global Positioning System. Bethesda, Maryland, GeoResearch, Inc.
Huff, M.K.
1995 OMNISTAR. A Versatile DGPS Positioning Tool. Posted on http.//omnistar.com web site.
Jasumback, Tony
1996 GPS Evaluation: West Coast Test Site. U.S. Forest Service Operational GPS Support Tech Tips September, pp. 7.
Jasumback, Tony and K. Chamberlain 1997 GPS Traverse Methods. U.S. Forest Service Operational GPS Support
Tech Tips February, pp. 4.
Jasumback, Tony and D. Lucpke 1996 Real-Time Global Positioning System (GPS) Evaluation. U.S. Forest
Service Operational GPS Support Tech Tips July, pp. 3.
27
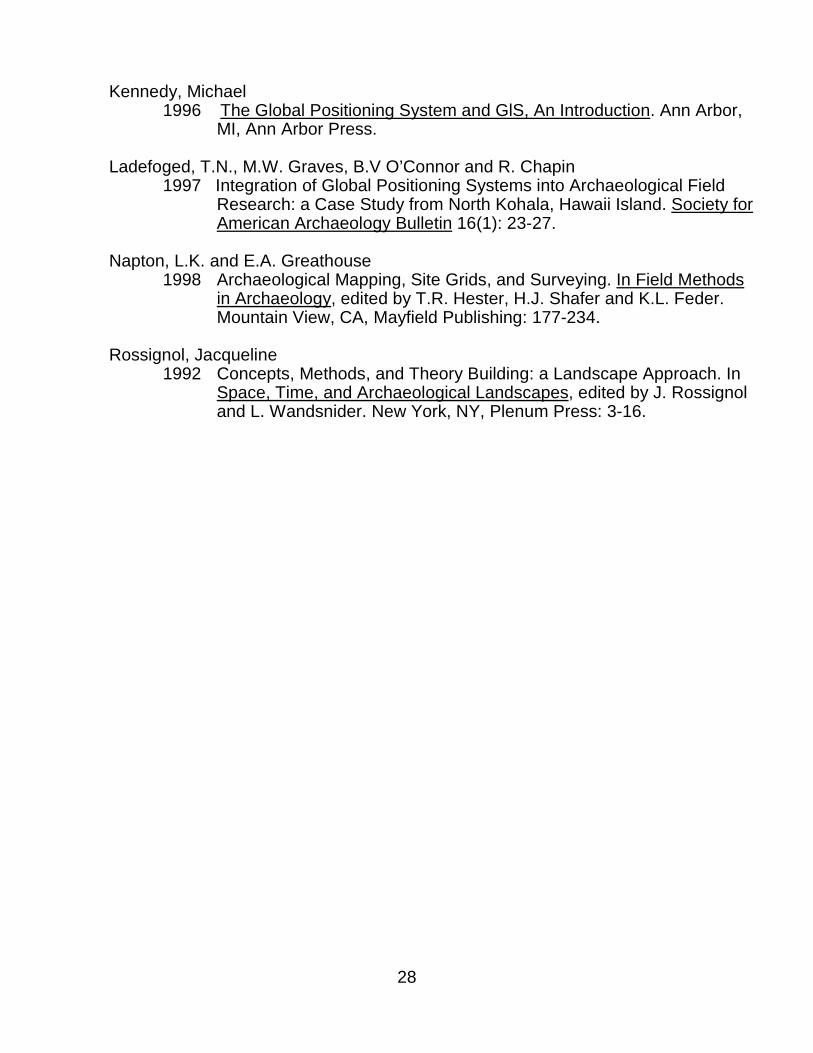
Kennedy, Michael 1996 The Global Positioning System and GlS, An Introduction. Ann Arbor,
MI, Ann Arbor Press.
Ladefoged, T.N., M.W. Graves, B.V O’Connor and R. Chapin 1997 Integration of Global Positioning Systems into Archaeological Field
Research: a Case Study from North Kohala, Hawaii Island. Society for American Archaeology Bulletin 16(1): 23-27.
Napton, L.K. and E.A. Greathouse
1998 Archaeological Mapping, Site Grids, and Surveying. In Field Methods in Archaeology, edited by T.R. Hester, H.J. Shafer and K.L. Feder. Mountain View, CA, Mayfield Publishing: 177-234.
Rossignol, Jacqueline
1992 Concepts, Methods, and Theory Building: a Landscape Approach. In Space, Time, and Archaeological Landscapes, edited by J. Rossignol and L. Wandsnider. New York, NY, Plenum Press: 3-16.
28
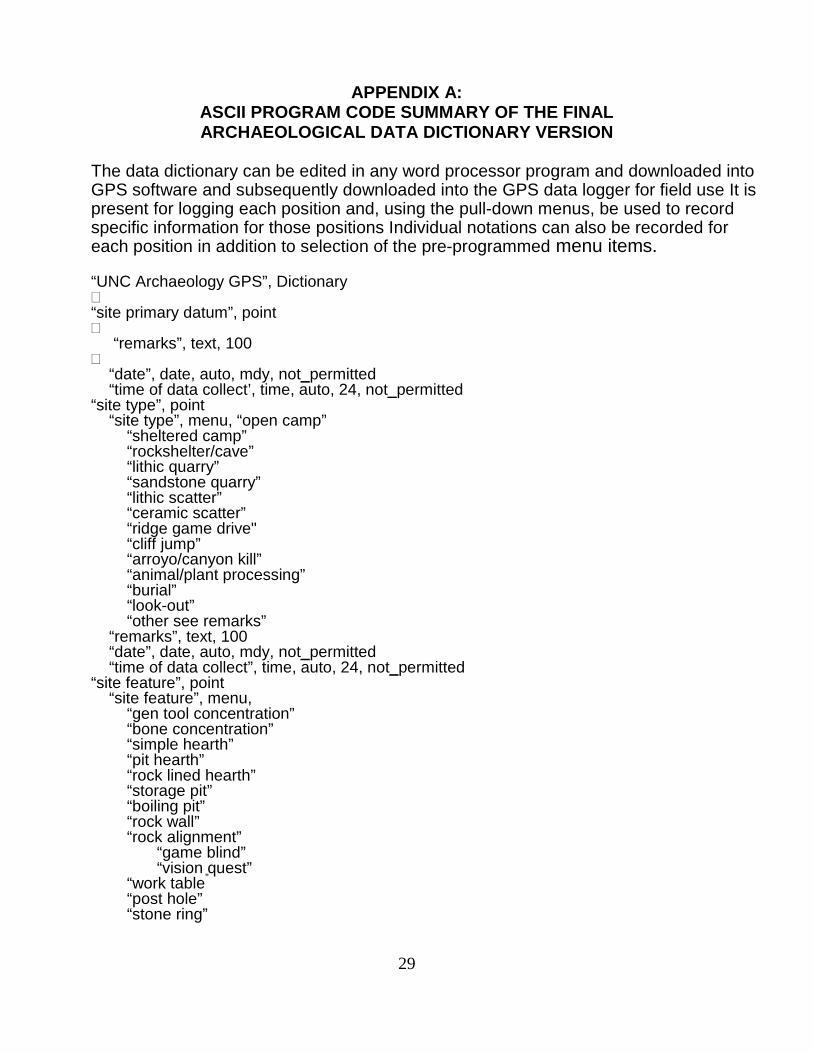
APPENDIX A: ASCII PROGRAM CODE SUMMARY OF THE FINAL ARCHAEOLOGICAL DATA DICTIONARY VERSION
The data dictionary can be edited in any word processor program and downloaded into GPS software and subsequently downloaded into the GPS data logger for field use It is present for logging each position and, using the pull-down menus, be used to record specific information for those positions Individual notations can also be recorded for each position in addition to selection of the pre-programmed menu items.
“UNC Archaeology GPS”, Dictionary � “site primary datum”, point �
“remarks”, text, 100 �
“date”, date, auto, mdy, not_permitted “time of data collect’, time, auto, 24, not_permitted
“site type”, point “site type”, menu, “open camp”
“sheltered camp” “rockshelter/cave” “lithic quarry” “sandstone quarry” “lithic scatter” “ceramic scatter” “ridge game drive" “cliff jump” “arroyo/canyon kill” “animal/plant processing” “burial” “look-out” “other see remarks”
“remarks”, text, 100 “date”, date, auto, mdy, not_permitted “time of data collect”, time, auto, 24, not_permitted
“site feature”, point “site feature”, menu,
“gen tool concentration” “bone concentration” “simple hearth” “pit hearth” “rock lined hearth” “storage pit” “boiling pit” “rock wall” “rock alignment”
“game blind” “vision quest”
“work table” “post hole” “stone ring”
29
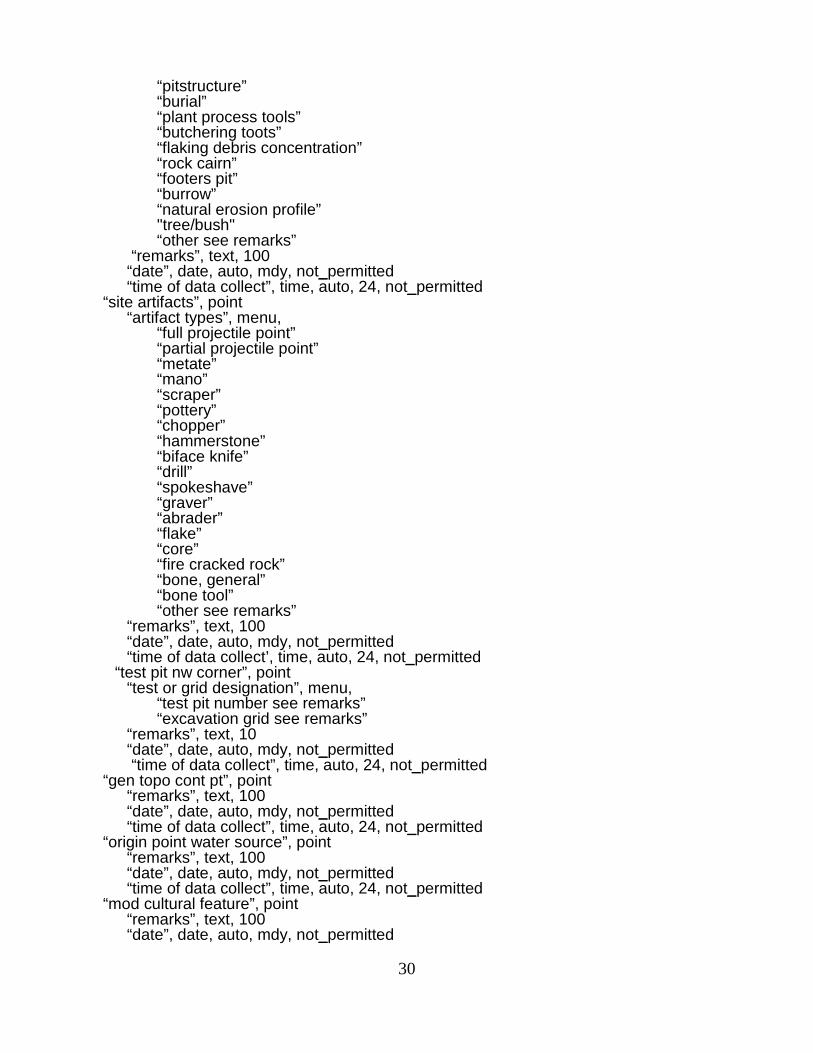
“pitstructure” “burial” “plant process tools” “butchering toots” “flaking debris concentration” “rock cairn” “footers pit” “burrow” “natural erosion profile” "tree/bush" “other see remarks”
“remarks”, text, 100 “date”, date, auto, mdy, not_permitted “time of data collect”, time, auto, 24, not_permitted
“site artifacts”, point “artifact types”, menu,
“full projectile point” “partial projectile point” “metate” “mano” “scraper” “pottery” “chopper” “hammerstone” “biface knife” “drill” “spokeshave” “graver” “abrader” “flake” “core” “fire cracked rock” “bone, general” “bone tool” “other see remarks”
“remarks”, text, 100 “date”, date, auto, mdy, not_permitted “time of data collect’, time, auto, 24, not_permitted
“test pit nw corner”, point “test or grid designation”, menu,
“test pit number see remarks” “excavation grid see remarks”
“remarks”, text, 10 “date”, date, auto, mdy, not_permitted “time of data collect”, time, auto, 24, not_permitted
“gen topo cont pt”, point “remarks”, text, 100 “date”, date, auto, mdy, not_permitted “time of data collect”, time, auto, 24, not_permitted
“origin point water source”, point “remarks”, text, 100 “date”, date, auto, mdy, not_permitted “time of data collect”, time, auto, 24, not_permitted
“mod cultural feature”, point “remarks”, text, 100 “date”, date, auto, mdy, not_permitted
30
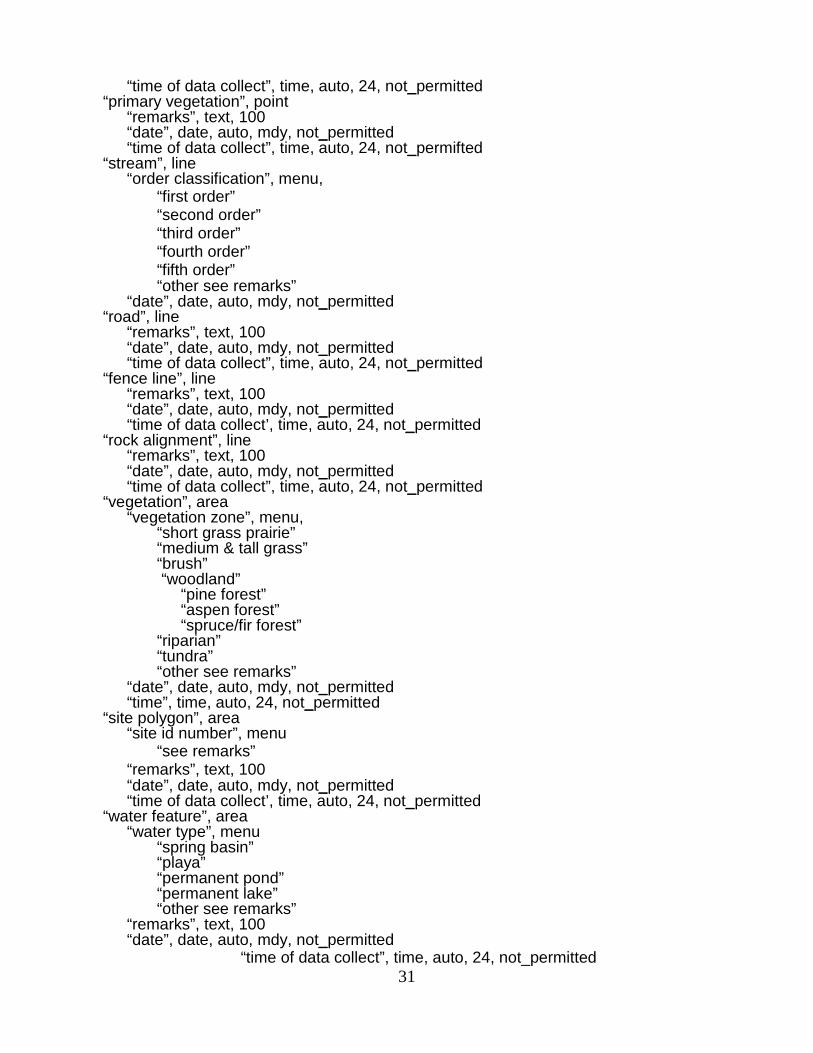
“time of data collect”, time, auto, 24, not_permitted “primary vegetation”, point
“remarks”, text, 100 “date”, date, auto, mdy, not_permitted “time of data collect”, time, auto, 24, not_permifted
“stream”, line “order classification”, menu,
“first order” “second order” “third order” “fourth order” “fifth order” “other see remarks”
“date”, date, auto, mdy, not_permitted “road”, line
“remarks”, text, 100 “date”, date, auto, mdy, not_permitted “time of data collect”, time, auto, 24, not_permitted
“fence line”, line “remarks”, text, 100 “date”, date, auto, mdy, not_permitted “time of data collect’, time, auto, 24, not_permitted
“rock alignment”, line “remarks”, text, 100 “date”, date, auto, mdy, not_permitted “time of data collect”, time, auto, 24, not_permitted
“vegetation”, area “vegetation zone”, menu,
“short grass prairie” “medium & tall grass” “brush” “woodland”
“pine forest” “aspen forest” “spruce/fir forest”
“riparian” “tundra” “other see remarks”
“date”, date, auto, mdy, not_permitted “time”, time, auto, 24, not_permitted
“site polygon”, area “site id number”, menu
“see remarks” “remarks”, text, 100 “date”, date, auto, mdy, not_permitted “time of data collect’, time, auto, 24, not_permitted
“water feature”, area “water type”, menu
“spring basin” “playa” “permanent pond” “permanent lake” “other see remarks”
“remarks”, text, 100 “date”, date, auto, mdy, not_permitted
“time of data collect”, time, auto, 24, not_permitted 31